Reduced auditory cortical adaptation in autism spectrum disorder
- University of Washington, United States
Figures
Figure 1
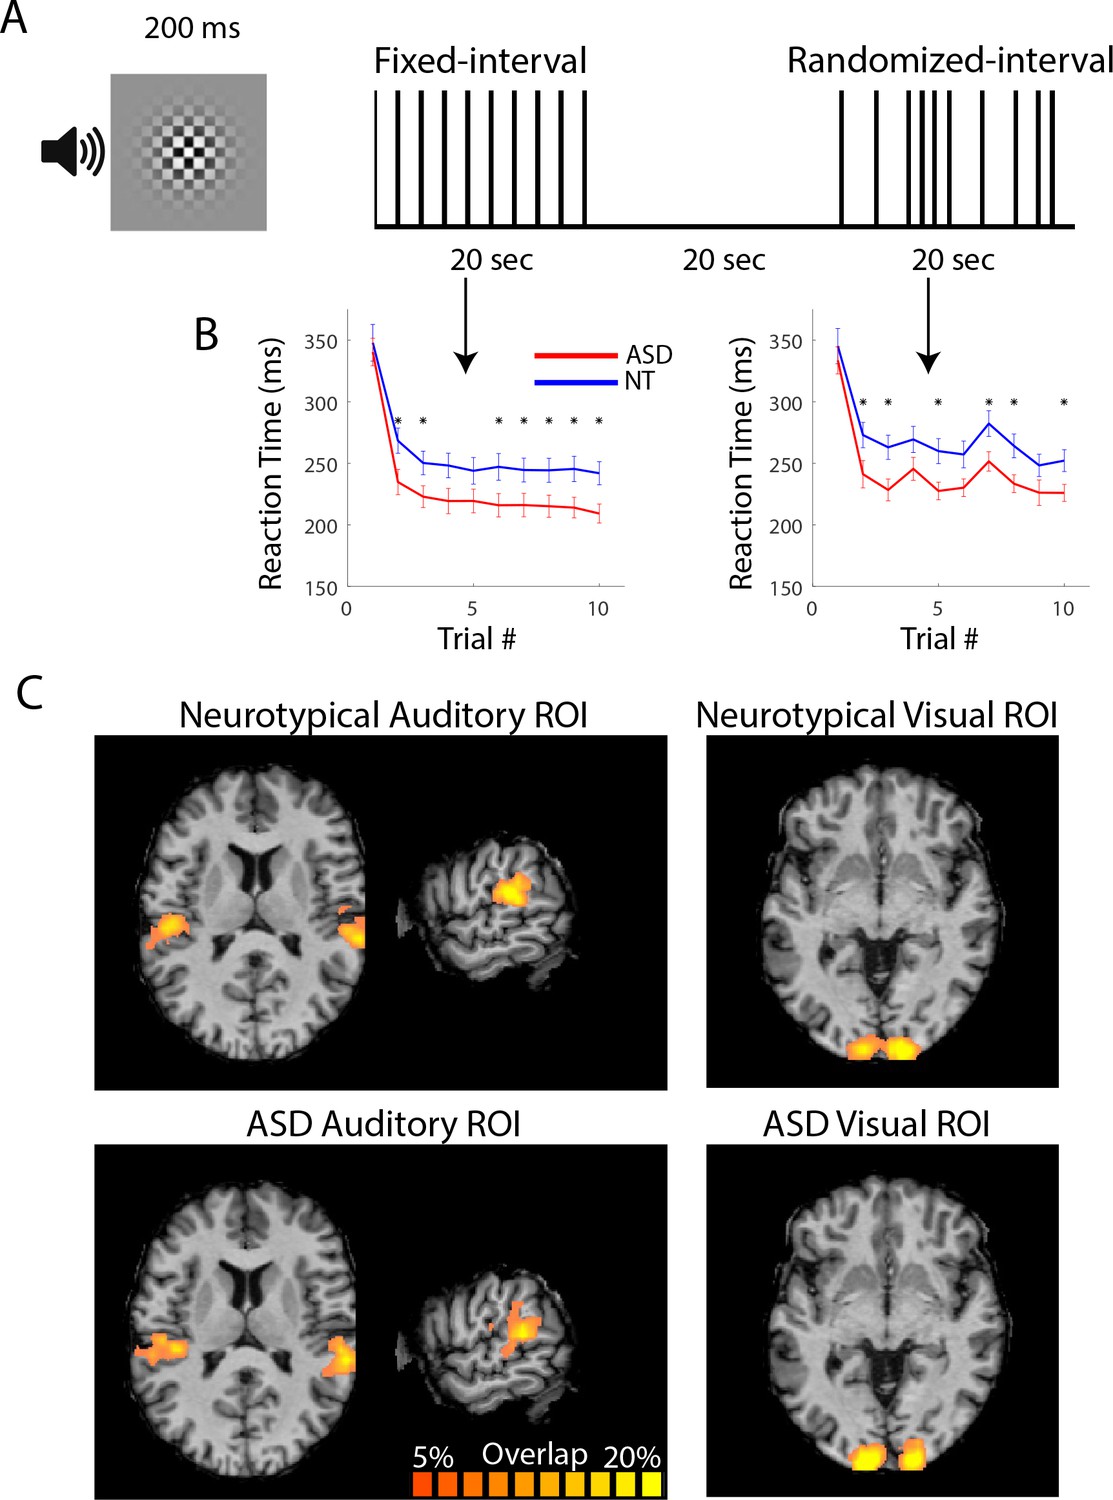
Task and ROI selection.
(A) The stimulus consisted of a checkerboard presented for 200 ms accompanied for the duration by auditory white noise. Subjects were asked to respond with a button press following the stimulus. Stimuli were presented with fixed or randomized inter-stimulus intervals in 20 s blocks. Stimulus blocks alternated with 20 s of fixation. (B) Reaction times were shorter for ASD compared to NT participants from the second trial and on. (*)=p < 0.05. (C) ROIs in left and right visual and left and right auditory areas were selected based on activation to stimulus versus fixation blocks over the three experimental runs. Probability maps/heat maps showing auditory and visual ROI locations for NT (top) and ASD (bottom) participants. Percent overlap across subjects calculated in Talairach space and displayed on an individual subject’s anatomical image.
-
Figure 1—source data 1
Button press reaction times.
- https://doi.org/10.7554/eLife.36493.003
Figure 2
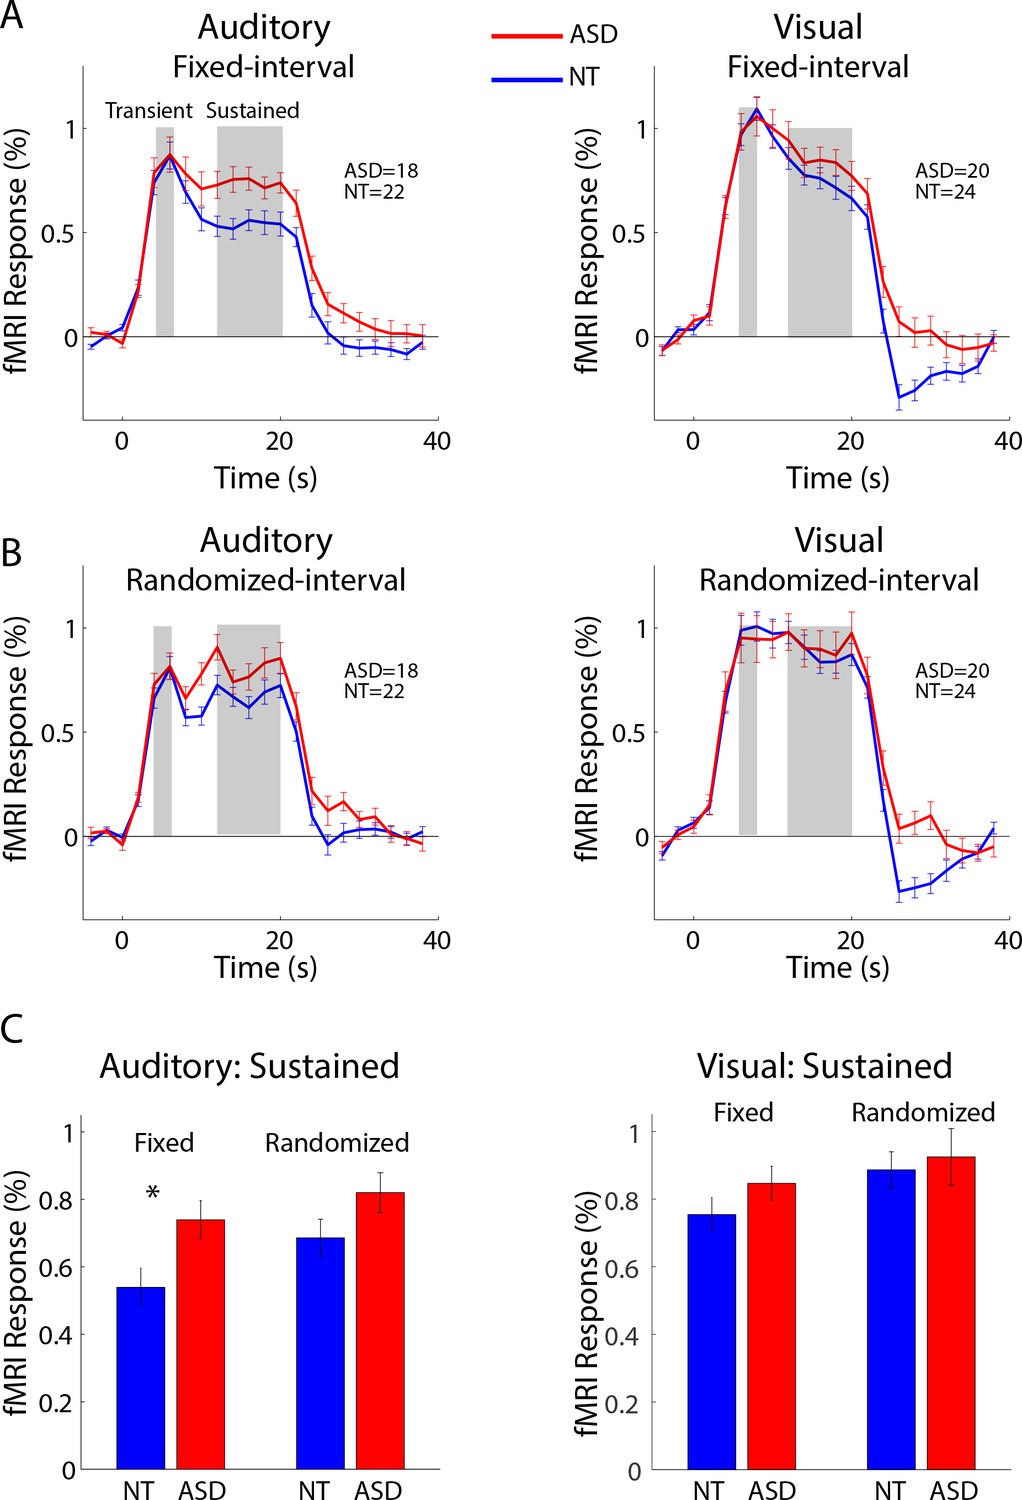
(A) Mean fMRI response timecourses in the fixed-interval timing blocks for NT (blue) and ASD (red) groups in the auditory (left, N(NT)=22, N(ASD)=18, and visual (right, N(NT)=24, N(ASD)=20) ROIs.
(B) Same as (A), but for the randomized-interval condition. (C) Mean response averaged over the sustained period. Error bars indicate the standard error of the mean.
-
Figure 2—source data 1
FMRI timecourses and averaged sustained responses in auditory and visual cortex.
- https://doi.org/10.7554/eLife.36493.005
Figure 3
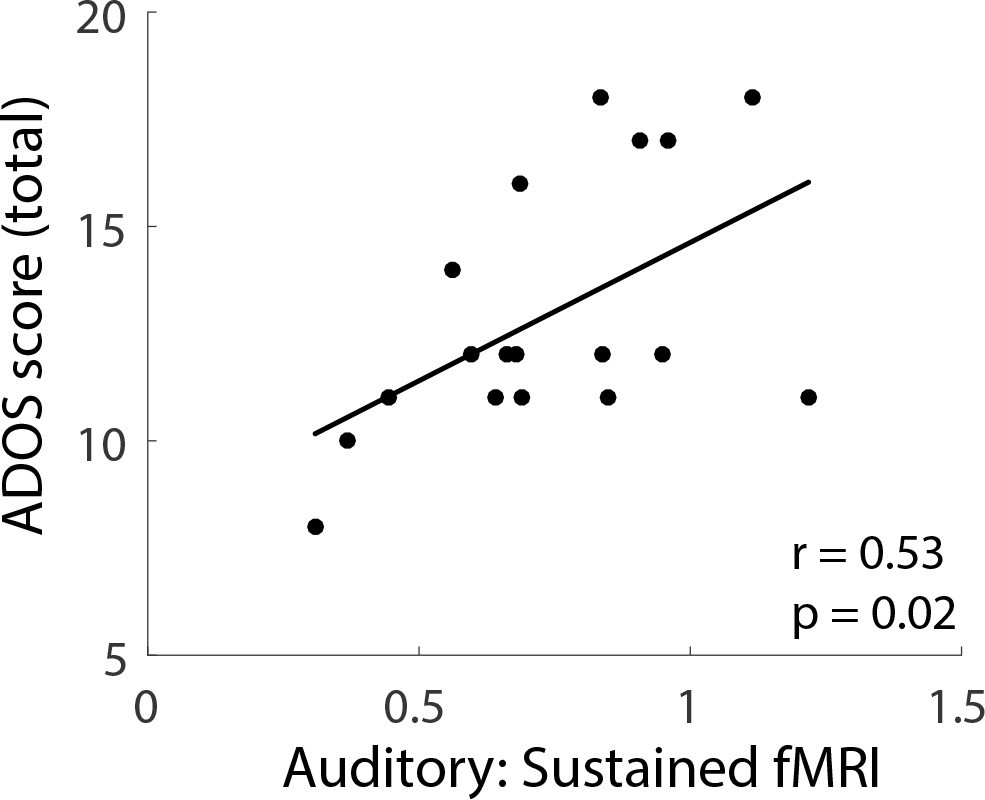
Individual differences (ASD participants) in the sustained fMRI response in the auditory cortex fixed-interval condition plotted against total ADOS scores.
https://doi.org/10.7554/eLife.36493.006-
Figure 3—source data 1
Sustained auditory fMRI response and ADOS scores in the ASD group.
- https://doi.org/10.7554/eLife.36493.007
Figure 4
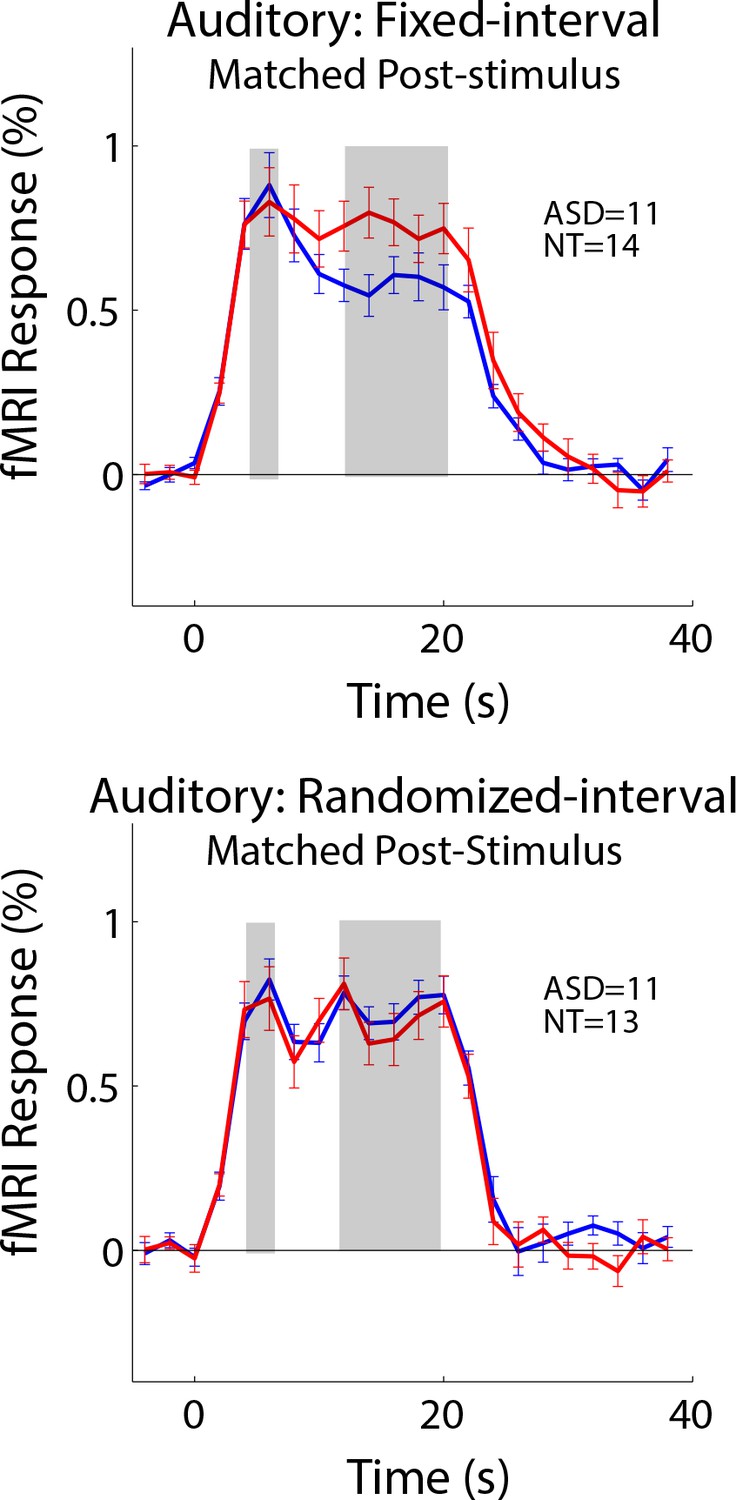
Subgroups were formed that were equated for the post-stimulus response.
Differences in the sustained response remained in the fixed-interval condition (top).
-
Figure 4—source data 1
FMRI timecourses in auditory cortex after matching for post-stimulus response.
- https://doi.org/10.7554/eLife.36493.009
Figure 5
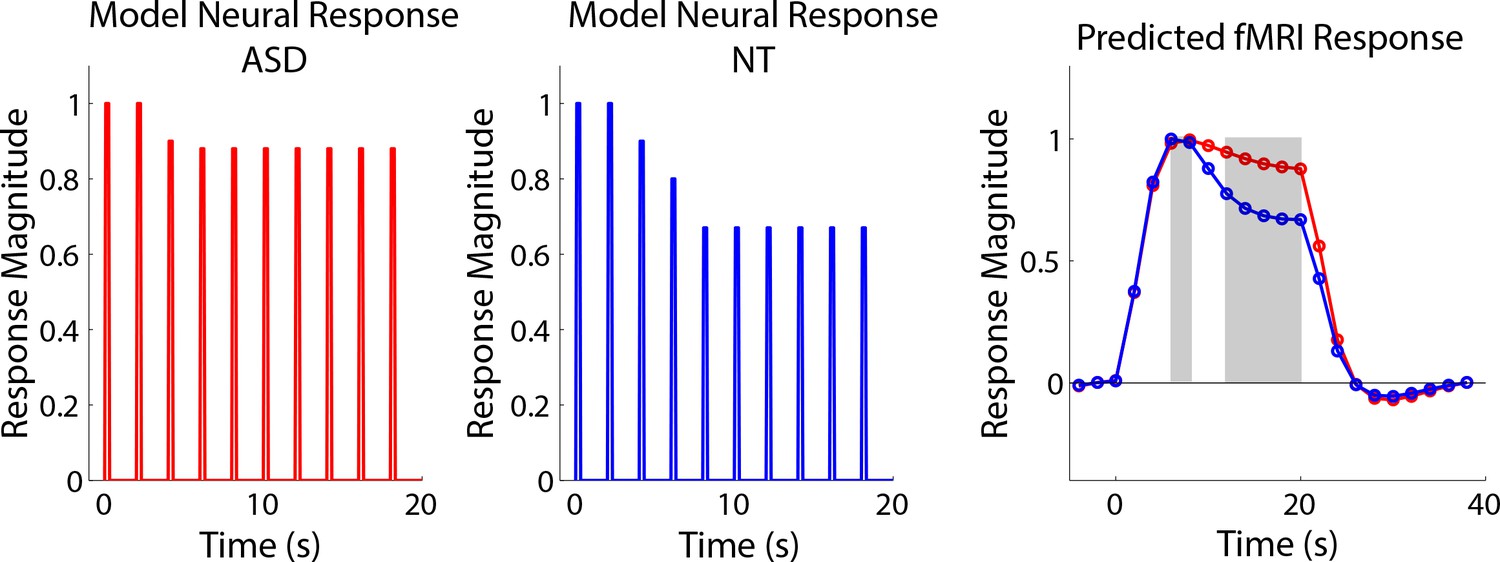
Model neural responses that reflected different degrees of adaptation (left = ASD, less adaptation; middle = NT, more adaptation) were convolved with a canonical hrf to produce expected fMRI timecourses for each group (right).
https://doi.org/10.7554/eLife.36493.010Tables
Table 1
Subject enrollment numbers and exlucsions.
https://doi.org/10.7554/eLife.36493.011| ASD | NT | |||
|---|---|---|---|---|
| Total enrolled | 24 | 29 | ||
| Pre-analysis exclusions (sleep, large head motions, etc.) | 2 | 2 | ||
| Data cleaning exclusion | 1 | 0 | ||
| Auditory | Visual | Auditory | Visual | |
| ROI definition exclusion | 2 | 0 | 0 | 0 |
| Power spectrum exclusion | 1 | 1 | 5 | 3 |
| Total Usable Data | 18 | 20 | 22 | 24 |
Additional files
-
Transparent reporting form
- https://doi.org/10.7554/eLife.36493.012
Download links
A two-part list of links to download the article, or parts of the article, in various formats.
Downloads (link to download the article as PDF)
Open citations (links to open the citations from this article in various online reference manager services)
Cite this article (links to download the citations from this article in formats compatible with various reference manager tools)
Reduced auditory cortical adaptation in autism spectrum disorder
eLife 7:e36493.
https://doi.org/10.7554/eLife.36493


