Firefly genomes illuminate parallel origins of bioluminescence in beetles
- Whitehead Institute for Biomedical Research, United States
- Massachusetts Institute of Technology, United States
- Cornell University, United States
- Bucknell University, United States
- University of Rochester, United States
- Chubu University, Japan
- Nagoya University, Japan
- Monterey Bay Aquarium Research Institute, United States
- Brigham Young University, United States
- University of Georgia, United States
- Arizona State University, United States
- Center of Agronomic Research, National Institute of Agricultural Technology, Argentina
- Centre for Ecology and Hydrology (CEH), United Kingdom
- University of California Davis, United States
- University of Tennessee HSC, United States
- Tufts University, United States
- National Institute for Basic Biology, Japan
Figures
Figure 1
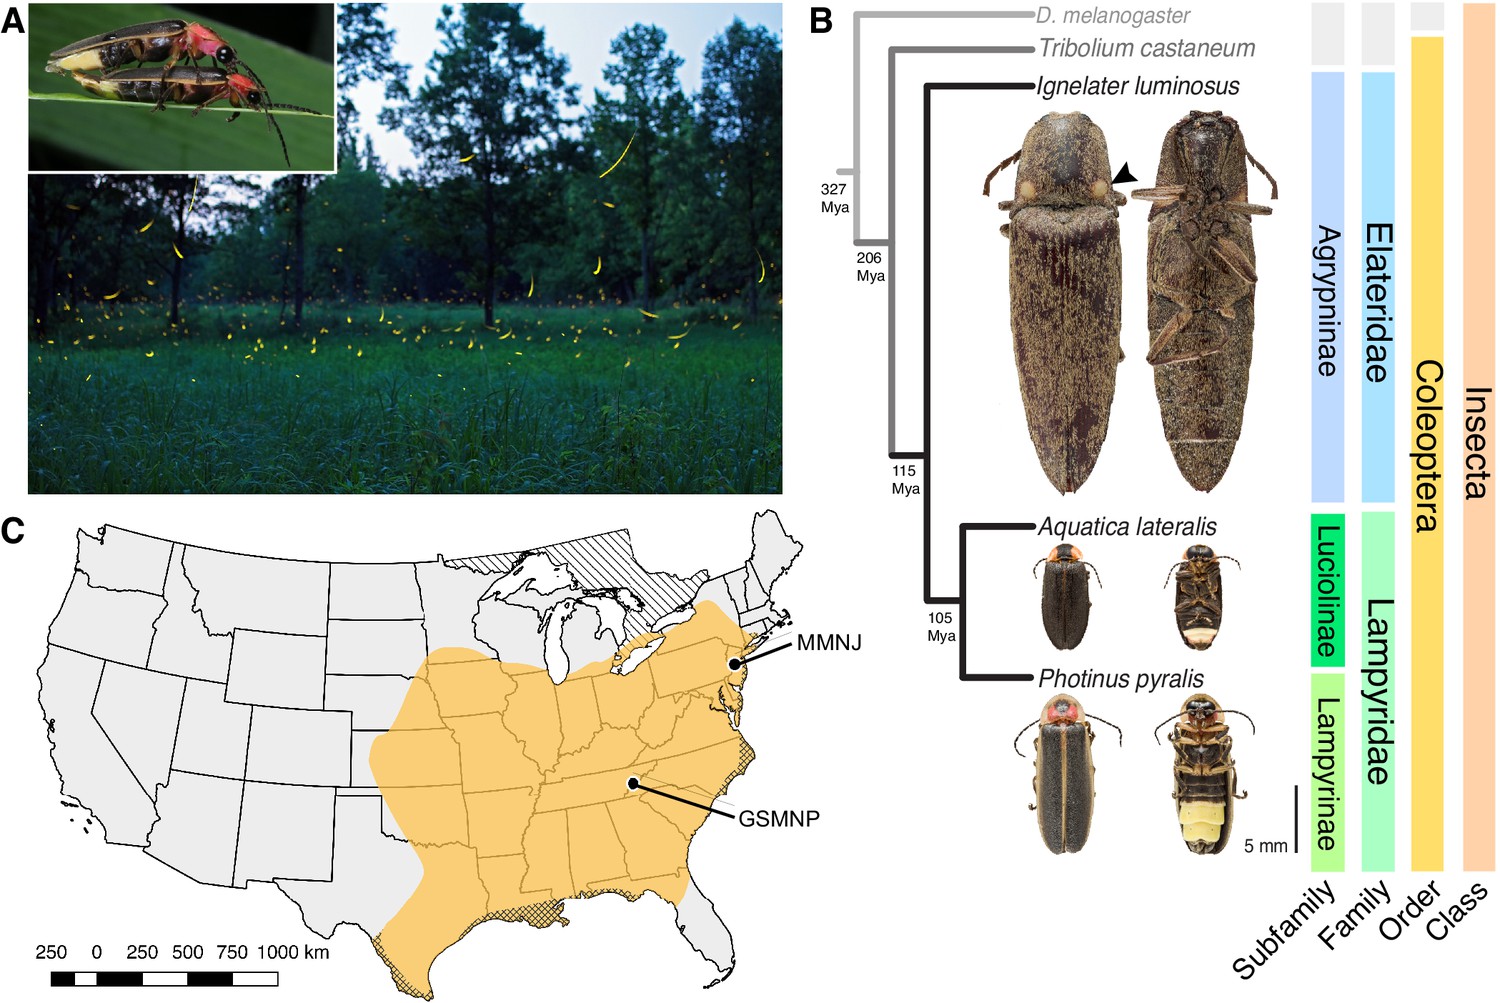
Geographic and phylogenetic context of the Big Dipper firefly, Photinus pyralis.
(A) P. pyralis males emitting their characteristic swooping ‘J’ patrol flashes over a field in Homer Lake, Illinois. Females cue in on these species-specific flash patterns and respond with their own species-specific flash (Lloyd, 1966). Photo credit: Alex Wild. Inset: male and female P. pyralis in early stages of mating. Photo credit: Terry Priest. (B) Cladogram depicting the hypothetical phylogenetic relationship between P. pyralis and related bioluminescent and non-bioluminescent taxa with Tribolium castaneum and Drosophila melanogaster as outgroups. Numbers at nodes give approximate dates of divergence in millions of years ago (mya) (Misof et al., 2014; Mckenna et al., 2015). Right: Dorsal and ventral photos of adult male specimens. Note the well-developed ventral light organs on the true abdominal segments 6 and 7 of P. pyralis and A. lateralis. In contrast, the luminescent click beetle, I. luminosus, has paired dorsal light organs at the base of its prothorax (arrowhead) and a lantern on the anterior surface of the ventral abdomen (not visible). (C) Empirical range of P. pyralis in North America, extrapolated from 541 reported sightings (Appendix 1.2). Collection sites of individuals used for genome assembly are denoted with circles and location codes. Cross hatches represent areas which likely have P. pyralis, but were not sampled. Diagonal hashes represent Ontario, Canada.
Figure 2
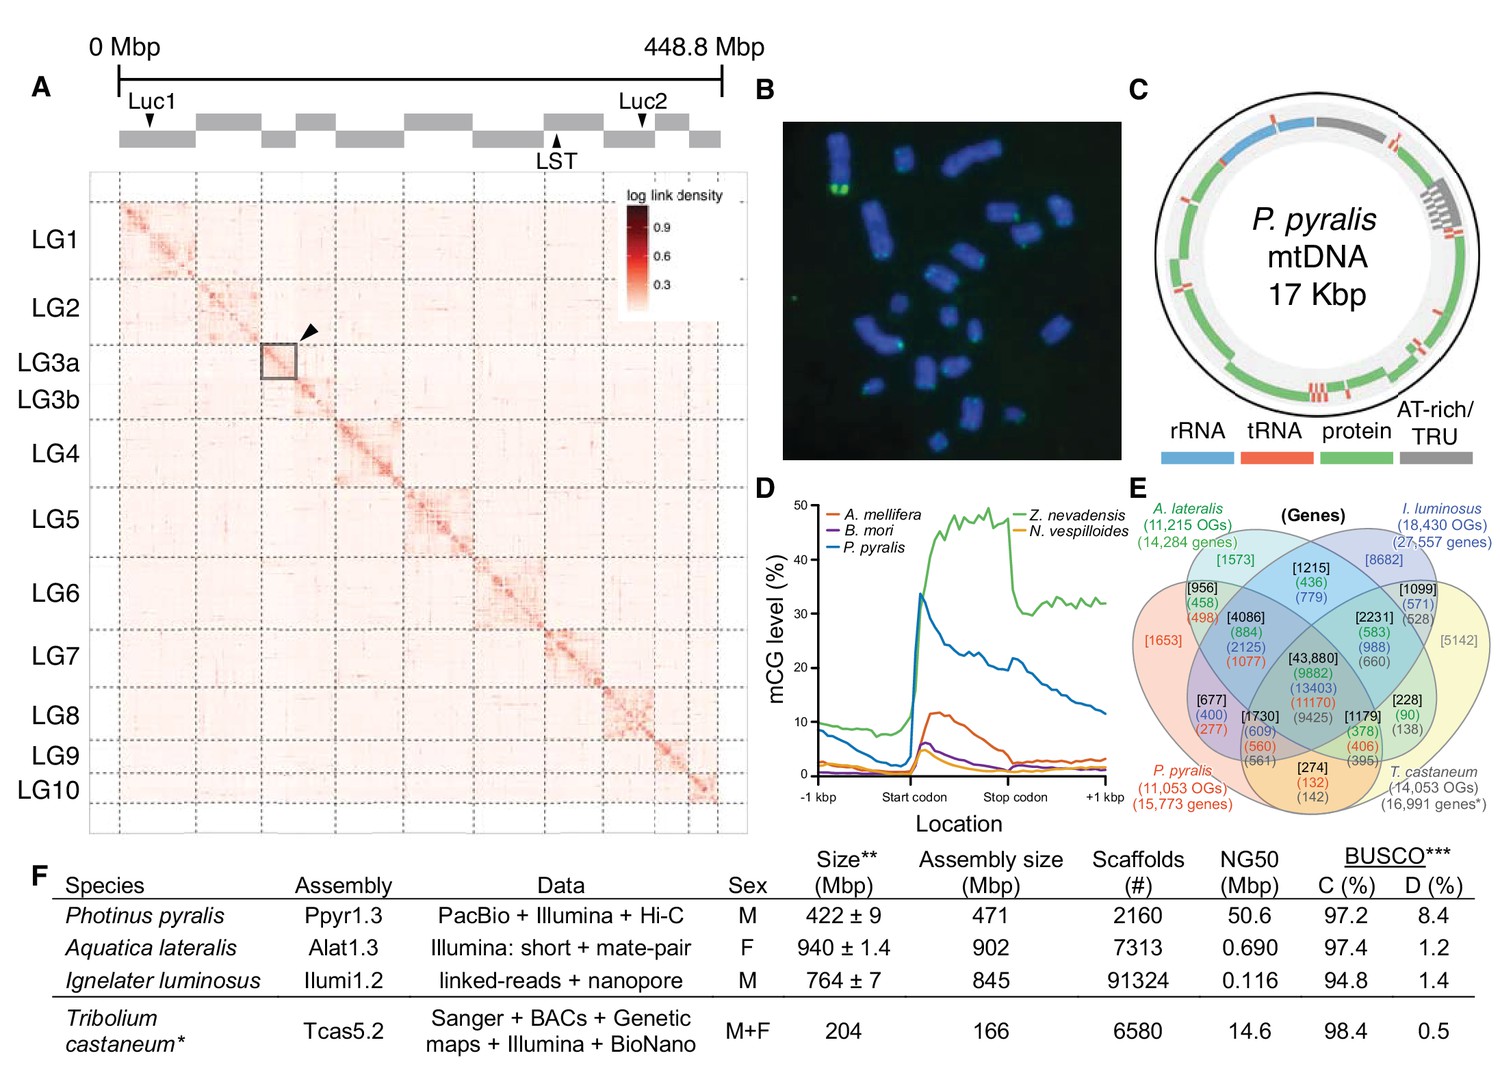
Photinus pyralis genome assembly and analysis.
(A) Assembled Ppyr1.3 linkage groups with annotation of the location of known luminescence-related genes, combined with Hi-C linkage density maps. Linkage group 3a (box with black arrow) corresponds to the X chromosome (Appendix 1.6.4.1). (B) Fluorescence in situ hybridization (FISH) on mitotic chromosomes of a P. pyralis larvae. The telomeric repeats TTAGG (green) localize to the ends of chromosomes stained with DAPI (blue). 20 paired chromosomes indicates that this individual was an XX female (Appendix 1.13). (C) Genome schematic of P. pyralis mitochondrial genome (mtDNA). Like other firefly mtDNAs, it has a tandem repetitive unit (TRU) (Appendix 1.8). (D) mCG is enriched across gene bodies of P. pyralis and shows methylation levels that are at least two times higher than other holometabolous insects (Appendix 1.12). (E) Orthogroup (OGs) clustering analysis of genes with Orthofinder (Emms and Kelly, 2015) shows a high degree of overlap of the P. pyralis, A. lateralis, and I. luminosus genesets with the geneset of Tribolium castaneum. Numbers within curved brackets (colored by species) represent gene count from specific species within the shared orthogroups. Numbers with square brackets (black color) represent total gene count amongst shared orthogroups. OGs = orthogroups, *=Not fully filtered to single isoform per gene. See Appendix 4.2.1 for more detail. Intermediate scripts and species-specific overlaps are available as Figure 2—source data 1. (F) Assembly statistics for presented genomes. *=Tribolium castaneum model beetle genome assembly (Tribolium Genome Sequencing Consortium et al., 2008) **=Genome size estimated by FC: flow cytometry. P. pyralis n = 5 females (SEM) I. luminosus n = 5 males (SEM), A. lateralis n = 3 technical-replicates of one female (SD). ***=Complete (C), and Duplicated (D), percentages for the Endopterygota BUSCO (Simão et al., 2015) profile (Appendix 1.4, 2.4, 3.4, 4.1).
-
Figure 2—source data 1
Figure 2E. Orthogroup clustering analysis.
- https://doi.org/10.7554/eLife.36495.006
-
Figure 2—source data 2
Excel file of Figure 2F table.
- https://doi.org/10.7554/eLife.36495.007
Figure 3
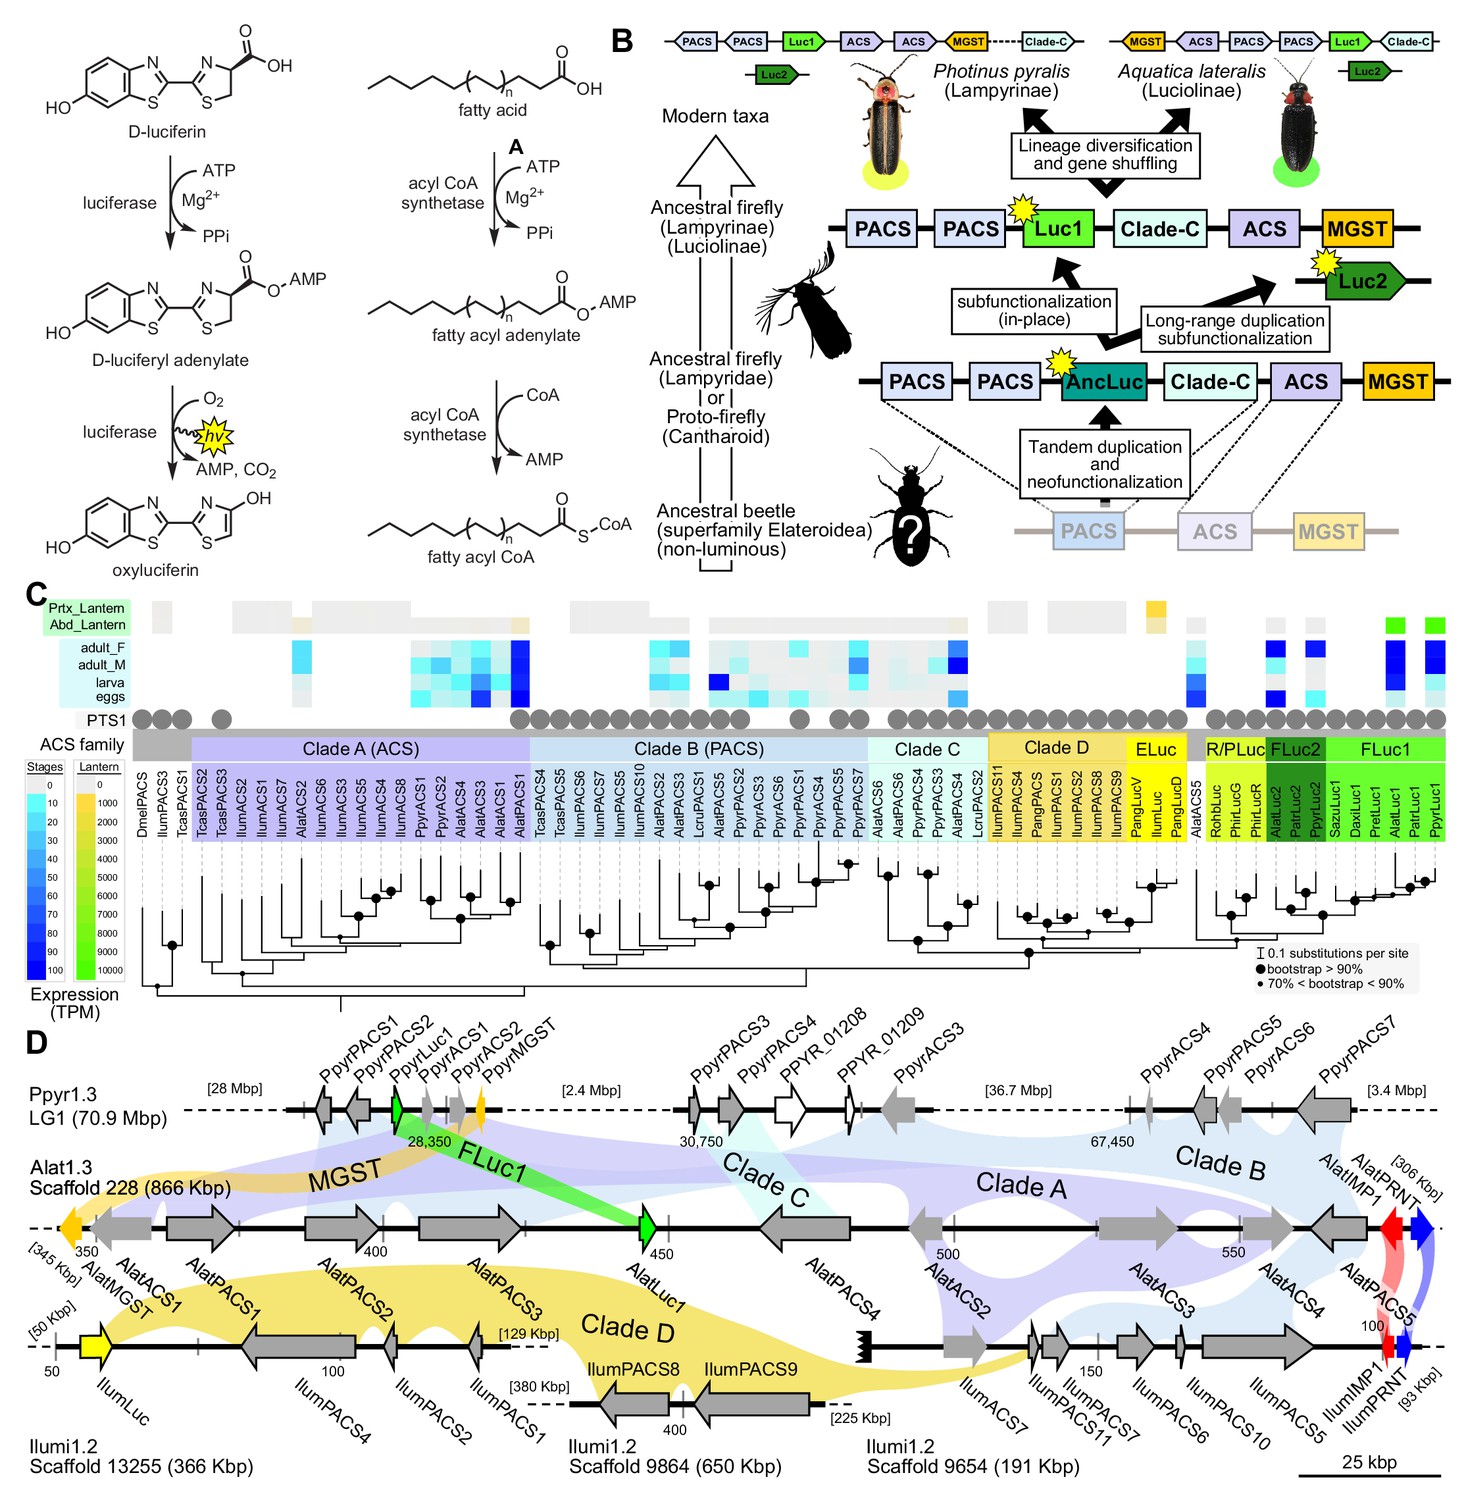
A genomic view of luciferase evolution.
(A) The reaction scheme of firefly luciferase is related to that of fatty acyl-CoA synthetases. (B) Model for genomic evolution of firefly luciferases. Ranging from genome structures of luciferase loci in extant fireflies (top), to inferred genomic structures in ancestral species (bottom). Arrow (left) represents ascending time. Not all adjacent genes within the same clade are shown. (C) Maximum likelihood tree of luciferase homologs. Grey circles above gene names indicate the presence of peroxisomal targeting signal 1 (PTS1). Color gradients indicate the transcript per million (TPM) values of whole body in each sex/stage (grey to blue) and in the prothorax or abdominal lantern (grey to orange to green). Tree and annotation visualized using iTOL (Letunic and Bork, 2016). Prothorax and abdominal lantern expression values for I. luminosus are from whole prothorax plus head, and metathorax plus the two most anterior abdominal segments. Fluc = firefly luciferases, Eluc = elaterid luciferases, R/PLuc = rhagophthalmid/phengodid luciferases. (Appendix 4.3.2) Gene tree, gene accession numbers, annotation, and expression values are available as Figure 3—source data 1. (D) Synteny analysis of beetle luciferase homologs. Nine of the 14 A. lateralis PACS/ACS genes closely flank AlatLuc1 on scaffold 228, while 4 of the 13 P. pyralis PACS/ACS genes are close neighbors of PpyrLuc1 on LG1, with a further seven genes 2.4 Mbp and 39.1 Mbp away on the same linkage-group. Although the Luc1 loci in P. pyralis and A. lateralis are evidently derived from a common ancestor, the relative positions of the most closely related flanking PACS/ACS genes have diverged between the two species. IlumLuc was captured on a separate scaffold (Ilumi1.2_Scaffold13255) from its most most closely related PACSs (IlumPACS8, IlumPACS9) on Ilumi1.2_Scaffold9864, although three more distantly related PACS genes (IlumiPACS1, IlumiPACS2, IlumiPACS4) are co-localized with IlumLuc. In contrast, a different scaffold (Ilumi1.2_Scaffold9654) shows orthology to the firefly Luc1 locus. The full Ilumi1.2_Scaffold13255 was produced by a manual evidence-supported merge of two scaffolds (Appendix 3.5.4). Genes with a PTS1 are indicated by a dark outline, except for the genes with white interiors, which instead represent non-PACS/ACS genes without an identified homolog in the other scaffolds. Co-orthologous genes are labeled in the same color in the phylogenetic tree and are connected with corresponding color bands in synteny diagram. Genes and genomic regions are to scale (Scale bar = 25 Kbp). Gaps excluded from the figure are shown with dotted lines and are annotated with their length in square brackets. Scaffold ends are shown with rough black bars. MGST = Microsomal glutathione S-transferase, IMP = Inositol monophosphatase, PRNT = Polyribonucleotide nucleotidyltransferase. Figure produced with GenomeTools ‘sketch’ (v1.5.9) (Gremme et al., 2013). Figure production scripts available as Figure 3—source data 2.
-
Figure 3—source data 1
Gene tree, gene accession numbers, annotation, and expression values for Figure 3C.
- https://doi.org/10.7554/eLife.36495.009
-
Figure 3—source data 2
Bash scripts for Figure 3D figure production.
- https://doi.org/10.7554/eLife.36495.010
Figure 4
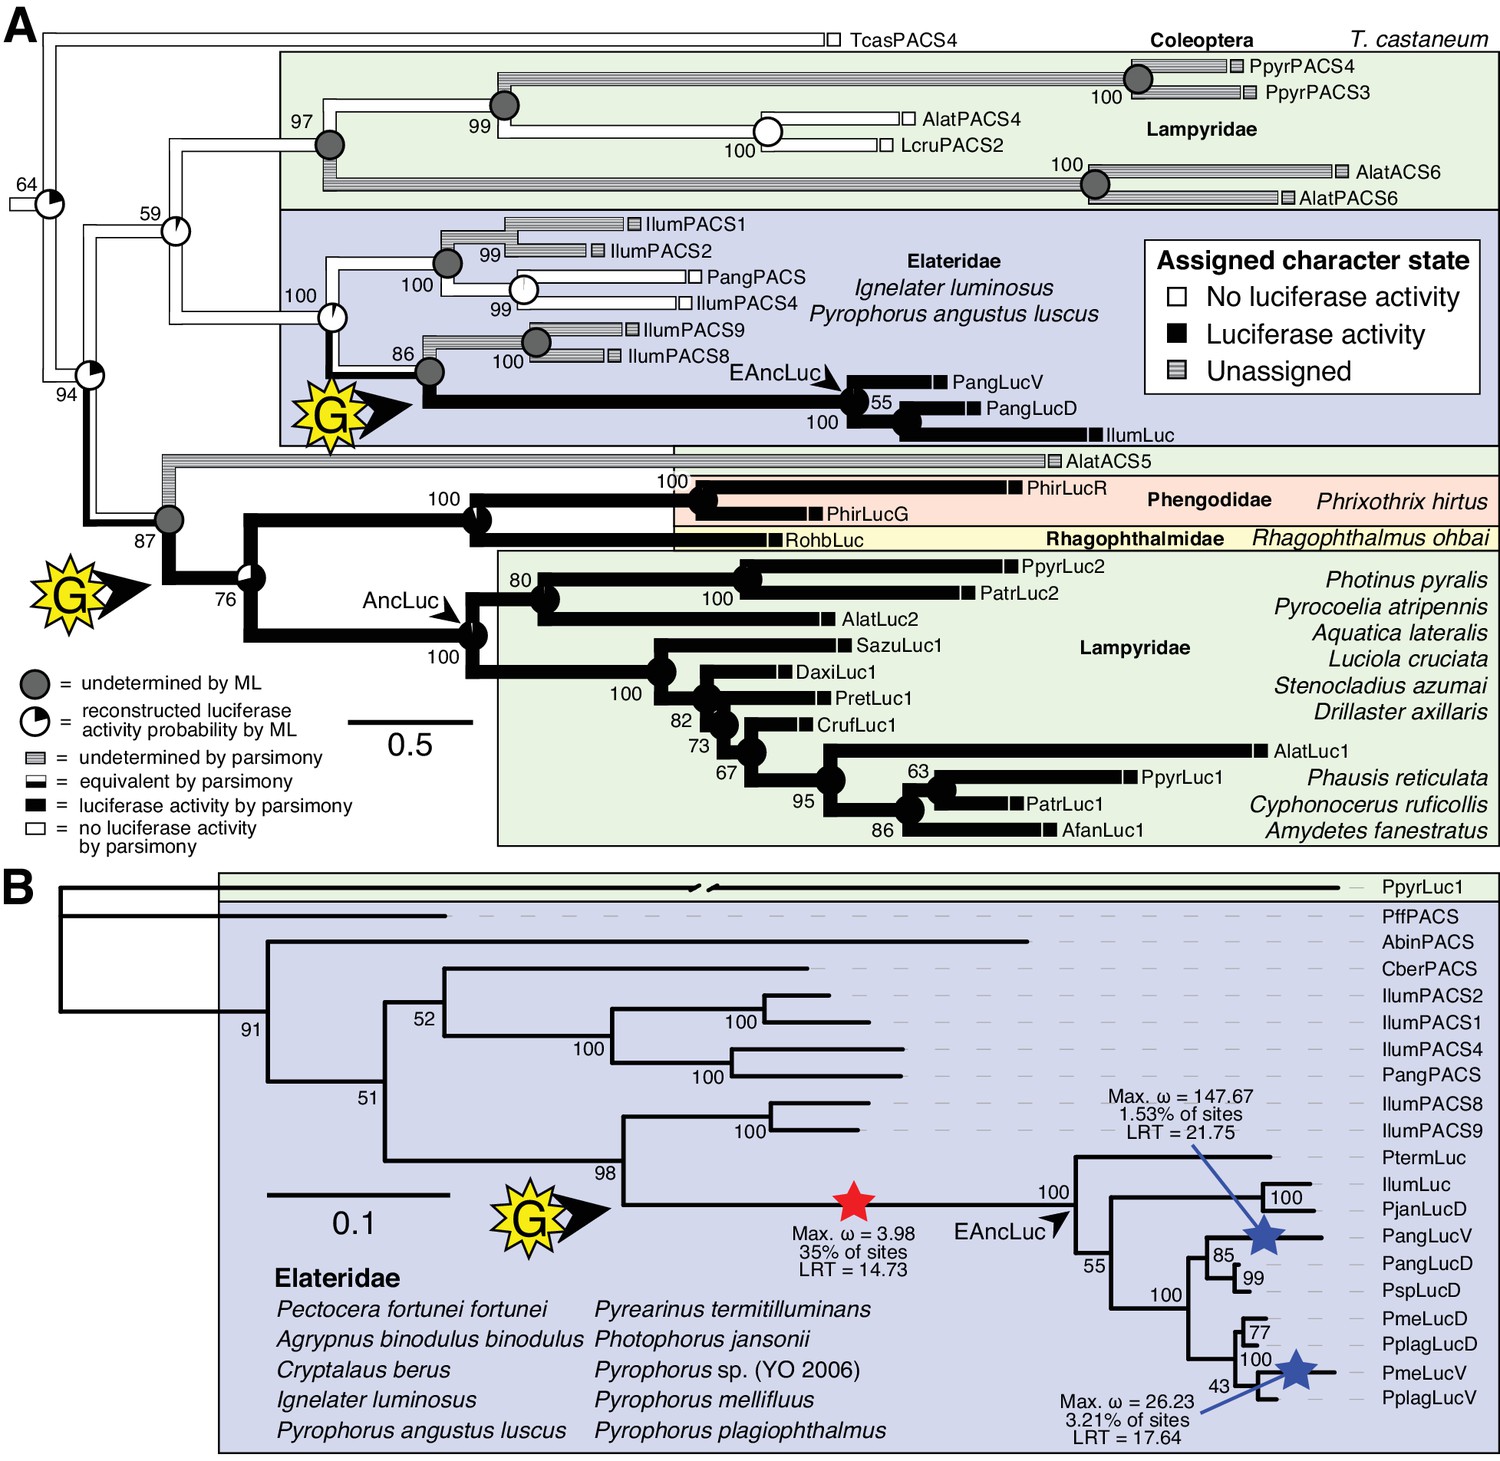
Parallel evolution of elaterid and firefly luciferase.
(A) Ancestral state reconstruction recovers at least two gains of luciferase activity in bioluminescent beetles. Luciferase activity (top right figure key; black: luciferase activity, white: no luciferase activity, shaded: undetermined) was annotated on extant firefly luciferase homologs via literature review or inference via direct orthology. The ancestral states of luciferase activity within the putative ancestral nodes were then reconstructed with an unordered parsimony framework and a maximum likelihood (ML) framework (bottom left figure key; Appendix 4.3.3). Two gains (‘G’) of luciferase activity, annotated with black arrows and yellow stars, are hypothesized. These hypothesized gains occurred once in a gene within the common ancestor of fireflies, rhagophthalmid, and phengodid beetles, and once in a gene within the common ancestor of bioluminescent elaterid beetles. Scale bar is substitutions per site. Numbers adjacent to nodes represents node support. NEXUS and newick files available as Figure 4—source data 1 (B) Molecular adaptation analysis supports independent neofunctionalization of click beetle luciferase. We tested the molecular adaptation of elaterid luciferase using the adaptive branch-site REL test for episodic diversification (aBSREL) method (Smith et al., 2015) (Appendix 4.3.4). The branch leading to the common ancestor of elaterid luciferases (red star) was one of three branches (red and blue stars) recovered with significant (p<0.01) evidence of positive selection, with 35% of sites showing strong directional selection (ω or max dN/dS = 3.98), which we interpret as signal of the initial neofunctionalization of elaterid ancestral luciferase (EAncLuc) from an ancestor without luciferase activity. As the selected branches with blue stars are red-shifted elaterid luciferases (Oba et al., 2010a; Stolz et al., 2003), they may represent the post-neofunctionalization selection of a few key sites via sexual selection of emission colors. Specific sites identified as under selection using Mixed Effect Model of Evolution (MEME) and Phylogenetic Analysis by Maximum Likelihood (PAML) methods are described in Appendix 4.3.4. The tree and results from the full adaptive model are shown. Branch length, with the exception of the PpyrLuc1 branch which was shortened, reflects the number of substitutions per site. Numbers adjacent to nodes represents node support. Figure was produced with iTOL (Letunic and Bork, 2016). Gene tree, metadata, and coding nucleotide multiple sequence alignment available as Figure 4—source data 2.
-
Figure 4—source data 1
NEXUS and Newick files for luciferase ancestral state reconstruction in Figure 4A.
- https://doi.org/10.7554/eLife.36495.012
-
Figure 4—source data 2
Gene tree, metadata, and coding nucleotide multiple sequence alignment for Elaterid luciferase homolog branch selection test.
- https://doi.org/10.7554/eLife.36495.013
Figure 5
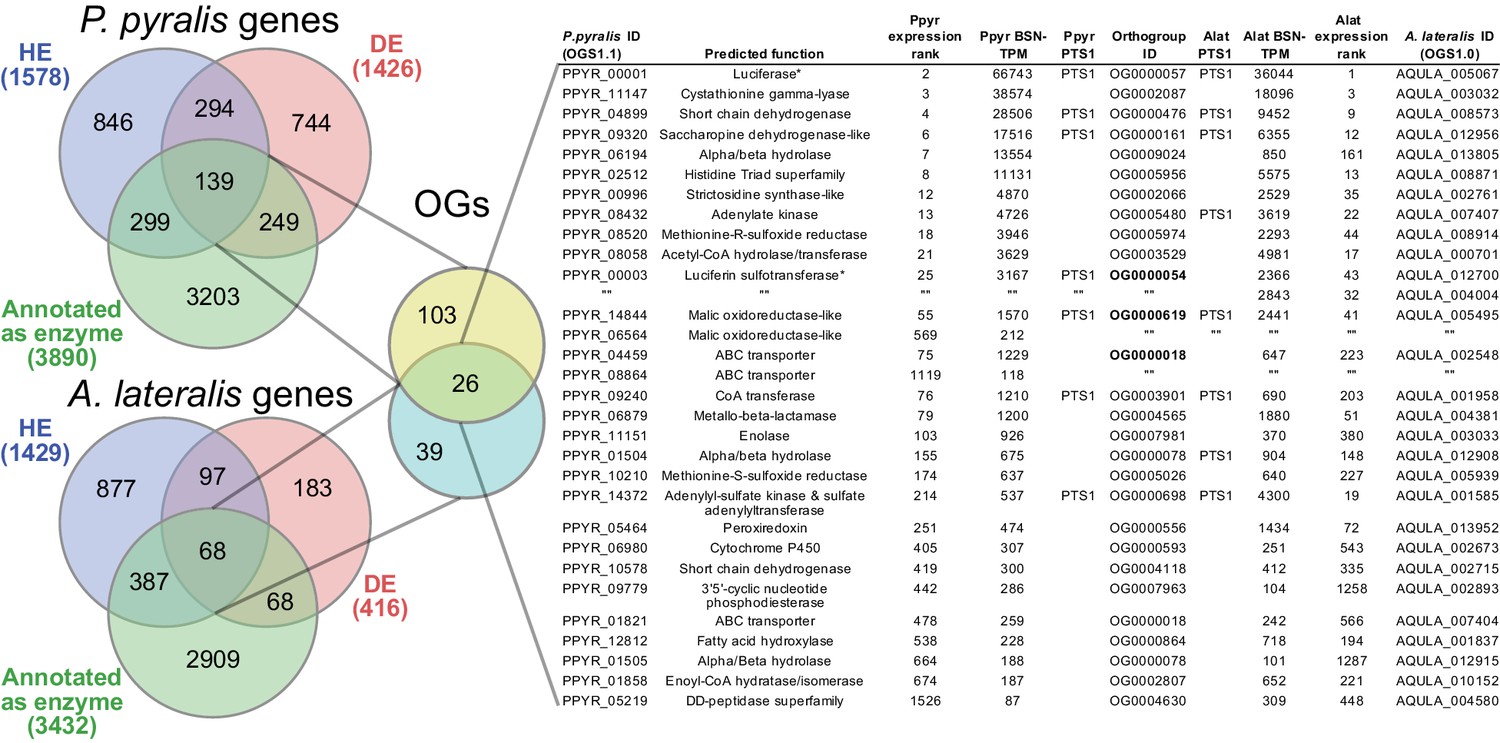
Comparative analyses of firefly lantern expression highlight likely metabolic adaptations to bioluminescence.
Enzymes which are highly expressed (HE), differentially expressed (DE), and annotated as enzymes via InterProScan are shown in the Venn diagrams for their respective species. Those genes in the intersection of the two sets which are within the same orthogroup (OGs) as determined by OrthoFinder are shown in the table. Many-to-one orthology relationships are represented by bold orthogroups and blank cells. See Appendix 4.2.2 for more detail. *=genes of previously described function. Underlying expression quantification and Venn analysis available on FigShare: (DOI: 10.6084/m9.figshare.5715151)
-
Figure 5—source data 1
Table of Figure 5 highly expressed, differentially expressed, orthogroup overlapped genes.
- https://doi.org/10.7554/eLife.36495.015
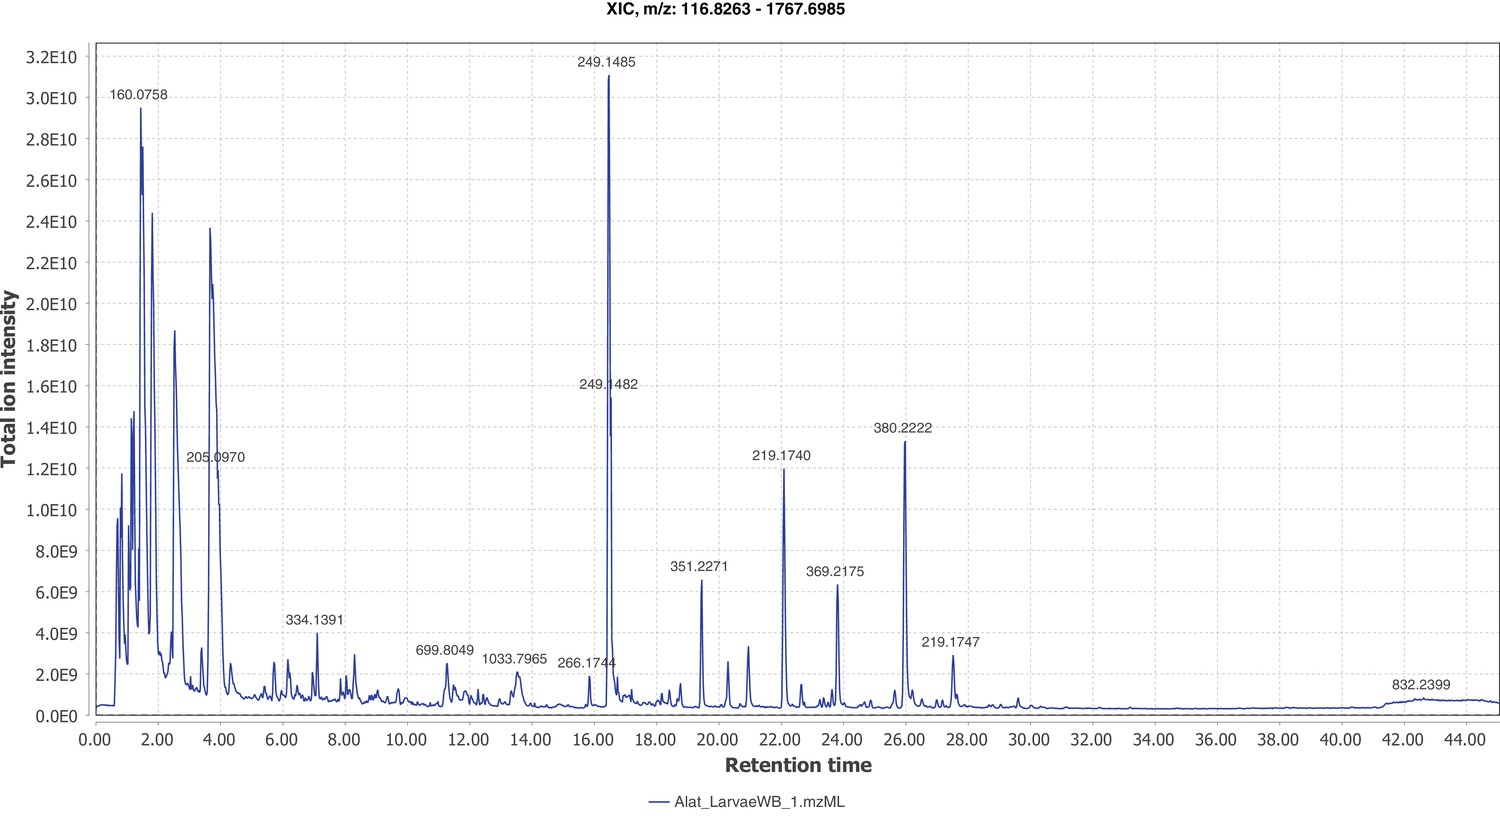
Figure 6
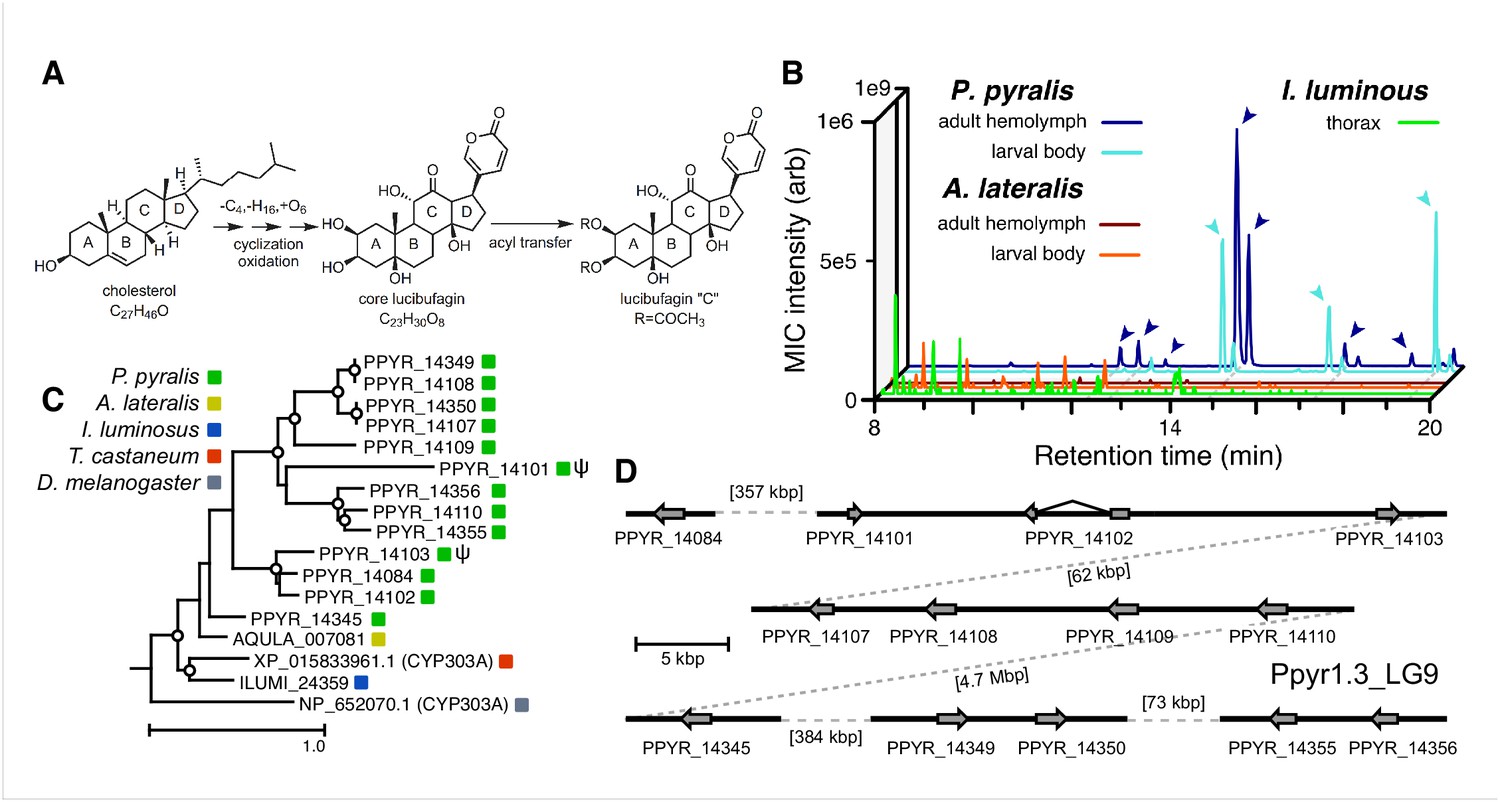
An expansion in the CYP303-P450 family correlates with lucibufagin content.
(A) Hypothesized lucibufagin biosynthetic pathway, starting from cholesterol. (B) LC-HRAM-MS multi-ion-chromatograms (MIC) showing the summation of exact mass traces for the [M + H]+ of 11 lucibufagin chemical formulas ± 5 ppm, calibrated for run-specific systematic m/z error (Appendix 4—table 9). Y-axis upper limit for P. pyralis adult hemolymph and larval body extract is 1000x larger than other traces. Arrows (blue/teal) indicate features with high MS2 spectral similarity to known lucibufagins. Sporadic peaks in A. lateralis body, and I. luminosus thorax traces are not abundant, preventing MS2 spectral acquisition and comparison, but do not match the m/z and RT of P. pyralis lucibufagins (Appendix 4.6). (C) Maximum likelihood tree of CYP303 family cytochrome P450 enzymes from P. pyralis, A. lateralis, T. castaneum, and D. melanogaster. P. pyralis shows a unique CYP303 family expansion, whereas the other species only have a single CYP303. Circles represent node bootstrap support >60%. Branch length measures substitutions per site. Pseudogenes are annotated with the greek letter Ψ (Appendix 1.10.1; 4.2.4). (D) Genomic loci for P. pyralis CYP303 family genes. These genes are found in multiple gene clusters on LG9, supporting origin via tandem duplication. Introns >4 kbp are shown.
-
Figure 6—source data 1
CYP303 multiple sequence alignment and gene tree for Figure 6C.
- https://doi.org/10.7554/eLife.36495.017
Appendix 1—figure 1
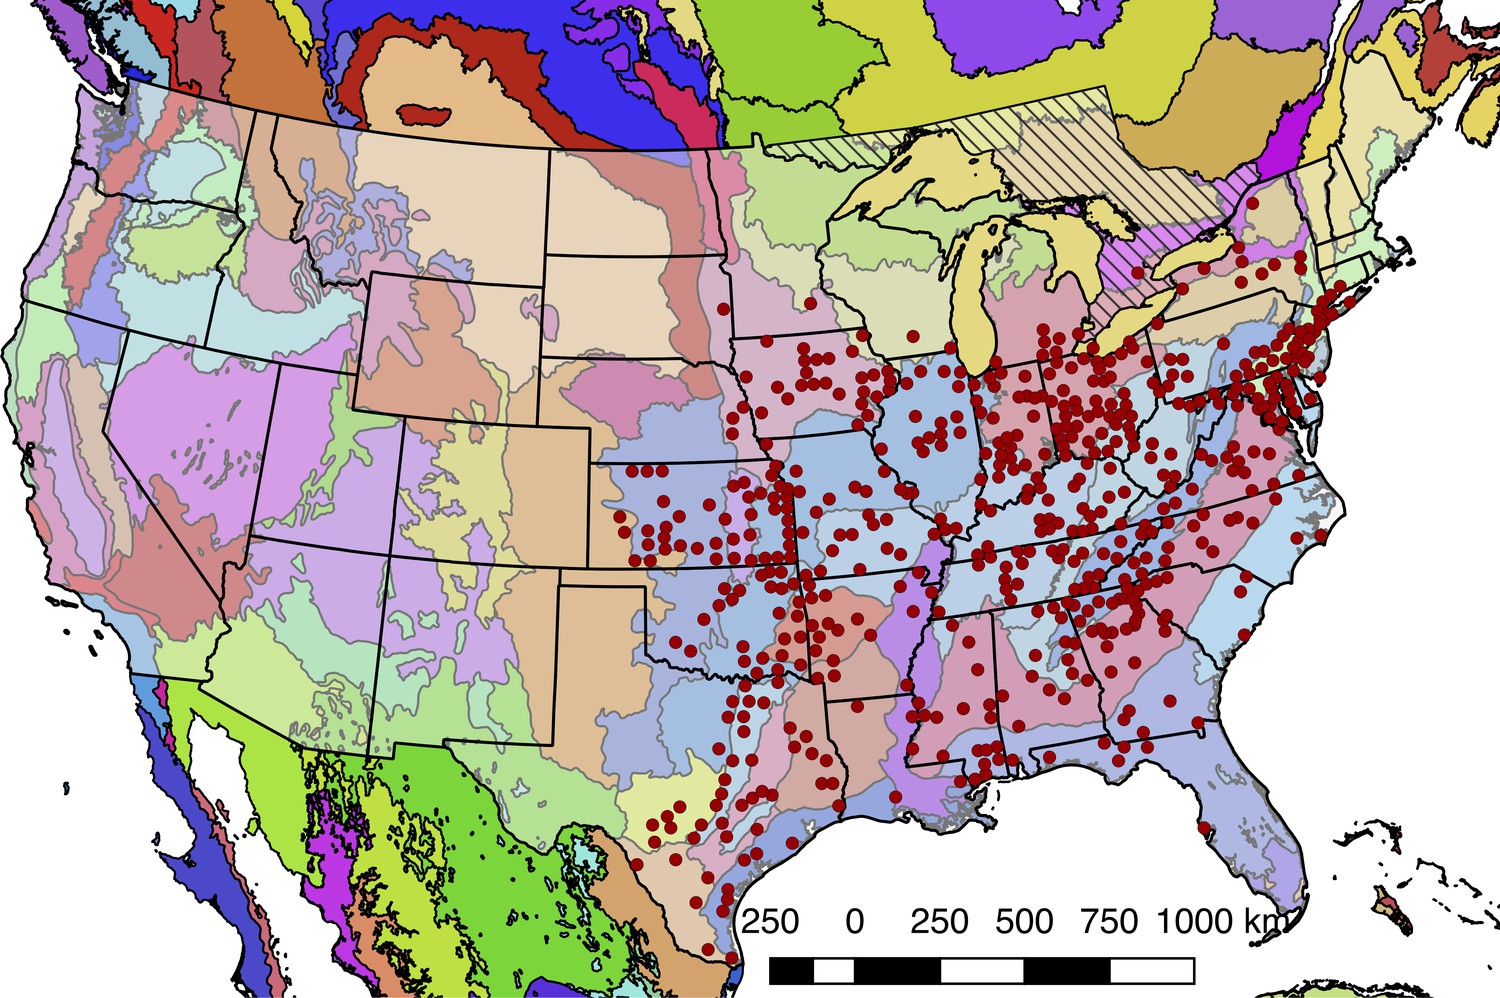
Detailed geographic distribution map for P. pyralis.
P. pyralis sightings (red circles show county centroided reports) in the United States and Ontario, Canada (diagonal hashes). The World Wildlife Fund Terrestrial Ecoregions (Olson et al., 2001; World Wildlife Fund, 2017) are also shown (colored shapes). The P. pyralis sighting dataset shown is identical to that used to prepare Figure 1B.
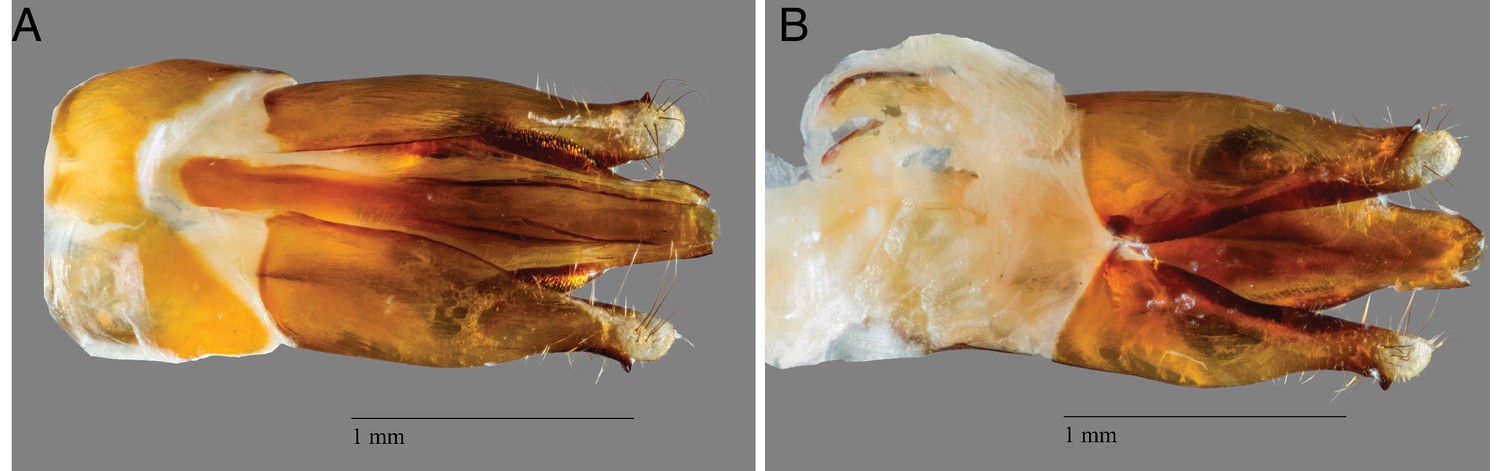
Appendix 1—figure 2
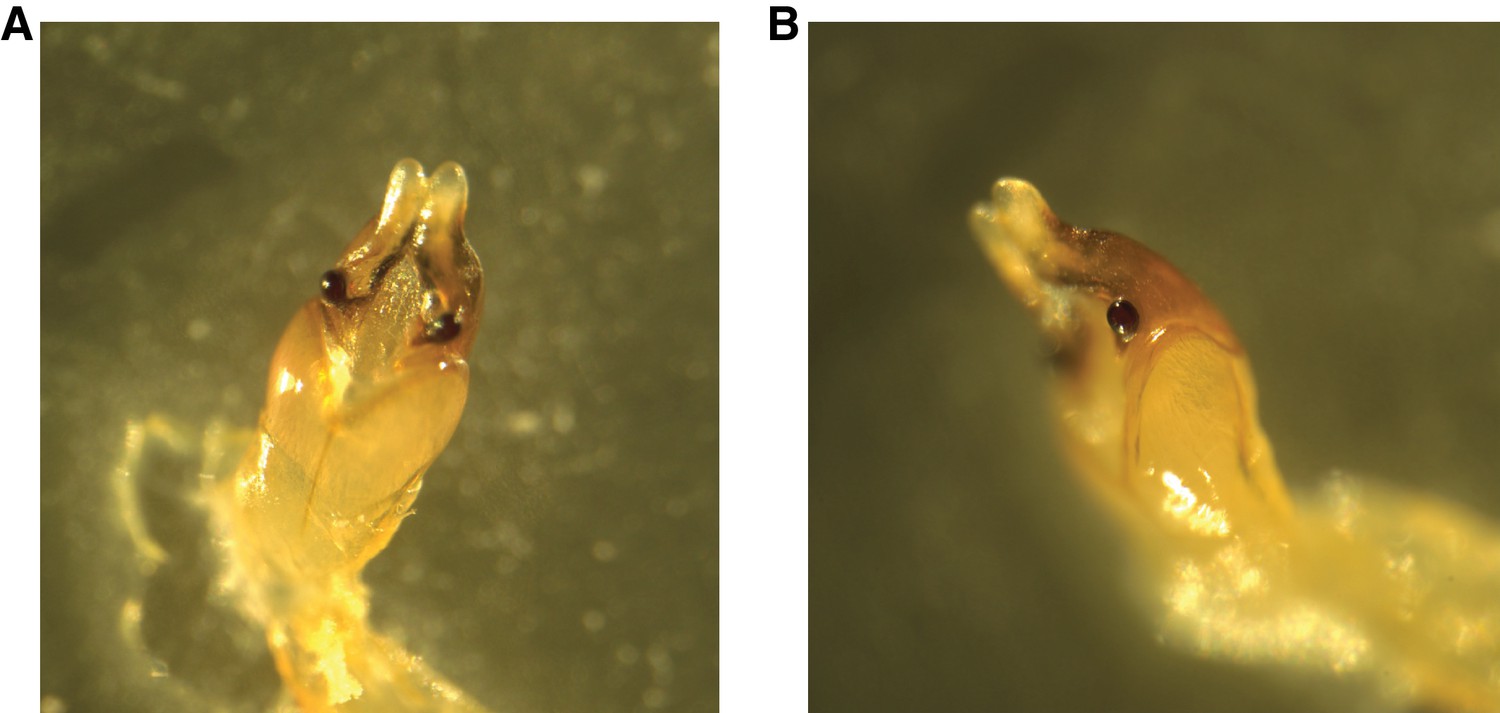
P. pyralis aedeagus (male genitalia).
(A) Ventral and (B) side view of a P. pyralis aedeagus dissected from specimens collected on the same date and locality as those used for PacBio sequencing. Note the strongly sclerotized paired ventro-basal processes (‘mickey mouse ears’) emerging from the median process, characteristic of P. pyralis (Green, 1956).
Appendix 1—figure 3
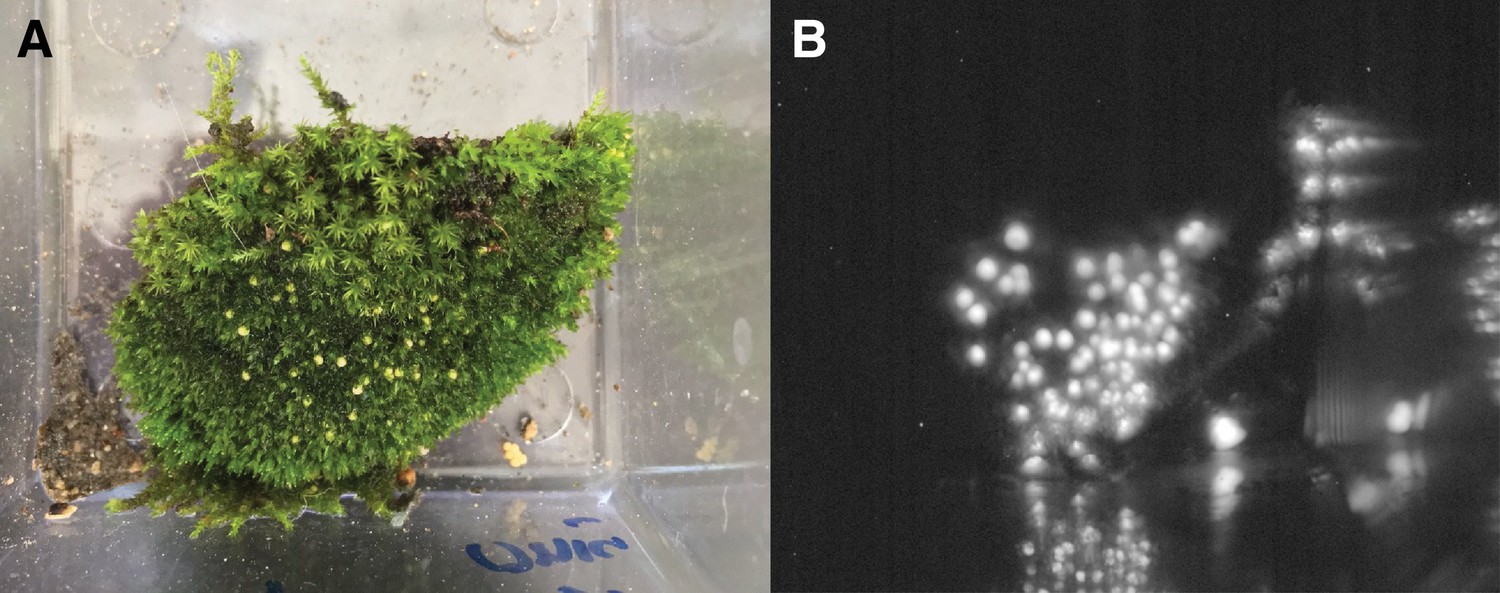
Luminescence of P. pyralis eggs.
(A) Photograph under ambient light of ~1 day post-deposition P. pyralis eggs. (B) Photograph of self-luminescence of ~1 day post-deposition P. pyralis eggs. Both photographs taken with a NightOwl LB98 cooled CCD luminescence imager (Berthold Technologies, USA). Luminescence was not visible to the dark-adapted eye.
Appendix 1—figure 4
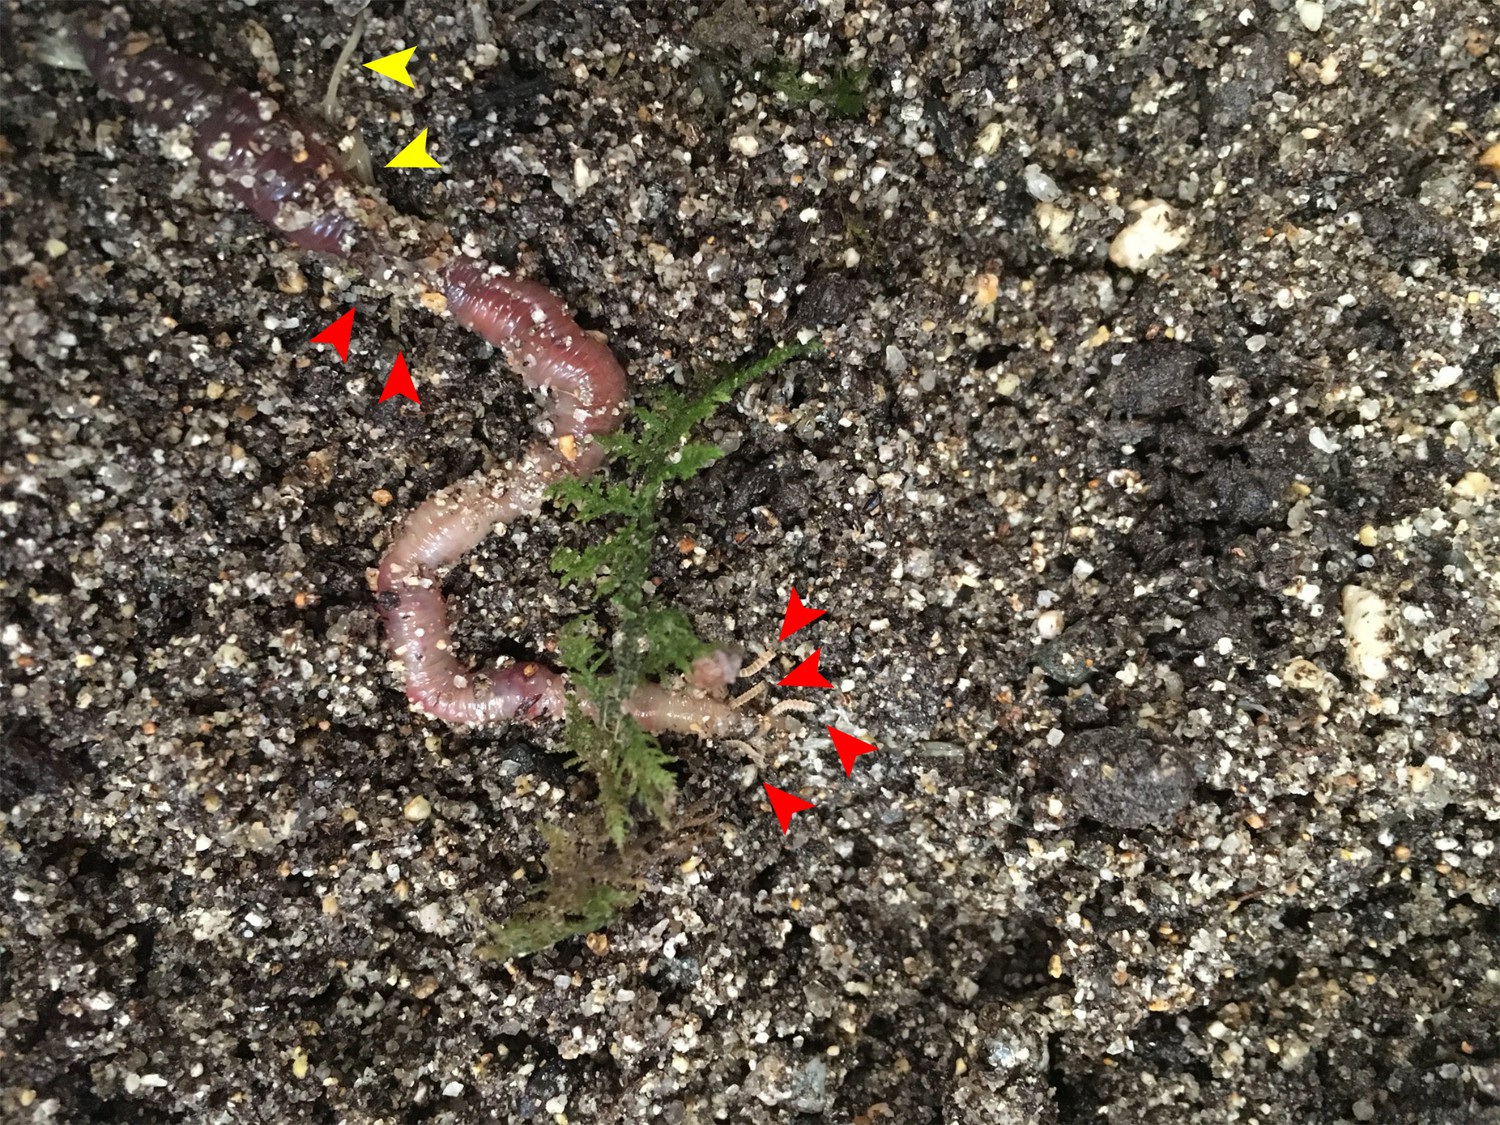
Gregarious predation of young P. pyralis larvae on a live Lumbricus terrestris.
Both P. pyralis larvae (red arrows), and Enchytraeus albidus (yellow arrows), were observed to feed on the paralyzed earthworms.
Appendix 1—figure 5
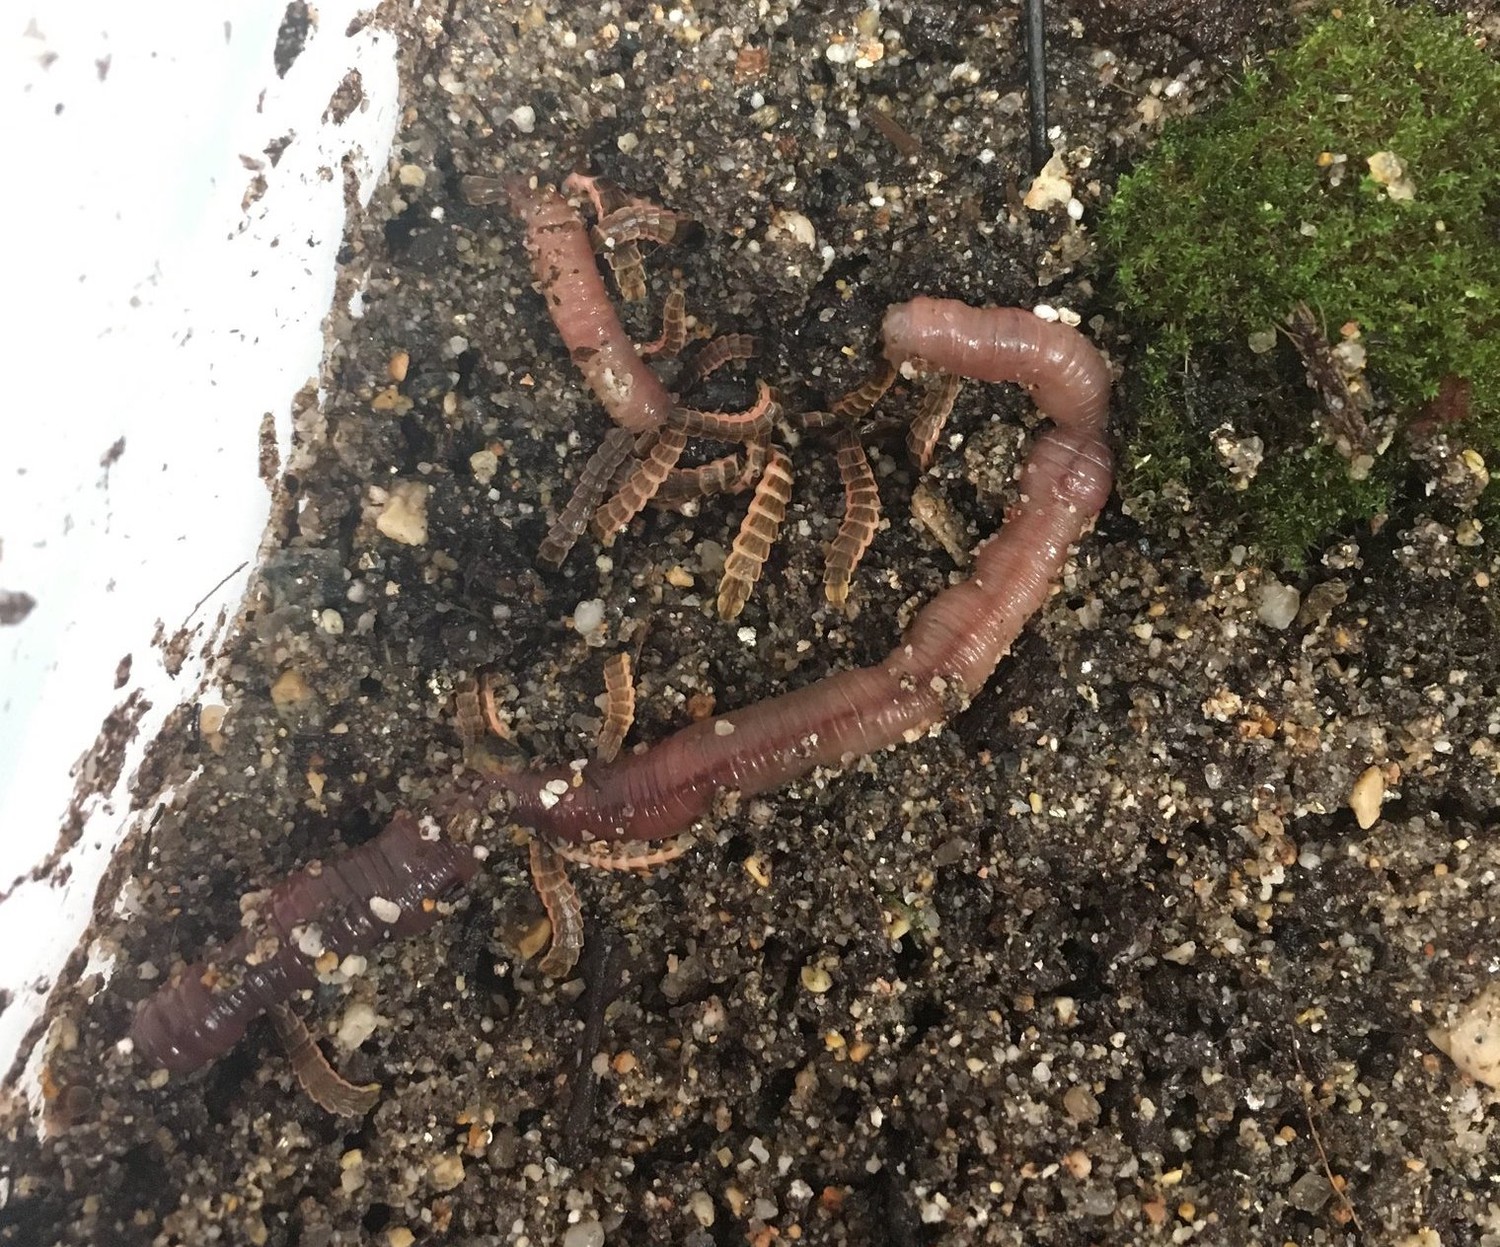
Gregarious predation of 3rd-4th instar P. pyralis larvae on a live Lumbricus terrestris.
https://doi.org/10.7554/eLife.36495.024
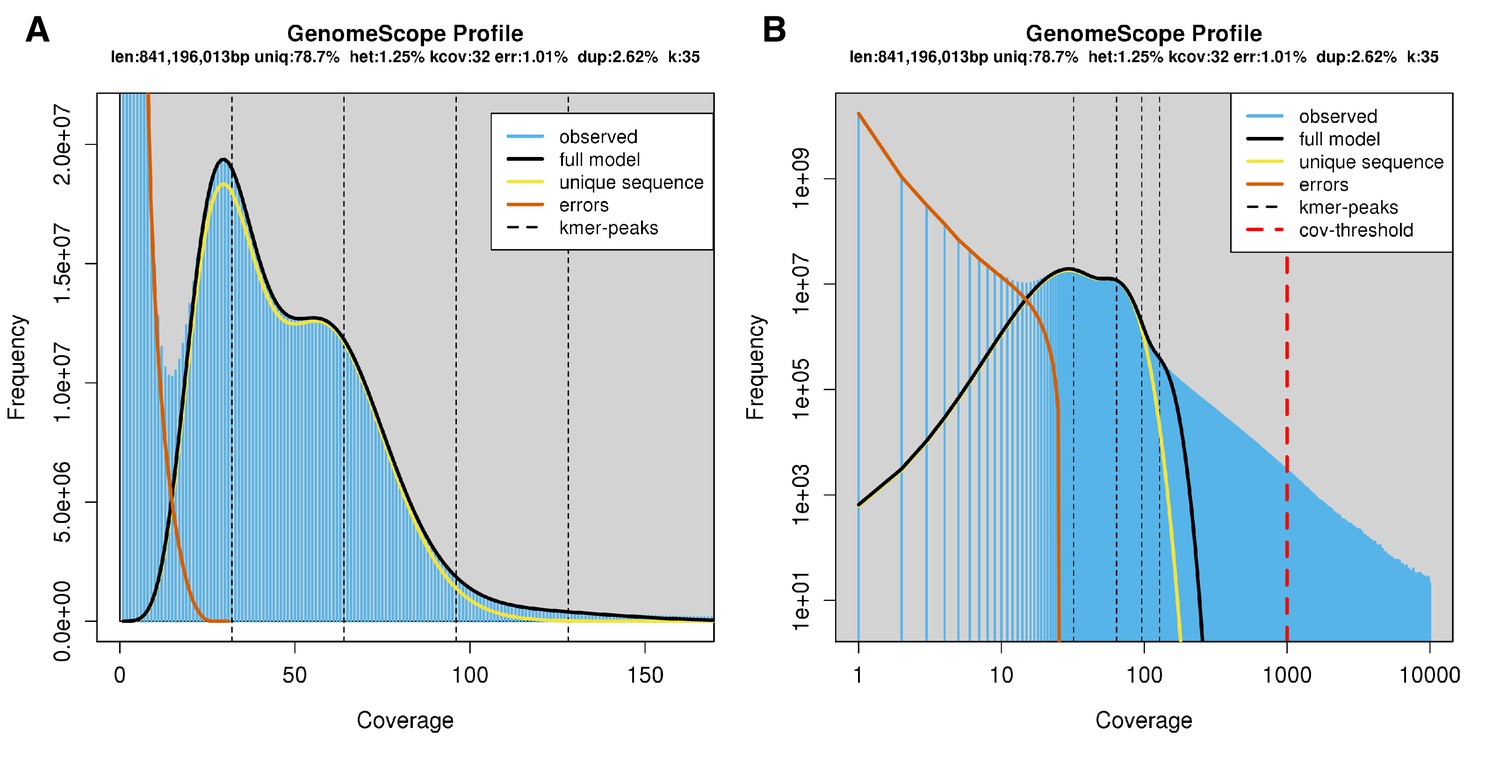
Appendix 1—figure 6
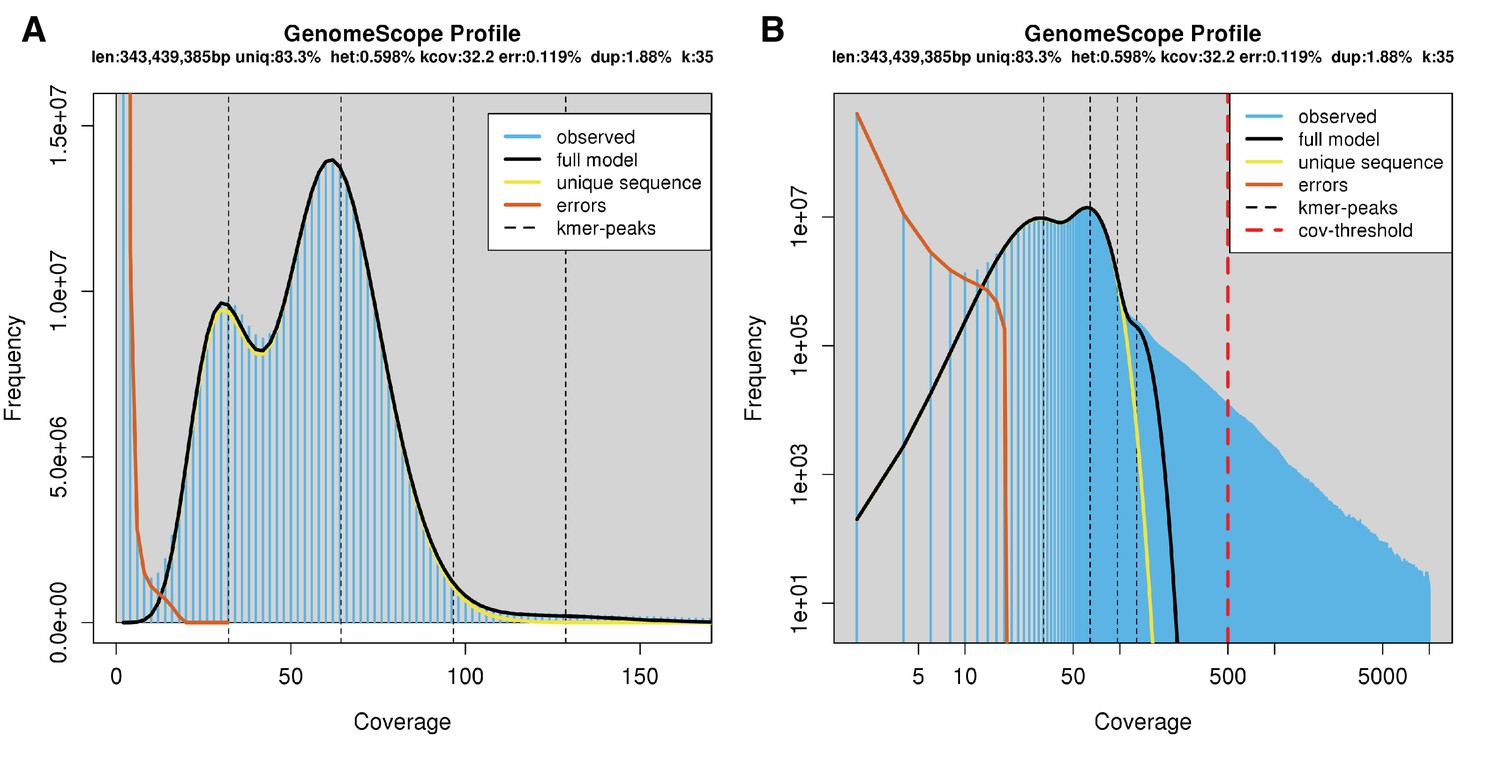
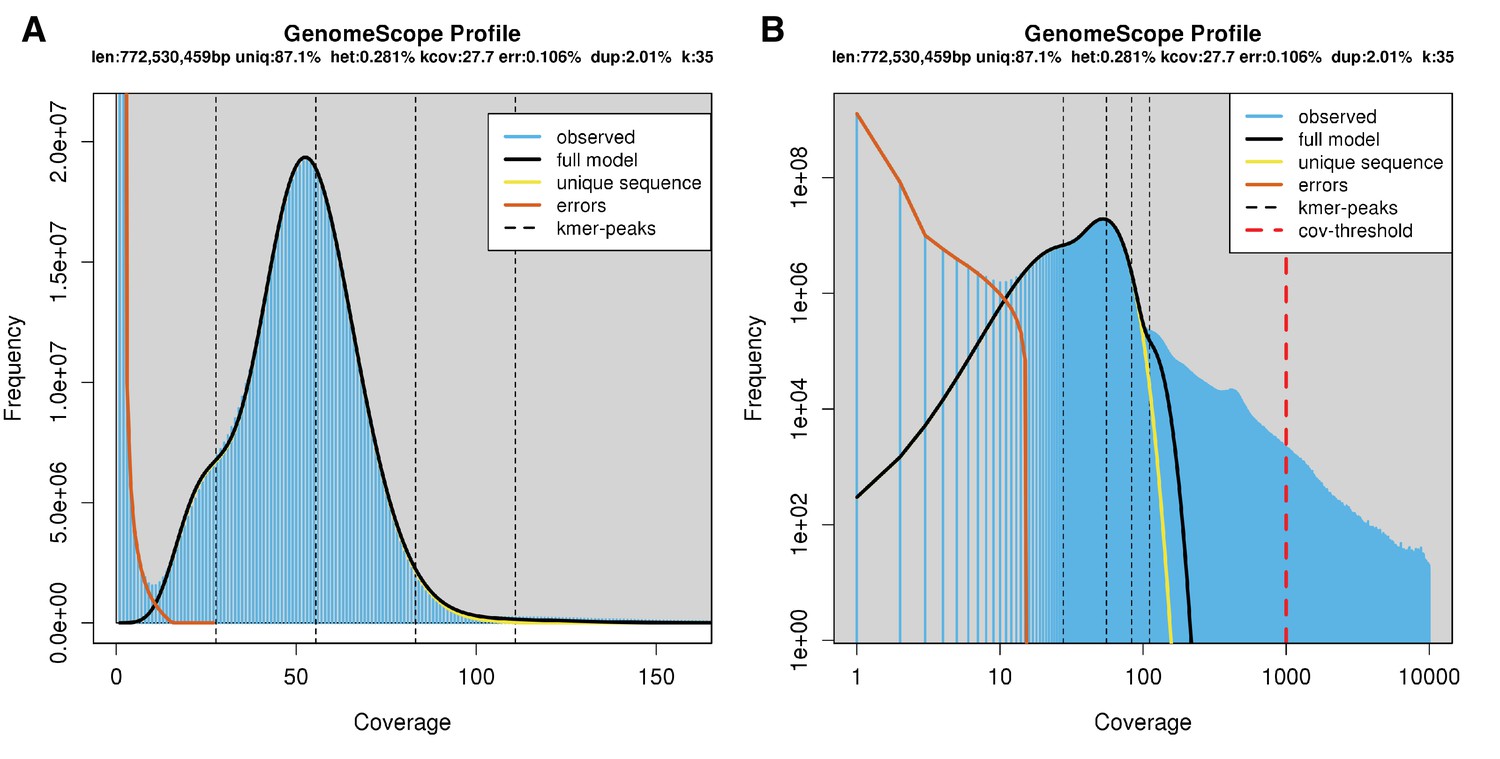
Genome scope kmer analysis of the P. pyralis short read library.
(A) Linear and (B) log plot of a kmer spectral genome composition analysis of the ‘8369’ P. pyralis Illumina short-read library from a single P. pyralis XO adult male (Appendix 1.5.1; Appendix 4—table 1) with jellyfish (v2.2.9; parameters: -C -k 35) (Marçais and Kingsford, 2011) and GenomeScope (v1.0; parameters: Kmer length = 35, Read length = 100, Max kmer coverage = 1000) (Vurture et al., 2017). len = inferred haploid genome length, uniq = percentage non-repetitive sequence, het = overall rate of genome heterozygosity, kcov = mean kmer coverage for heterozygous bases, err = error rate of the reads, dup: average rate of read duplications. These results are consistent with the genome size of a XO male, when possible systematic error of kmer spectral analysis and flow cytometry genome size estimates is considered. The heterozygosity is somewhat low when compared to some other arthropods.
Appendix 1—figure 7
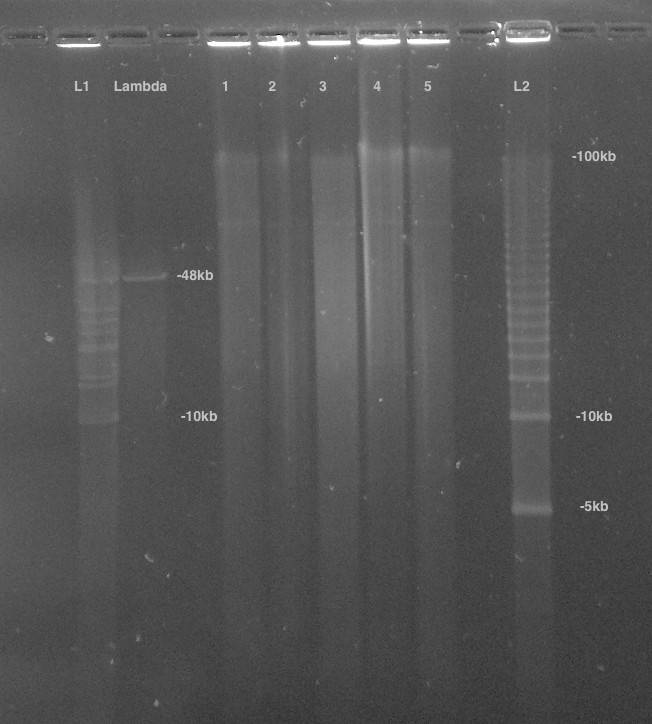
PFGE of P. pyralis HMW DNA used for PacBio sequencing.
Lane 1 was used for further library prep and sequencing, Lanes 2–5 represent separate batches of P. pyralis HMW DNA that was not used for PacBio sequencing. Lane 1 was used as it had the highest DNA yield, and an equivalent DNA size distribution to the other samples.
Appendix 1—figure 8
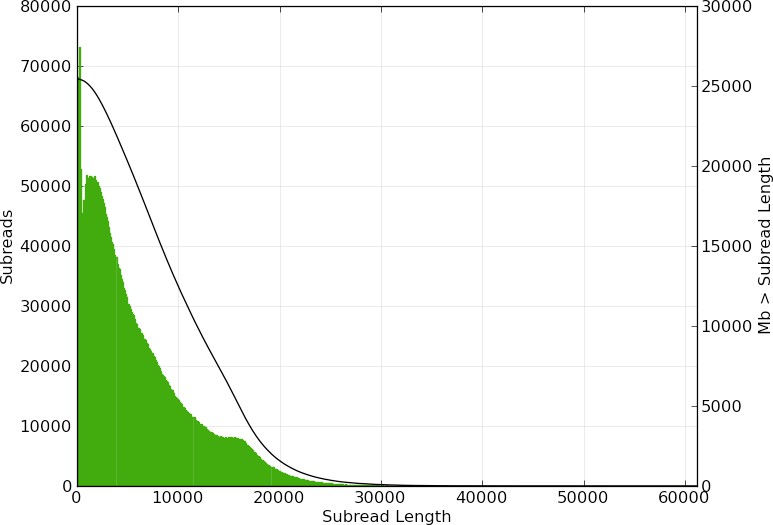
Subread length distribution for P. pyralis PacBio RSII sequencing.
Figure produced with SMRTPortal (v2.3.0.140936, Pacific Biosciences, 2017) by aligning all PacBio reads from data from the 61 SMRT cells against Ppyr1.3 using the RS_Resequencing.1 protocol with default parameters. Subread length unit is basepair (bp).
Appendix 1—figure 9
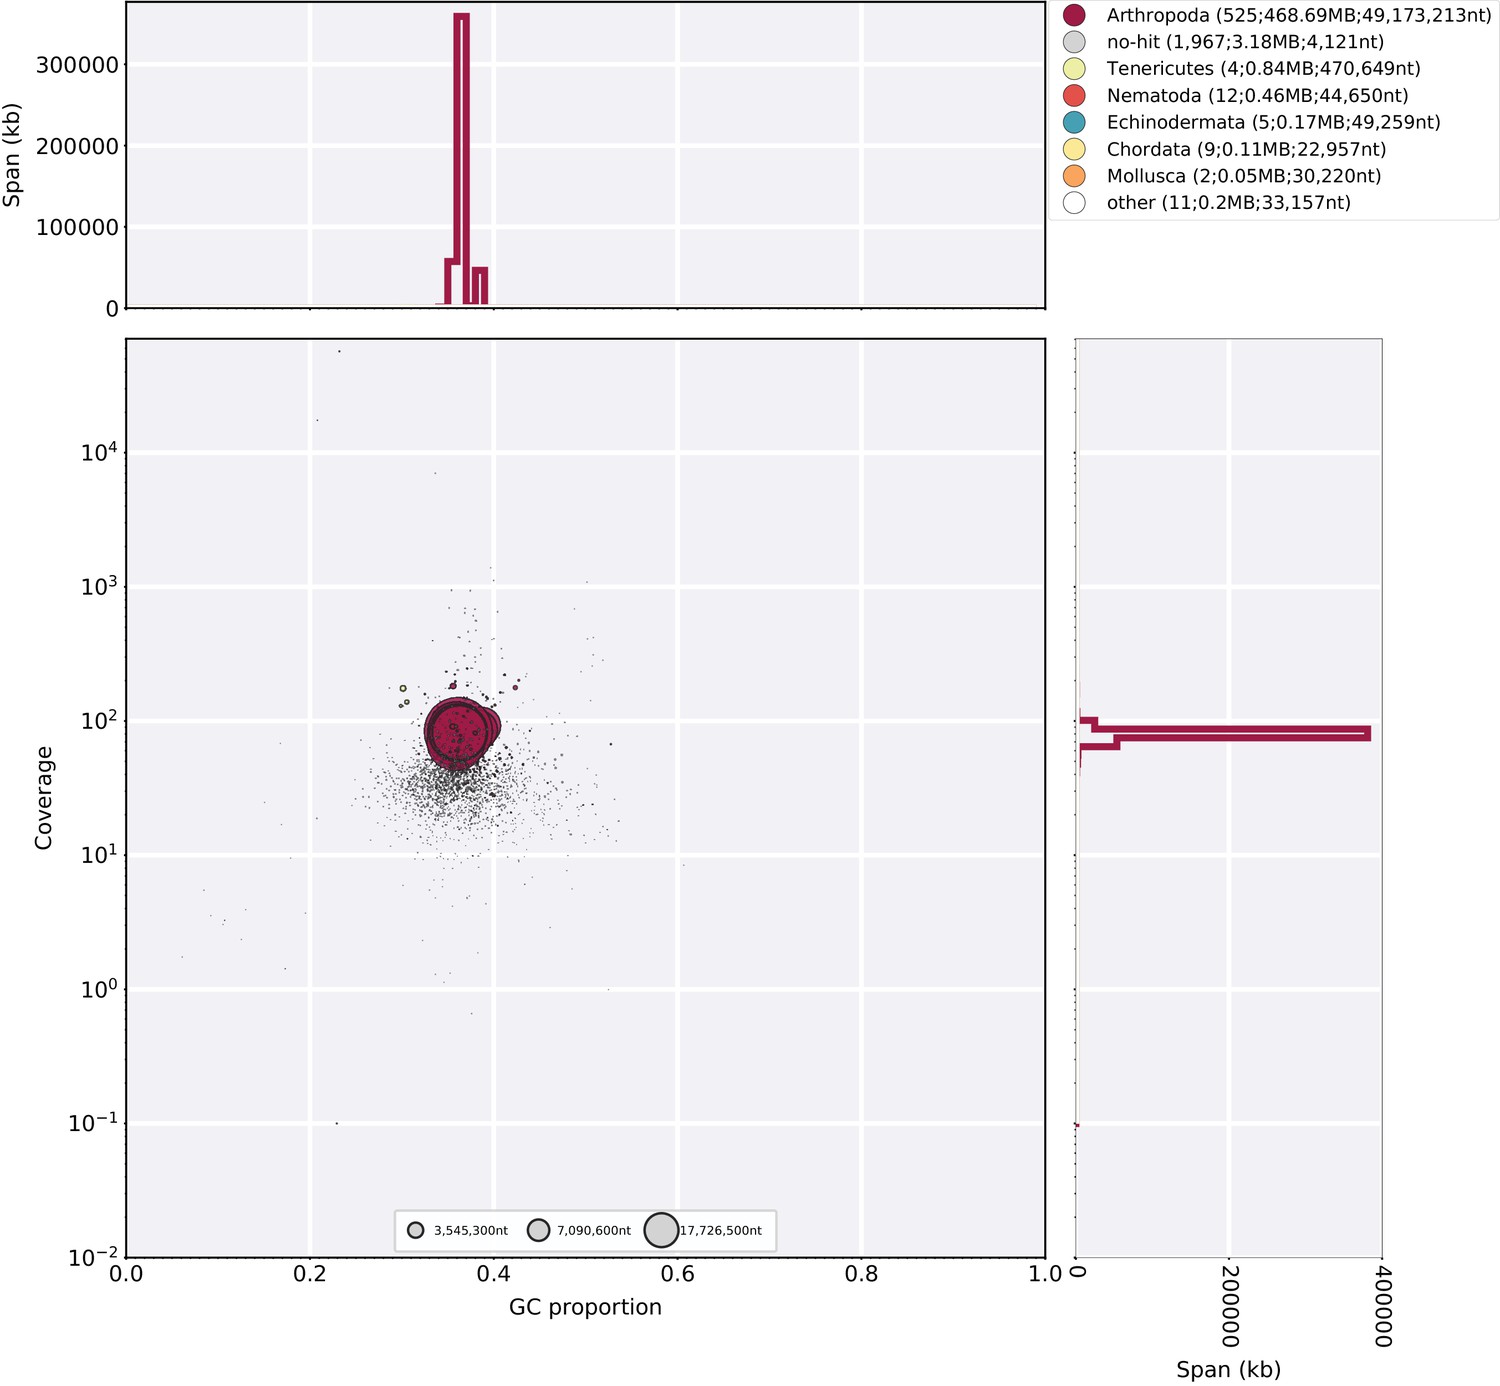
Blobplot of Illumina short-insert reads aligned against the Ppyr1.2 reference.
Coverage shown represents mean coverage of reads from the Illumina short-insert library (Sample name 8369; Appendix 4—table 1), aligned against Ppyr1.2 using Bowtie2 with parameters (--local). Scaffolds were taxonomically annotated as described in Appendix 1.6.4.2.
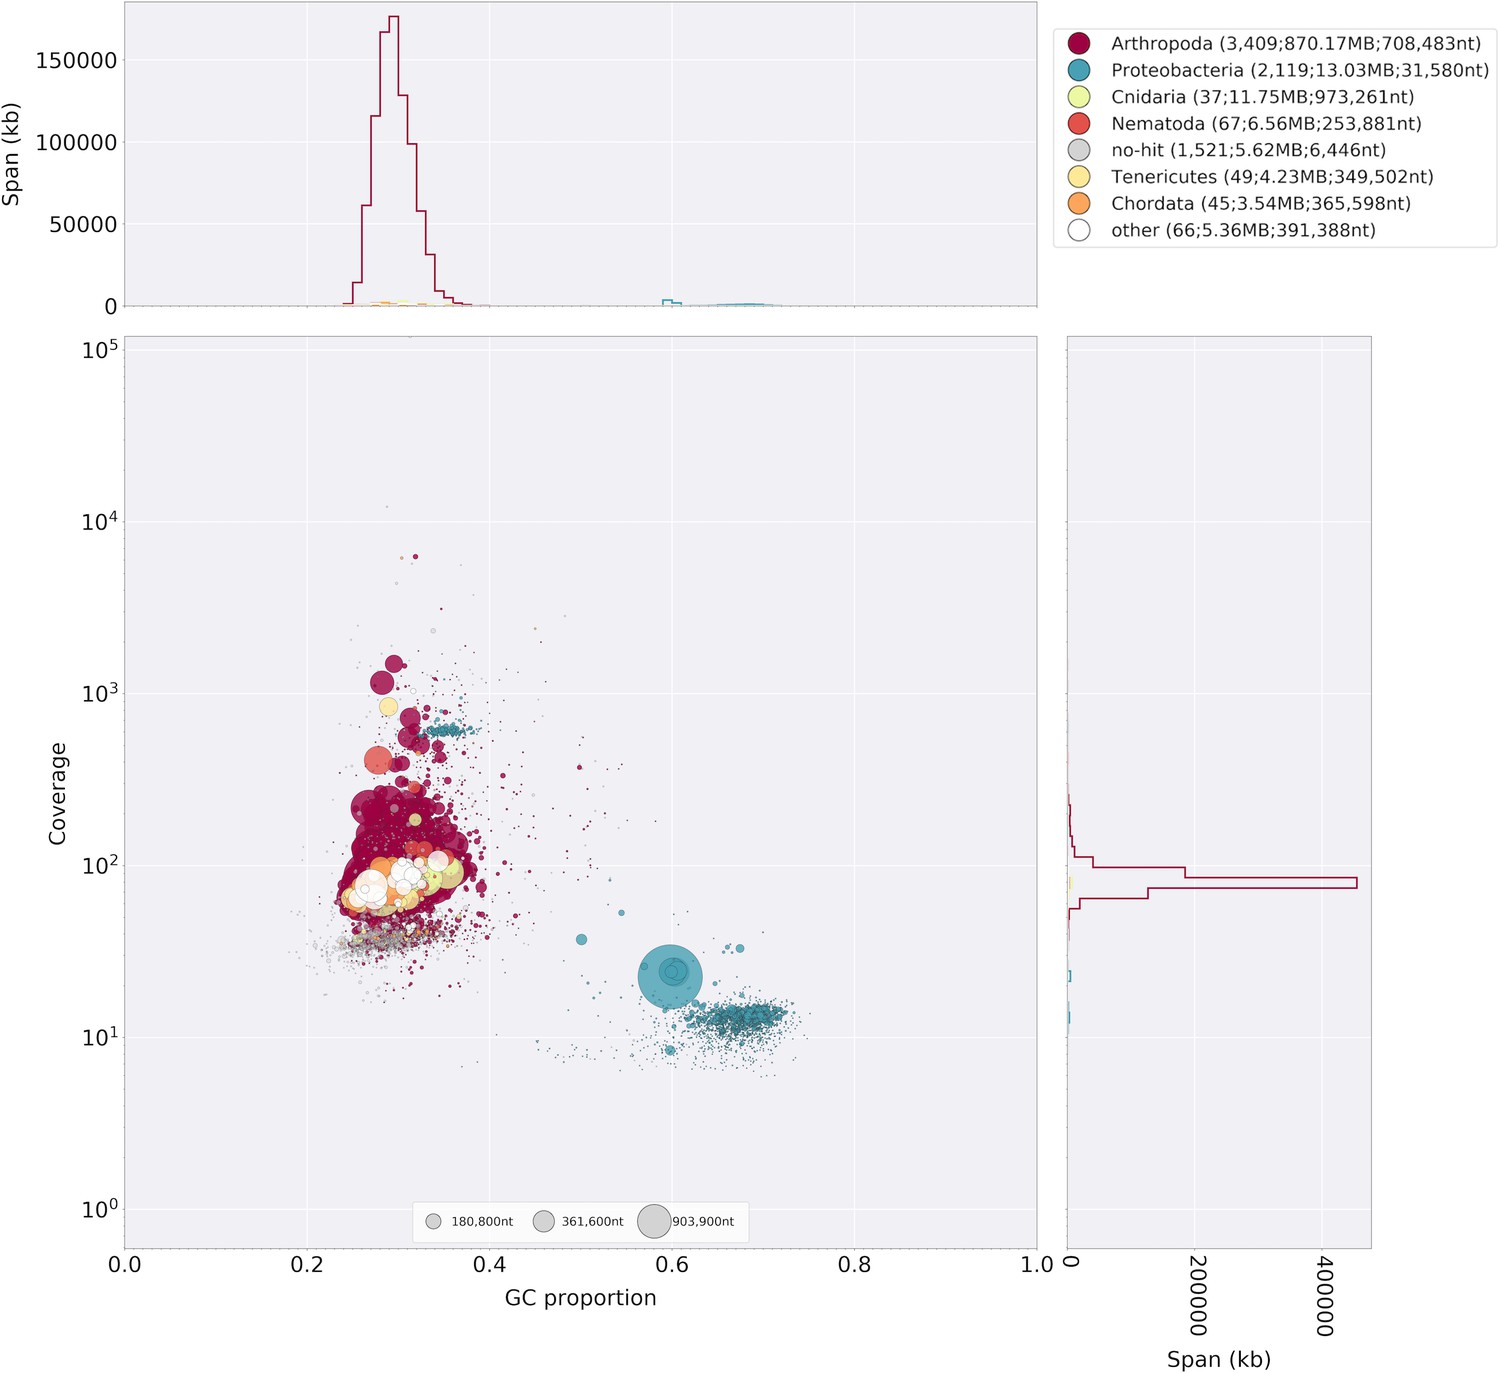
Appendix 1—figure 10
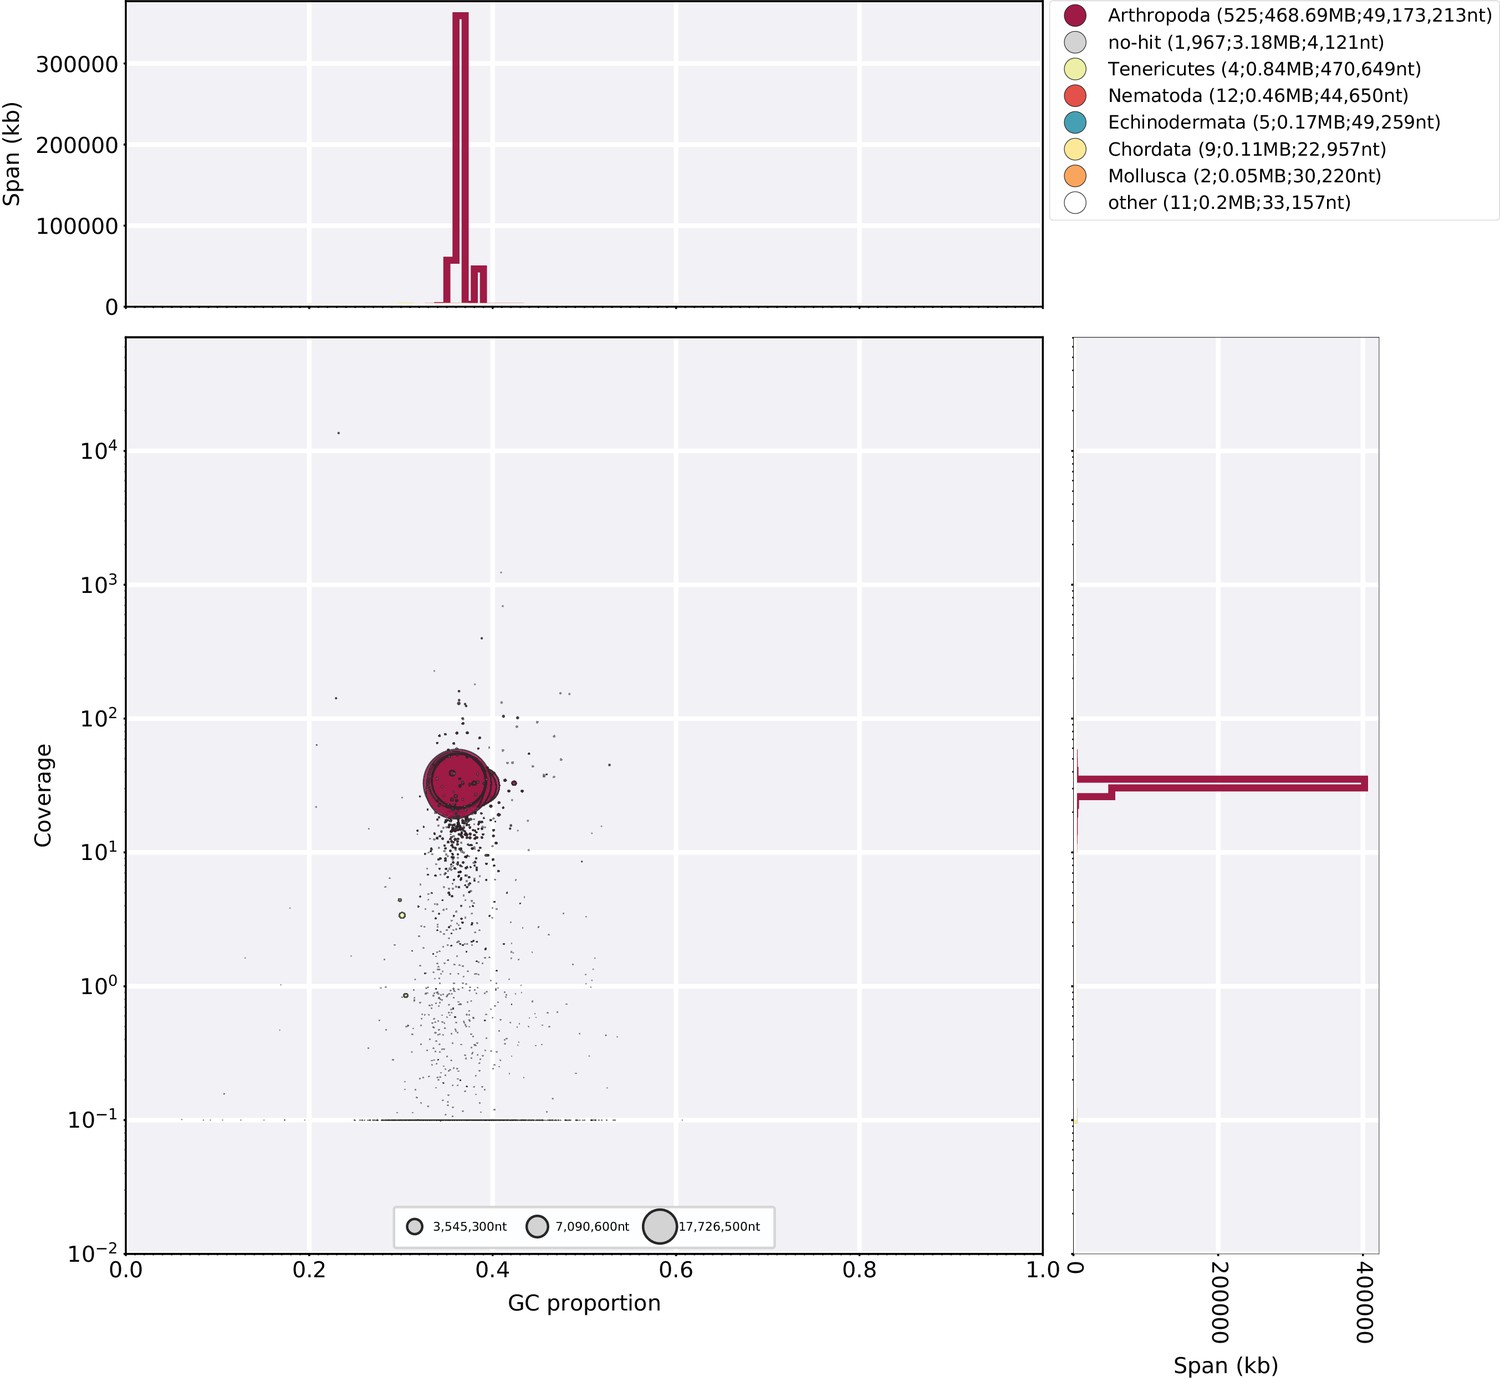
Blobplot of P. pyralis PacBio reads aligned against Ppyr1.2.
Coverage shows represents mean coverage of reads from the PacBio library (Sample name 1611; Appendix 4—table 1). The reads were aligned using SMRTPortal v2.3.0.140893 with the ‘RS_Resequencing.1’ protocol with default parameters. Scaffolds were taxonomically annotated as described in Appendix 1.6.4.2.
Appendix 1—figure 11
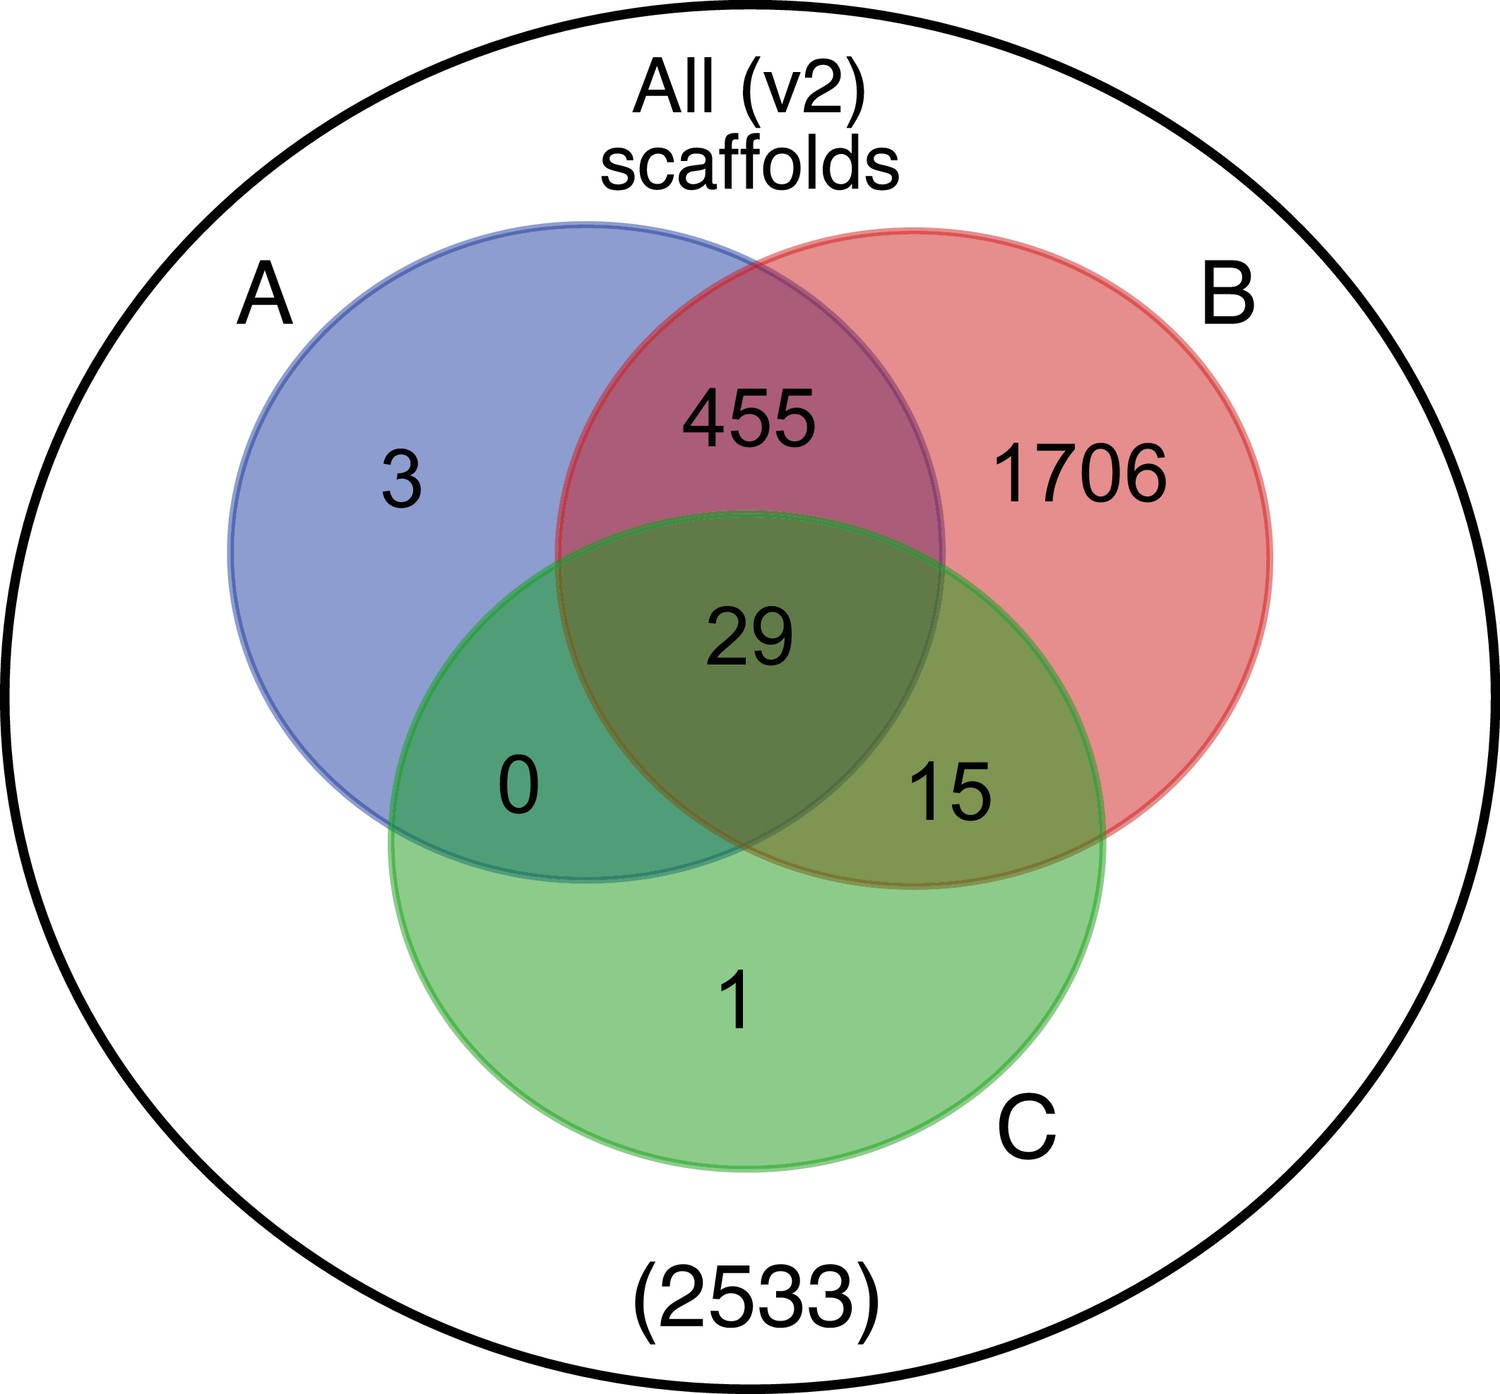
Venn diagram representation of blobtools taxonomic annotation filtering approach for Ppyr1.2 scaffolds.
(A) The blue set represents scaffolds which have >10.0 coverage in both Illumina and PacBio libraries. (B) The red set represents scaffolds which had either genes on repeats (non simple or low-complexity) annotated. (C) The green set represents scaffolds with suspicious taxonomic assignment (Non ‘Arthropod’ or ‘no-hit’). Outside A, B, and C, represents low-coverage, unannotated scaffolds. Ppyr1.3 consists of the intersection of A and B, minus the intersection of C. All linkage groups (LG1-LG10) were annotated as ‘Arthropod’ by blobtools, and captured in the intersection between A and B but not set C.
Appendix 1—figure 12
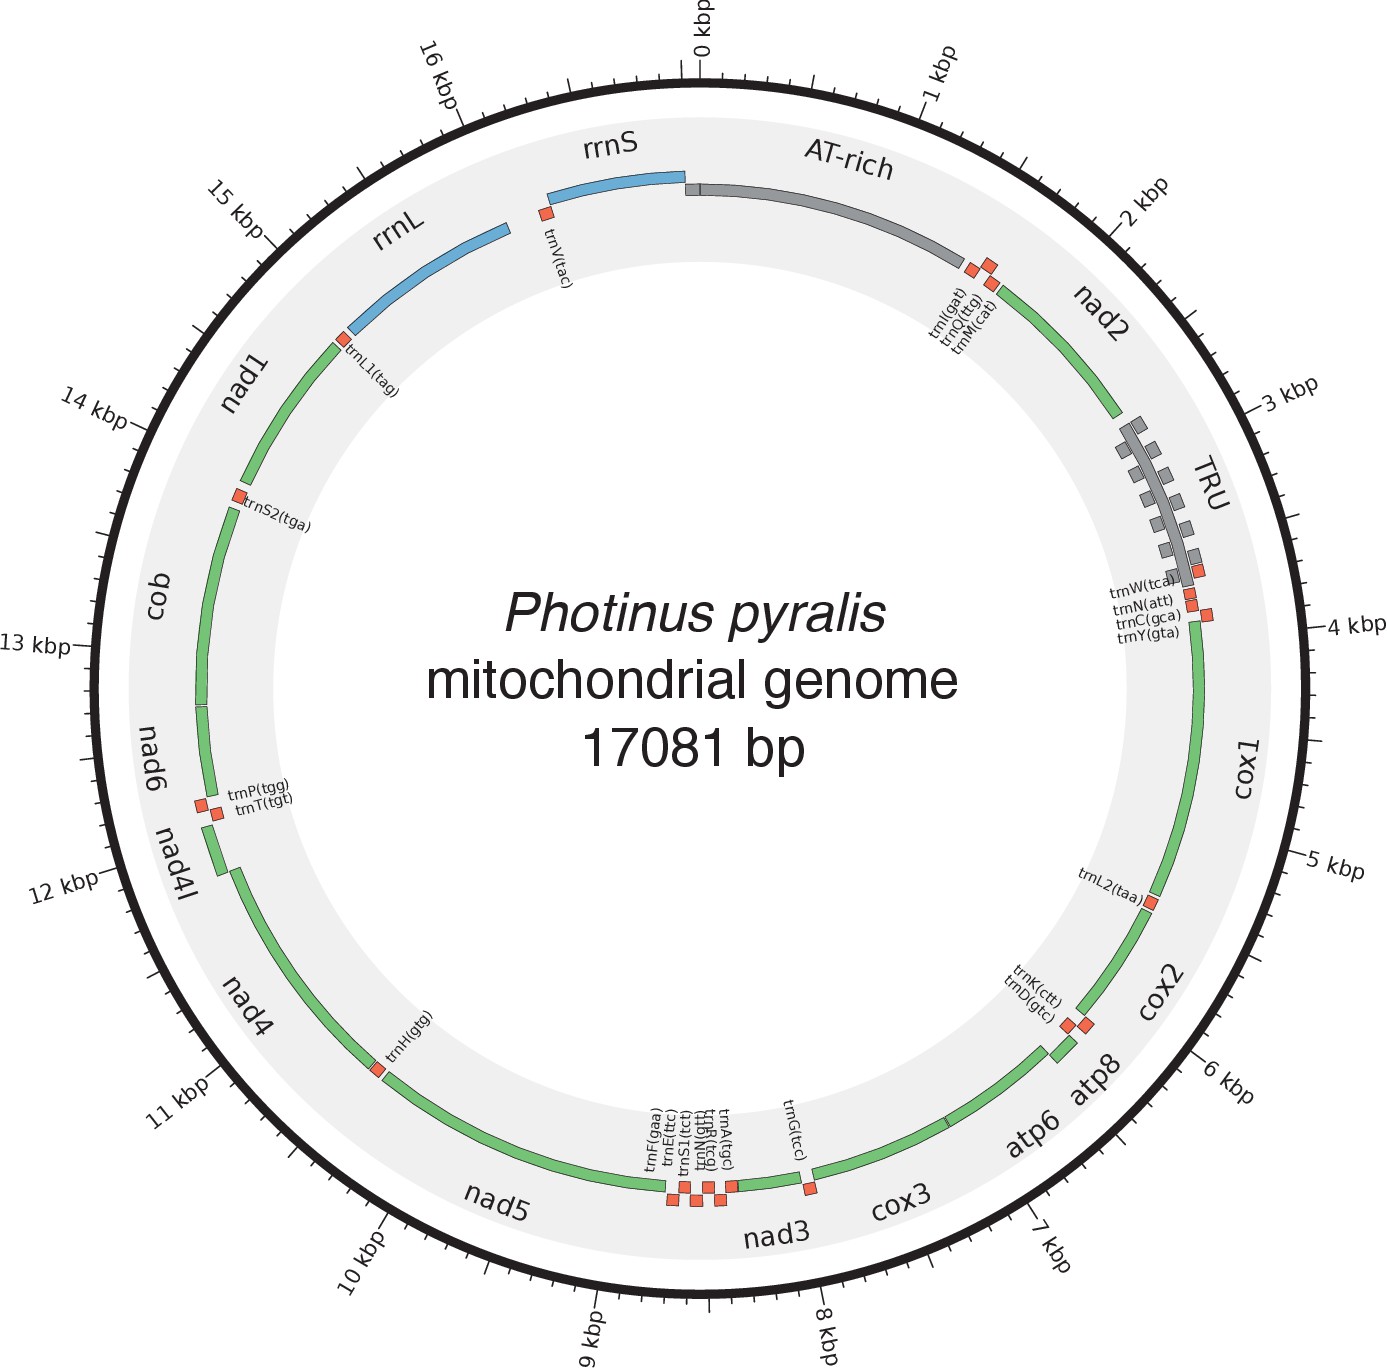
Mitochondrial genome of P. pyralis.
The mitochondrial genome of P. pyralis was assembled and annotated as described. Note the firefly specific tandem-repeat-unit (TRU) region. Figure produced with Circos (Krzywinski et al., 2009).
Appendix 1—figure 13
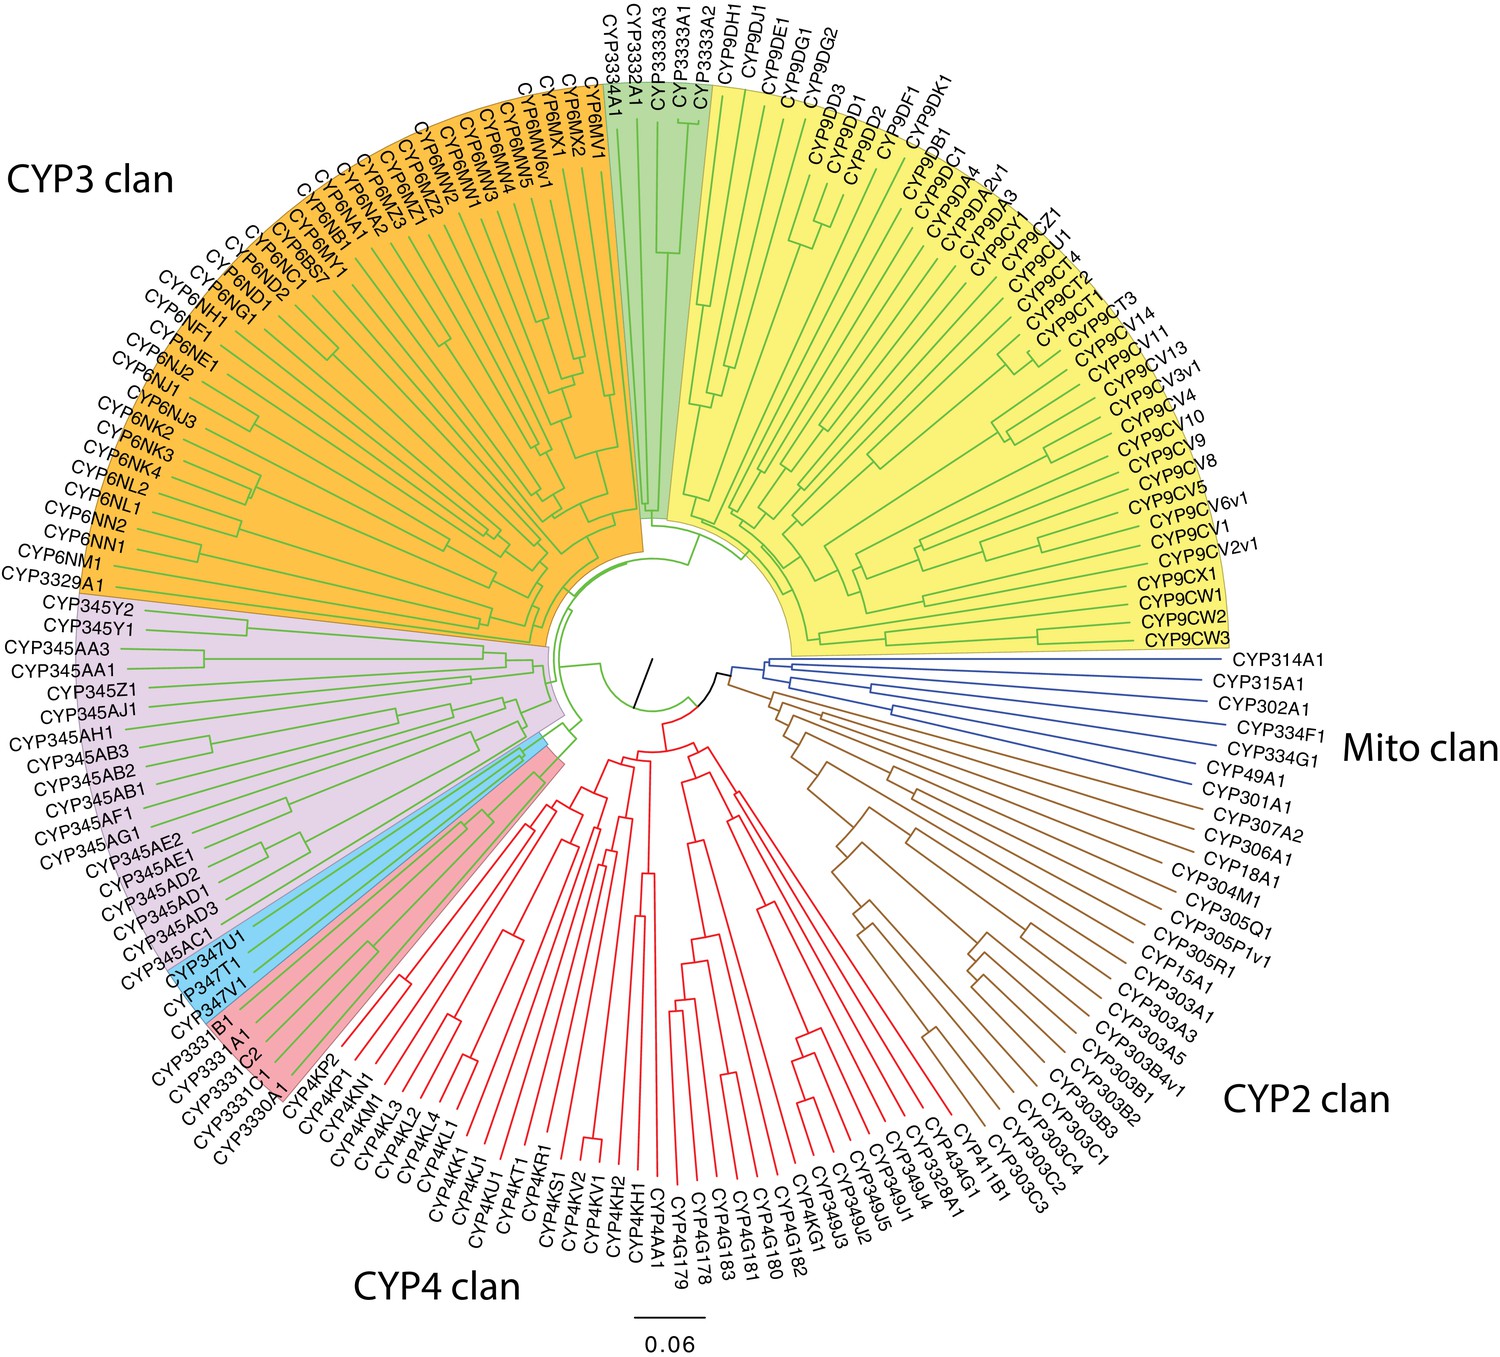
P. pyralis P450 gene phylogenetic tree.
Neighbor-joining phylogenetic tree of 165 cytochrome P450s from P. pyralis. Four pseudogenes and one short sequence were removed. The P450 clans have colored spokes (CYP2 clan brown, CYP3 clan green, CYP4 clan red, Mito clan blue). Shading highlights different families and family clusters within the CYP3 clan. The tree was made using Clustal Omega at EBI (European Bioinformatics Institute, 2017) with default settings. The resulting multiple sequence alignment is available on FigShare (DOI: 10.6084/m9.figshare.5697643). The tree was drawn with FigTree v1.3.1 using midpoint rooting.
Appendix 2—figure 1
Genome scope kmer analysis of the A. lateralis short-insert genomic library.
(A) Linear and (B) log plot of a kmer spectral genome composition analysis of the ‘FFGPE_PE200’ A. lateralis Illumina short-insert library (Appendix 2.5; Appendix 4—table 1) with jellyfish (v2.2.9; parameters: -C -k 35) (Marçais and Kingsford, 2011) and GenomeScope (v1.0; parameters: Kmer length = 35, Read length = 100, Max kmer coverage = 1000) (Vurture et al., 2017). len = inferred haploid genome length, uniq = percentage non-repetitive sequence, het = overall rate of genome heterozygosity, kcov = mean kmer coverage for heterozygous bases, err = error rate of the reads, dup: average rate of read duplications. These results are consistent when considering the possible systematic error of kmer spectral analysis and flow cytometry genome size estimates. The heterozygosity is lower than that measured for P. pyralis, possibly reflecting the long-term laboratory rearing in reduced population sizes of A. lateralis strain Ikeya-Y90.
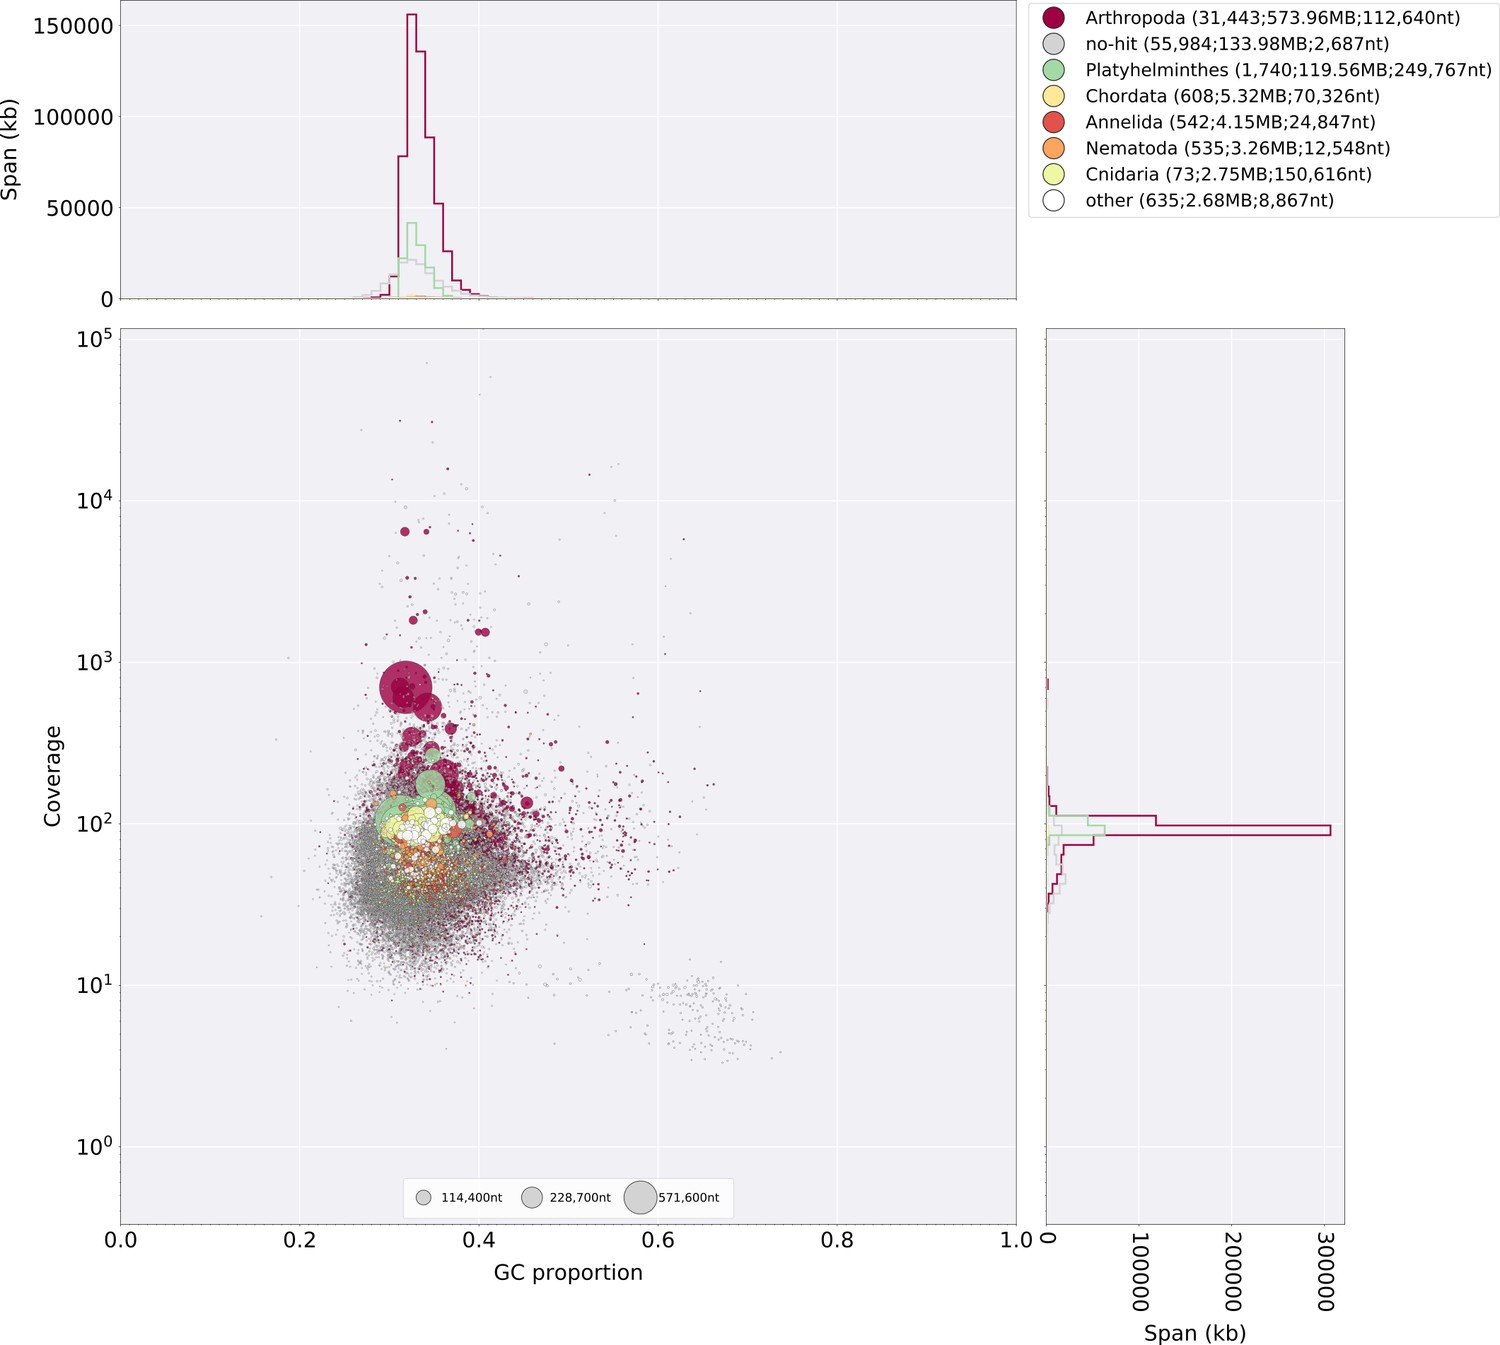
Appendix 2—figure 2
Blobplot of A. lateralis Illumina reads aligned against Alat1.2.
Coverage shown represents mean coverage of reads from the Illumina short-insert library (Sample name FFGPE_PE200; Appendix 4—table 1), aligned against Alat1.2 using Bowtie2. Scaffolds were taxonomically annotated as described in Appendix 2.5.2.
Appendix 3—figure 1
I. luminosus aedeagus (male genitalia).
(A) Dorsal and (B) ventral view of an Ignelater luminosus aedeagus, dissected from the same batch of specimens used for linked-read sequencing and genome assembly. The species identity of this specimen was confirmed as I. luminosus by comparison of the aedeagus to the keys of Costa and Rosa (Costa, 1975; Rosa, 2007; Rosa, 2010).
Appendix 3—figure 2
Genome scope kmer analysis of the I. luminosus linked-read genomic library.
(A) Linear and (B) log plot of a kmer spectral genome composition analysis of the ‘1610_IlumiHiSeqX’ I. luminosus Illumina linked-read library (Appendix 2.5; Appendix 4—table 1) with jellyfish (v2.2.9; parameters: -C -k 35) (Marçais and Kingsford, 2011) and GenomeScope (v1.0; parameters: Kmer length = 35, Read length = 138, Max kmer coverage = 1000) (Vurture et al., 2017). Before analysis, 10x Chromium barcodes were trimmed off Read1 using cutadapt (v1.8; parameters: -u 23) (Martin, 2011). vlen = inferred haploid genome length, uniq = percentage non-repetitive sequence, het = overall rate of genome heterozygosity, kcov = mean kmer coverage for heterozygous bases, err = error rate of the reads, dup: average rate of read duplications. These results are consistent when considering the possible systematic error of kmer spectral analysis and flow cytometry genome size estimates. The heterozygosity is higher than that measured for P. pyralis and A. lateralis. The read error rate for this library is also significantly higher than the P. pyralis and A. lateralis results, possibly highlighting the difference in raw read error rate between HiSeq2500 and HiSeqX sequencing, or is possibly an artifact of the Chromium library.
Appendix 3—figure 3
Blobtools plot of Ilumi1.0.
Coverage shown represents mean coverage of reads from the HiSeqX Chromium library sequencing (Sample name 1610_IlumiHiSeqX; Appendix 4—table 1), aligned against Ilumi1.0 using Bowtie2 with parameters (--local). Scaffolds were taxonomically annotated as described in Appendix 3.5.2.
Appendix 3—figure 4
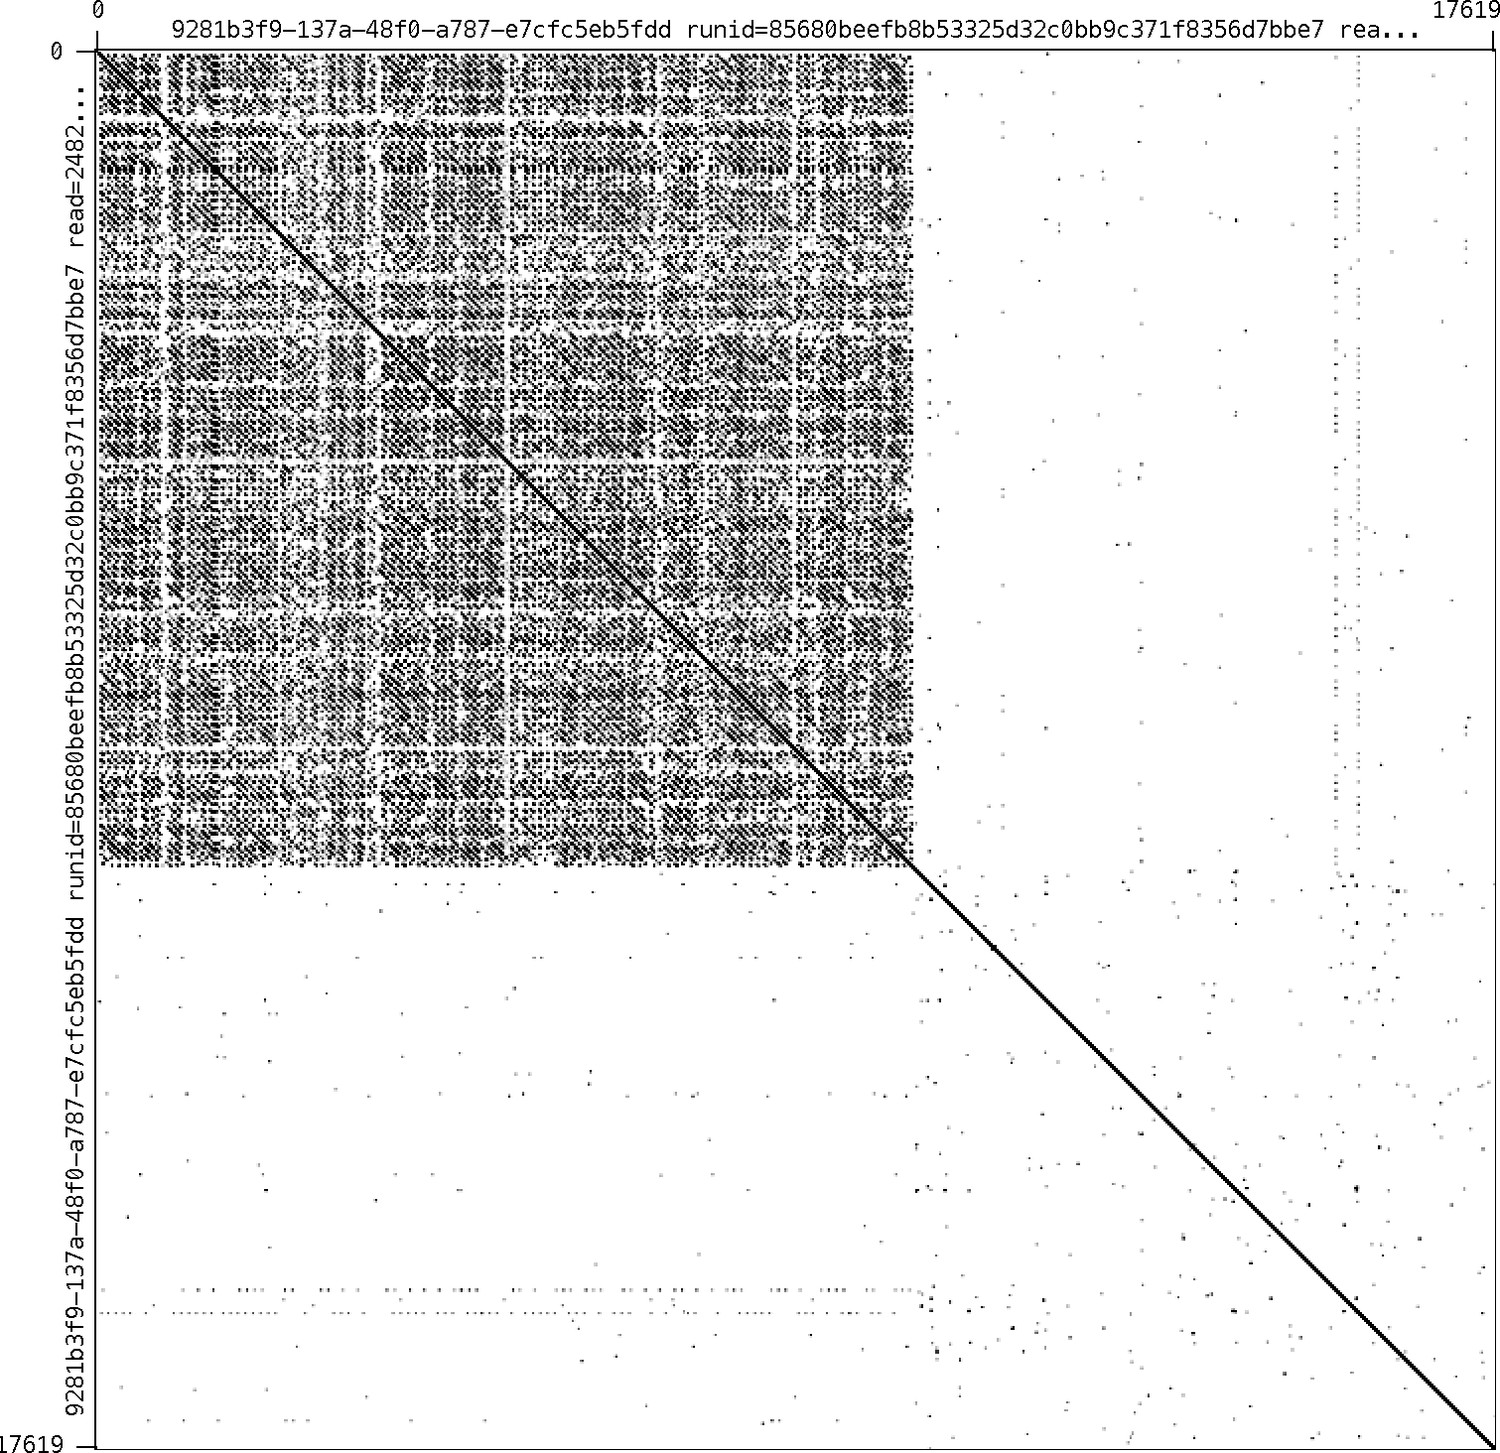
Self alignment of the Ilumi1.1_Scaffold13255 right-edge extending long MinION read.
Alignment performed in in Gepard (Krumsiek et al., 2007). Note the large (10 kbp+) tandem repetitive region.
Appendix 3—figure 5
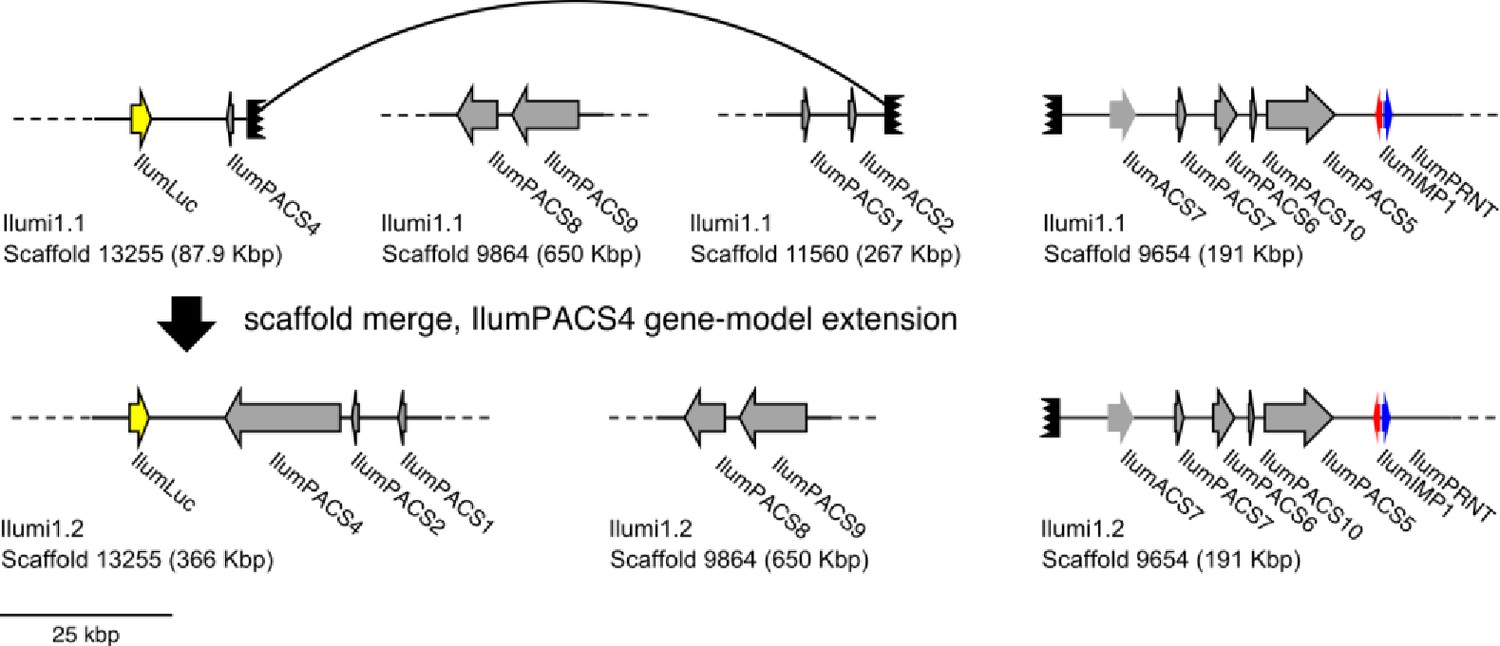
Diagram of manual scaffold merges between Ilumi1.1 and Ilumi1.2.
Diagram of the manual merge of Ilumi1.1_Scaffold13255 with Ilumi1.1_Scaffold11560 between I. luminosus genome assembly versions Ilumi1.1 and Ilumi1.2. This merge was supported by: (1) The putative missing first exon of IlumPACS4 being present on the right edge of Ilumi1.2_Scaffold11560. (2) The right edge of Ilumi1.1_Scaffold13255, and the right edge of Ilumi1.1_Scaffold11560, having anti-parallel versions of a homologous complex tandem repeat. See Figure 3 in the maintext for explanation of presented genes.
Appendix 3—figure 6

Mitochondrial genome of I. luminosus.
The mitochondrial genome of I. luminosus was assembled and annotated as described. in the Appendix 3.10. Figure produced with Circos (Krzywinski et al., 2009).
Appendix 4—figure 1
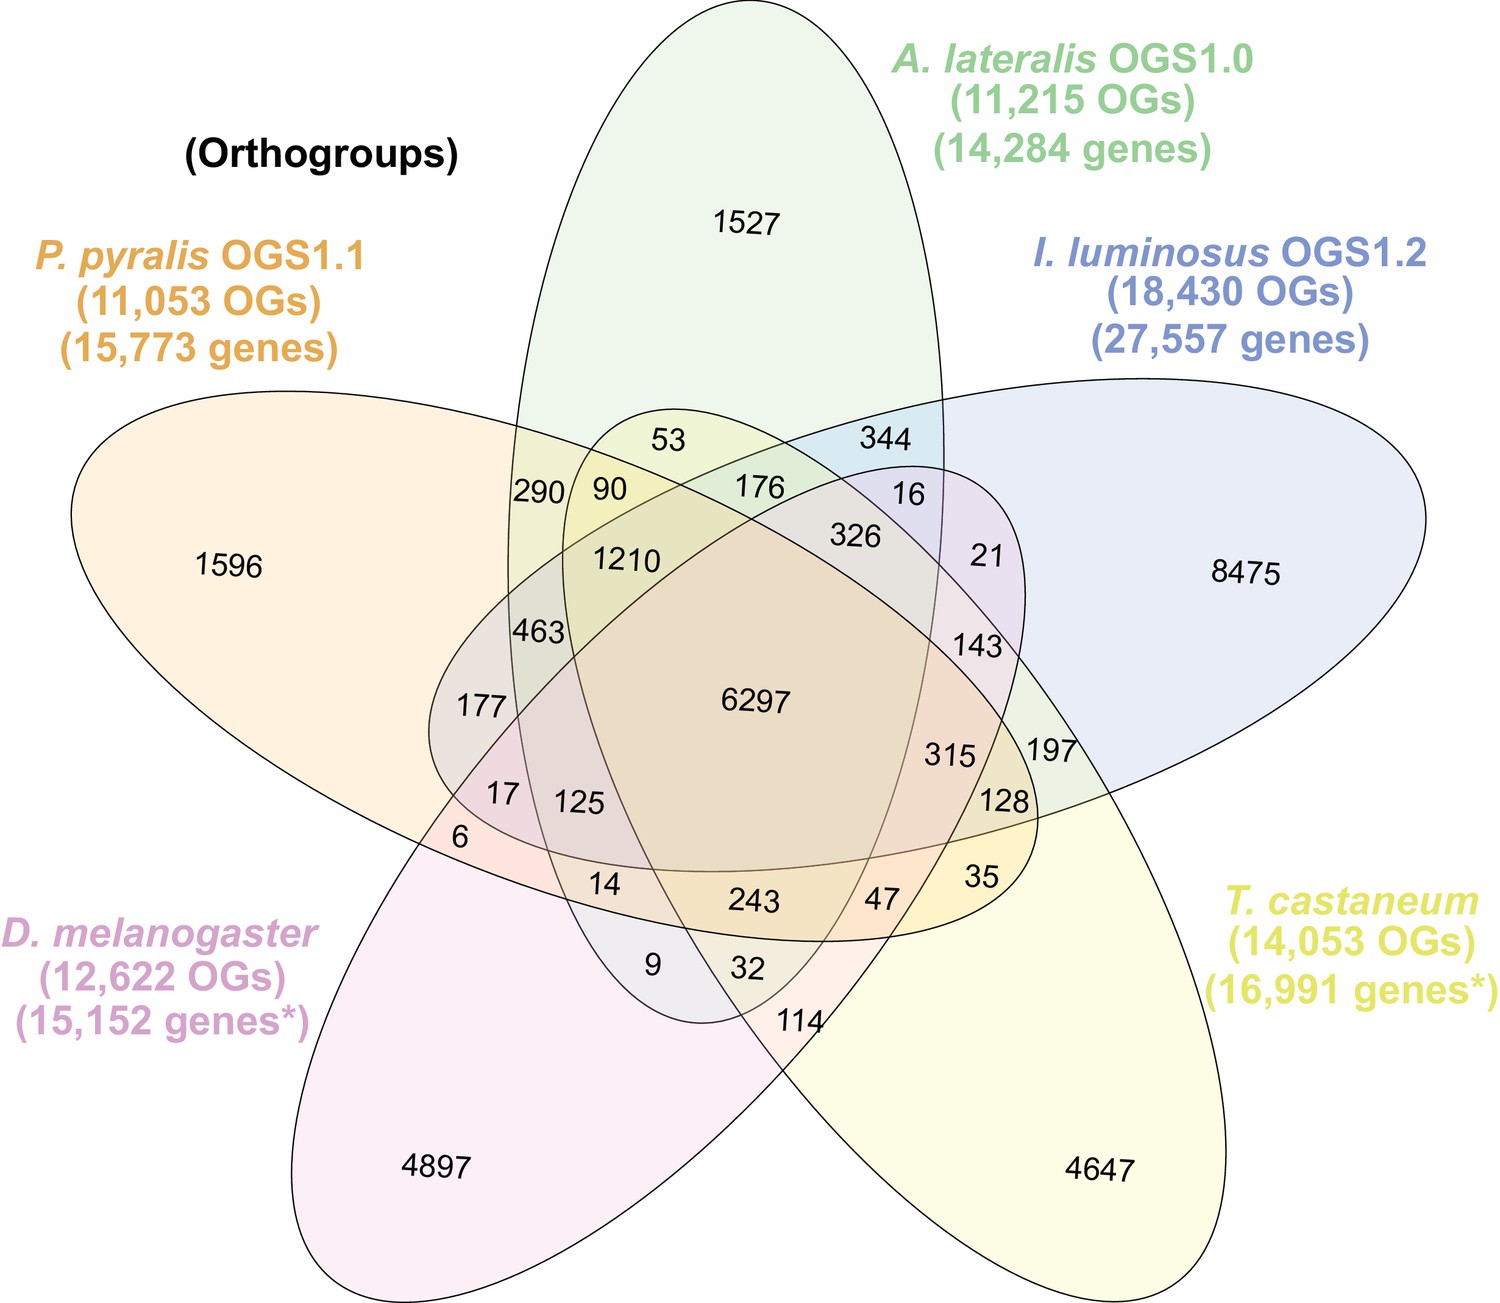
Venn diagram of P. pyralis, A. lateralis, I. luminosus, T. castaneum, and D. melanogaster orthogroup relationships.
Orthogroups were calculated between the PPYR_OGS1.1, AQULA_OGS1.0, ILUMI_OGS1.2, genesets, and the T. casteneum and D. melanogaster filtered Uniprot reference proteomes using OrthoFinder(Emms and Kelly, 2015). See Appendix 4.2.1 for description of clustering method. OGs = Orthogroups, OGS = Official gene set, *=Not completely filtered to single peptide per gene. Figure produced with InteractiVenn (Heberle et al., 2015). Intermediate scripts and species specific overlaps are available as Figure 2—source data 1.
Appendix 4—figure 2
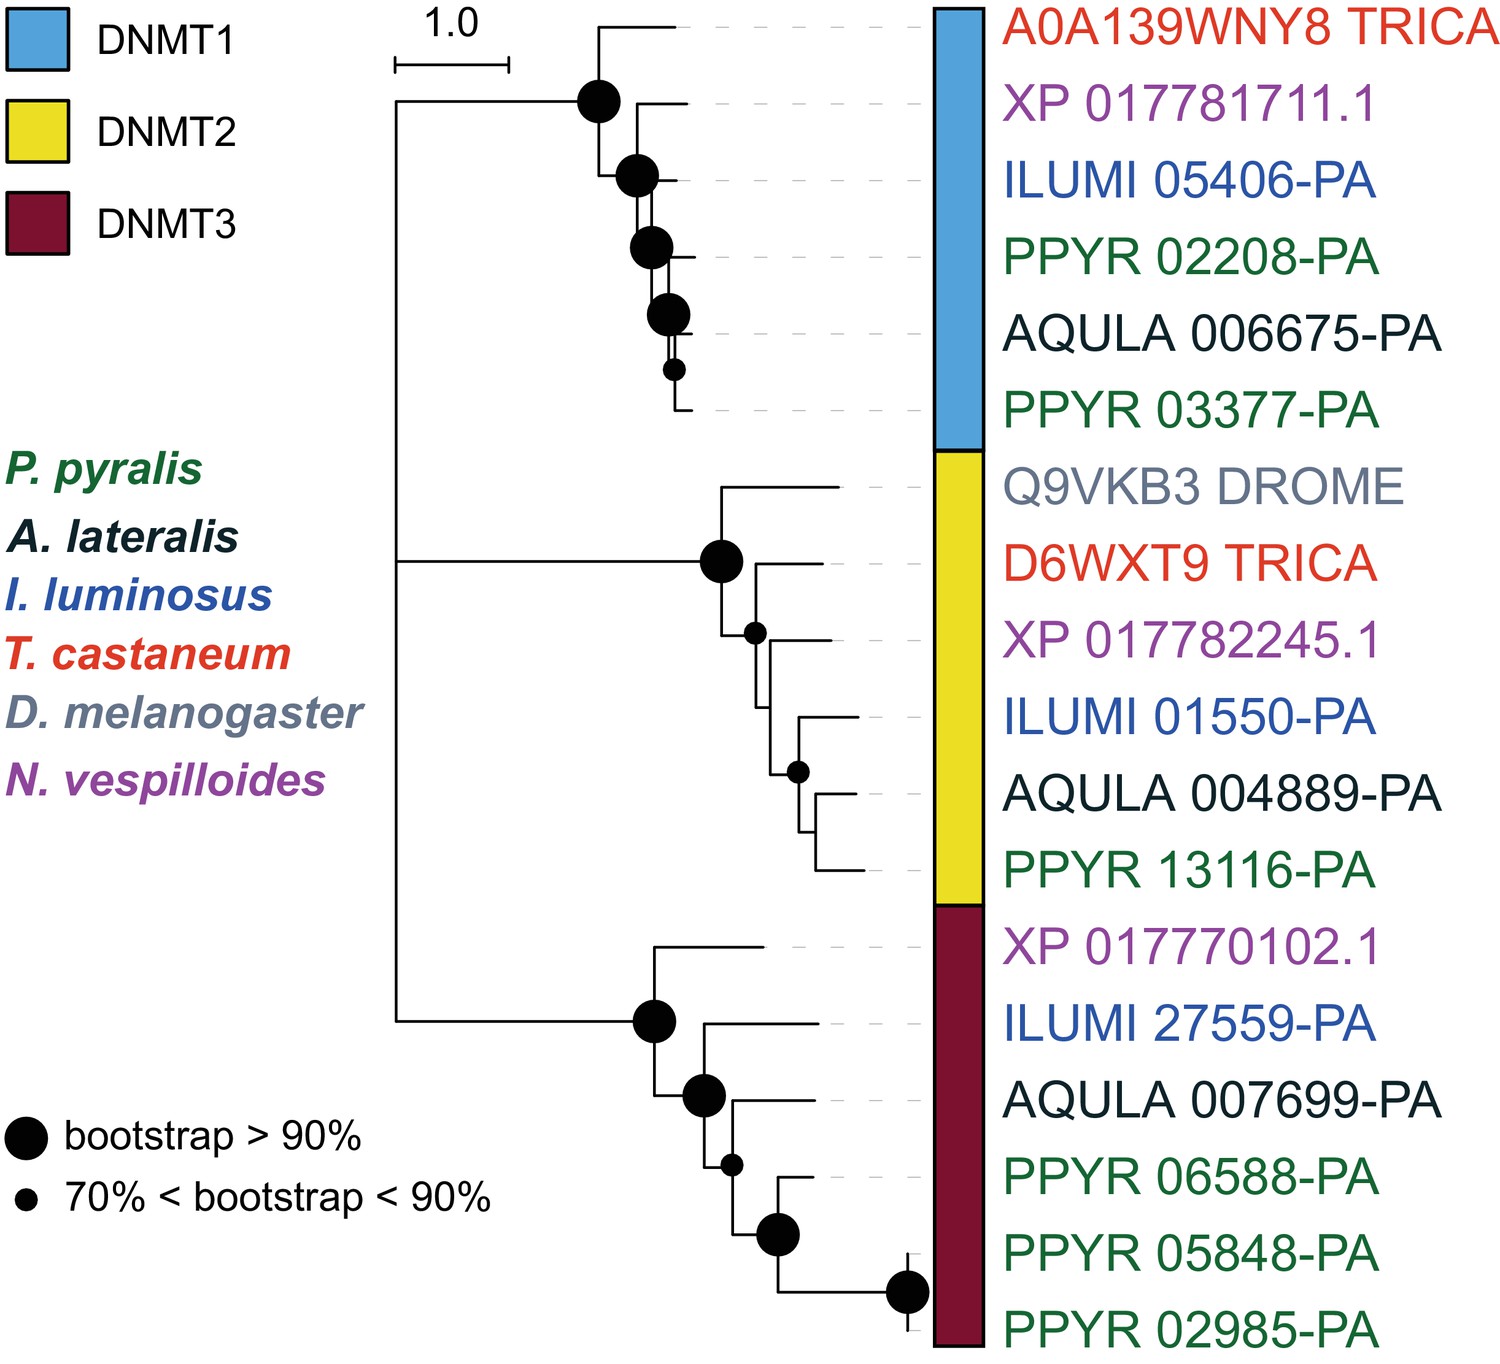
DNA and tRNA methyltransferase gene phylogeny.
Levels and patterns of mCG in P. pyralis are corroborated by the presence of de novo and maintenance DNMTs (DNMT3 and DNMT1, respectively). Notably, P. pyralis possesses two copies of DNMT1, and 3 copies of DNMT3, in contrast to a single copy of DNMT1 and DNMT3 in the firefly Aquatica lateralis. The evolutionary history was inferred by using the Maximum Likelihood method with the LG + G (five gamma categories) (Le and Gascuel, 2008). Evolutionary analyses were conducted in MEGA7 (Kumar et al., 2016). Size of circles at nodes corresponds to bootstrap support (100 bootstrap replicates). Branch lengths are in amino acid substitutions per site. T. castaneum = Tribolium castaneum, D. melanogaster = Drosophila melanogaster, N. vespilloides = Nicrophorus vespilloides. The multiple sequence alignment and phylogenetic topology are available on FigShare (10.6084/m9.figshare.6531311).
Appendix 4—figure 3
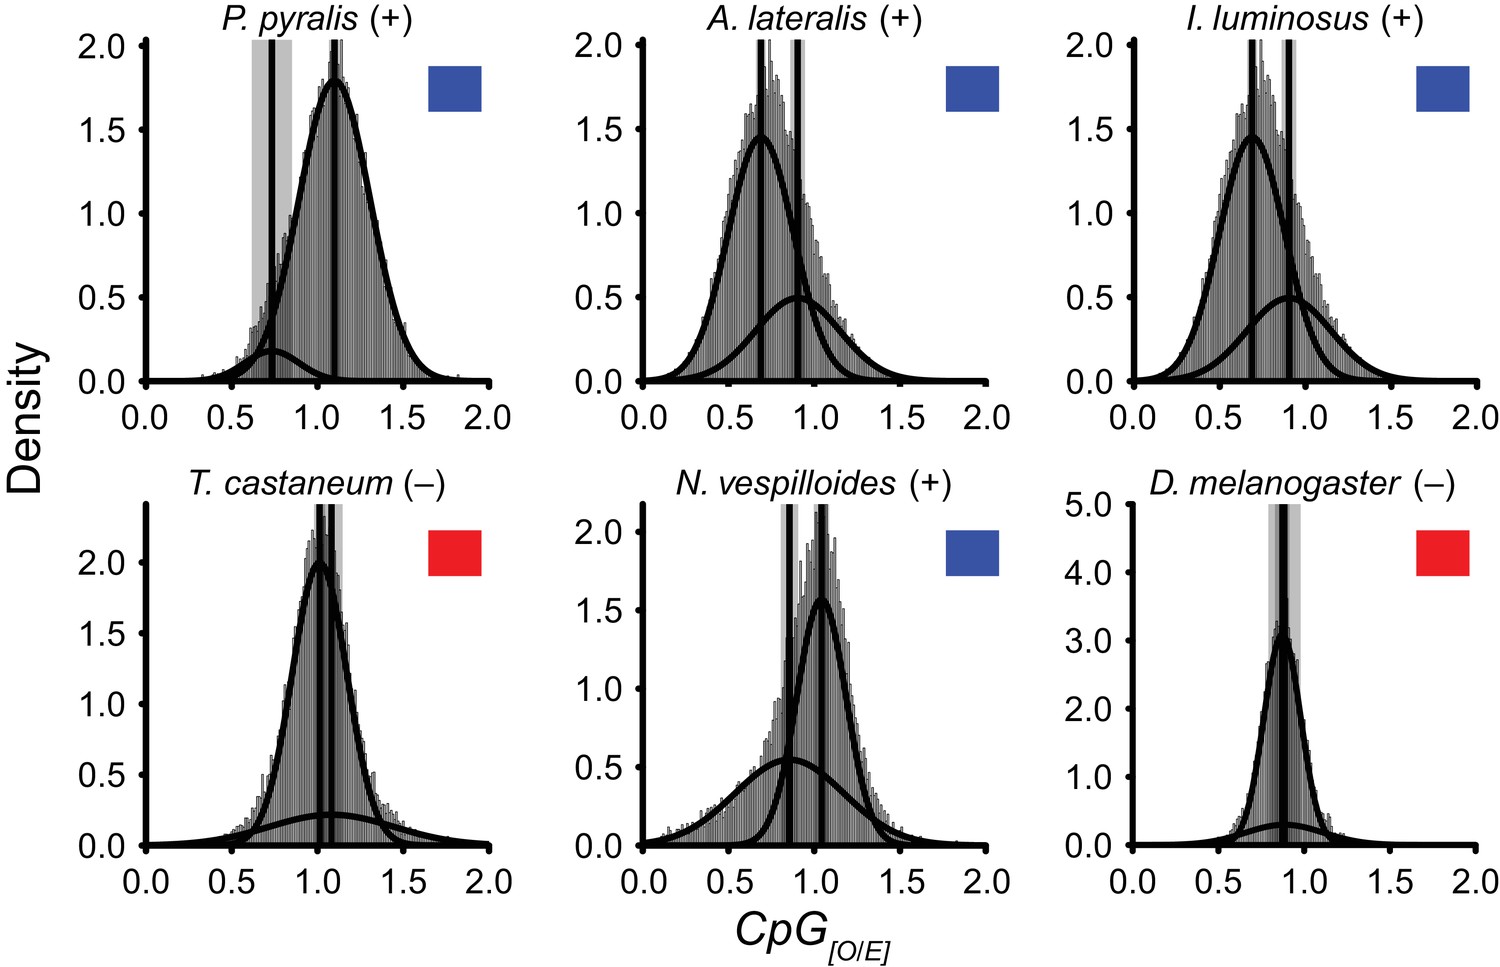
Detection of DNA methylation using CpG[O/E].
https://doi.org/10.7554/eLife.36495.057
Appendix 4—figure 4

Intron-exon structure of beetle luciferases.
(A) Intron-exon structure of P. pyralis and A. lateralis Luc1 and Luc2 from Ppyr1.3 and Alat1.3, and IlumLuc from Ilumi1.2. Between fireflies and click-beetles, the structure of the luciferase genes are globally similar, with seven exons, similar intron lengths, and identical splice junction locations (Appendix 4—figure 5). The intron-exon structure of IlumLuc is consistent with the reported intron-exon structure of Pyrophorus plagiophthalamus luciferase (Velez and Feder, 2006).
Appendix 4—figure 5
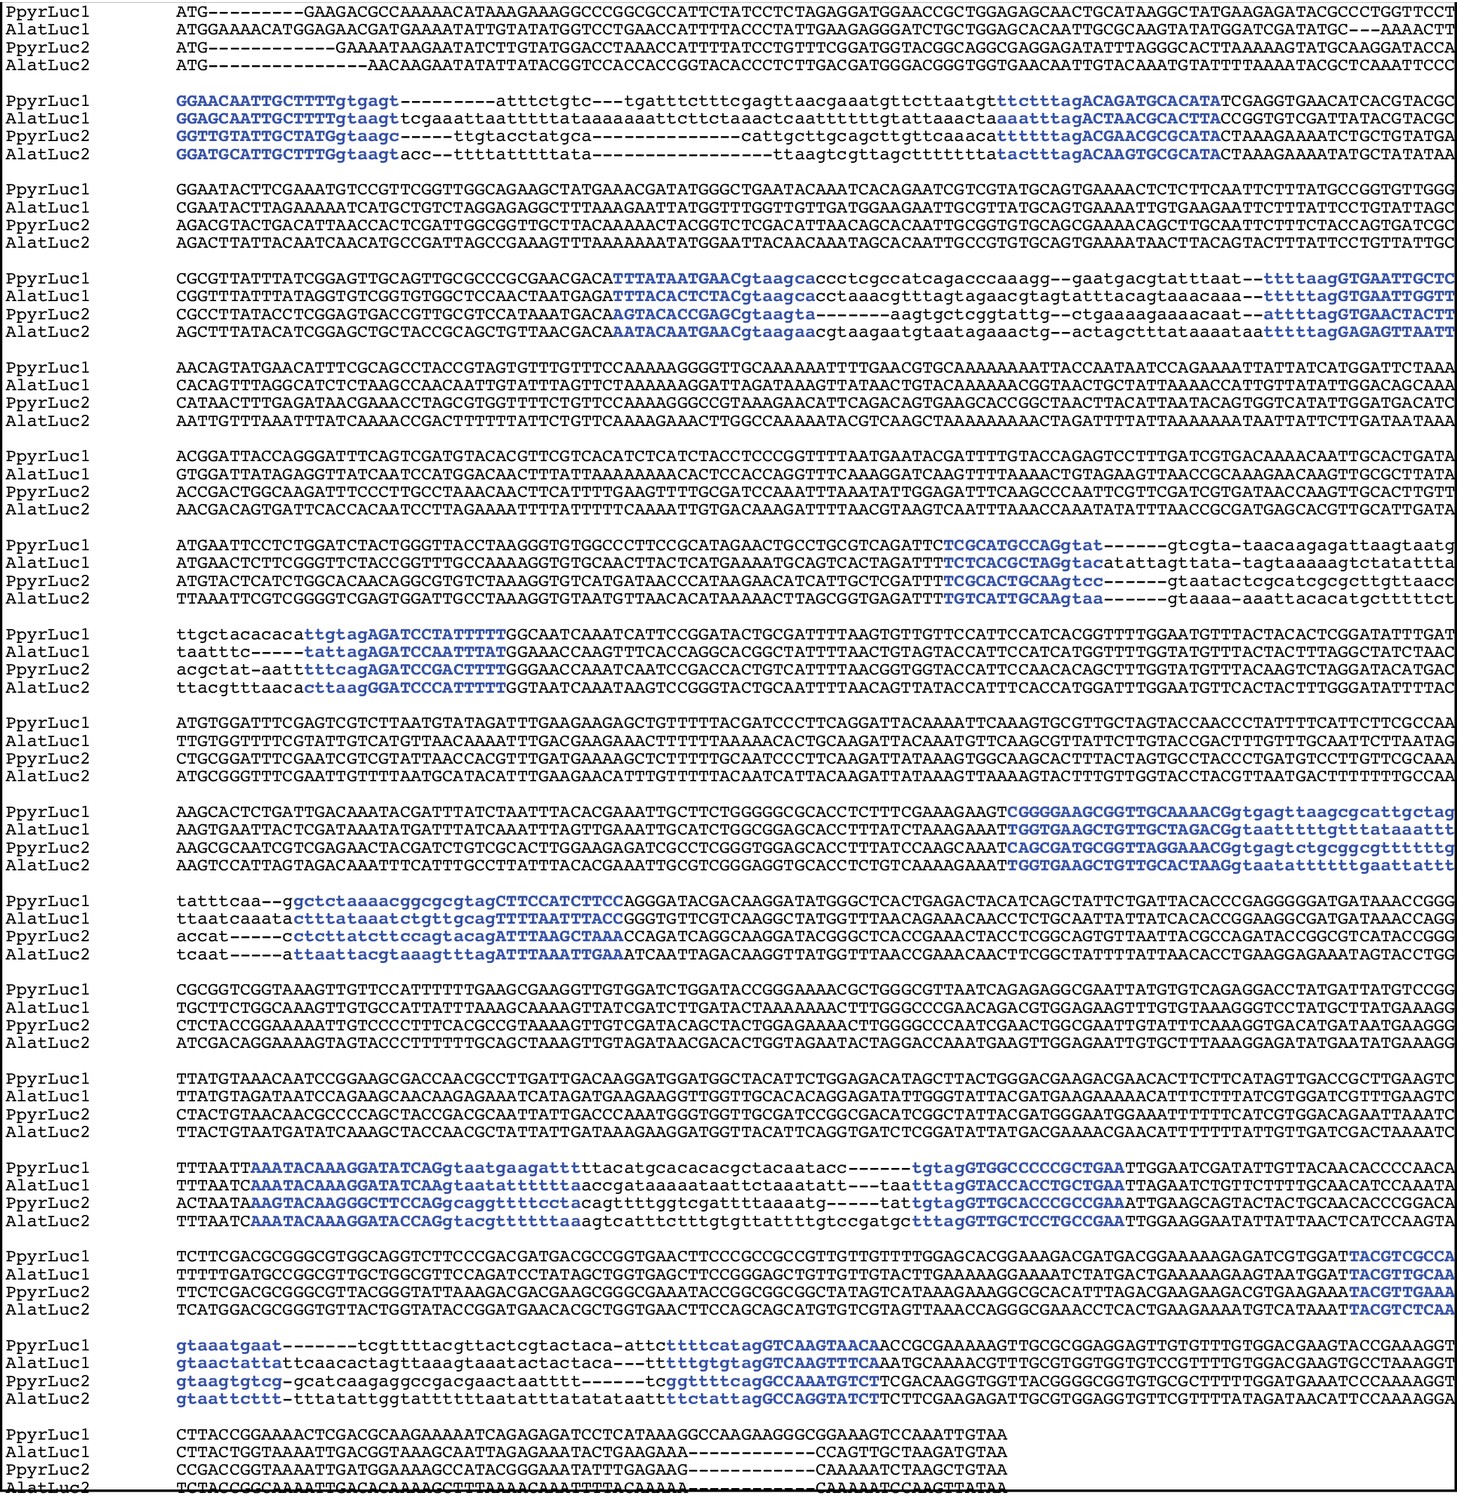
Multiple sequence alignment of firefly luciferase genes.
MAFFT (Katoh and Standley, 2013) L-INS-i multiple sequence alignment of luciferase gene nucleotide sequences from PpyrOGS1.1 and AlatOGS1.0 demonstrates the location of intron-exon junctions (bolded blue text) is completely conserved amongst the four luciferases. Exonic sequence is capitalized, whereas intronic sequence is lowercase.
Appendix 4—figure 6
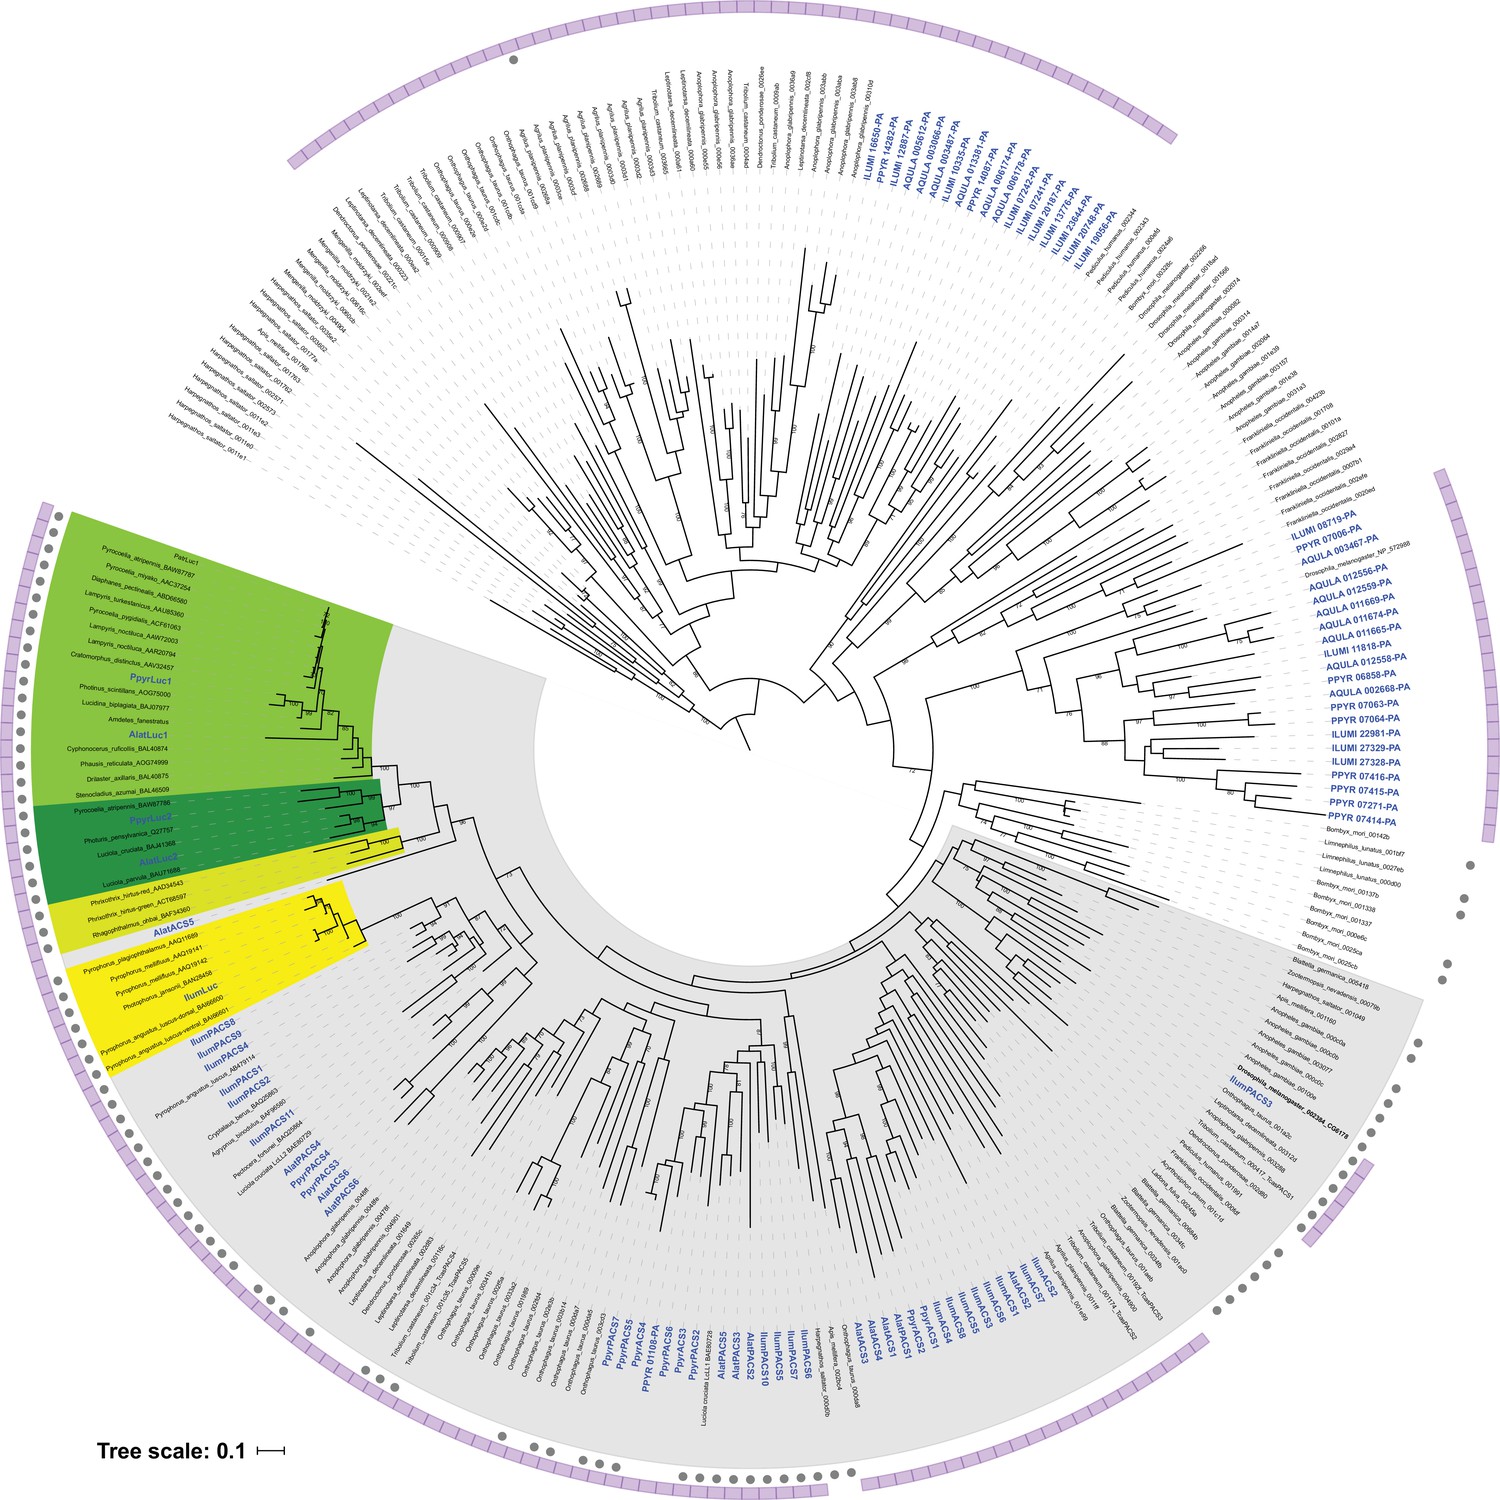
Preliminary maximum likelihood phylogeny of luciferase homologs.
A preliminary maximum likelihood tree was reconstructed from a 385 amino acid multiple sequence alignment, generated via a BLASTP and orthoDB search using P. pyralis luciferase as query (e-value: 1.0 × 10−60). Members of the clade that includes both known firefly luciferase and CG6178 of D. melanogaster (bold) are defined as luciferase co-orthologous genes (highlighted in gray), and were selected and used for the independent maximum likelihood analysis in Figure 3C (Appendix 4.3.2). Branch length represents substitutions per site. Genes found from this study are indicated in blue. Lampyridae Luc1-type and Luc2-type luciferases are highlighted in yellow-green and green. Rhagophthalmidae and Phengodidae luciferases are highlighted in lime-green. Elateridae luciferases are highlighted in yellow. Genbank accession numbers of luciferase orthologs genes are indicated after the species name. OrthoDB taxon and protein IDs of luciferase co-orthologs are indicated after species name. Bootstrap values are indicated on the nodes. The genes from Coleoptera are indicated as purple strip. Grey closed circles indicate genes that have PTS1.
Appendix 4—figure 7
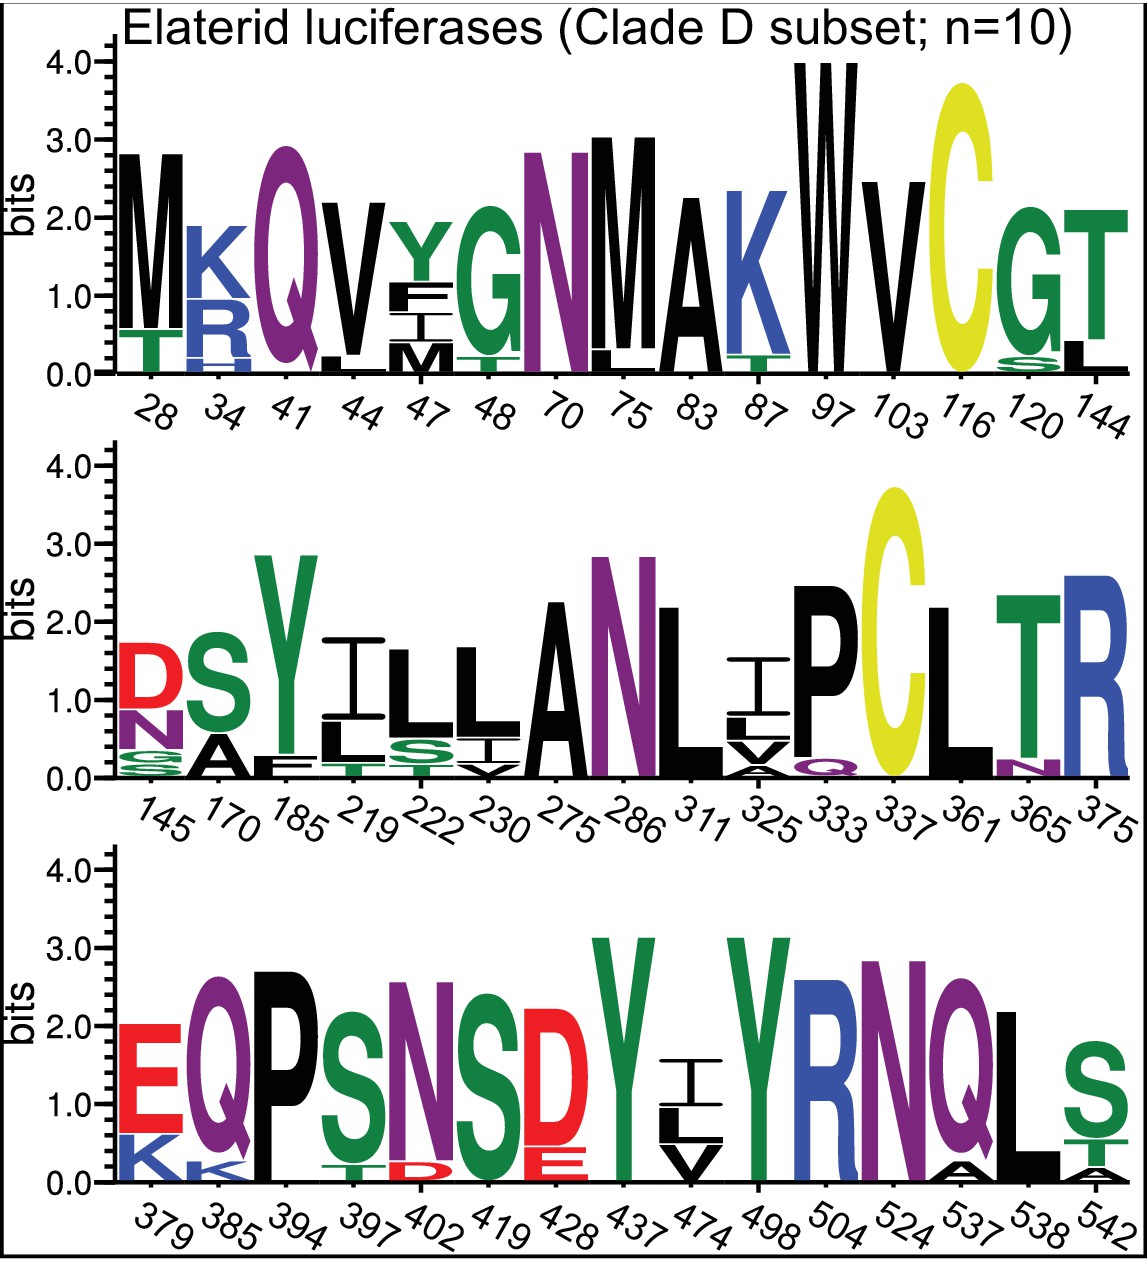
Amino acid variation at sites recovered in selection analysis.
Amino acid variation of extant Elaterid luciferases (Clade D ‘Eluc’ subset; Figure 3) at all sites recovered via both the MEME and PAML-BEB selection analysis (Appendix 4—table 5). Site numbering relative to IlumLuc. Figure produced with seqkit (Shen et al., 2016) and WebLogo(v3.6.0) (Crooks et al., 2004).
Appendix 4—figure 8
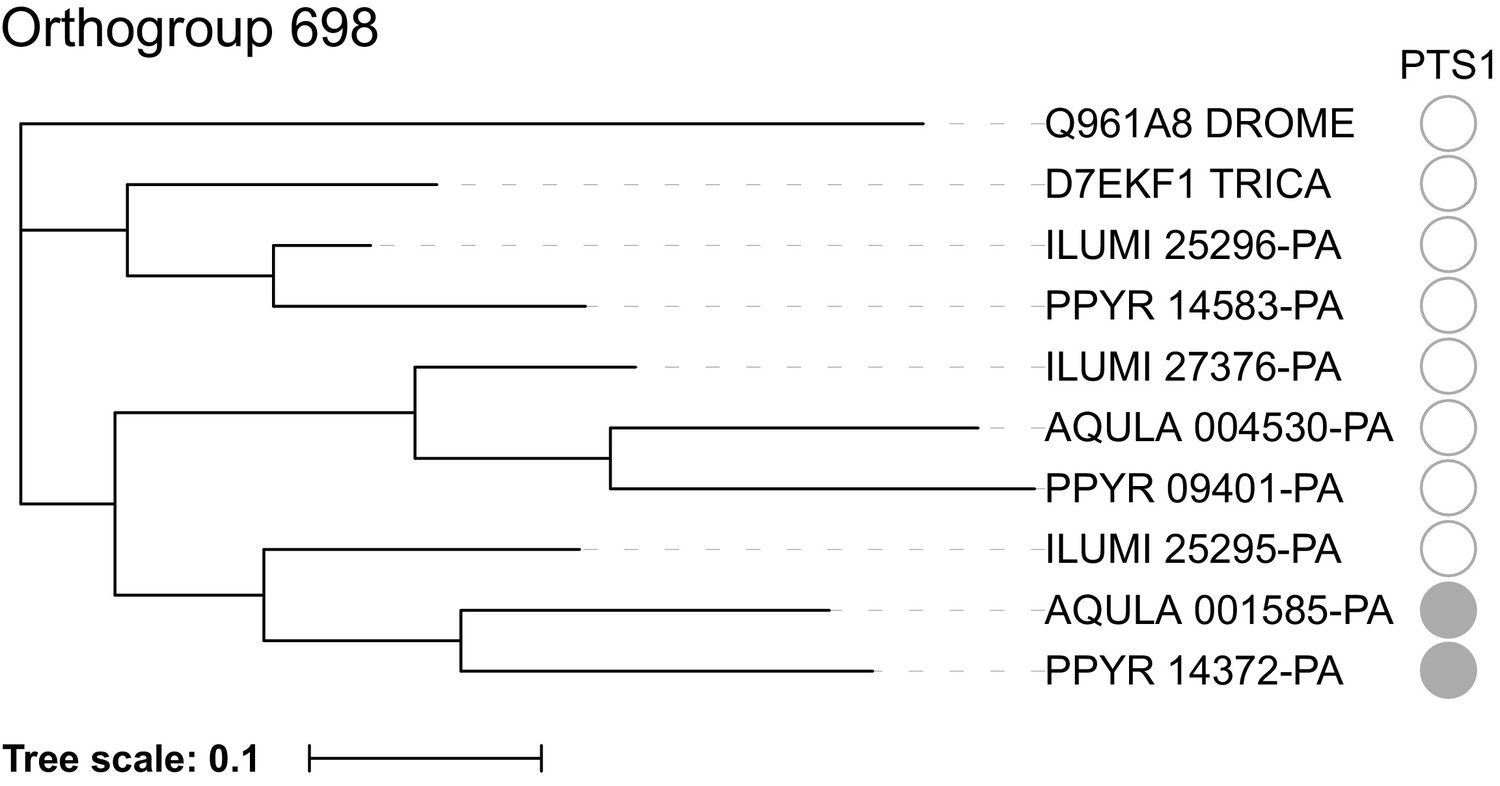
Maximum likelihood gene tree of the combined adenylyl-sulfate kinase and sulfate adenylyltransferase (ASKSA) orthogroup.
Peptide sequences from P. pyralis, A. lateralis, I. luminosus, T. castaneum, and D. melanogaster were clustered (orthogroup # 698), multiple sequence aligned, and refactored into a species rooted maximum likelihood tree, via the OrthoFinder pipeline (Appendix 4.2.1). As this is a genome-wide analysis where bootstrap replicates would be computationally prohibitive, no bootstrap replicates were performed to evaluate the support of the tree topology. PTS1 sequences were predicted from the peptide sequence using the PTS1 predictor server (Neuberger et al., 2017). Figure produced with iTOL (Letunic and Bork, 2016).
Appendix 4—figure 9
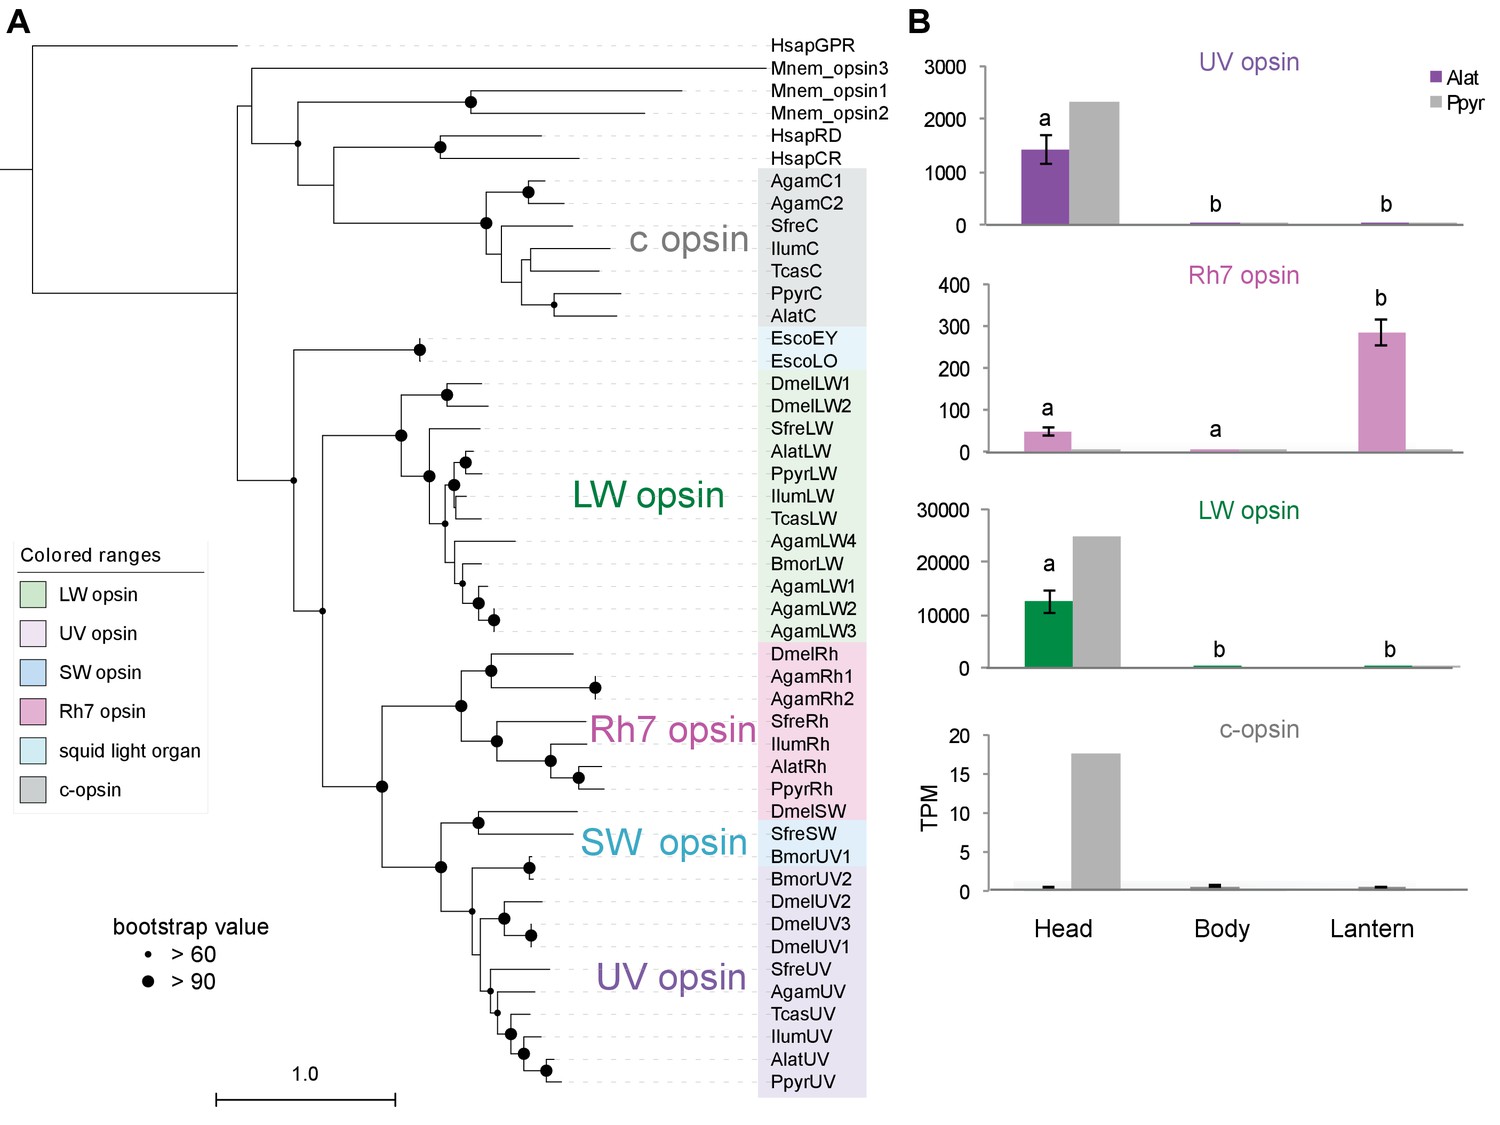
ML tree and gene expression levels of opsin genes.
https://doi.org/10.7554/eLife.36495.066
Appendix 4—figure 10

Positive mode MS1 total-ion-chromatogram (TIC) of P.pyralis adult hemolymph LC-HRAM-MS data.
Figure produced using MZmine2 (Pluskal et al., 2010).
Appendix 4—figure 11

Negative mode MS1 total-ion-chromatogram (TIC) of P. pyralis adult hemolymph LC-HRAM-MS data.
Figure produced using MZmine2 (Pluskal et al., 2010).
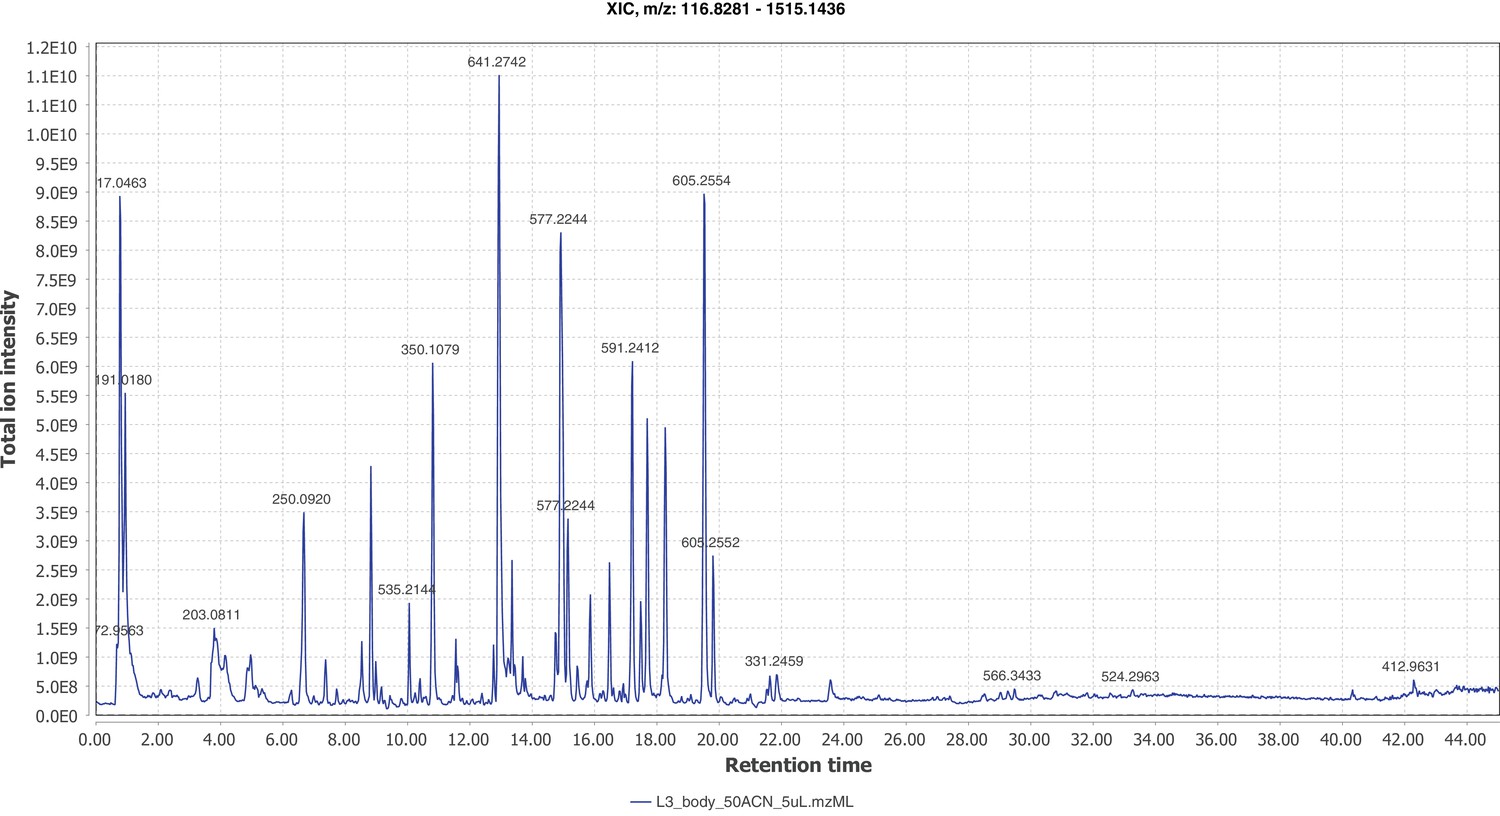
Appendix 4—figure 12

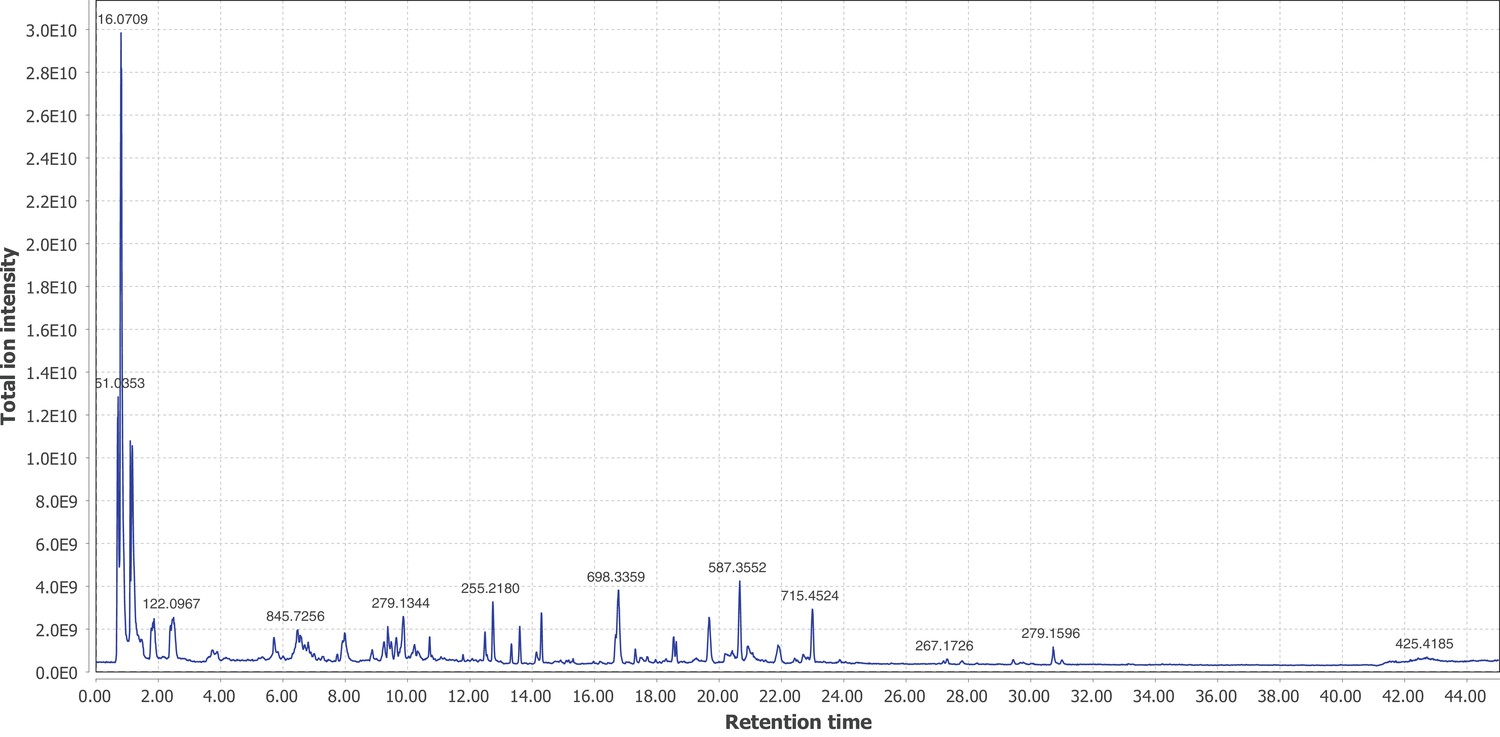
Positive mode MS1 total-ion-chromatogram (TIC) of P. pyralis larval whole body minus two posterior segments LC-HRAM-MS data.
Figure produced using MZmine2 (Pluskal et al., 2010).
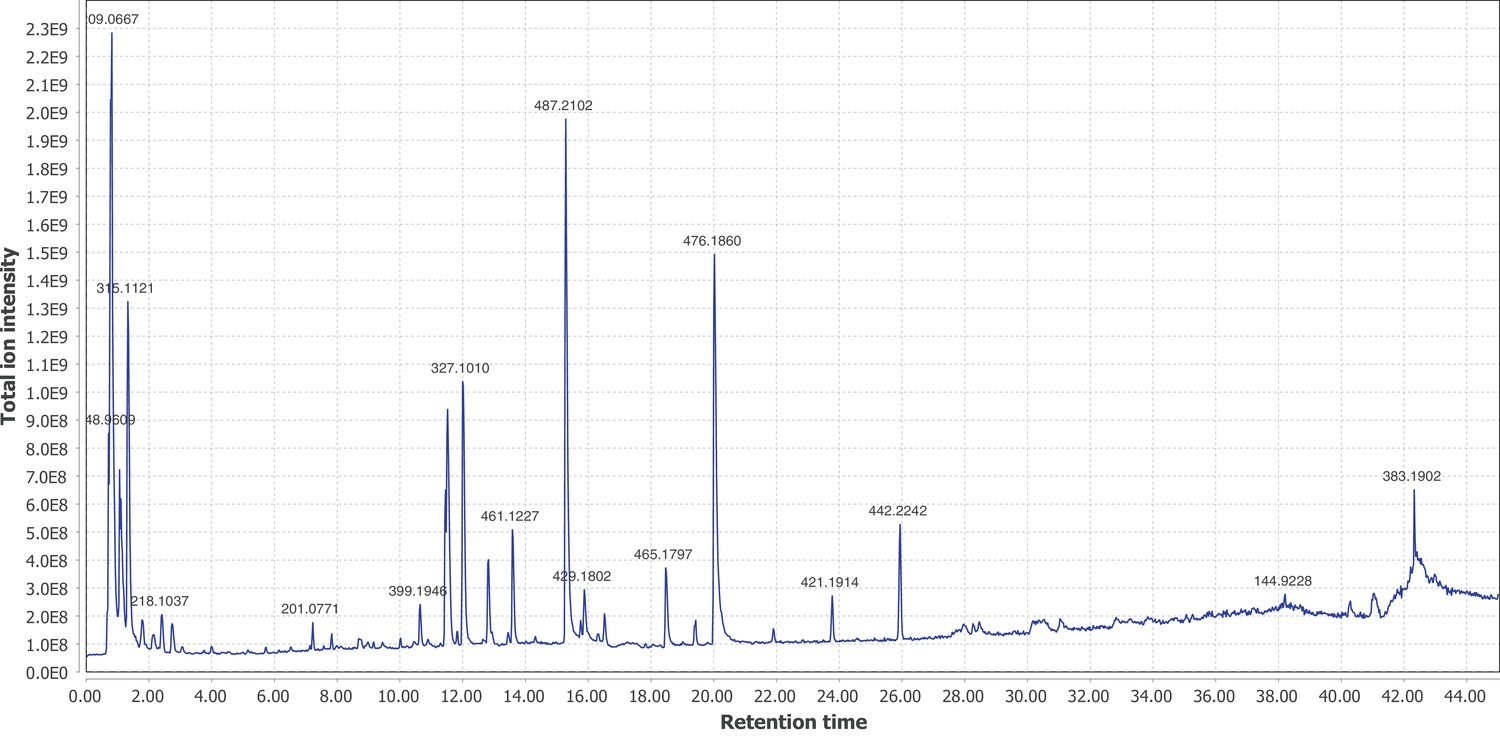
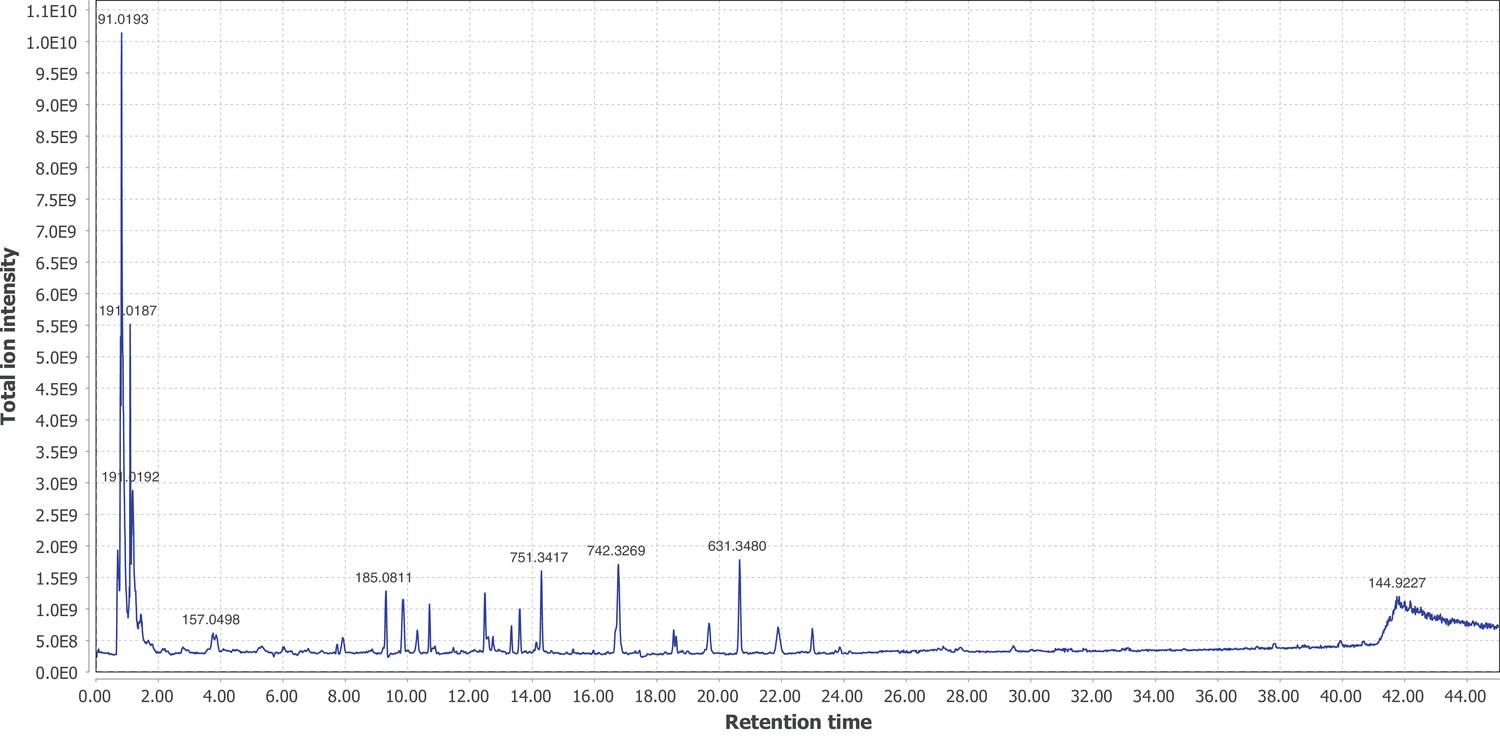
Appendix 4—figure 13
Negative mode MS1 total-ion-chromatogram (TIC) of P. pyralis larval whole body minus two posterior segments LC-HRAM-MS data.
Figure produced using MZmine2 (Pluskal et al., 2010).
Appendix 4—figure 14

Positive mode MS1 total-ion-chromatogram (TIC) of A. lateralis adult hemolymph LC-HRAM-MS data.
Figure produced using MZmine2 (Pluskal et al., 2010).
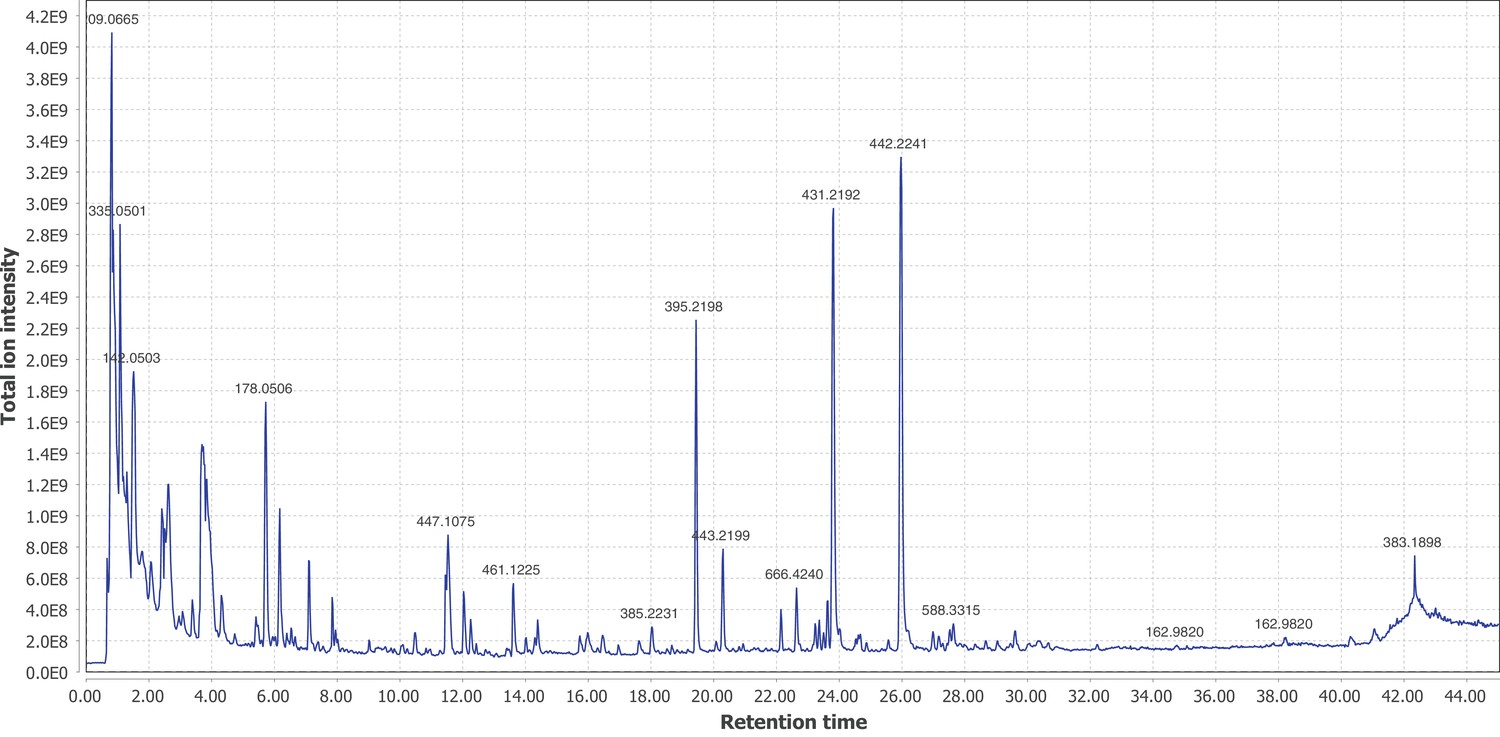
Appendix 4—figure 15
Negative mode MS1 total-ion-chromatogram (TIC) of A. lateralis adult hemolymph LC-HRAM-MS data.
Figure produced using MZmine2 (Pluskal et al., 2010).
Appendix 4—figure 16
Positive mode MS1 total-ion-chromatogram (TIC) of A. lateralis larval whole body LC-HRAM-MS data.
Figure produced using MZmine2 (Pluskal et al., 2010).
Appendix 4—figure 17
Negative mode MS1 total-ion-chromatogram (TIC) of A. lateralis larval whole body extract LC-HRAM-MS data.
Figure produced using MZmine2 (Pluskal et al., 2010).
Appendix 4—figure 18
Positive mode MS1 total-ion-chromatogram (TIC) of I. luminosus mesothorax +abdomen extract LC-HRAM-MS data.
Figure produced using MZmine2 (Pluskal et al., 2010).
Appendix 4—figure 19
Negative mode MS1 total-ion-chromatogram (TIC) of I.luminosus mesothorax + abdomen extract LC-HRAM-MS data.
Figure produced using MZmine2 (Pluskal et al., 2010).
Appendix 4—figure 20
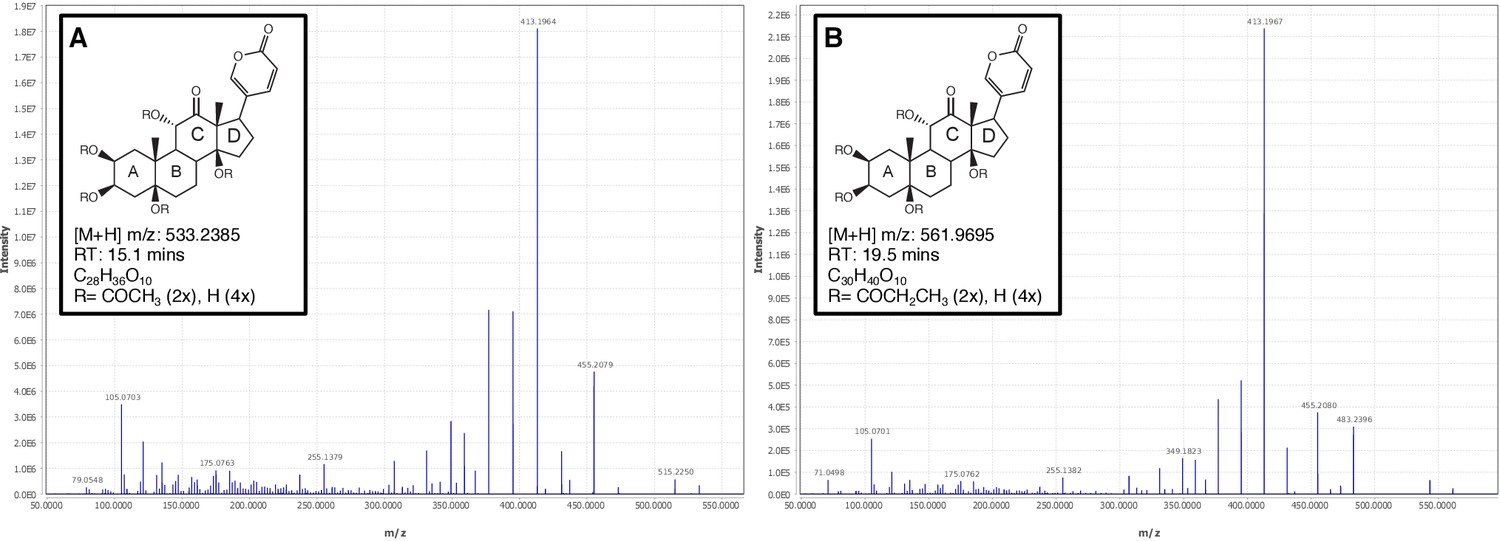
Positive mode MS2 spectra of (A) diacetylated lucibufagin [M + H]+ and (B) dipropylated lucibufagin [M + H]+.
https://doi.org/10.7554/eLife.36495.077
Appendix 4—figure 21
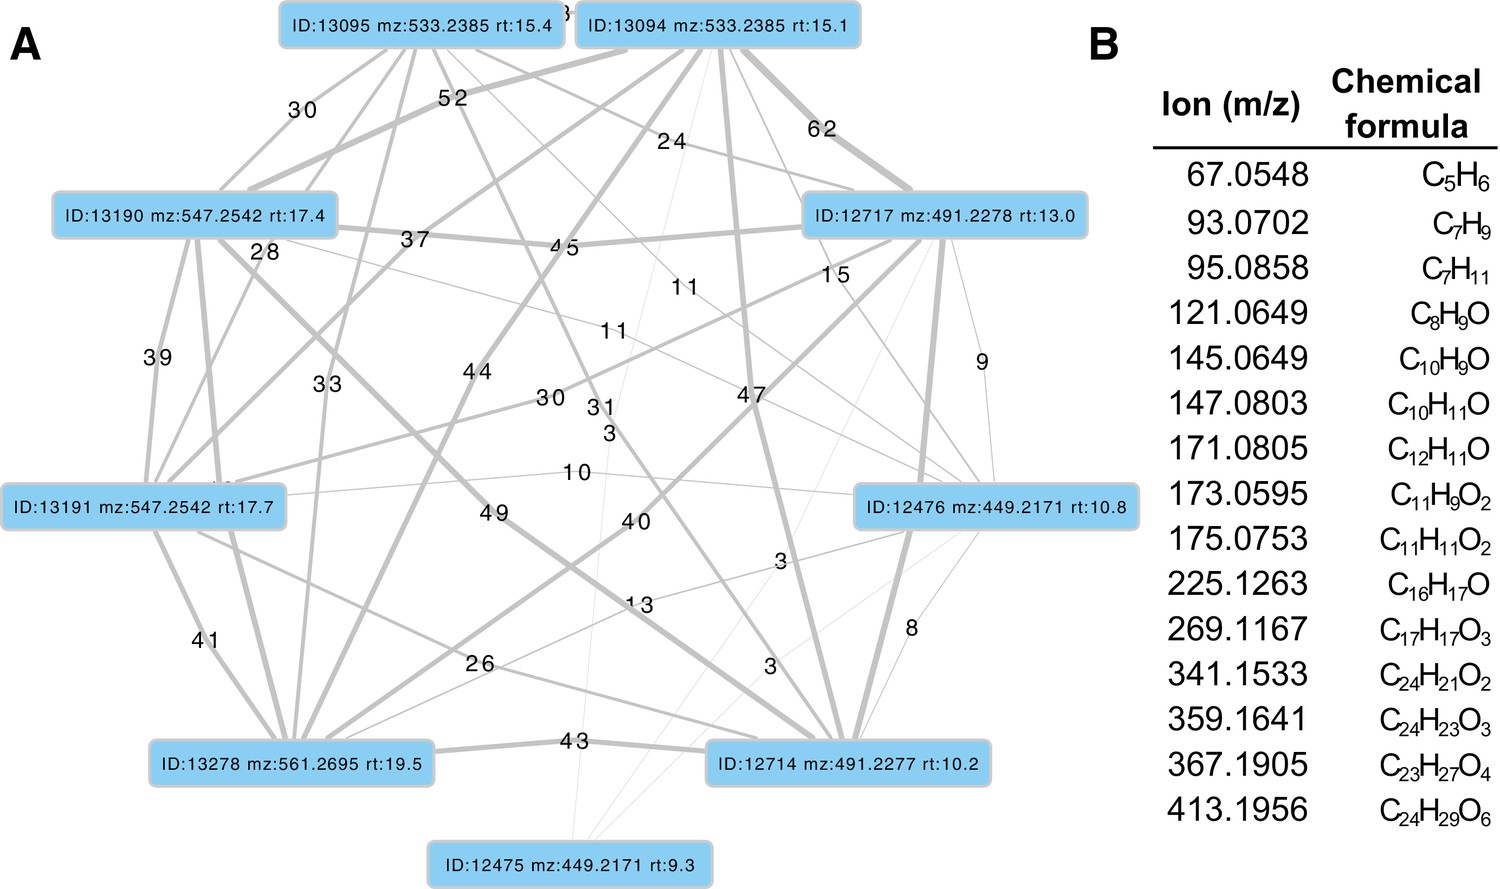
MS2 spectral similarity network for P.pyralis adult hemolymph lucibufagins.
(A) MS2 similarity network produced with the MZmine2 MS2 similarity search module. Nodes represent MS2 spectra from the initial dataset, whereas edges represent an MS2 similarity match between two MS2 spectra. Thickness/label of the edge represents the number of ions matched between the two MS2 spectra. (B) Table of matched ions between diacetylated lucibufagin (m/z: 533.2385 RT:15.1), and core (unacetylated) lucibufagin (m/z: 449.2171 RT:10.8 min). MS1 adducts and complexes of the presented ions were manually removed.
Appendix 5—figure 1
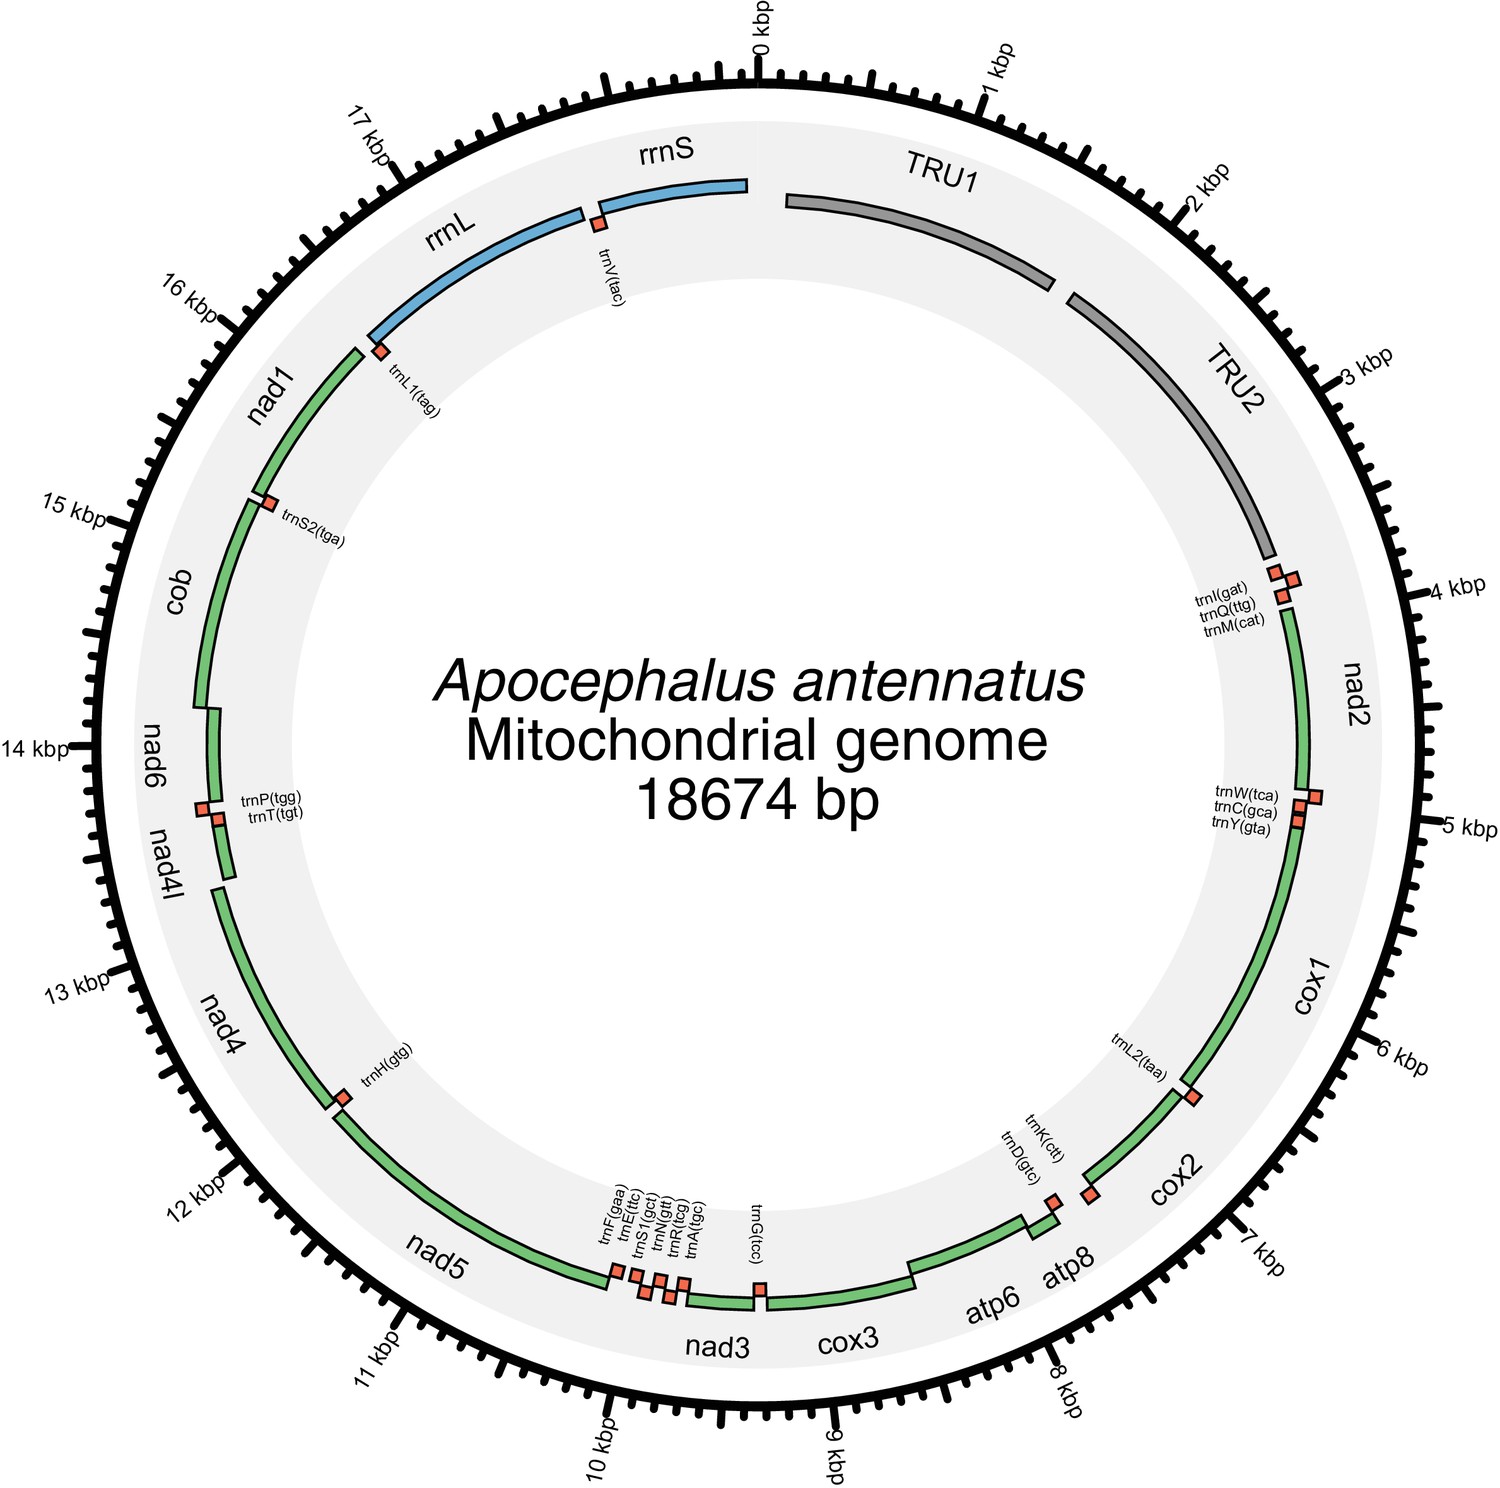
Mitochondrial genome of Apocephalus antennatus.
The mitochondrial genome of A. antennatus was assembled and annotated as described in the Appendix 5.2, and taxonomically identified as described in Appendix 5.3. Figure produced with Circos (Krzywinski et al., 2009).
Appendix 5—figure 2
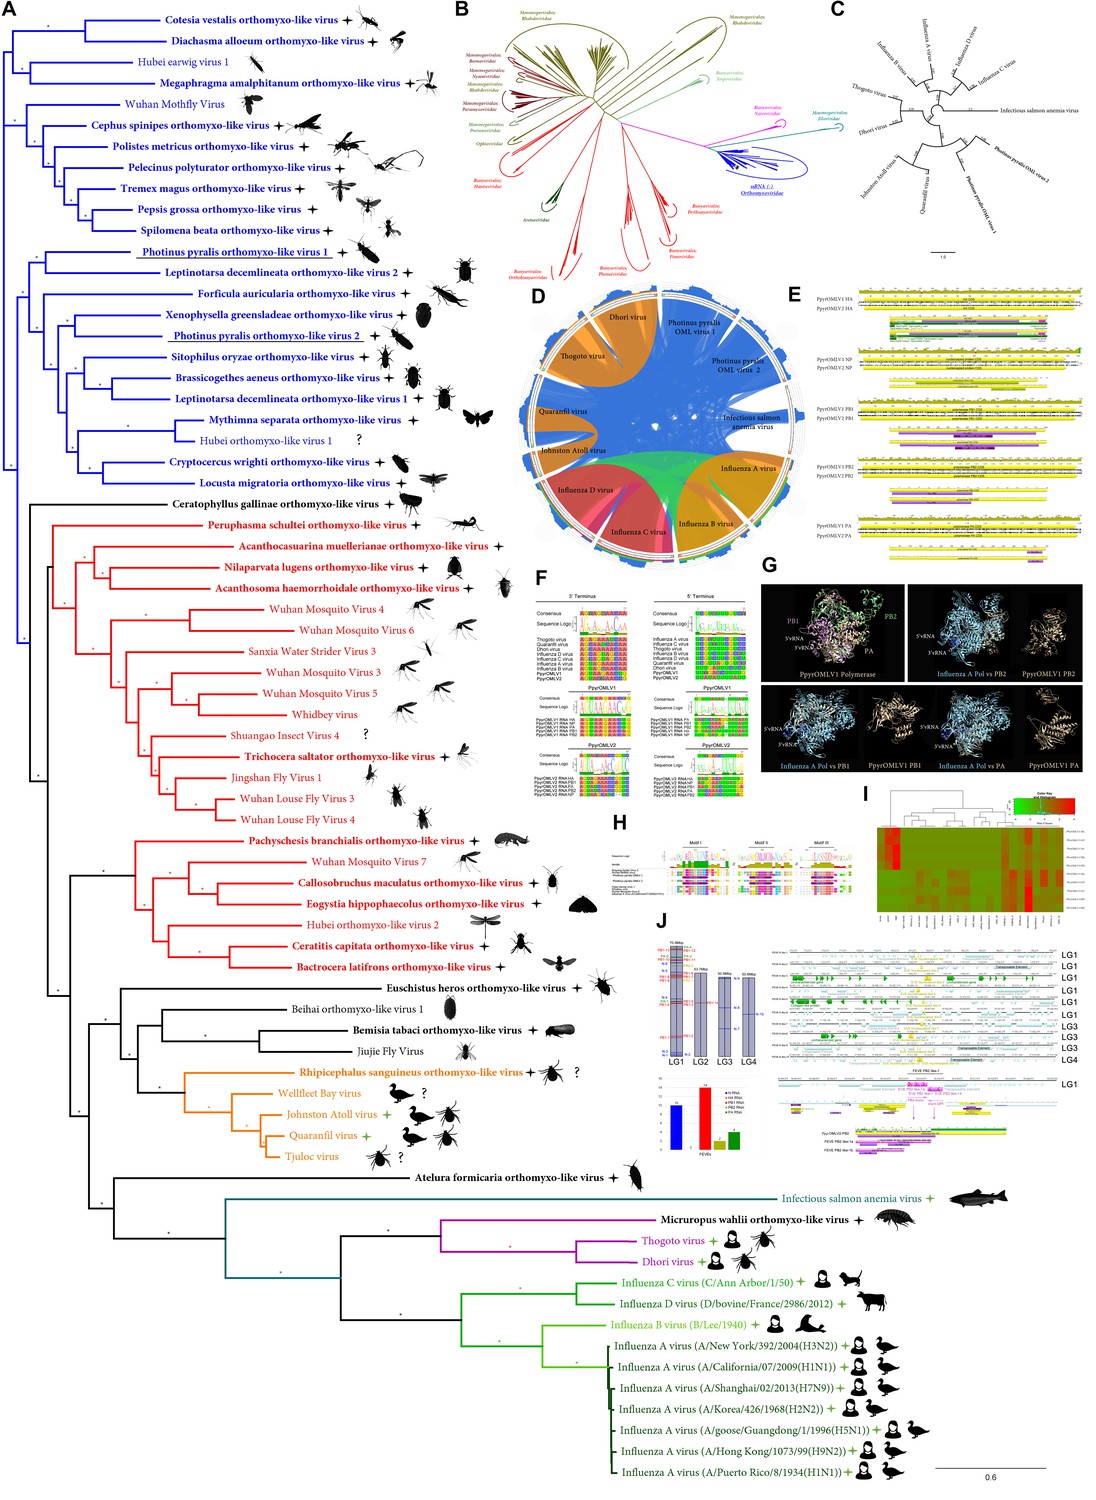
Photinus pyralis viruses and endogenous viral-like elements.
(A) Phylogenetic tree based in MAFFT alignments of predicted replicases of Orthomyxoviridae (OMV) ICTV accepted viruses (green stars), new Photinus pyralis viruses (underlined) and tentative OMV-like virus species (black stars). ICTV recognized OMV genera: Quaranjavirus (orange), Thogotovirus (purple), Issavirus (turquoise), Influenzavirus A-D (green). Silhouettes correspond to host species. Asterisk denote FastTree consensus support >0.5. Question marks depict viruses with unidentified or unconfirmed host. (B) Phylogenetic tree of OMV proposed and recognized species in the context of all ssRNA (-) virus species, based on MAFFT alignments of refseq replicases. Photinus pyralis viruses are portrayed by black stars. (C) Phylogenetic tree of ICTV recognized OMV species and PpyrOMLV1 and 2. Numbers indicate FastTree consensus support. (D) Genetic distances of concatenated gene products of OMV depicted as circoletto diagrams. Proteins are oriented clockwise in N-HA-PB1-PB2-PA order when available. Sequence similarity is expressed as ribbons ranging from blue (low) to red (high). (E) Genomic architecture, predicted gene products and structural and functional domains of PpyrOLMV1 and 2. (F) Virus genomic noncoding termini analyses of PpyrOLMV1 and 2 in the context of ICTV OMV. The 3’ and 5’ end, A and U rich respectively, partially complementary sequences are associated to tentative panhandle polymerase binding and replication activity, typical of OMV. (G) 3D renders of the heterotrimeric polymerase of PpyrOMLV1 based on Swiss-Expasy generated models using as template the Influenza A virus polymerase structure. Structure comparisons were made with the MatchAlign tool of the Chimera suite, and solved in PyMOL. (H) Conserved functional motifs of PpyrOLMV1 and 2 PB1 and related viruses. Motif I-III are essential for replicase activity of viral polymerase. (I) Dynamic and prevalent virus derived RNA levels of the corresponding PpyrOMLV1 and 2 genome segments, determined in 24 RNA libraries of diverse individuals/developmental stages/tissues and geographic origins. RNA levels are expressed as normalized TPM, heatmaps were generated by Shinyheatmap. Values range from low (green) to high (red). (J) Firefly EVEs (FEVEs) identified in the P. pyralis genome assembly mapped to the corresponding pseudo-molecules. A 15 Kbp region flanking nucleoprotein like FEVES are depicted, enriched in transposable elements. Representative products of a putative PB2 FEVE are aligned to the corresponding protein of PpyrOMLV 2.
Appendix 5—figure 3
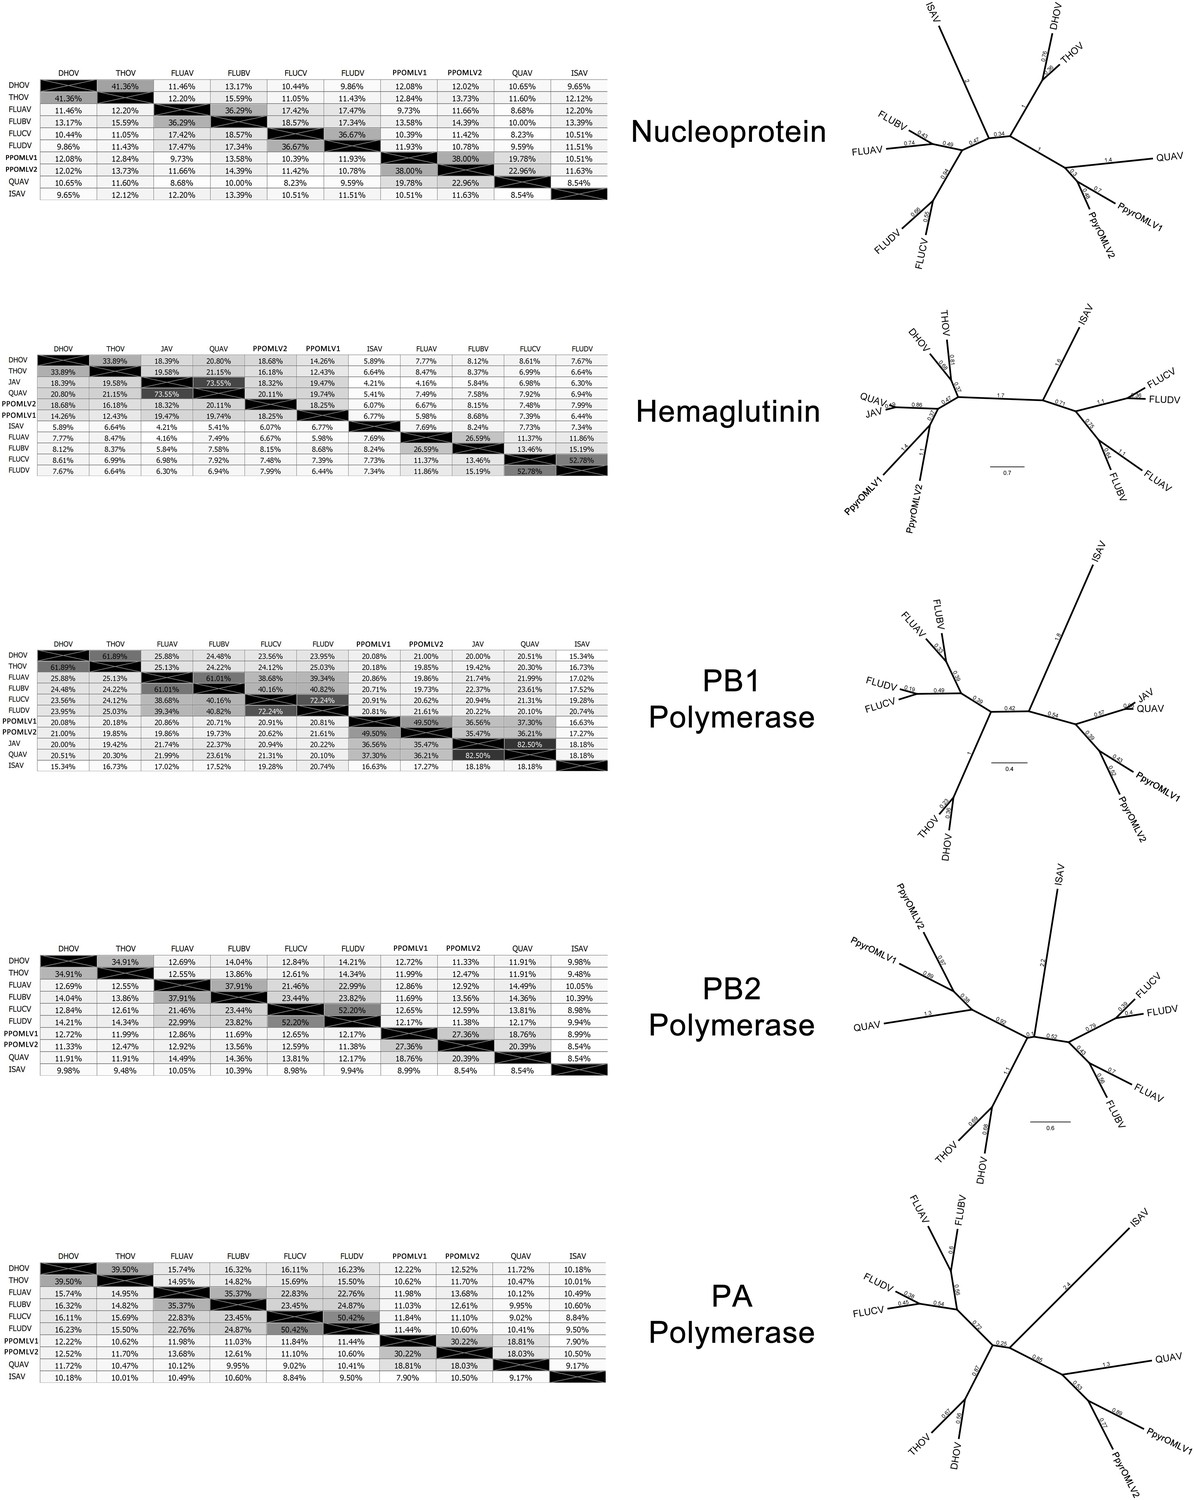
Pairwise identity of OMLV viral proteins amongst identified OMLV viruses.
https://doi.org/10.7554/eLife.36495.086Videos
Video 1
A Photinus pyralis courtship dialogue.
https://doi.org/10.7554/eLife.36495.004Tables
Appendix 1—table 1
P. pyralis RNA sequencing libraries.
N: number of individuals pooled for sequencing; Sex/stage: M = male, F = female, A = adult, L = larva, L1 = larva 1 st instar, L4 = larvae fourth instar, E13 = 13 days post fertilization eggs; Tissue: H = head, PA = lantern abdominal segments, FB = abdominal fat body, T = thorax, OAG = other accessory glands, SD = spermatophore digesting gland/bursa, SG = spiral gland, SC = spermatheca, p=dissected photophore, E = egg, WB = whole body.
| Library name | Source* | SRA ID | N | Sex/stage | Tissue | Library type |
|---|---|---|---|---|---|---|
| 8175 Photinus pyralis male head (adult) transcriptome | SRA1 | SRR2103848 | 1 | M/A | H | |
| 8176 Photinus pyralis male light organ (adult) transcriptome | SRA1 | SRR2103849 | 1 | M/A | PA | |
| 8819 Photinus pyralis light organ (larval) transcriptome | SRA1 | SRR2103867 | 1 | L | PA | |
| 9_Photinus_sp_1_lantern | SRA2 | SRR3521424 | 1 | M/A | PA | Strand-specific. Ribo-zero |
| Ppyr_FatBody_1 | SRA3 | SRR3883756 | 6 | M/A | FB | |
| Ppyr_FatBody_2 | SRA3 | SRR3883757 | 6 | M/A | FB | |
| Ppyr_FatBody_3 | SRA3 | SRR3883766 | 6 | M/A | FB | |
| Ppyr_FatBody_Mated | SRA3 | SRR3883767 | 4 | M/A | FB | |
| Ppyr_FThorax | SRA3 | SRR3883768 | 3 | F/A | T | |
| Ppyr_MThorax_1 | SRA3 | SRR3883769 | 6 | M/A | T | |
| Ppyr_MThorax_2 | SRA3 | SRR3883770 | 6 | M/A | T | |
| Ppyr_MThorax_3 | SRA3 | SRR3883771 | 6 | M/A | T | |
| Ppyr_OAG_1A | SRA3 | SRR3883772 | 6 | M/A | AG | |
| Ppyr_OAG_1B | SRA3 | SRR3883773 | 6 | M/A | AG | |
| Ppyr_OAG_2 | SRA3 | SRR3883758 | 6 | M/A | AG | |
| Ppyr_OAG_Mated | SRA3 | SRR3883759 | 4 | M/A | AG | |
| Ppyr_SDGBursa | SRA3 | SRR3883760 | 3 | F/A | SD | |
| Ppyr_SG_Mated | SRA3 | SRR3883761 | 4 | M/A | SG | |
| Ppyr_Spermatheca | SRA3 | SRR3883762 | 3 | F/A | SC | |
| Ppyr_SpiralGland_1 | SRA3 | SRR3883763 | 6 | M/A | SG | |
| Ppyr_SpiralGland_2 | SRA3 | SRR3883764 | 6 | M/A | SG | |
| Ppyr_SpiralGland_3 | SRA3 | SRR3883765 | 6 | M/A | SG | |
| Ppyr_Lantern_1A | ‡ | SRR6345453 | 6 | M/A | P | |
| Ppyr_Lantern_2 | ‡ | SRR6345454 | 6 | M/A | P | |
| Ppyr_Lantern_3 | ‡ | SRR6345446 | 6 | M/A | P | |
| Ppyr_Eggs | ‡ | SRR6345447 | 7 | E13 | E | Strand-specific |
| Ppyr_Larvae | ‡ | SRR6345445 | 4 | L1 | WB | Strand-specific |
| Ppyr_wholeFemale† | ‡ | SRR6345449 | 1 | F/A | WB | Strand-specific |
| Ppyr_wholeMale | ‡ | SRR6345452 | 1 | M/A | WB | Strand-specific |
| TF_VA2017_3pooled_larval_lantern | ‡ | SRR7345580 | 3 | L4 | P |
-
*SRA1 = NCBI BioProject PRJNA289908 (Sander and Hall, 2015); SRA2 = NCBI BioProject PRJNA321737 (Fallon et al., 2016); SRA3 = NCBI BioProject PRJNA328865 (Al-Wathiqui et al., 2016).
†Parent of eggs and larvae with data from this study.
-
‡This study.
Appendix 1—table 2
Annotated repetitive elements in P. pyralis.
https://doi.org/10.7554/eLife.36495.034| Repeat class | Family | Counts | Bases | % of assembly |
|---|---|---|---|---|
| DNA | All | 122551 | 38364685 | 8.14 |
| Helitrons | 35068 | 9308100 | 1.97 | |
| LTR | All | 28860 | 11401648 | 2.42 |
| Non-LTR | All | 52107 | 17744320 | 3.76 |
| LINE | 48983 | 16763499 | 3.56 | |
| SINE | 1241 | 139637 | 0.03 | |
| Unknown interspersed | 696511 | 141970977 | 30.1 | |
| Complex tandem repeats | 10395 | 2352796 | 0.50 | |
| Simple repeat | 48224 | 2372183 | 0.50 | |
| rRNA | 449 | 161517 | 0.034 | |
Appendix 1—table 3
Photinus pyralis genome Experiment.com crowdfunding donors (https://experiment.com/projects/illuminating-the-firefly-genome).
https://doi.org/10.7554/eLife.36495.035| Liliana Bachrach | Doug Fambrough | Benjamin Lower | Luis Cunha | Joshua Guerriero |
|---|---|---|---|---|
| Atsuko Fish | Tom Alar | Noreen Huefner | David Esopi | John Skarha |
| Rutong Xie | Richard Hall | Zachary Michel | Jack Hynes | Keith Guerin |
| Nathan Shaner | Joe Doggett | Joe T. Bamberg | Michael McGurk | Pureum Kim |
| Sara Lewis | Mark Lewis | Lauren Solomon | Peter Berx | Milo Grika |
| Jing-Ke Weng | Sarah Sander | Dr. Husni Elbahesh | Matt Grommes | Daniel Zinshteyn |
| Peter Rodenbeck | Daniel Bear | Kathryn Larracuente | Colette Dedyn | Tom Brekke |
| Larry Fish | Don Salvatore | Matthew Cichocki | Florencia Schlamp | Edoardo Gianni |
| Amanda Larracuente | Emily Davenport | Marcel Bruchez | Marie Lower | Cindy Wu |
| Hunter Lower | Ted Sharpe | Robert Unckless | Michael R. McKain | Christina Tran |
| Allan Kleinman | David Plunkett | Arvid Ågren | Ben Pfeiffer | Eric Damon Walters |
| Misha Koksharov | Tim Fallon | Margaret S Butler | Kathryn Keho | Geoffrey Giller |
| Sarah Shekher | Edward Garrity | Yasir Ahmed-Braimah | Jenny Wayfarer | Fahd Butt |
| Jared Lee | Huaping Mo | Ruth Ann Grissom | Darby Thomas | Christophe Mandy |
| Raphael De Cock | TimG | Tomáš Pluskal | Emily Hatas | |
| Linds Fallon | Jan Thys | Genome Galaxy | Richard Casey | |
| Grace Li | Francisco Martinez Gasco | Dustin Greiner | William Nicholls |
Appendix 2—table 1
Aquatica lateralis RNA sequencing.
N: number of individuals pooled for sequencing; Sex/stage: M = male, F = female, A = adult, L = larva, L = larvae, E = Eggs, p=Pupae, P-E = Pupae early, P-M = Pupae middle, P-L = Pupae late; Tissue: H = head, La = dissected lantern containing cuticle, photocyte layer and reflector layer, H = head, B = Thorax, plus abdomen excluding lantern containing segments. W = whole specimen. AEL = After egg laying.
| Library name | Label | SRA ID | N | Sex/ Stage | Tissue | Library type |
|---|---|---|---|---|---|---|
| R102L6_idx13 | BdM1 | DRR119264 | 1 | M/A | B | Illumina paired-end, non-stranded specific, PolyA |
| R128L1_idx25 | BdM2 | DRR119265 | 1 | M/A | B | Illumina single-end, non-stranded specific, PolyA |
| R128L2_idx27 | BdM3 | DRR119266 | 1 | M/A | B | Illumina single-end, non-stranded specific, PolyA |
| R102L6_idx15 | HeF1 | DRR119267 | 3 | F/A | H | Illumina paired-end, non-stranded specific, PolyA |
| R128L1_idx22 | HeF2 | DRR119268 | 3 | F/A | H | Illumina single-end, non-stranded specific, PolyA |
| R128L2_idx23 | HeF3 | DRR119269 | 3 | F/A | H | Illumina single-end, non-stranded specific, PolyA |
| R102L6_idx12 | HeM1 | DRR119270 | 2 | M/A | H | Illumina paired-end, non-stranded specific, PolyA |
| R128L1_idx20 | HeM2 | DRR119271 | 2 | M/A | H | Illumina single-end, non-stranded specific, PolyA |
| R128L2_idx21 | HeM3 | DRR119272 | 2 | M/A | H | Illumina single-end, non-stranded specific, PolyA |
| R102L6_idx16 | LtF1 | DRR119273 | 5 | F/A | La | Illumina paired-end, non-stranded specific, PolyA |
| R128L1_idx06 | LtF2 | DRR119274 | 5 | F/A | La | Illumina single-end, non-stranded specific, PolyA |
| R128L2_idx12 | LtF3 | DRR119275 | 5 | F/A | La | Illumina single-end, non-stranded specific, PolyA |
| R102L6_idx14 | LtM1 | DRR119276 | 5 | M/A | La | Illumina paired-end, non-stranded specific, PolyA |
| R128L1_idx05 | LtM2 | DRR119277 | 5 | M/A | La | Illumina single-end, non-stranded specific, PolyA |
| R128L2_idx19 | LtM3 | DRR119278 | 5 | M/A | La | Illumina single-end, non-stranded specific, PolyA |
| R128L2_idx15 | WAF1 | DRR119279 | 1 | F/A | W | Illumina single-end, non-stranded specific, PolyA |
| R128L1_idx16 | WAF2 | DRR119280 | 1 | F/A | W | Illumina single-end, non-stranded specific, PolyA |
| R128L2_idx18 | WAF3 | DRR119281 | 1 | F/A | W | Illumina single-end, non-stranded specific, PolyA |
| R128L1_idx11 | WAM1 | DRR119282 | 1 | M/A | W | Illumina single-end, non-stranded specific, PolyA |
| R128L2_idx13 | WAM2 | DRR119283 | 1 | M/A | W | Illumina single-end, non-stranded specific, PolyA |
| R128L1_idx14 | WAM3 | DRR119284 | 1 | M/A | W | Illumina single-end, non-stranded specific, PolyA |
| R102L6_idx4 | Egg1 | DRR119285 | 19.6 mg (~30–50) | E ~6 hr AEL | W | Illumina paired-end, non-stranded specific, PolyA |
| R128L1_idx01 | Egg2 | DRR119286 | 21.6 mg (~30–50) | E ~7 d AEL | W | Illumina single-end, non-stranded specific, PolyA |
| R102L6_idx5 | Lrv1 | DRR119287 | 1 | L | W | Illumina paired-end, non-stranded specific, PolyA |
| R128L1_idx03 | Lrv2 | DRR119288 | 1 | L | W | Illumina single-end, non-stranded specific, PolyA |
| R128L2_idx04 | Lrv3 | DRR119289 | 1 | L | W | Illumina single-end, non-stranded specific, PolyA |
| R128L1_idx07 | PpEM | DRR119290 | 1 | M/P-E | W | Illumina single-end, non-stranded specific, PolyA |
| R128L2_idx10 | PpLF | DRR119291 | 1 | F/P-L | W | Illumina single-end, non-stranded specific, PolyA |
| R128L1_idx09 | PpMF | DRR119292 | 1 | F/P-M | W | Illumina single-end, non-stranded specific, PolyA |
| R128L2_idx08 | PpMM | DRR119293 | 1 | M/P-M | W | Illumina single-end, non-stranded specific, PolyA |
| R102L6_idx7 | PpEF | DRR119294 | 1 | F/P-E | W | Illumina paired-end, non-stranded specific, PolyA |
| R102L6_idx6 | PpLM | DRR119295 | 1 | M/P-L | W | Illumina paired-end, non-stranded specific, PolyA |
Appendix 2—table 2
Annotated repetitive elements in A. lateralis.
https://doi.org/10.7554/eLife.36495.040| Repeat class | Family | Counts | Bases | % of assembly |
|---|---|---|---|---|
| DNA | All | 229064 | 73263593 | 8.06 |
| Helitrons | 930 | 466679 | 0.051 | |
| LTR | All | 59499 | 23391956 | 2.57 |
| Non-LTR | All | 151788 | 50394853 | 5.55 |
| LINE | 151788 | 50394853 | 5.55 | |
| SINE | 0 | 0 | 0 | |
| Unknown interspersed | 450934 | 99998958 | 11.01 | |
| Complex tandem repeats | 295 | 33237 | 0.004 | |
| Simple repeat | 155265 | 6656757 | 0.73 | |
| rRNA | 0 | 0 | 0 | |
Appendix 3—table 1
Sequence of the I. luminosus luciferase cluster splitting complex tandem repeat.
https://doi.org/10.7554/eLife.36495.046| Repeat name | Repeat unit length | Repeat unit sequence |
|---|---|---|
| Ilumi.complex.repeat.1 | ~100 bp | TGGTACGAACTATACACGTATACTCAAATCTAATT GTGATACAGCAAAGTAATAATGCAGCATTGTTTGCC GCTCTATACTGCGATTTTATAGTGGT |
Appendix 3—table 2
I. luminosus RNA-Seq libraries.
https://doi.org/10.7554/eLife.36495.048| Library name | SRA ID | N | Sex | Tissue | Notes |
|---|---|---|---|---|---|
| Pyrophorus_luminosus_head | SRR6339835 | 1 | M* | Prothorax and head (lantern containing) | Illumina RNA-Seq |
| Prothorax_A3 | SRR6339834 | 1 | M* | Prothorax and head (lantern containing) | BGISEQ-500 RNA-Seq |
| Thorax_A3 | SRR6339833 | 1 | M* | Mesothorax and metathorax | BGISEQ-500 RNA-Seq |
| Abdomen_A3 | SRR6339832 | 1 | M* | Abdomen (lantern containing) | BGISEQ-500 RNA-Seq |
| Prothorax_A4 | SRR6339831 | 1 | M* | Prothorax and head (lantern containing) | BGISEQ-500 RNA-Seq |
| Thorax_A4 | SRR6339830 | 1 | M* | Mesothorax and metathorax | BGISEQ-500 RNA-Seq |
| Abdomen_A4 | SRR6339838 | 1 | M* | Abdomen (lantern containing) | BGISEQ-500 RNA-Seq |
-
*Gender inferred. See Appendix 3.3 for a discussion on this inference.
Appendix 3—table 3
Annotated repetitive elements in I. luminosus.
https://doi.org/10.7554/eLife.36495.049| Repeat class | Family | Counts | Bases | % of assembly |
|---|---|---|---|---|
| DNA | All | 158853 | 71221843 | 8.45 |
| Helitrons | 344 | 139863 | 0.016 | |
| LTR | All | 23433 | 11341577 | 1.35 |
| Non-LTR | All | 151788 | 50394853 | 4.75 |
| LINE | 97703 | 40052840 | 4.75 | |
| SINE | 0 | 0 | 0 | |
| Unknown interspersed | 757206 | 159587269 | 18.93 | |
| Complex tandem repeats | 4976 | 848992 | 0.1 | |
| Simple repeat | 108914 | 4439967 | 0.52 | |
| rRNA | 0 | 0 | 0 | |
Appendix 4—table 1
Genomic sequencing library statistics.
ID: NCBI BioProject or Gene Expression Omnibus (GEO) ID. N: Number of individuals used for sequencing. Date: collection date for wild-caught individuals. Locality: GSMNP: Great Smoky Mountains National Park, TN; MMNJ: Mercer Meadows, Lawrenceville, NJ; IY90: laboratory strain Ikeya-Y90; MAPR: Mayagüez, Puerto Rico. Tissue: Thr: thorax; WB: whole-body; Type: SI: Illumina short insert; MP: Illumina mate pair; PB: Pacific Biosciences, RSII P6-C4; HC: Hi-C; BS: Bisulfite; CH: 10x Chromium; ONT: Oxford Nanopore MinION R9.4. Reads: PE: paired-end, CLR: continuous long read. Number: number of reads. Cov: Mode of autosomal coverage (mode of putative X chromosome, LG3a, coverage), determined from mapped reads with QualiMap (v2.2). ND: Not Determined. Insert size: Mode of insert size after alignment (orientation: FR: forward, RF: reverse), determined from mapped reads with QualiMap. Contamination: Percent contamination as estimated by kraken v1.0.
| Library | SRA ID | N | Date | Locality | Sex | Tissue | Type | Reads | Number | Cov | Insert size (Ori) | Contamination |
|---|---|---|---|---|---|---|---|---|---|---|---|---|
| Photinus pyralis | ||||||||||||
| 8369* | SRR6345451/ SRR2127932 | 1 | 6/13/11 | GSMNP | M | Thr | SI | 101 × 101 PE | 203,074,230 | 98 (49) | 354 bp (FR) | 0.28 |
| 8375_3 K† | SRR6345448 | 1 | 6/13/11 | GSMNP | M | Thr | MP | 101 × 101 PE | 101,624,630 | 21 | 2155 bp (RF) | 2.63 |
| 8375_6 K† | SRR6345457 | 1 | 6/13/11 | GSMNP | M | Thr | MP | 101 × 101 PE | 23,564,456 | 5 | 4889 bp (RF) | 3.36 |
| 83_3 K† | SRR6345450 | 3 | 6/13/11 | GSMNP | M | Thr | MP | 101 × 101 PE | 121,757,858 | 13 | 2247 bp (RF) | 0.79 |
| 83_6 K† | SRR6345455 | 3 | 6/13/11 | GSMNP | M | Thr | MP | 101 × 101 PE | 17,905,700 | 1 | 4877 bp (RF) | 1.38 |
| 1611_PpyrPB1 | SRX3444870 | 4 | 7/9/16 | MMNJ | M | WB | PB | CLR-PB | 3,558,201 | 38 (21) | 7 Kbp‡ | 3.5 |
| 1704 | SRR6345456 | 2 | 7/9/16 | MMNJ | M | WB | HC | 80 × 80 PE | 93,850,923 | ND | ND | ND |
| 1705 | GSE107177 | 1 | 7/9/16 | MMNJ | M | WB | BS | 150 SE | 113,761,746 | ~16x§ | ND | ND |
| Aquatica lateralis | ||||||||||||
| FFGPE_PE200 | DRR119296 | 1 | N/A | IY90 | F | WB | SI | 126 × 126 PE | 561,450,686 | 72 | 180 bp (FR) | ND |
| FFGPE_PE800 | DRR119297 | WB | SI | 126 × 126 PE | 218,830,950 | 20 | 476 bp (FR) | ND | ||||
| FFGMP_MPGF | DRR119298 | WB | MP | 101 × 101 PE | 358,601,808 | 31 | 2300 bp (RF) | ND | ||||
| Ignelater luminosus | ||||||||||||
| 1610_Ilumi HiSeqX# | SRR6339837 | 1 | MAPR | M¶ | WB | CH | 151 × 151 PE | 408,838,927 | 99 | 339 bp (FR) | ND | |
| 1706_Ilumi HiSeq2500# | SRR6339836 | WB | CH | 150 × 150 PE | 145,250,480 | 48 | 334 bp (FR) | ND | ||||
| 18_lib1 | SRR6760567 | ONT | CLR | 824,248 | ~2x | 2984‡ | ||||||
-
*Mean of three sequencing lanes
†Mean of two sequencing lanes
-
‡Mean subread (PacBio) or read (Oxford Nanopore) length after alignment
§Estimate from quantity of mapped reads
-
#Same library, different instruments
¶Inferred from specimens collected at the same time and locality
Appendix 4—table 2
Assembly statistics
https://doi.org/10.7554/eLife.36495.053| Assembly | Libraries | Assembly scheme | Assembly* /measured** genome size (Gbp) | Scaffold/ Contig (#) | Contig NG50*** (Kbp) | Scaffold NG50*** (Kbp) | BUSCO statistics |
|---|---|---|---|---|---|---|---|
| Ppyr0.1-PB | PacBio (61 RSII SMRT cells) | Canu (no polishing) | 721/422 | 25986/ 25986 | 86 | 86 | C:93.8%[S:65.2%,D:28.6%],F:3.3%,M:2.9% |
| Ppyr1.1 | Short read Mate Pair PacBio | MaSuRCA + redundancy reduction | 473/422 | 8065/ 8285 | 193.4 | 202 | C:97.2% [S:88.8%, D:8.4%], F:1.9%, M:0.9% |
| Ppyr1.2 | Short | Ppyr1.1+ Phase Genomics scaffolder (in-house) | 473/422 | 2535/ 7823 | 193.4 | 50,607 | C:97.2% [S:88.8% ,D:8.4%],F:1.9%, M:0.9% |
| PacBio | |||||||
| Hi-C | |||||||
| Ppyr1.3 | Short read Mate Pair PacBio | Ppyr1.2 +Blobtools + manual filtering | 472/422 | 2160/ 7533 | 192.5 | 49,173 | C:97.2% [S:88.8%, D:8.4%], F:1.9%, M:0.9% |
| Alat1.2 | Short read Mate Pair | ALLPATHS-LG | 920/940 | 7313/ 36467 | 38 | 673 | C:97.4% [S:96.2%, D:1.2%], F:1.8%, M:0.8% |
| Alat1.3 | Short read Mate Pair | Alat1.2+Blobtools + manual filtering | 909/940 | 5388/ 34298 | 38 | 670 | C:97.4% [S:96.2%, D:1.2%], F:1.8%, M:0.8% |
| Ilumi1.0 | Linked-read | Supernova | 845/764 | 91560/ 105589 | 31.6 | 116.5 | C:93.7% [S:92.3%, D:1.4%], F:4.3%, M:2.0%, |
| Ilumi1.2 | Linked read+ nanopore | Ilumi1.0+Blobtools+ Pilon indeland gappolishing. Manual scaffolding | 842/764 | 91305/ 105262 | 34.5 | 115.8 | C:94.8% [S:93.4%, D:1.4%],F:3.5%, M:1.7% |
-
*Calculated from genome assembly file with ‘seqkit stat’
**Measured via flow cytometry of propidium iodide stained nuclei. See Appendix 1.4, 2.4, 3.4.
-
***Calculated with QUAST (v4.5) (Gurevich et al., 2013), parameters ‘-e --scaffolds --est-ref-size X --min-contig 0’ and the measured genome size for ‘est-ref-size’
Appendix 4—table 3
Comparison of BUSCO conserved gene content with other insect genome assemblies
https://doi.org/10.7554/eLife.36495.054| Species | Genome version (NCBI assemblies) | Note | Genome BUSCO (endopterygota_odb9) | Protein geneset BUSCO (endopterygota_odb9)** |
| Drosophila melanogaster | GCA_000001215.4 Release 6 | Model insect | C:99.4%[S:98.7%,D:0.7%], F:0.4%,M:0.2%,n:2442 | C:99.6%[S:92.8%,D:6.8%], F:0.3%,M:0.1%,n:2442 |
| Tribolium castaneum | GCF_000002335.3 Release 5.2 | Model beetle | C:98.4%[S:97.9%,D:0.5%], F:1.2%,M:0.4%,n:2442 | C:98.0%[S:95.8%,D:2.2%], F:1.6%,M:0.4%,n:2442 |
| Photinus pyralis* | Ppyr1.3* | North American firefly | C:97.2%[S:88.8%,D:8.4%], F:1.8%,M:1.0%,n:2442 | C:94.2%[S:84.0%,D:10.2%], F:1.2%,M:4.6%,n:2442 |
| Aquatica lateralis* | Alat1.3* | Japanese firefly | C:97.4%[S:96.2%,D:1.2%], F:1.8%,M:0.8% | C:90.0%[S:89.1%,D:0.9%], F:3.2%,M:6.8%,n:2442 |
| Nicrophorus vespilloides (Cunningham et al., 2015) | GCF_001412225.1 Release 1.0 | Burying beetle | C:96.8%[S:95.3%,D:1.5%], F:2.1%,M:1.1%,n:2442 | C:98.7%[S:69.4%,D:29.3%], F:0.8%,M:0.5%,n:2442 |
| Agrilus planipennis (Poelchau et al., 2015) | GCF_000699045.1 Release 1.0 | Emerald Ash Borer beetle | C:92.7%[S:91.8%,D:0.9%], F:4.6%,M:2.7%,n:2442 | C:92.1%[S:64.1%,D:28.0%], F:4.5%,M:3.4%,n:2442 |
| Ignelater luminosus* | Ilumi1.2 | Puerto Rican bioluminescent click beetle | C:94.8%[S:93.4%,D:1.4%], F:3.5%,M:1.7%,n:2442 | C:91.8%[S:89.8%,D:2.0%], F:4.4%,M:3.8%,n:2442 |
-
*=This report, **=Protein genesets downloaded from the NCBI Genome resource associated with the mentioned assembly in the 2nd column, or in the case of D. melanogaster, and T. castaneum, protein genesets were produced from Uniprot Reference Proteomes which had been heuristically filtered down to ‘canonical’ isoforms with a custom script and BLASTP against the D. melanogaster, T. castaneum, Apis mellifera, Bombyx mori, Caenorhabditis elegans, and Anopheles gambiae protein genesets associated with their more recent genome assembly on NCBI. See Appendix 4.2.1 for more detail.
Appendix 4—table 4
Results of PAML branch x sites analysis.
Proportion indicates the proportion of sites in each site class (0, 1, 2a, 2b). Site classes 0 and 1 are those in the constrained and neutral classes, respectively. 2a are sites that were constrained on the background branches, but are either neutral (H0) or in the selective class (HA) on the foreground branches. 2b are sites that were neutral on the background branches, but are either neutral (H0) or in the selective class (HA) on the foreground branches.
| Hypothesis | Site class: | 0 | 1 | 2a | 2b | lnL |
|---|---|---|---|---|---|---|
| H0: no selection | proportion | 0.62 | 0.14 | 0.18 | 0.04 | −15888.16 |
| background ω | 0.12 | 1 | 0.12 | 1 | ||
| foreground ω | 0.12 | 1 | 1 | 1 | ||
| HA: selection | proportion | 0.71 | 0.15 | 0.11 | 0.02 | −15833.50* |
| background ω | 0.12 | 1 | 0.12 | 1 | ||
| foreground ω | 0.12 | 1 | 3.25 | 3.25 |
-
*significant (LRT: 9.32, df = 1)
Appendix 4—table 5
Sites identified as under selection on foreground branches using both Bayes Empirical Bayes (BEB) and Mixed Effects Model of Evolution (MEME).
https://doi.org/10.7554/eLife.36495.062| Site numbering | MEME2 | PAML-BEB | |||||||
|---|---|---|---|---|---|---|---|---|---|
| MSA | IlumLuc | IlumLuc site AA1 | α | β+ | LRT | Episodic selection p-value | # branches | BEB site class probability | BEB significance |
| 28 | 28 | M | 0.986 | * | |||||
| 34 | 34 | K | 0.47 | 23.5 | 4.1 | 0.0603 | 0 | ||
| 41 | 41 | Q | 0.5 | ||||||
| 46 | 44 | V | 0 | 3 | 4.5 | 0.0485 | 0 | ||
| 49 | 47 | I | 0.93 | 792.4 | 3.8 | 0.0692 | 0 | ||
| 50 | 48 | G | 0.57 | 3332.3 | 4.8 | 0.0427 | 0 | 0.836 | |
| 72 | 70 | N | 0.55 | 3333.1 | 3.1 | 0.0998 | 0 | 0.776 | |
| 77 | 75 | M | 0.964 | * | |||||
| 85 | 83 | A | 0.962 | * | |||||
| 89 | 87 | K | 0.958 | * | |||||
| 99 | 97 | W | 0.598 | ||||||
| 105 | 103 | V | 0.44 | 6.8 | 4.3 | 0.0549 | 0 | 0.768 | |
| 118 | 116 | C | 0.3 | 3333.1 | 7.4 | 0.0109 | 1 | ||
| 122 | 120 | G | 0.82 | ||||||
| 146 | 144 | L | 0.34 | 12.8 | 4.9 | 0.039 | 0 | ||
| 147 | 145 | G | 0.75 | 3333.6 | 5.9 | 0.0236 | 0 | ||
| 172 | 170 | A | 0.698 | ||||||
| 189 | 185 | F | 0.534 | ||||||
| 223 | 219 | L | 0.507 | ||||||
| 226 | 222 | T | 1.44 | 29.6 | 4.8 | 0.0427 | 0 | 0.889 | |
| 234 | 230 | I | 1.13 | 9.6 | 3.1 | 0.0991 | 0 | 0.613 | |
| 279 | 275 | A | 0.559 | ||||||
| 290 | 286 | N | 0.92 | 3333 | 4 | 0.064 | 0 | ||
| 315 | 311 | L | 0.69 | 29.5 | 5.1 | 0.0362 | 0 | 0.884 | |
| 329 | 325 | L | 0.766 | ||||||
| 337 | 333 | P | 0.26 | 13.3 | 6.3 | 0.0198 | 0 | ||
| 341 | 337 | C | 0.812 | ||||||
| 365 | 361 | L | 0.58 | 7.6 | 4.4 | 0.052 | 0 | 0.912 | |
| 369 | 365 | T | 0.21 | 6.8 | 6.6 | 0.0169 | 0 | 0.843 | |
| 379 | 375 | R | 0.932 | ||||||
| 383 | 379 | E | 0 | 2.8 | 4.1 | 0.0594 | 0 | ||
| 389 | 385 | Q | 0.792 | ||||||
| 398 | 394 | P | 0.96 | 1999.2 | 4.5 | 0.05 | 0 | 0.951 | * |
| 401 | 397 | S | 0.617 | ||||||
| 406 | 402 | N | 0.58 | 5.5 | 3.7 | 0.0745 | 0 | 0.949 | |
| 423 | 419 | S | 0.67 | 1574.6 | 4.7 | 0.043 | 0 | 0.569 | |
| 432 | 428 | E | 0 | 2.9 | 3.1 | 0.0999 | 1 | ||
| 441 | 437 | Y | 1.43 | 39.3 | 4.2 | 0.0573 | 0 | 0.912 | |
| 478 | 474 | V | 0 | 10.3 | 6.9 | 0.0139 | 1 | 0.646 | |
| 502 | 498 | Y | 0.5 | 1790.4 | 4.9 | 0.0393 | 0 | 0.583 | |
| 508 | 504 | R | 0.519 | ||||||
| 528 | 524 | N | 0 | 2.2 | 3.6 | 0.0772 | 0 | ||
| 541 | 537 | Q | 0 | 1999.2 | 10.4 | 0.0024 | 1 | ||
| 542 | 538 | L | 0.56 | 68 | 6.3 | 0.0197 | 0 | ||
| 550 | 542 | T | 0.74 | 3332.9 | 4.3 | 0.0541 | 0 | ||
-
1 = amino acid. 2=All recovered sites in a single partition with a p+ value of 1.000.
Appendix 4—table 6
Highly expressed (HE), differentially expressed (DE), non-enzyme annotated (NotE), lantern genes whose closest relative in the opposite species is also HE, DE, NotE. BSN-TPM = between sample normalized TPM.
https://doi.org/10.7554/eLife.36495.064| P. pyralis ID (OGS1.1) | Predicted function | Ppyr expression rank | Ppyr BSN-TPM | Orthogroup | Alat expression rank | Alat BSN-TPM | A. lateralis ID (OGS1.0) |
|---|---|---|---|---|---|---|---|
| PPYR_04589 | Fatty-acid binding protein | 1 | 70912 | OG0000524 | 2 | 31943 | AQULA_005253 |
| PPYR_04589 | Fatty-acid binding protein | 1 | 70912 | OG0000524 | 8 | 10464 | AQULA_005257 |
| PPYR_04589 | Fatty-acid binding protein | 1 | 70912 | OG0000524 | 10 | 8520 | AQULA_005259 |
| PPYR_05098 | Peroxisomal biogenesis factor 11 (PEX11) | 15 | 4005 | OG0001490 | 26 | 3294 | AQULA_005466 |
| PPYR_14966 | Octopamine binding secreted hemocyanin | 34 | 2353 | OG0000369 | 21 | 3658 | AQULA_008529 |
| PPYR_11733 | MFS transporter superfamily | 42 | 1853 | OG0000980 | 84 | 1335 | AQULA_012209 |
| PPYR_07633 | Reticulon | 56 | 1556 | OG0004764 | 109 | 1123 | AQULA_005090 |
| PPYR_09394 | lysosomal Cystine Transporter | 87 | 1098 | OG0000847 | 69 | 1494 | AQULA_009474 |
| PPYR_08979 | PF03670 Uncharacterised protein family | 114 | 860 | OG0003009 | 340 | 411 | AQULA_012099 |
| PPYR_05852 | Vacuolar ATP synthase 16 kDa subunit | 118 | 836 | OG0001039 | 287 | 475 | AQULA_001418 |
| PPYR_11443 | RNA-binding domain superfamily | 134 | 782 | OG0004268 | 1221 | 108 | AQULA_003174 |
| PPYR_02465 | Peroxin 13 | 189 | 581 | OG0001667 | 196 | 710 | AQULA_010288 |
| PPYR_06160 | V-type ATPase, V0 complex | 209 | 543 | OG0000381 | 541 | 251 | AQULA_000400 |
| PPYR_11300 | Mitochondrial outer membrane translocase complex | 232 | 509 | OG0004557 | 402 | 349 | AQULA_004355 |
| PPYR_08174 | PF03650 Uncharacterised protein family | 249 | 475 | OG0000647 | 163 | 836 | AQULA_009867 |
| PPYR_04602 | Leucine-rich repeat domain superfamily | 262 | 459 | OG0004508 | 378 | 373 | AQULA_004134 |
| PPYR_01678 | MFS transporter superfamily | 264 | 458 | OG0000347 | 455 | 302 | AQULA_002485 |
| PPYR_08192 | PF03650 Uncharacterised protein family | 271 | 453 | OG0000647 | 163 | 836 | AQULA_009867 |
| PPYR_13497 | Mitochondrial substrate/solute carrier | 285 | 438 | OG0004402 | 379 | 372 | AQULA_003680 |
| PPYR_08917 | LysM domain superfamily | 315 | 398 | OG0002035 | 483 | 278 | AQULA_002396 |
| PPYR_04424 | Domain of unknown function (DUF4782) | 332 | 379 | OG0007447 | 1296 | 101 | AQULA_013946 |
| PPYR_08278 | Protein of unknown function DUF1151 | 348 | 365 | OG0001306 | 430 | 325 | AQULA_000628 |
| PPYR_13261 | Major facilitator superfamily | 404 | 309 | OG0000410 | 158 | 862 | AQULA_007558 |
| PPYR_14848 | Homeobox-like domain superfamily - Abdominal-B-like | 413 | 304 | OG0001849 | 737 | 186 | AQULA_000483 |
| PPYR_11623 | GNS1/SUR4 family | 446 | 281 | OG0008603 | 308 | 449 | AQULA_009341 |
| PPYR_01828 | TLDc domain | 490 | 250 | OG0002035 | 483 | 278 | AQULA_002396 |
| PPYR_03449 | Innexin | 533 | 230 | OG0000992 | 619 | 219 | AQULA_013430 |
| PPYR_05702 | Sulfate permease family | 543 | 225 | OG0007205 | 396 | 357 | AQULA_013064 |
| PPYR_05993 | V-type ATPase, V0 complex, 116 kDa subunit family | 579 | 210 | OG0000381 | 541 | 251 | AQULA_000400 |
| PPYR_04179 | Haemolymph juvenile hormone binding protein | 606 | 202 | OG0002916 | 879 | 152 | AQULA_011187 |
| PPYR_08298 | Peroxisomal membrane protein (Pex16) | 623 | 198 | OG0007339 | 395 | 358 | AQULA_013536 |
| PPYR_06294 | Homeobox-like domain superfamily - Abdominal-B-like | 627 | 197 | OG0001849 | 737 | 186 | AQULA_000483 |
| PPYR_05397 | PDZ superfamily | 773 | 164 | OG0006975 | 367 | 379 | AQULA_012321 |
| PPYR_12625 | Homeobox domain | 796 | 160 | OG0002661 | 1395 | 95 | AQULA_008665 |
| PPYR_08494 | Armadillo-type fold | 846 | 152 | OG0001600 | 986 | 133 | AQULA_008183 |
| PPYR_09217 | Haemolymph juvenile hormone binding protein | 853 | 151 | OG0001089 | 441 | 316 | AQULA_003304 |
| PPYR_01677 | MFS transporter superfamily | 1234 | 108 | OG0000347 | 455 | 302 | AQULA_002485 |
Appendix 4—table 7
Putative lucibufagin compounds from LC-HRAM-MS of P. pyralis adult hemolymph.
Retention time and m/z values are not calibrated to the other samples.
| Assigned ion identity | Ion type | Chemical formula | Expected M/z | Measured M/z | M/z error* (ppm) | Retention time (mins) | Feature area (arb) |
|---|---|---|---|---|---|---|---|
| Core lucibufagin isomer 1 | [M + H]+ | C24H33O8 | 449.2175 | 449.2171 | −0.89 | 7.9 | 6.7E + 05 |
| Core lucibufagin isomer 2 | "" | “” | “” | "" | “” | 9.3 | 1.1E + 07 |
| Monoacetylated lucibufagin isomer 1 | "" | C26H35O9 | 491.2281 | 491.2277 | −0.81 | 10.2 | 4.2E + 07 |
| Core lucibufagin isomer 3 | "" | C24H33O8 | 449.2175 | 449.2171 | −0.89 | 10.8 | 1.7E + 07 |
| Monoacetylated lucibufagin isomer 2 | "" | C26H35O9 | 491.2281 | 491.2277 | −0.81 | 11.4 | 1.1E + 06 |
| Monoacetylated lucibufagin isomer 3 | "" | “” | “” | "" | “” | 11.9 | 1.8E + 07 |
| Monoacetylated lucibufagin isomer 4 | "" | “” | “” | "" | “” | 13.0 | 2.7E + 08 |
| Monoacetylated lucibufagin isomer 5 | "" | “” | “” | "" | “” | 13.2 | 6.0E + 07 |
| Monoacetylated lucibufagin isomer 6 | "" | “” | “” | "" | “” | 14.5 | 6.2E + 06 |
| Diacetylated lucibufagin isomer 1 | "" | C28H37O10 | 533.2387 | 533.2385 | −0.37 | 15.1 | 4.0E + 09 |
| Diacetylated lucibufagin isomer 2 | "" | “” | “” | "" | “” | 15.4 | 1.9E + 09 |
| Monoacetylated, mono propylated lucibufagin isomer 1 | "" | C29H39O10 | 547.2543 | 547.2542 | −0.18 | 17.0 | 1.5E + 07 |
| Monoacetylated, mono propylated lucibufagin isomer 2 | "" | “” | “” | "" | “” | 17.4 | 2.8E + 08 |
| Monoacetylated, mono propylated lucibufagin isomer 3 | "" | “” | “” | "" | “” | 17.7 | 1.2E + 08 |
| Dipropylated lucibufagin isomer 1 | "" | C30H41O10 | 561.2700 | 561.2695 | −0.89 | 18.9 | 1.4E + 08 |
| Dipropylated lucibufagin isomer 2 | "" | “” | “” | "" | “” | 19.5 | 3.9E + 07 |
| Dipropylated lucibufagin isomer 3 | "" | “” | “” | "" | “” | 19.8 | 1.8E + 08 |
Appendix 4—table 8
Putative lucibufagin compounds from LC-HRAM-MS of P. pyralis larval partial body extracts.
Retention time and m/z values are not calibrated to the other samples. *=m/z error and expected m/z extrapolated from ions with similar m/z, and chemical formula predicted from resulting extrapolated m/z. **=Likely chemical formula cannot be determined due to many possible chemical formula from the expected m/z.
| Assigned ion identity | Ion type | Chemical formula | Expected m/z | Measured m/z | m/z error (ppm) | Retention time (mins) | Feature area (arb) |
|---|---|---|---|---|---|---|---|
| Core lucibufagin isomer 2 | [M + H]+ | C24H33O8 | 449.2175 | 449.2215 | +8.9 | 9.15 | 8.5E + 06 |
| Monoacetylated lucibufagin isomer 1 | “” | C26H35O9 | 491.2277 | 491.2326 | +9.9 | 10.04 | 1.2E + 07 |
| Unknown | unknown | C28H39O10* | 535.2543* | 535.2592 | +9.1* | 12.40 | 1.6E + 07 |
| Unknown | unknown | C24H38NO6* | 436.2695* | 436.2735 | +9.1* | 13.30 | 2.2E + 07 |
| Unknown | unknown | C27H45N2O8* | 525.3173* | 525.3221 | +9.1* | 13.35 | 1.3E + 08 |
| Unknown | unknown | C24H40NO7* | 454.2799* | 454.2840 | +9.1* | 13.73 | 1.3E + 07 |
| Diacetylated lucibufagin isomer 1 | [M + H]+ | C28H37O10 | 533.2387 | 533.2426 | +7.3 | 14.93 | 1.7E + 09 |
| Diacetylated lucibufagin isomer 2 | [M + H]+ | “” | “” | 533.2426 | +7.3 | 15.16 | 3.5E + 08 |
| Unknown | Unknown | C29H46NO8* | 536.3216* | 536.3256 | +7.3* | 16.57 | 4.1E + 07 |
| Unknown | Unknown | Unknown** | 563.2854* | 563.2896 | +7.3* | 16.80 | 1.3E + 07 |
| Unknown | Unknown | C26H31O7 | 455.2056 | 455.2097 | +9.1* | 17.22 | 5.8E + 07 |
| Dipropylated lucibufagin isomer 3 | Unknown | C30H41O10 | 561.2700 | 561.2738 | +6.7 | 19.53 | 2.0E + 09 |
| Dipropylated lucibufagin isomer 4 | Unknown | C30H41O10 | 561.2700 | 561.2738 | +6.7 | 19.82 | 2.2E + 08 |
Appendix 4—table 9
Putative lucibufagin [M + H]+ exact masses adjusted for instrument run specific systematic m/z error (Figure 6B).
Used for multi-ion-chromatogram (MIC) traces in Figure 6B.
| Chemical formula | Predicted exact mass | Exact mass adjusted to P. pyralis hemolymph data (+0.6 ppm) | Exact mass adjusted to P. pyralis partial larval body data (+9.9 ppm) | Exact mass adjusted to A. lateralis hemolymph data (+1.6 ppm) | Exact mass adjusted to A. lateralis larval body data (+1.1 ppm) | Exact mass adjusted to I. luminosus thorax data (+0.6 ppm) |
|---|---|---|---|---|---|---|
| C24H33O8 | 449.2175 | 449.2178 | 449.2219 | 449.2182 | 449.2180 | 449.2178 |
| C24H38NO6* | 436.2699 | 436.2702 | 436.2742 | 436.2706 | 436.2704 | 436.2702 |
| C24H40NO7* | 454.2804 | 454.2807 | 454.2849 | 454.2811 | 454.2809 | 454.2807 |
| C26H31O7 | 455.2069 | 455.2072 | 455.2114 | 455.2076 | 455.2074 | 455.2072 |
| C26H35O9 | 491.2281 | 491.2284 | 491.2330 | 491.2289 | 491.2286 | 491.2284 |
| C27H45N2O8* | 525.3175 | 525.3178 | 525.3227 | 525.3183 | 525.3181 | 525.3178 |
| C28H37O10 | 533.2386 | 533.2389 | 533.2439 | 533.2395 | 533.2392 | 533.2389 |
| C28H39O10* | 535.2543 | 535.2546 | 535.2596 | 535.2552 | 535.2549 | 535.2546 |
| C29H39O10 | 547.2543 | 547.2546 | 547.2597 | 547.2552 | 547.2549 | 547.2546 |
| C29H46NO8* | 536.3223 | 536.3226 | 536.3276 | 536.3232 | 536.3229 | 536.3226 |
| C30H41O10 | 561.2699 | 561.2702 | 561.2755 | 561.2708 | 561.2705 | 561.2702 |
-
*=Chemical formula assigned for structurally unclear putative lucibufagins
Appendix 4—table 10
Relative quantification of A. lateralis features identified by lucibufagin MS2 similarity search
https://doi.org/10.7554/eLife.36495.082| Assigned identity | M/z | Chemical formula | RT (mins) | Similarity score | # of ions matched | A. lateralis feature area (arb) | P. pyralis feature area (arb) |
|---|---|---|---|---|---|---|---|
| Unknown | 460.2462 | C22H38NO7P*; C25H29N7O2* | 15.27 | 4.10E + 11 | 34 | 7.04E + 08 | 0.00E + 00 |
| "" | 657.2229 | N.D. | 12.01 | 9.50E + 11 | 29 | 6.13E + 07 | "" |
| "" | 414.2043 | N.D. | 18.07 | 1.20E + 11 | 25 | 5.61E + 06 | "" |
| "" | 381.2176 | C23H28N2O3* | 15.77 | 3.80E + 11 | 18 | 1.22E + 08 | "" |
| "" | 476.1839 | N.D. | 15.93 | 3.80E + 11 | 16 | 9.87E + 06 | "" |
| "" | 456.2148 | N.D. | 19 | 2.30E + 11 | 14 | 5.03E + 06 | "" |
| "" | 351.228 | N.D. | 19.42 | 2.60E + 11 | 13 | 1.56E + 07 | "" |
| "" | 479.1948 | N.D. | 19.83 | 2.20E + 11 | 12 | 1.11E + 07 | "" |
-
*Determined with Sirius (MS2 analysis), and MZmine2 (isotope pattern analysis).
N.D., Not determined
Appendix 5—table 1
Best hits from BLASTP of PpyrOMLV proteins against the NCBI database
https://doi.org/10.7554/eLife.36495.087| Genome segment | Size (nt) | Gene product (aa) | Best hit | Best hit taxonomy | Query cover | E value | Identity |
|---|---|---|---|---|---|---|---|
| PpyrOMLV1-PB1 | 2510 | 801 PB1 | Wuhan Mothfly Virus | Orthomyxoviridae | 83% | 0.0 | 51% |
| PpyrOMLV1-PA | 2346 | 754 PA | Hubei earwig virus 1 | Orthomyxoviridae | 98% | 4.00E-137 | 35% |
| PpyrOMLV1-HA | 1667 | 526 HA | Tjuloc virus | Orthomyxoviridae | 91% | 9.00E-25 | 25% |
| PpyrOMLV1-PB2 | 2517 | 804 PB2 | Hubei earwig virus 1 | Orthomyxoviridae | 91% | 3.00E-118 | 31% |
| PpyrOMLV1-N | 1835 | 562 N | Hubei earwig virus 1 | Orthomyxoviridae | 93% | 8.00E-74 | 30% |
| PpyrOMLV2-PB1 | 2495 | 802 PB1 | Hubei orthomyxo- like virus 1 | Orthomyxoviridae | 93% | 0.0 | 48% |
| PpyrOMLV2-PA | 2349 | 762 PA | Hubei earwig virus 1 | Orthomyxoviridae | 98% | 1.00E-107 | 31% |
| PpyrOMLV2-HA | 1668 | 525 HA | Wellfleet Bay virus | Orthomyxoviridae | 82% | 3.00E-40 | 26% |
| PpyrOMLV2-PB2 | 2506 | 801 PB2 | Hubei earwig virus 1 | Orthomyxoviridae | 96% | 3.00E-86 | 27% |
| PpyrOMLV2-N | 1738 | 528 N | Hubei earwig virus 1 | Orthomyxoviridae | 95% | 6.00E-82 | 32% |
Appendix 5—table 2
InterProScan domain annotation of PpyrOMLV proteins.
https://doi.org/10.7554/eLife.36495.088| Genome product | Annotation | Start | End | Length | Database | Id | InterPro ID | InterPro name |
|---|---|---|---|---|---|---|---|---|
| PpyrOMLV1 -PB1 | Flu_PB1 | 48 | 752 | 705 | PFAM | PF00602 | IPR001407 | RNA_pol_PB1_ influenza |
| RDRP _SSRNA | 330 | 529 | 200 | PROSITE_ PROFILES | PS50525 | IPR007099 | RNA-dir_pol_ NSvirus | |
| PpyrOMLV2 -PB1 | Flu_PB1 | 54 | 766 | 713 | PFAM | PF00602 | IPR001407 | RNA_pol_PB1_ influenza |
| RDRP _SSRNA | 337 | 539 | 203 | PROSITE_ PROFILES | PS50525 | IPR007099 | RNA-dir_pol_ NSvirus | |
| PpyrOMLV1 -PB2 | Flu_PB2 | 13 | 421 | 409 | PFAM | PF00604 | IPR001591 | RNA_pol_PB2_ orthomyxovir |
| PpyrOMLV2 -PB2 | Flu_PB2 | 13 | 415 | 403 | PFAM | PF00604 | IPR001591 | RNA_pol_PB2_ orthomyxovir |
| PpyrOMLV1 -HA | SignalP-noTM | 1 | 19 | 19 | SIGNALP_ EUK | SignalP-noTM | Unintegrated | |
| Baculo _gp64 | 108 | 432 | 325 | PFAM | PF03273 | IPR004955 | Baculovirus_ Gp64 | |
| PpyrOMLV2 -HA | SignalP-noTM | 1 | 21 | 21 | SIGNALP_ EUK | SignalP-noTM | Unintegrated | |
| Baculo _gp64 | 66 | 426 | 361 | PFAM | PF03273 | IPR004955 | Baculovirus_ Gp64 | |
| PpyrOMLV1 -PA | Flu_PA | 663 | 736 | 74 | PFAM | PF00603 | IPR001009 | RNA-dir_pol_ influenzavirus |
| PpyrOMLV2 -PA | Flu_PA | 667 | 740 | 74 | PFAM | PF00603 | IPR001009 | RNA-dir_pol_ influenzavirus |
| PpyrOMLV1 -PB1 | flu NP-like | 94 | 459 | 366 | SUPER FAMILY | SSF161003 | Unintegrated | |
| PpyrOMLV2 -PB1 | flu NP-like | 363 | 483 | 121 | SUPER FAMILY | SSF161003 | Unintegrated |
Appendix 5—table 3
Total reads mapped to PpyrOMLV genome segments from P. pyralis RNA-Seq datasets.
https://doi.org/10.7554/eLife.36495.089| SRR 3883773 | SRR 3883772 | SRR 3883758 | SRR 3883771 | SRR 3883770 | SRR 3883769 | SRR 3883768 | SRR 3883767 | SRR 3883765 | SRR 3883764 | SRR 3883763 | SRR 3883762 | |
|---|---|---|---|---|---|---|---|---|---|---|---|---|
| Ppyr OMLV1 HA | 11 | 541 | 2 | 160 | 0 | 4 | 881 | 2 | 0 | 2 | 199 | 2848 |
| Ppyr OMLV1 NP | 0 | 321 | 0 | 141 | 0 | 0 | 523 | 0 | 0 | 0 | 120 | 1460 |
| Ppyr OMLV1 PA | 3 | 256 | 0 | 95 | 0 | 0 | 306 | 1 | 0 | 5 | 100 | 660 |
| Ppyr OMLV1 PB1 | 2 | 364 | 2 | 208 | 0 | 4 | 820 | 0 | 0 | 0 | 669 | 1464 |
| Ppyr OMLV1 PB2 | 5 | 194 | 0 | 152 | 2 | 0 | 319 | 2 | 0 | 0 | 106 | 696 |
| Ppyr OMLV2 HA | 12 | 444 | 266 | 124 | 54 | 247 | 549 | 38 | 22 | 10 | 232 | 710 |
| Ppyr OMLV2 NP | 29 | 526 | 275 | 144 | 66 | 299 | 653 | 24 | 205 | 57 | 274 | 1067 |
| Ppyr OMLV2 PA | 12 | 88 | 216 | 72 | 40 | 204 | 97 | 18 | 15 | 8 | 50 | 838 |
| Ppyr OMLV2 PB1 | 9 | 115 | 75 | 72 | 26 | 78 | 76 | 8 | 74 | 57 | 146 | 493 |
| Ppyr OMLV2 PB2 | 5 | 50 | 57 | 67 | 47 | 131 | 110 | 22 | 85 | 72 | 173 | 728 |
| SRR 3883761 | SRR 3883760 | SRR 3883759 | SRR 3883757 | SRR 3883756 | SRR 3883766 | SRR 2103867 | SRR 2103849 | SRR 2103848 | Ppyr _larvae | Ppyr _Female | Ppyr _eggs | |
| Ppyr OMLV1 HA | 0 | 578 | 2 | 6 | 867 | 0 | 0 | 0 | 0 | 1664 | 7826 | 15586 |
| Ppyr OMLV1 NP | 0 | 289 | 0 | 3 | 647 | 0 | 2 | 0 | 0 | 644 | 5216 | 6562 |
| Ppyr OMLV1 PA | 0 | 124 | 0 | 2 | 626 | 0 | 0 | 0 | 0 | 1264 | 3692 | 9564 |
| Ppyr OMLV1 PB1 | 2 | 460 | 0 | 3 | 1607 | 2 | 0 | 0 | 0 | 2824 | 7144 | 15952 |
| Ppyr OMLV1 PB2 | 0 | 188 | 0 | 2 | 848 | 0 | 0 | 0 | 0 | 648 | 2562 | 10568 |
| Ppyr OMLV2 HA | 13 | 236 | 23 | 546 | 337 | 286 | 43 | 190 | 415 | 0 | 0 | 0 |
| Ppyr OMLV2 NP | 32 | 248 | 22 | 501 | 482 | 196 | 51 | 127 | 432 | 0 | 0 | 0 |
| Ppyr OMLV2 PA | 14 | 93 | 6 | 234 | 222 | 131 | 75 | 54 | 97 | 0 | 0 | 0 |
| Ppyr OMLV2 PB1 | 29 | 90 | 4 | 168 | 180 | 63 | 22 | 96 | 190 | 0 | 0 | 0 |
| Ppyr OMLV2 PB2 | 49 | 90 | 6 | 256 | 230 | 94 | 22 | 57 | 96 | 0 | 0 | 0 |
Appendix 5—table 4
FPKM of reads mapped to PpyrOMLV genome segments from P. pyralis RNA-Seq datasets.
https://doi.org/10.7554/eLife.36495.090| SRR 3883773 | SRR 3883772 | SRR 3883758 | SRR 3883771 | SRR 3883770 | SRR 3883769 | SRR 3883768 | SRR 3883767 | SRR 3883765 | SRR 3883764 | SRR 3883763 | SRR 3883762 | |
|---|---|---|---|---|---|---|---|---|---|---|---|---|
| Ppyr OMLV1 HA | 19.10 | 0.32 | 0.05 | 6.46 | 0.00 | 0.11 | 30.69 | 0.05 | 0.00 | 0.08 | 4.07 | 69.54 |
| Ppyr OMLV1 NP | 10.37 | 0.00 | 0.00 | 5.21 | 0.00 | 0.00 | 16.66 | 0.00 | 0.00 | 0.00 | 2.24 | 32.61 |
| Ppyr OMLV1 PA | 6.46 | 0.06 | 0.00 | 2.74 | 0.00 | 0.00 | 7.62 | 0.02 | 0.00 | 0.13 | 1.46 | 11.52 |
| Ppyr OMLV1 PB1 | 8.53 | 0.04 | 0.04 | 5.57 | 0.00 | 0.07 | 18.95 | 0.00 | 0.00 | 0.00 | 9.07 | 23.72 |
| Ppyr OMLV1 PB2 | 4.50 | 0.10 | 0.00 | 4.03 | 0.05 | 0.00 | 7.29 | 0.03 | 0.00 | 0.00 | 1.42 | 11.16 |
| Ppyr OMLV2 HA | 16.13 | 0.36 | 7.41 | 5.15 | 2.31 | 6.80 | 19.68 | 0.90 | 1.05 | 0.39 | 4.88 | 17.84 |
| Ppyr OMLV2 NP | 17.36 | 0.79 | 6.96 | 5.44 | 2.57 | 7.48 | 21.27 | 0.52 | 8.87 | 2.01 | 5.24 | 24.36 |
| Ppyr OMLV2 PA | 2.21 | 0.25 | 4.17 | 2.07 | 1.19 | 3.89 | 2.41 | 0.30 | 0.49 | 0.21 | 0.73 | 14.58 |
| Ppyr OMLV2 PB1 | 2.73 | 0.18 | 1.37 | 1.95 | 0.73 | 1.40 | 1.78 | 0.12 | 2.30 | 1.44 | 2.01 | 8.10 |
| Ppyr OMLV2 PB2 | 1.18 | 0.10 | 1.03 | 1.81 | 1.31 | 2.34 | 2.56 | 0.34 | 2.63 | 1.81 | 2.36 | 11.88 |
| SRR 3883761 | SRR 3883760 | SRR 3883759 | SRR 3883757 | SRR 3883756 | SRR 3883766 | SRR 2103867 | SRR 2103849 | SRR 2103848 | Ppyr_ larvae | Ppyr_ Female | Ppyr_ eggs | |
| Ppyr OMLV1 HA | 0.00 | 18.29 | 0.08 | 0.21 | 23.44 | 0.00 | 0.00 | 0.00 | 0.00 | 15.89 | 74.25 | 104.49 |
| Ppyr OMLV1 NP | 0.00 | 8.37 | 0.00 | 0.09 | 16.00 | 0.00 | 0.04 | 0.00 | 0.00 | 5.62 | 45.27 | 40.24 |
| Ppyr OMLV1 PA | 0.00 | 2.81 | 0.00 | 0.05 | 12.10 | 0.00 | 0.00 | 0.00 | 0.00 | 8.63 | 25.05 | 45.85 |
| Ppyr OMLV1 PB1 | 0.04 | 9.66 | 0.00 | 0.07 | 28.83 | 0.04 | 0.00 | 0.00 | 0.00 | 17.89 | 44.97 | 70.96 |
| Ppyr OMLV1 PB2 | 0.00 | 3.91 | 0.00 | 0.05 | 15.05 | 0.00 | 0.00 | 0.00 | 0.00 | 4.06 | 15.96 | 46.51 |
| Ppyr OMLV2 HA | 0.43 | 7.68 | 0.95 | 19.30 | 9.38 | 9.74 | 1.02 | 4.94 | 8.95 | 0.00 | 0.00 | 0.00 |
| Ppyr OMLV2 NP | 0.97 | 7.34 | 0.82 | 16.09 | 12.19 | 6.07 | 1.10 | 3.00 | 8.47 | 0.00 | 0.00 | 0.00 |
| Ppyr OMLV2 PA | 0.32 | 2.10 | 0.17 | 5.73 | 4.28 | 3.09 | 1.23 | 0.97 | 1.45 | 0.00 | 0.00 | 0.00 |
| Ppyr OMLV2 PB1 | 0.63 | 1.92 | 0.11 | 3.88 | 3.27 | 1.40 | 0.34 | 1.63 | 2.68 | 0.00 | 0.00 | 0.00 |
| Ppyr OMLV2 PB2 | 1.06 | 1.90 | 0.16 | 5.88 | 4.16 | 2.08 | 0.34 | 0.96 | 1.35 | 0.00 | 0.00 | 0.00 |
Appendix 5—table 5
FEVE hits from BLASTX of PpyrOMLV PB1.
https://doi.org/10.7554/eLife.36495.091| Scaffold | Start | End | Strand | Id with PpOMLV | E value | Coverage | FEVE |
|---|---|---|---|---|---|---|---|
| Ppyr1.2_LG1 | 12787323 | 12786796 | (-) | 56.30% | 8.22E-50 | 39.10% | EVE PB1 like-1 |
| Ppyr1.2_LG1 | 13016647 | 13016120 | (-) | 56.30% | 8.22E-50 | 39.10% | EVE PB1 like-2 |
| Ppyr1.2_LG1 | 34701480 | 34701560 | (+) | 37.00% | 2.88E-26 | 26.70% | EVE PB1 like-3 |
| Ppyr1.2_LG1 | 34701562 | 34701774 | (+) | 37.60% | 2.88E-26 | 30.20% | EVE PB1 like-3 |
| Ppyr1.2_LG1 | 34701801 | 34702214 | (+) | 45.30% | 2.88E-26 | 34.00% | EVE PB1 like-3 |
| Ppyr1.2_LG1 | 35094645 | 35095094 | (+) | 28.10% | 2.15E-10 | 9.50% | EVE PB1 like-4 |
| Ppyr1.2_LG1 | 35110084 | 35109956 | (-) | 53.50% | 2.37E-14 | 4.40% | EVE PB1 like-5 |
| Ppyr1.2_LG1 | 35110214 | 35110107 | (-) | 75.00% | 2.37E-14 | 14.70% | EVE PB1 like-5 |
| Ppyr1.2_LG1 | 35110347 | 35110213 | (-) | 42.60% | 2.37E-14 | 2.90% | EVE PB1 like-5 |
| Ppyr1.2_LG1 | 50031464 | 50031330 | (-) | 64.40% | 1.18E-09 | 10.00% | EVE PB1 like-6 |
| Ppyr1.2_LG1 | 50031498 | 50031457 | (-) | 71.40% | 1.18E-09 | 11.60% | EVE PB1 like-6 |
| Ppyr1.2_LG1 | 50613130 | 50612921 | (+) | 49.40% | 3.71E-11 | 4.90% | EVE PB1 like-7 |
| Ppyr1.2_LG1 | 50673211 | 50673621 | (+) | 38.50% | 1.03E-12 | 9.70% | EVE PB1 like-8 |
| Ppyr1.2_LG1 | 51208464 | 51207634 | (-) | 77.20% | 0 | 56.40% | EVE PB1 like-9 |
| Ppyr1.2_LG1 | 51209399 | 51208467 | (-) | 68.50% | 0 | 53.60% | EVE PB1 like-9 |
| Ppyr1.2_LG1 | 51209556 | 51209398 | (-) | 71.70% | 0 | 39.20% | EVE PB1 like-9 |
| Ppyr1.2_LG1 | 61871682 | 61872158 | (+) | 31.10% | 2.84E-23 | 36.00% | EVE PB1 like-10 |
| Ppyr1.2_LG1 | 61872158 | 61872319 | (+) | 46.30% | 2.84E-23 | 28.30% | EVE PB1 like-10 |
| Ppyr1.2_LG1 | 61872355 | 61872456 | (+) | 41.20% | 2.84E-23 | 27.00% | EVE PB1 like-10 |
| Ppyr1.2_LG1 | 61930528 | 61930205 | (-) | 38.00% | 3.58E-27 | 30.90% | EVE PB1 like-11 |
| Ppyr1.2_LG1 | 61930686 | 61930504 | (-) | 63.60% | 3.58E-27 | 35.90% | EVE PB1 like-11 |
| Ppyr1.2_LG1 | 68038999 | 68039073 | (+) | 60.00% | 7.73E-12 | 6.60% | EVE PB1 like-12 |
| Ppyr1.2_LG1 | 68039072 | 68039314 | (+) | 40.70% | 7.73E-12 | 5.00% | EVE PB1 like-12 |
| Ppyr1.2_LG1 | 68039289 | 68039330 | (+) | 64.30% | 7.73E-12 | 8.00% | EVE PB1 like-12 |
| Ppyr1.2_LG1 | 68128820 | 68129008 | (+) | 51.50% | 1.89E-06 | 4.90% | EVE PB1 like-13 |
| Ppyr1.2_LG2 | 34545814 | 34545680 | (-) | 58.70% | 3.84E-06 | 7.20% | EVE PB1 like-14 |
| Ppyr1.2_LG2 | 34546169 | 34545801 | (-) | 52.80% | 1.16E-31 | 34.10% | EVE PB1 like-14 |
Appendix 5—table 6
FEVE hits from BLASTX of PpyrOMLV PB2.
https://doi.org/10.7554/eLife.36495.092| Scaffold | Start | End | Strand | Id with PpOMLV | E value | Coverage | FEVE |
|---|---|---|---|---|---|---|---|
| Ppyr1.2_LG1 | 50313869 | 50314219 | (+) | 82.10% | 6.91E-54 | 48.30% | EVE PB2 like-1 |
| Ppyr1.2_LG1 | 50314216 | 50315016 | (+) | 82.40% | 1.92E-142 | 57.90% | EVE PB2 like-1 |
| Ppyr1.2_LG1 | 50315772 | 50315002 | (-) | 89.10% | 9.97E-145 | 60.60% | EVE PB2 like-1 |
| Ppyr1.2_LG1 | 58707403 | 58706942 | (-) | 52.60% | 6.19E-42 | 35.80% | EVE PB2 like-2 |
Appendix 5—table 7
FEVE hits from BLASTX of PpyrOMLV PA.
https://doi.org/10.7554/eLife.36495.093| Scaffold | Start | End | Strand | Id with PpOMLV | E value | Coverage | FEVE |
|---|---|---|---|---|---|---|---|
| Ppyr1.2_LG1 | 34977392 | 34977231 | (-) | 48.10% | 7.73E-07 | 3.50% | EVE PA like-1 |
| Ppyr1.2_LG1 | 62052289 | 62052023 | (-) | 28.70% | 8.92E-11 | 7.10% | EVE PA like-2 |
| Ppyr1.2_LG1 | 62117077 | 62116811 | (-) | 28.70% | 1.22E-10 | 7.10% | EVE PA like-3 |
| Ppyr1.2_LG1 | 62117493 | 62117101 | (-) | 26.30% | 1.22E-10 | 8.60% | EVE PA like-3 |
| Ppyr1.2_LG1 | 68122348 | 68122440 | (+) | 77.40% | 3.40E-06 | 15.70% | EVE PA like-4 |
Appendix 5—table 8
FEVE hits from BLASTX of PpyrOMLV NP
https://doi.org/10.7554/eLife.36495.094| Scaffold | Start | End | Strand | Id with PpOMLV | E value | Coverage | FEVE |
|---|---|---|---|---|---|---|---|
| Ppyr1.2_LG1 | 181303 | 181404 | (+) | 79.40% | 7.01E-09 | 17.90% | EVE NP like-1 |
| Ppyr1.2_LG1 | 1029425 | 1029568 | (+) | 93.80% | 9.59E-21 | 27.40% | EVE NP like-2 |
| Ppyr1.2_LG1 | 2027860 | 2027438 | (-) | 35.50% | 3.00E-21 | 30.80% | EVE NP like-3 |
| Ppyr1.2_LG1 | 36568324 | 36568551 | (+) | 42.10% | 8.99E-11 | 7.20% | EVE NP like-4 |
| Ppyr1.2_LG1 | 52877256 | 52877086 | (-) | 68.40% | 3.87E-15 | 14.60% | EVE NP like-5 |
| Ppyr1.2_LG1 | 59927414 | 59927271 | (+) | 93.80% | 5.60E-20 | 26.40% | EVE NP like-6 |
| Ppyr1.2_LG3 | 17204346 | 17204122 | (-) | 46.70% | 7.60E-13 | 7.10% | EVE NP like-7 |
| Ppyr1.2_LG3 | 31635344 | 31635030 | (-) | 35.80% | 3.30E-08 | 10.00% | EVE NP like-8 |
| Ppyr1.2_LG3 | 50175821 | 50175922 | (+) | 79.40% | 7.01E-09 | 17.90% | EVE NP like-9 |
| Ppyr1.2_LG4 | 27811681 | 27811758 | (+) | 38.50% | 3.22E-13 | 2.50% | EVE NP like-10 |
| Ppyr1.2_LG4 | 27811853 | 27812179 | (+) | 39.00% | 3.22E-13 | 10.90% | EVE NP like-10 |
Additional files
-
Transparent reporting form
- https://doi.org/10.7554/eLife.36495.018
Download links
A two-part list of links to download the article, or parts of the article, in various formats.
Downloads (link to download the article as PDF)
Open citations (links to open the citations from this article in various online reference manager services)
Cite this article (links to download the citations from this article in formats compatible with various reference manager tools)
Firefly genomes illuminate parallel origins of bioluminescence in beetles
eLife 7:e36495.
https://doi.org/10.7554/eLife.36495


