Inert and seed-competent tau monomers suggest structural origins of aggregation
- University of Texas Southwestern Medical Center, United States
- University of Delaware, United States
- Washington University in St. Louis, United States
Figures
Figure 1
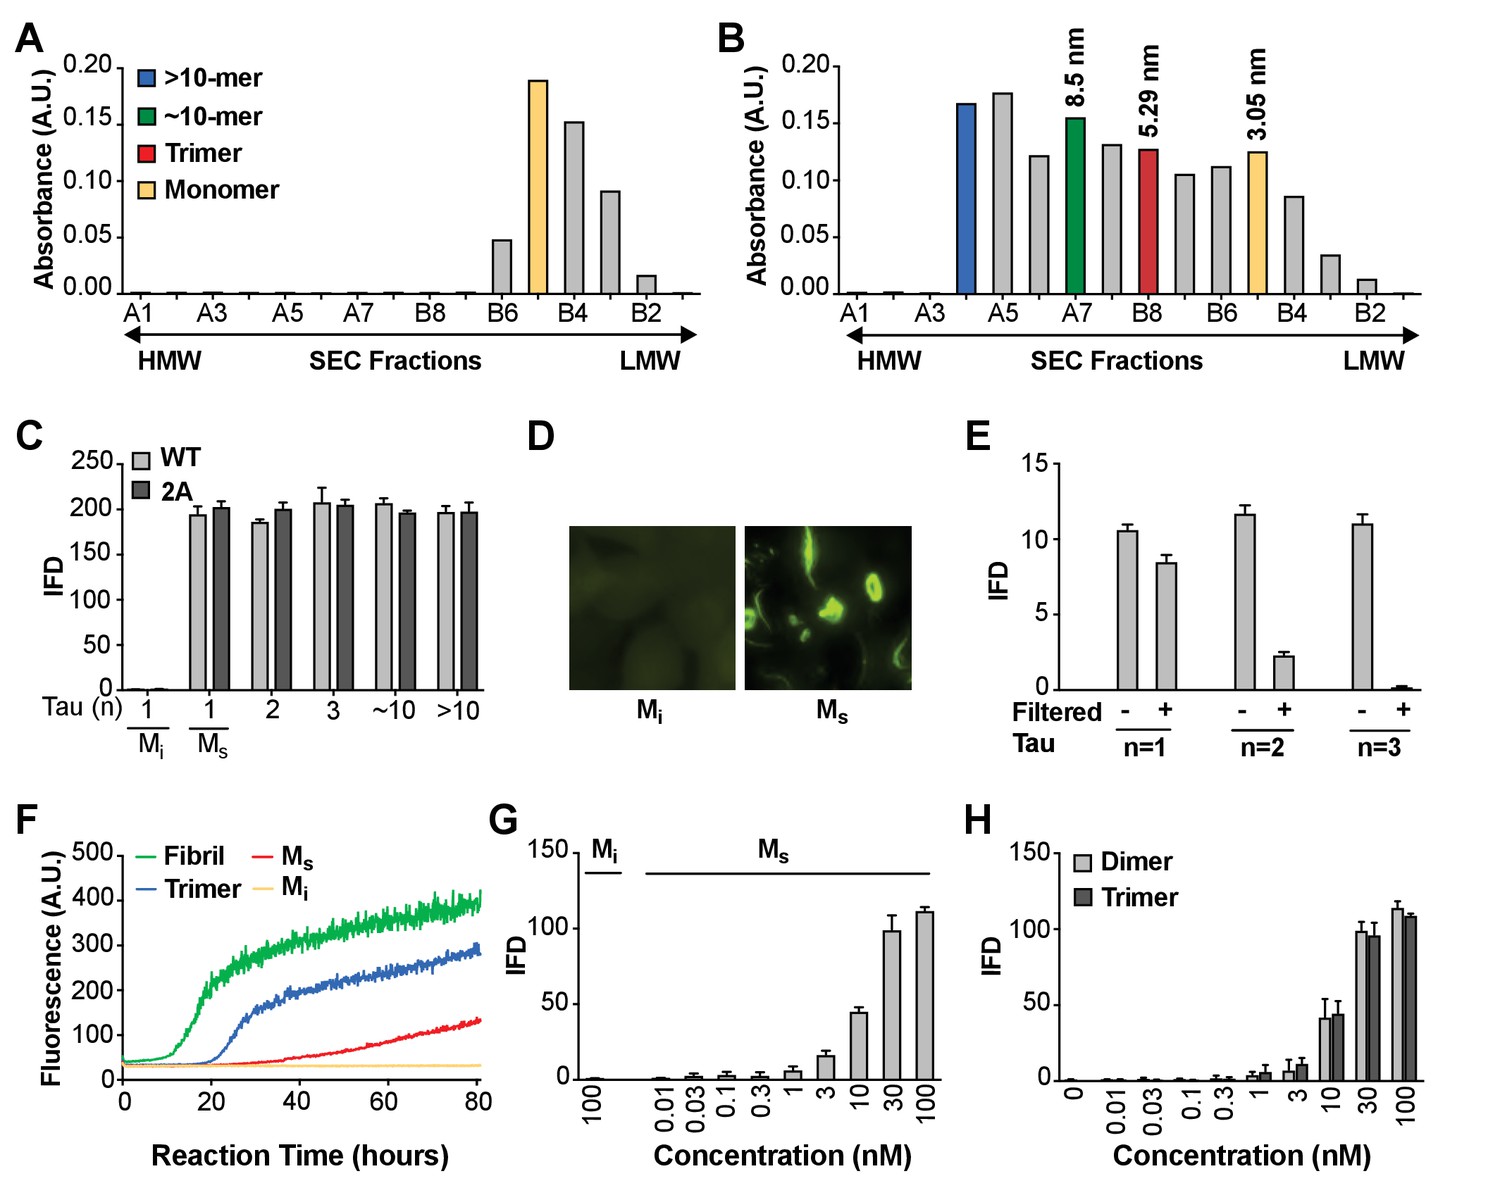
Seeding activity of tau monomer in cells and in vitro.
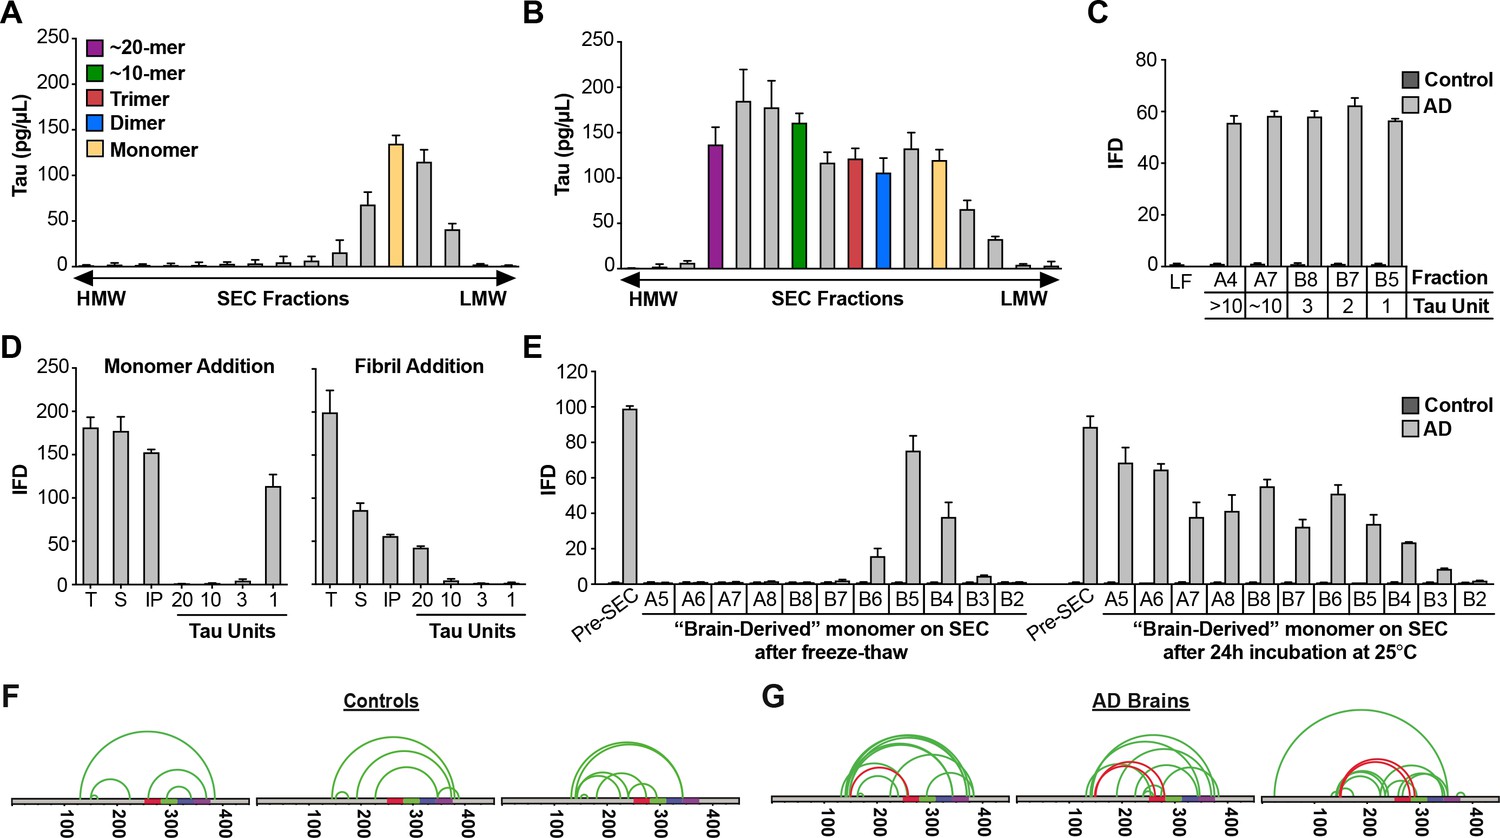
(A, B) FL Cys-Tau(2A) was labeled with Alexa488 and resolved by SEC (A), or was fibrillized in the presence of heparin, labeled with Alexa488, sonicated, and the assemblies resolved by SEC (B). The column was calibrated using standards of the indicated hydrodynamic radii. Color codes indicate the putative assembly units. (C) Tau assemblies were seeded into tau RD-CFP/YFP biosensor cells. Mi represents ‘inert’ monomer purified in (A), which had no seeding activity; Ms represents ‘seed-competent’ monomer purified in (B), which induced intracellular tau aggregation (p<0.001). (D) FL WT tau and FL Cys-Tau(2A) were similarly fibrillized, sonicated, and the fragments resolved by SEC. Seeding activity of each fraction was determined. Ms and larger assemblies of both forms of tau exhibited seeding activity, but not Mi. IFD = Integrated FRET Density. (E) Tau assemblies of n = 1,2,3 were passed through a 100kD size cutoff filter. Filtration had no effect on the Ms fraction, whereas it reduced seeding of assemblies of n = 2 or 3. (F) Tau fibrils, trimer, or monomer were used to induce fibrillization in vitro of full-length (0N4R) tau, measured by induced thioflavin fluorescence. Mi had no seeding activity, whereas Ms, trimer, and unfractionated fibrils had strong seeding activity. (G,H) Titration of assemblies was performed. (G) Ms exhibited an EC50 of approximately 10 nM (monomer equivalent); (H) Dimer and trimer had similar potencies. Concentration is reflected as monomer equivalent. See Figure 1—source data 1.
-
Figure 1—source data 1
Data for Mi and Ms seeding activity in cells and in vitro.
- https://doi.org/10.7554/eLife.36584.004
Figure 2
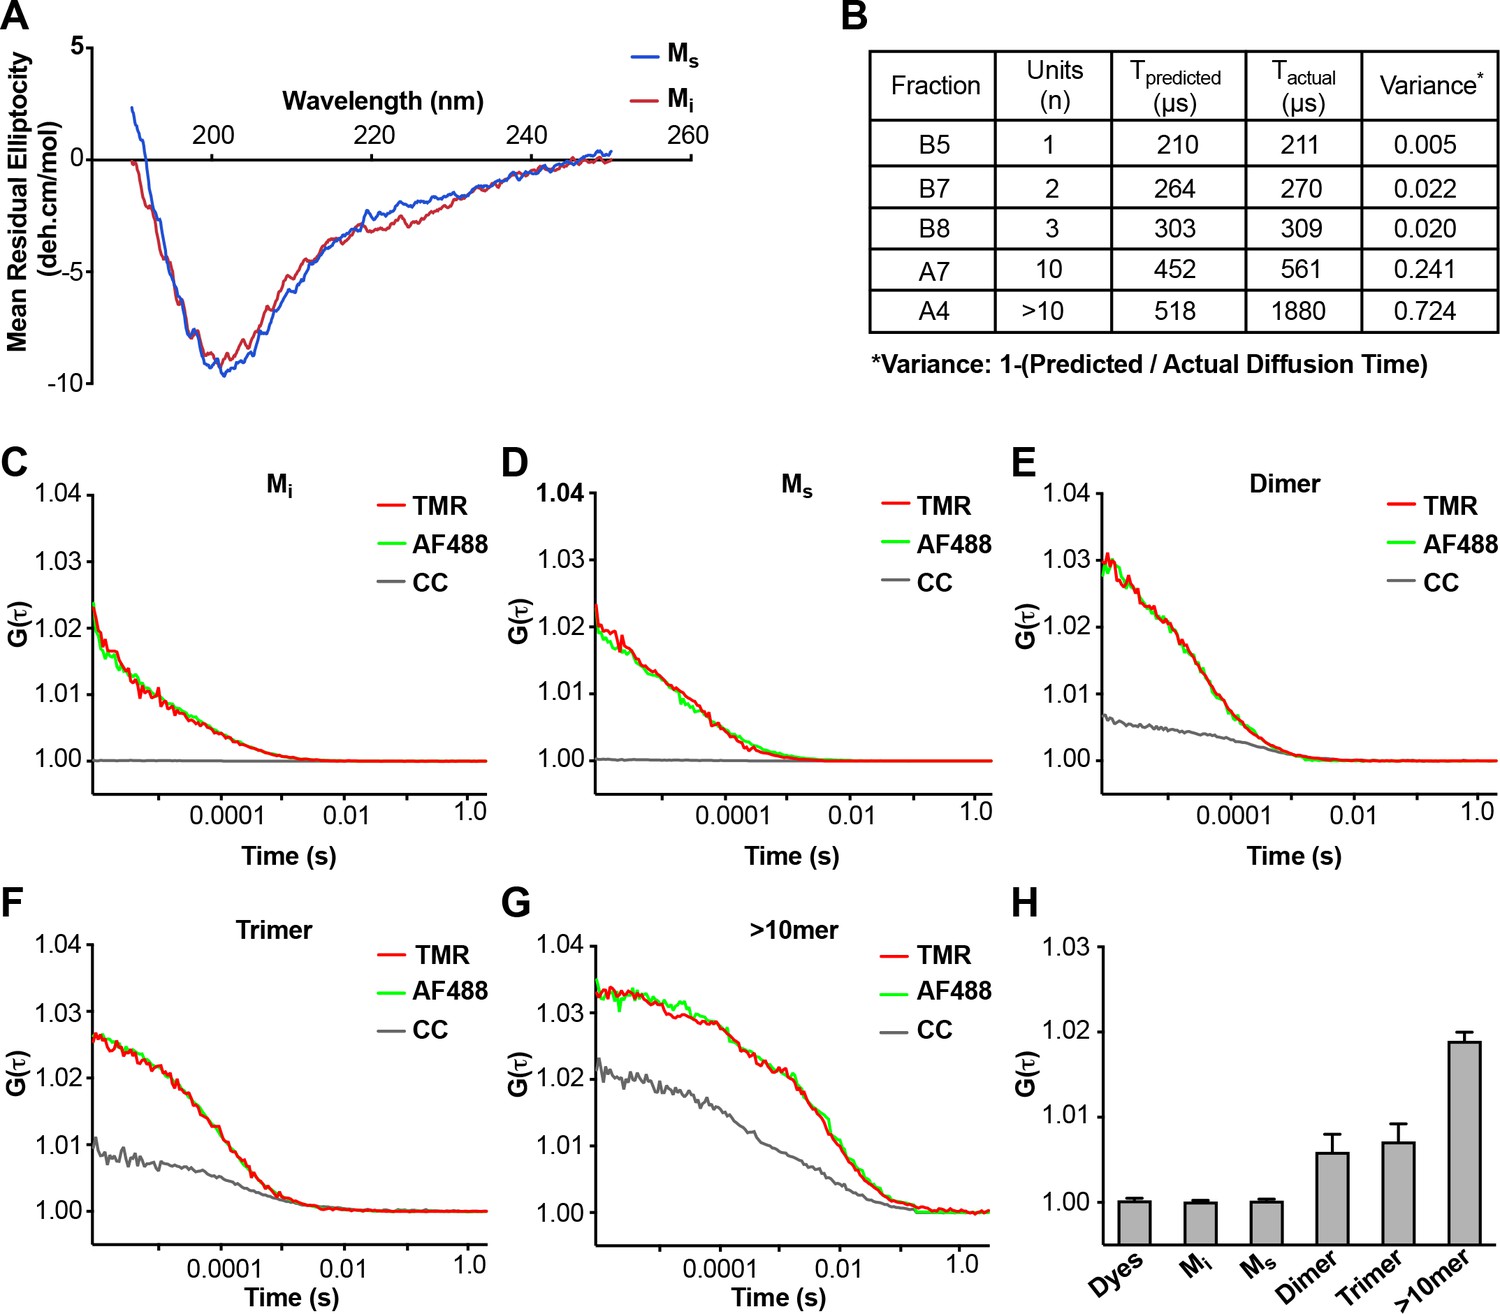
Analyses of Mi and Ms by CD and FCS.
(A) CD spectra of Mi and Ms were similar. (B) FCS Diffusion times for Mi, MS, dimer, trimer, and ~10 mer, and the cross-correlation for Mi, Ms, dimer, trimer, and ≥10 mer were determined after labeling of fibrils with Alexa488, or double labeling additionally with tetramethylrhodamine prior to sonication. Table reflects the predicted diffusion time and the actual diffusion time. The variance between predicted vs. observed times is reported. (C–G) FCS for double-labeled tau assemblies. Cross correlation (CC) between the two dyes is indicated in grey lines. (H) Summary of FCS cross-correlation, including free dyes. Neither free dye, Mi nor Ms showed any cross-correlation, indicating that single species predominate. All multimeric assemblies exhibited cross-correlation, indicating detection of both dyes within a single particle. See Figure 2—source data 1.
-
Figure 2—source data 1
Data for CD and FCS of Mi and Ms.
- https://doi.org/10.7554/eLife.36584.006
Figure 3
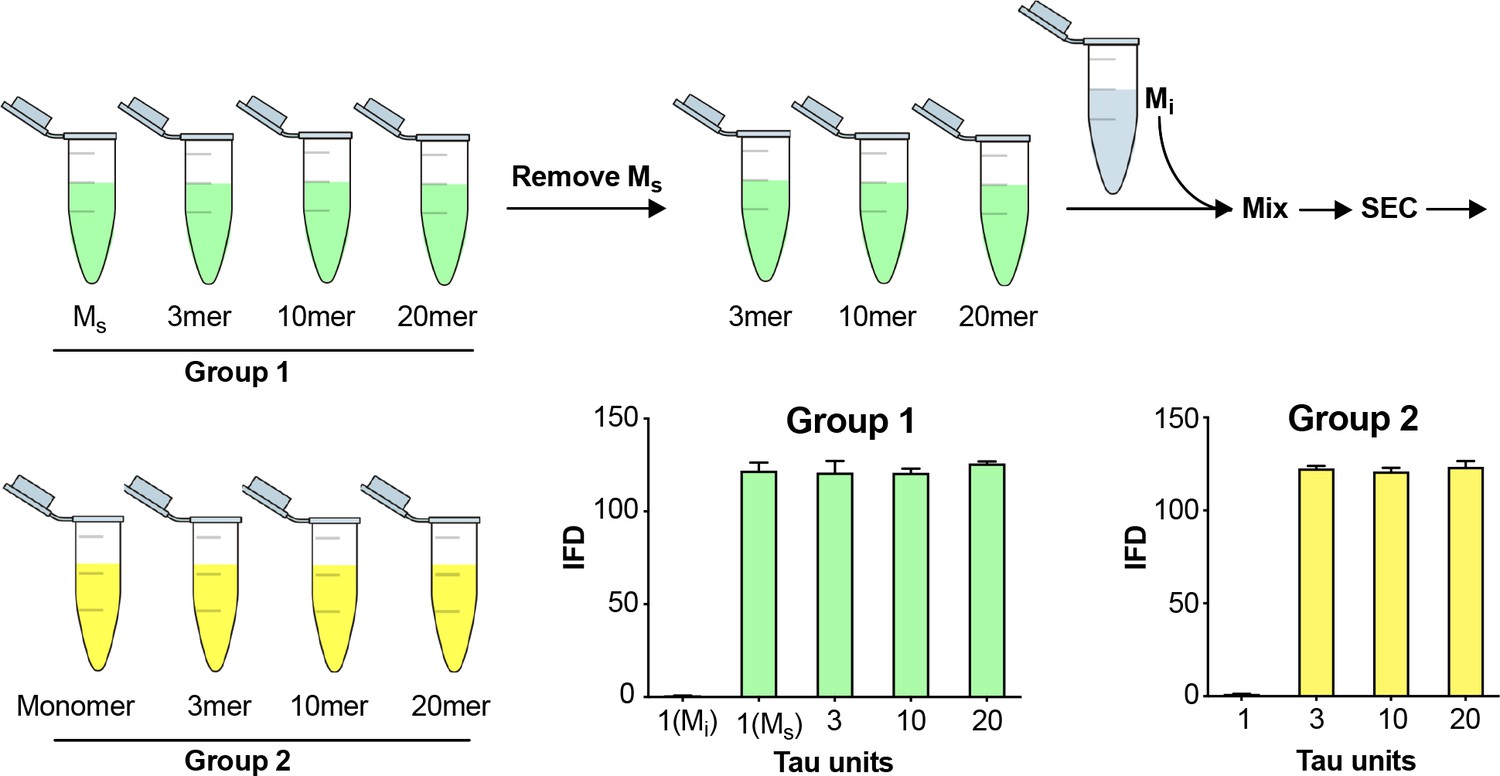
Fidelity of SEC purification of assemblies.
SEC fidelity was tested by isolating Ms from fractions after fibril sonication. Remaining fractions were combined with Mi, and the mix was re-isolated by SEC. In Group 1, after the first isolation, the monomer fraction (which contains Ms) contained seeding activity. In Group 2, after the second purification by SEC, the monomer fraction (which contains Mi spiked in) did not exhibit seeding activity. See Figure 3—source data 1.
-
Figure 3—source data 1
Data for fidelity of SEC purification of assemblies.
- https://doi.org/10.7554/eLife.36584.008
Figure 4
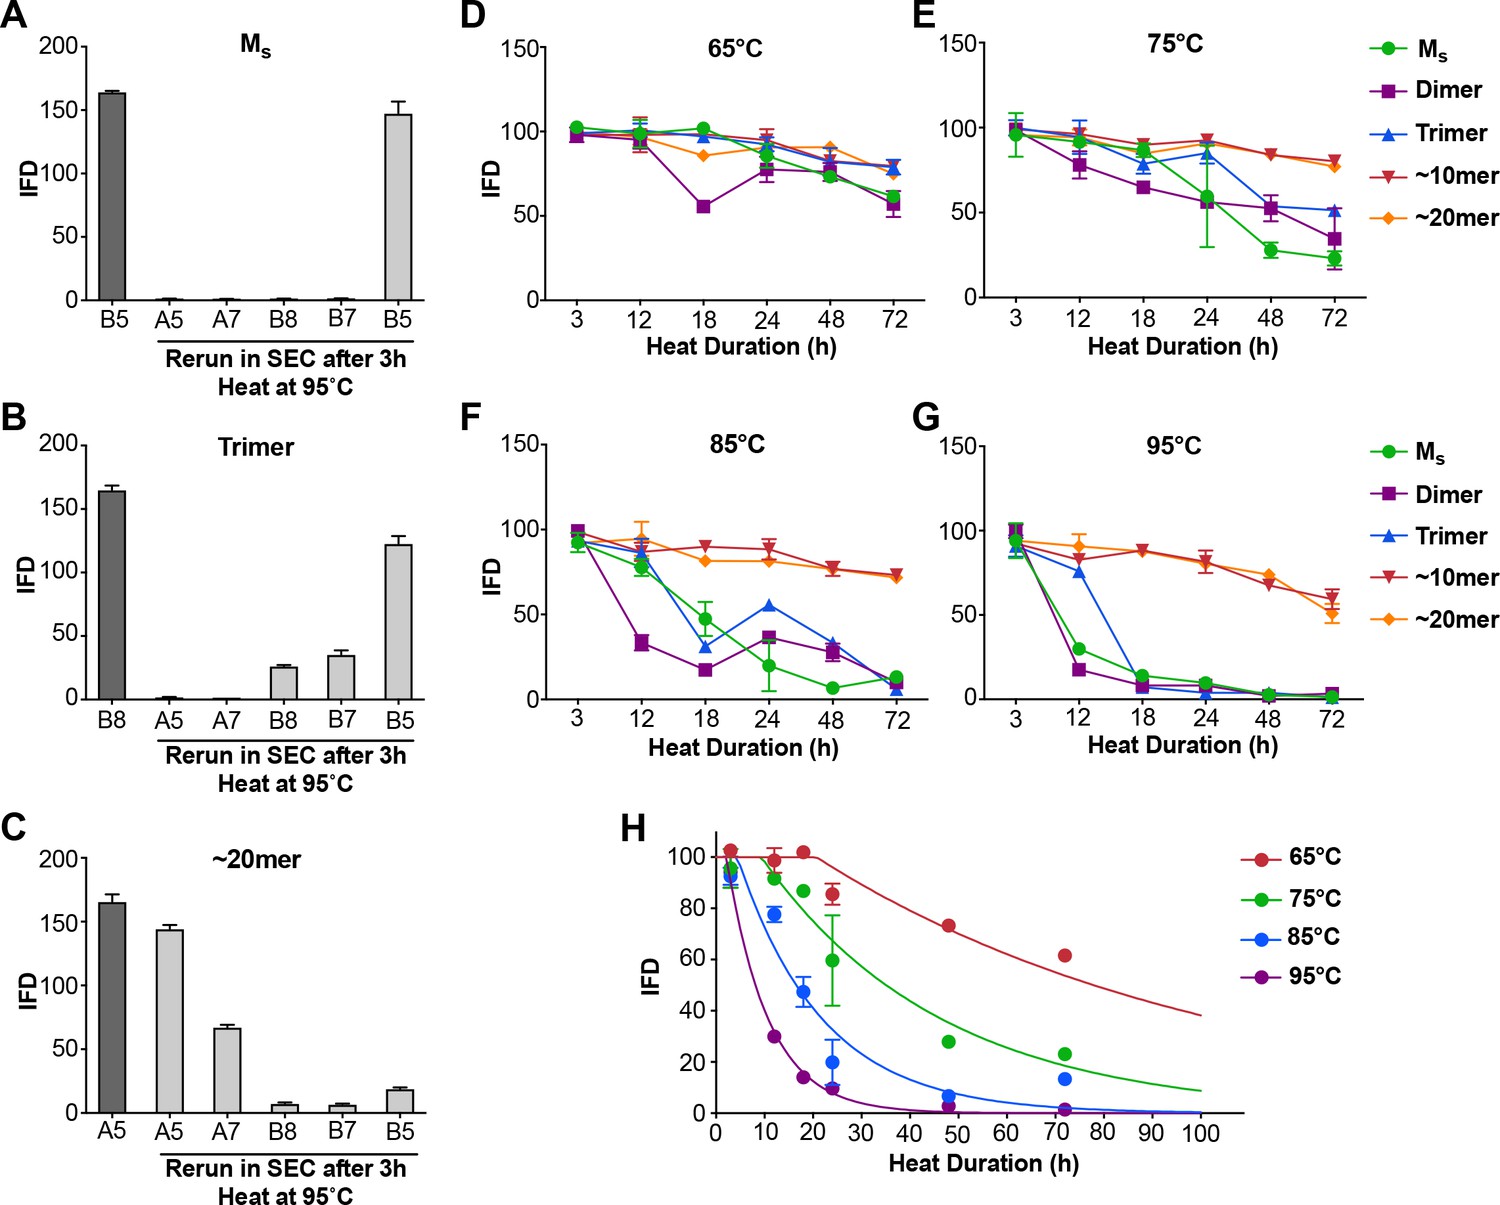
Heat denaturation of assemblies.
(A–C) Heat-induced dissociation of assemblies. (A) The SEC fraction containing Ms (B5) was heated to 95°C for 3 hr and re-isolated by SEC prior to testing the FRET biosensor assay. No loss in seeding activity was observed. (B) When the SEC fraction containing trimer (B8) was heated similarly, seeding activity shifted to fractions that contain dimer and monomer (B7, B5). (C) ~ 20 mer (A5) was largely stable to heating, although some smaller seed-competent assemblies were liberated. (D–G) Various assemblies were subjected to heat denaturation at the indicated temperatures and times, followed by analysis of seeding activity in the FRET biosensor assay. Whereas ~10 mer and ~20 mer were relatively stable from 65–95°C, monomer, dimer and trimer showed temperature-dependent loss of seeding activity. (H) Plot of denaturation data for Ms with multimodal regression curves superimposed. See Figure 4—source data 1.
-
Figure 4—source data 1
Data for heat denaturation of assemblies.
- https://doi.org/10.7554/eLife.36584.010
Figure 5

Ms self-assembles.
Mi and Ms were incubated at 500 nM or with equivalent amounts (monomer equivalent) of dimer and trimer for various times prior to resolution by SEC. Assemblies were monitored by reading the absorbance of fractions using micro BCA assay. (A) Mi showed no self-association. (B) Ms exhibited self-association over time. (C,D) Dimer and trimer were stable over time. (E,F) Mi does not react with dimer or trimer to form larger assemblies. (G,H) Ms reacts with dimer and trimer to form larger assemblies. See Figure 5—source data 1.
-
Figure 5—source data 1
Data for Ms self-assembly.
- https://doi.org/10.7554/eLife.36584.012
Figure 6 with 1 supplement
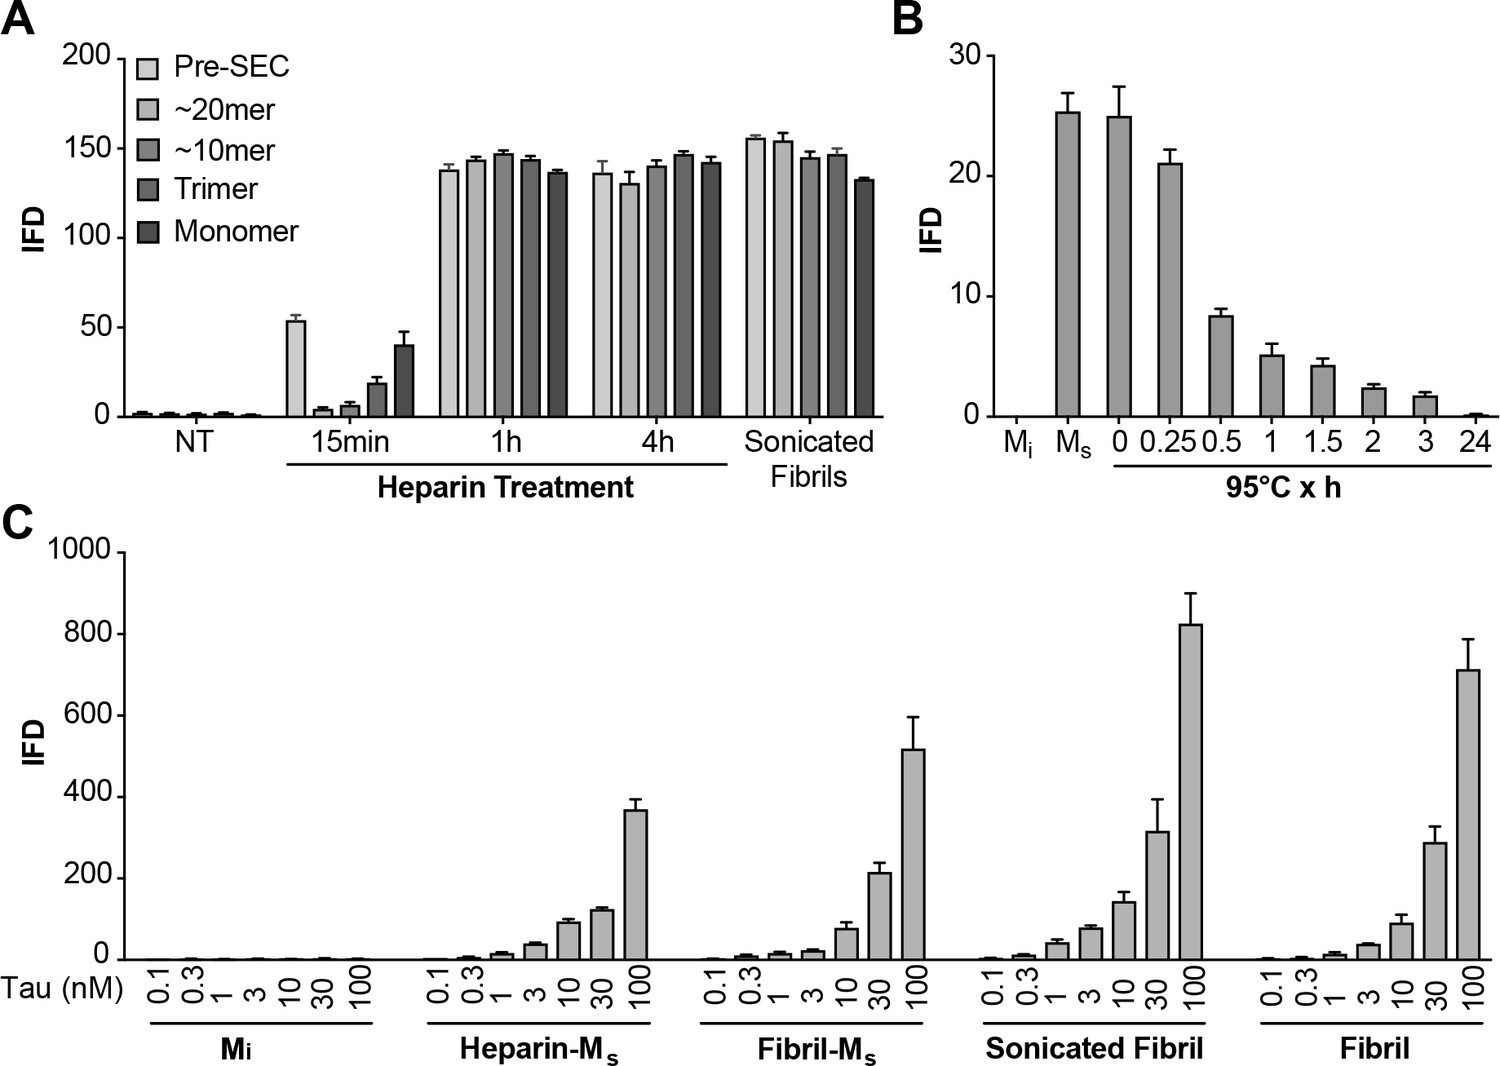
Heparin induces transition from Mi to Ms.
(A) Heparin treatment of FL WT tau was carried out for 15 min, 1 hr, or 4 hr. Samples were resolved by SEC, and fractions of various sizes were compared using the biosensor seeding assay. ‘Pre-SEC’ refers to the sample prior to fractionation. NT = monomer not treated with heparin. At 15 min, a small, but significant seeding activity was observed primarily in the monomer fraction. By 1 hr this signal was very strong, and comparable to the signal of Ms derived from sonicated fibrils. (B) Ms derived from 4 hr heparin exposure was heated at 95°C for different times, followed by analysis of seeding activity in the FRET biosensor assay. Seeding activity decayed over 24 hr. (C) Seeding efficiencies per nM of tau (monomer equivalent) of the various forms of Ms, sonicated, or unsonicated fibrils were relatively similar. Mi was sonicated identically to Ms, followed by purification via SEC, but exhibited no seeding activity. Transfection of heparin failed to trigger intracellular aggregation (data not shown). See Figure 6—source data 1.
-
Figure 6—source data 1
Data for heparin induced transition from Mi to Ms.
- https://doi.org/10.7554/eLife.36584.015
Figure 6—figure supplement 1
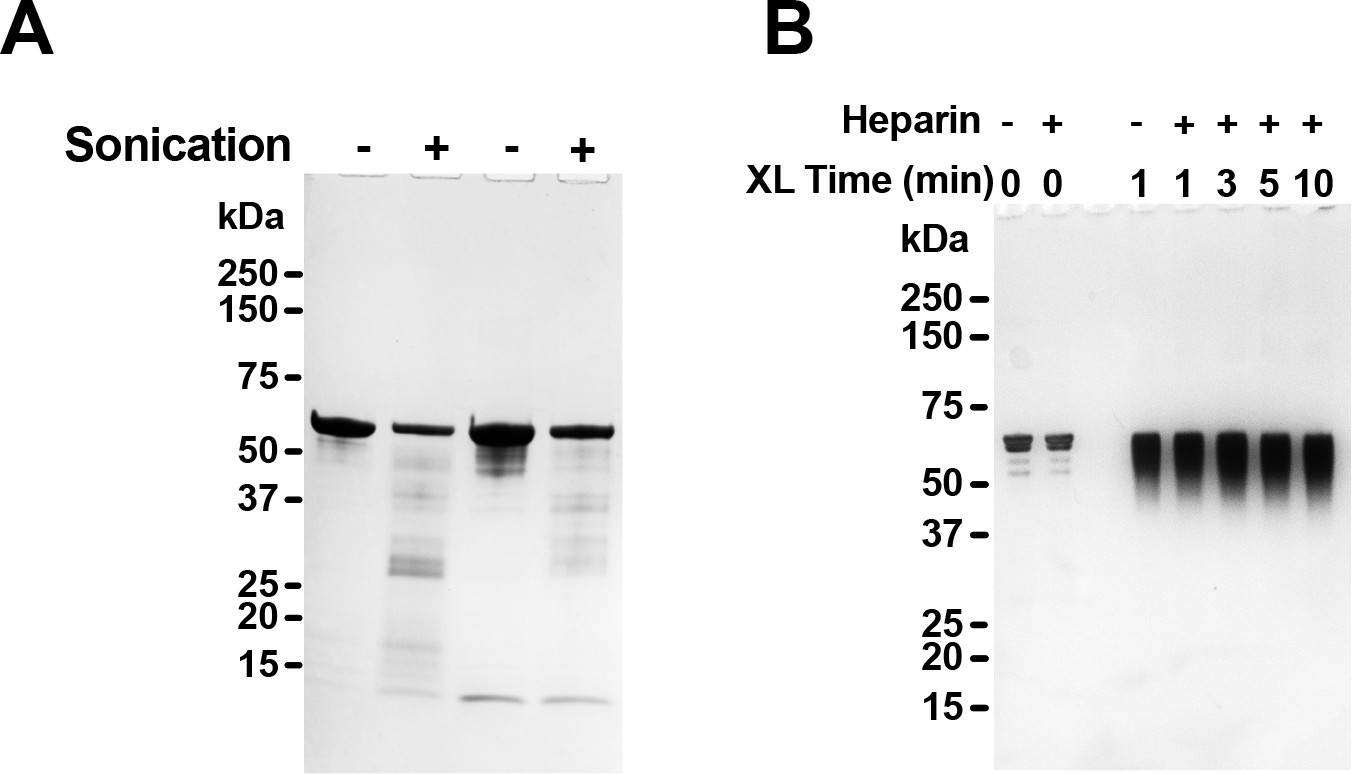
SDS-PAGE of tau after sonication or heparin treatment.
(A) Two different FL WT tau preparations were sonicated or not, and 1.5 µg protein was then resolved by SDS-PAGE and coomassie stain. Sonication induced a small degree of protein fragmentation. (B) FL WT tau was exposed to heparin for 15 min, sufficient to induce conversion from Mi to Ms, followed by DSS crosslinking for the indicated time periods. 100 ng Protein was then resolved by SDS-PAGE and silver stain. No small fragments or higher-order crosslinked species were visible.
Figure 7 with 1 supplement

Unique XL-MS patterns for different forms of Mi and Ms.
Tau monomers were prepared as described, heated at 95°C for 0, 3 or 24 hr, reacted with DSS, proteolyzed and analyzed by mass spectrometry to define intramolecular crosslinks. Diagrams represent crosslinks within the tau protein. Tau is shown in grey; RD is colored in red (R1), green (R2), blue (R3) and indigo (R4). Each diagram indicates consensus crosslinks present across replicates (N = 3) (green or red). Crosslinks uniquely observed within Ms preparations are shown in red. Each sample was prepared, isolated by SEC, and then subjected XL-MS. (A) Mi: tau monomer not previously fibrillized; (B) Ms: fibril-derived tau monomer; (C) Ms: heparin-exposed tau monomer (0.25 hr or 1 hr). Crosslinks from aa150 to aa254-290 mark all forms of Ms after exposure to 95°C for 0 hr, 0.25 hr and 3 hr, but not 24 hr. See Figure 7—source data 1 and 2.
-
Figure 7—source data 1
Summary of triplicate XL-MS datasets.
- https://doi.org/10.7554/eLife.36584.018
-
Figure 7—source data 2
Summary of consensus XL-MS datasets.
- https://doi.org/10.7554/eLife.36584.019
Figure 7—figure supplement 1
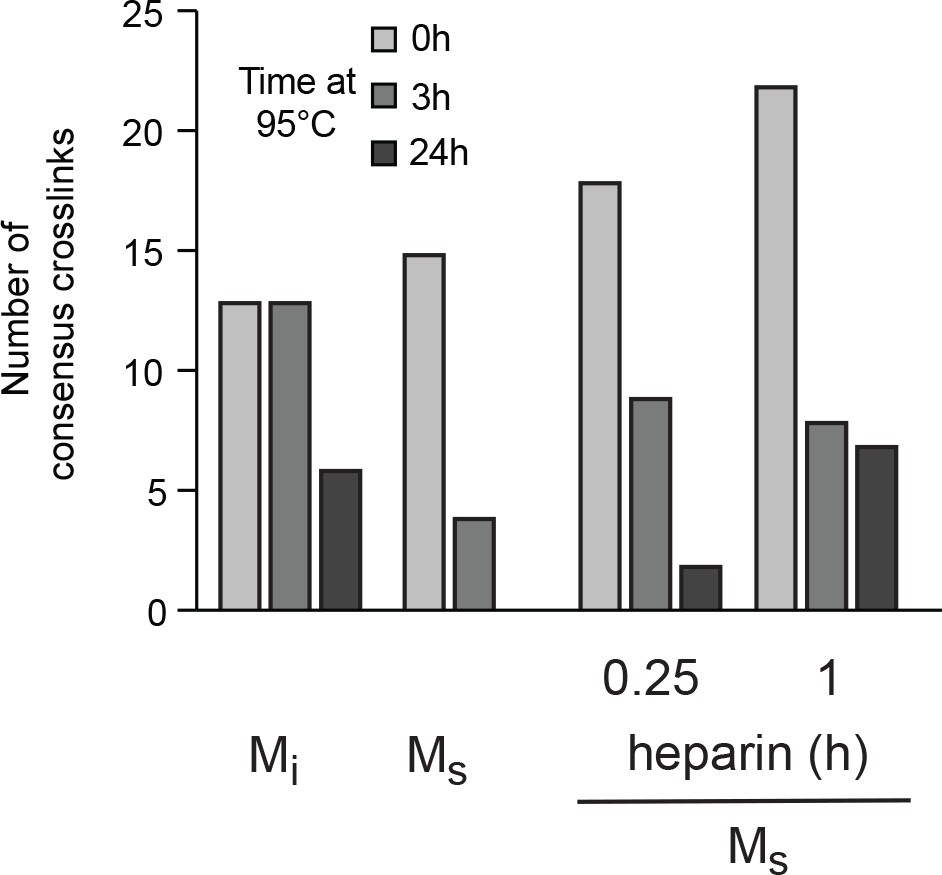
Frequency of crosslinks decreases with heat incubation.
Heat denaturation of Mi and Ms (fibril-derived and heparin treated for 0.25 hr, 1 hr) decreases the abundance of consensus crosslink pairs (A). Columns represent data after exposure to 95°C for 0 hr, 3 hr and 24 hr. See Figure 7—source data 2.
Figure 8 with 1 supplement
AD brain contains seed-competent monomer.
Tau from control and AD brains was immunoprecipitated and subjected to SEC. (A) SEC from control brain contained predominantly tau monomer. (B) SEC from AD brain contained a range of tau assembly sizes. (C) Tau monomer from control brain exhibited no seeding activity, whereas monomer from AD brain did, along with larger assemblies (p<0.001). Tau Unit refers to the putative number of molecules per assembly. LF = Lipofectamine control. (D) Tau KO mouse brain was spiked either with human tau Ms or fibrils prior to dounce homogenization, immunopurification, and resolution by SEC. Samples spiked with Ms exhibited monomer seeding activity, but not samples that had been spiked with fibrils. (E) AD-derived tau monomer was incubated for the indicated times prior to SEC and determination of seeding activity in each fraction. Larger seed-competent assemblies formed after 24 hr incubation at RT. (F, G) Three control and AD brains were homogenized, monomer isolated, and evaluated by XL-MS. Tau monomer from controls lacked the long-range crosslinks observed in Ms. AD-derived Ms contained long-range crosslinks (aa150 to aa254-290) also observed in recombinant forms of Ms. See Figure 8—source datas 1 and 2.
-
Figure 8—source data 1
Data characterization of patient samples.
- https://doi.org/10.7554/eLife.36584.022
-
Figure 8—source data 2
Summary of patient-derived XL-MS datasets.
- https://doi.org/10.7554/eLife.36584.023
Figure 8—figure supplement 1

Different brain homogenization methods yield similar crosslink patterns.
A single AD brain sample was homogenized using four different methods: (A) Dounce homogenization; (B) Pulse sonication; (C) Mechanical homogenization; (D) Mechanical homogenization followed by pulse sonication. Diagrams represent crosslinks within the FL tau protein. RD is colored in red (R1), green (R2), blue (R3) and indigo (R4). High confidence XL-MS crosslinks are shown as light green lines; crosslinks found in Ms are shown in red. See Figure 8—source data 1and Figure 8—source data 2.
Figure 9 with 1 supplement
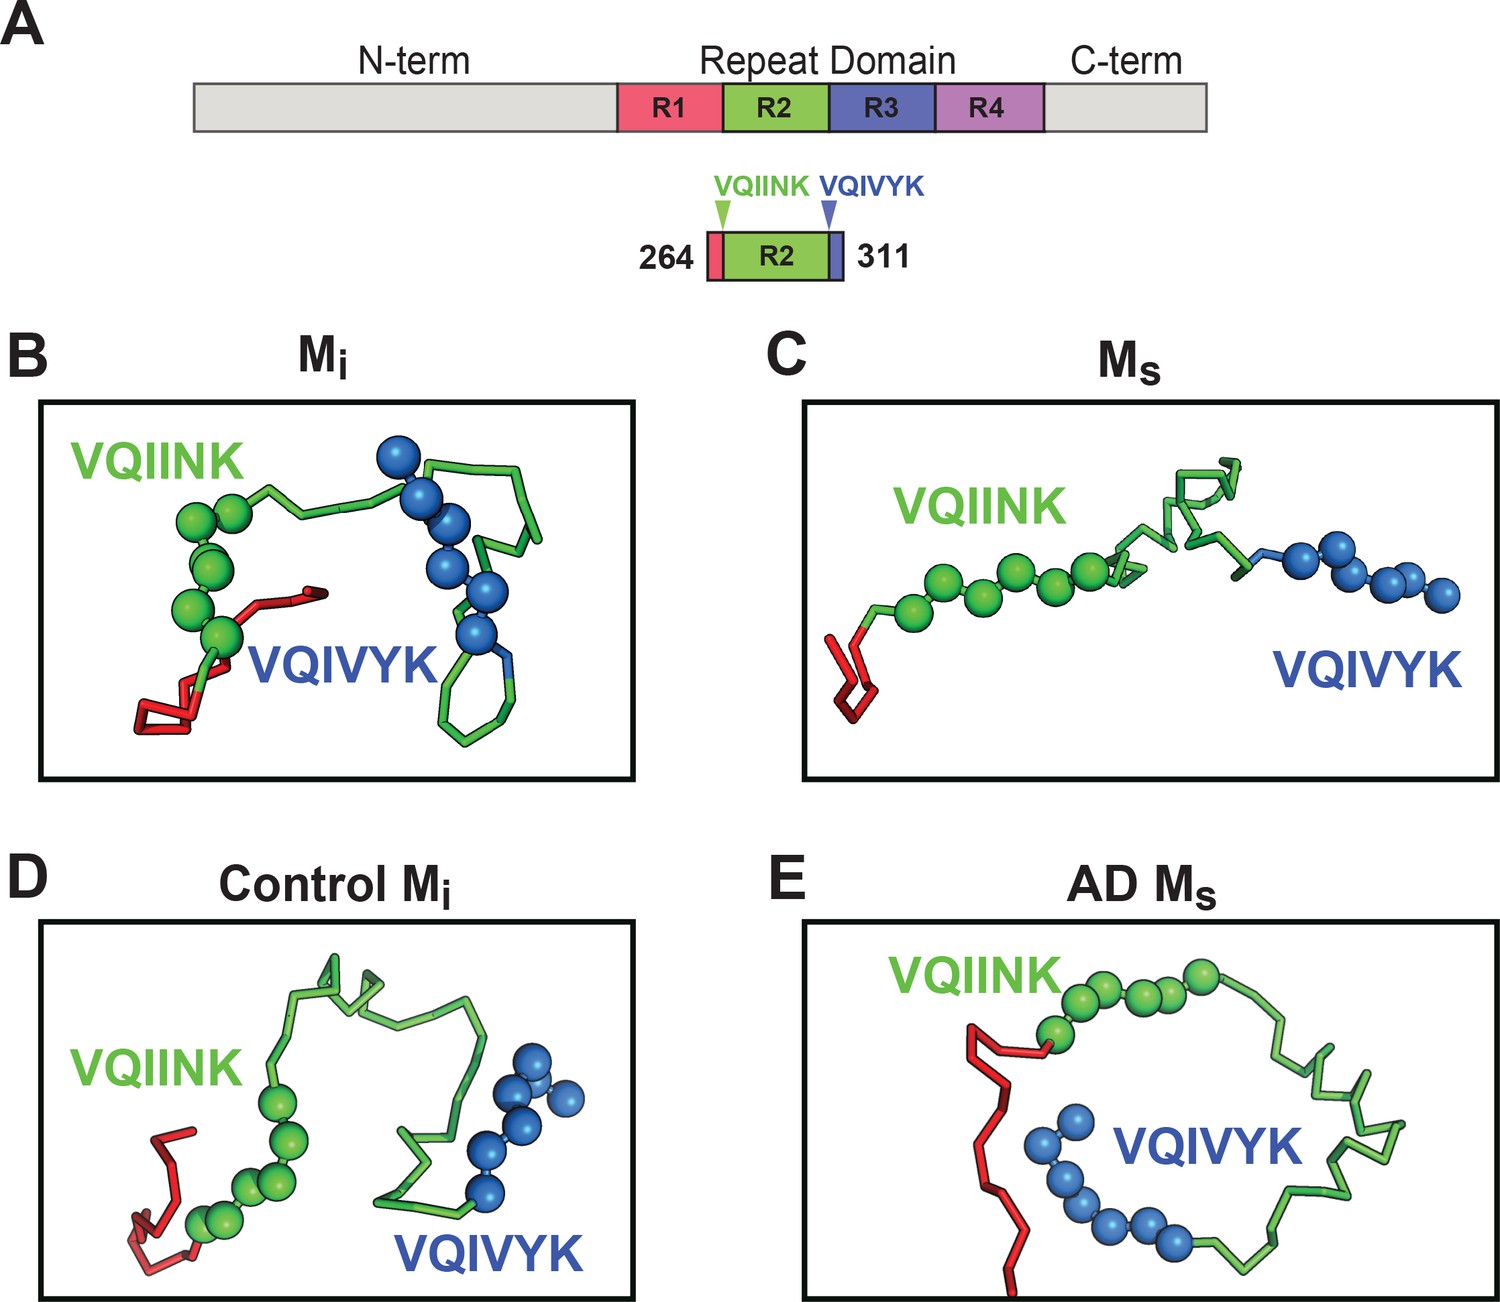
Models of Mi and Ms suggest differences in the R1R2 and R2R3 regions.
XL-MS identified pairs were used as restraints in Rosetta to create structural models of discrete tau domains. (A) Schematic highlighting the region of the RD encoding structural differences between Mi and Ms. Tau RD is colored in red (R1), green (R2), blue (R3) and indigo (R4); N- and C-terminal portions of tau are shown in grey. Fragments of interest are shown with their position in the RD. (B) recombinant Mi; (C) fibril-derived Ms, (D) Control Mi and (E) AD-derived Ms. Regions surrounding the R1R2 and R2R3 are indicated, highlighting two amyloid-forming sequences, VQIINK (green spheres) and VQIVYK (blue spheres). In both forms of Mi VQIINK and VQIVYK are associated with flanking amino acids in hairpin structures. In both forms of Ms the VQIINK and VQIVYK sequences are presented at the protein surface. See Figure 9—source data 1.
-
Figure 9—source data 1
Models of Mi, Ms, control and AD conformations of tau.
- https://doi.org/10.7554/eLife.36584.026
-
Figure 9—source data 2
Rosetta energy and radius of gyration for structural ensembles.
- https://doi.org/10.7554/eLife.36584.027
Figure 9—figure supplement 1
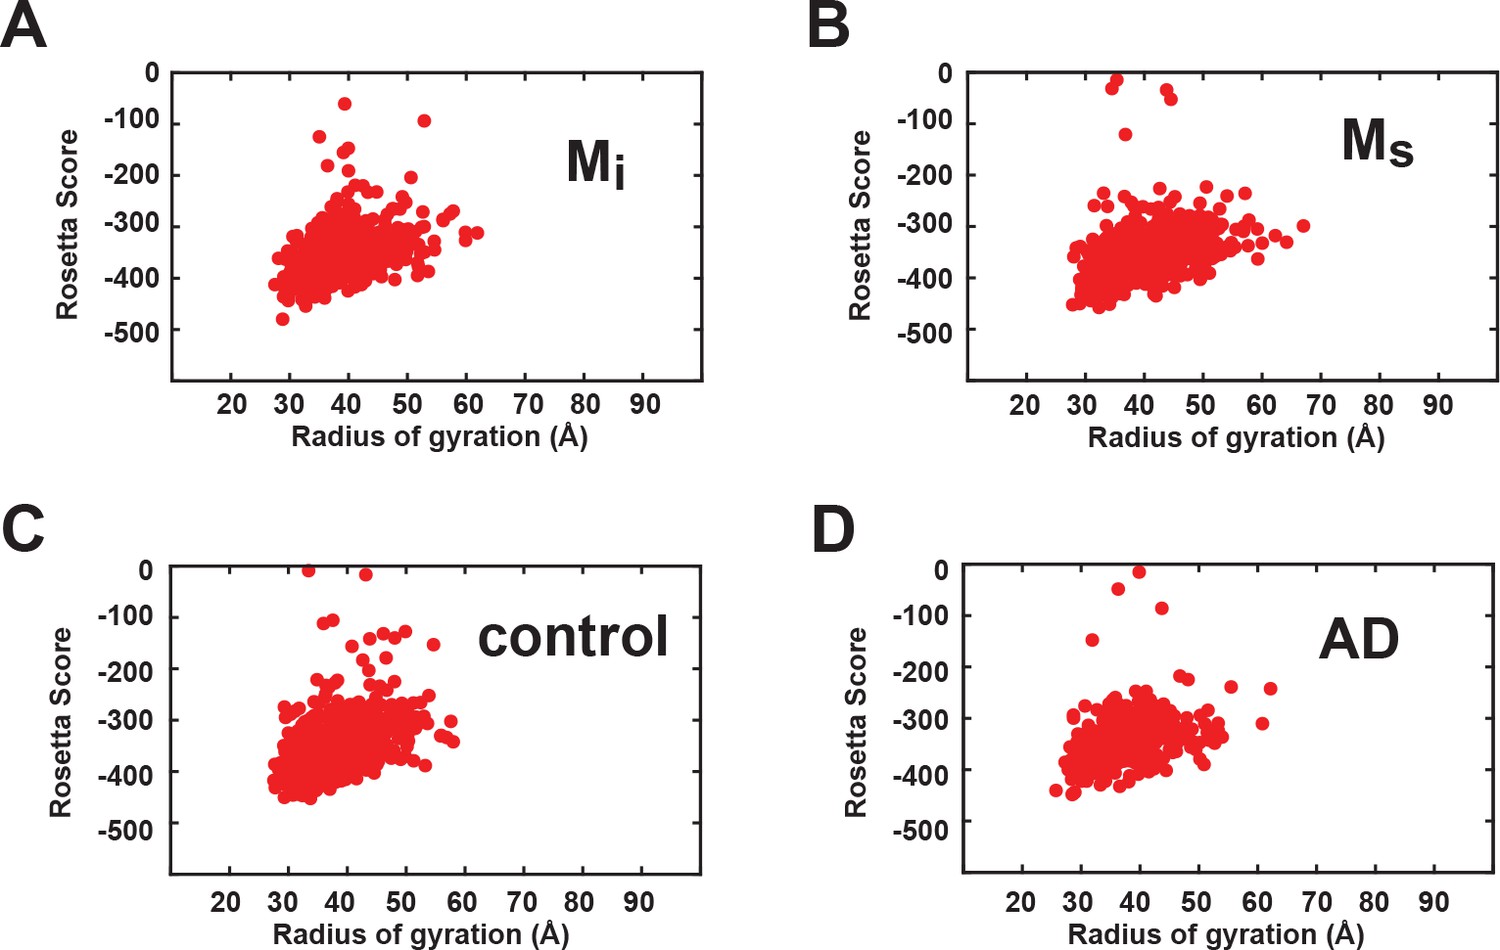
Energetics of Rosetta structural ensembles.
The ensembles are shown as a distribution of total energy of each model and radius of gyration for recombinant Mi (A), recombinant Ms (B), control brain-derived Mi (C) and AD-derived Ms (D). Figure 9—source data 2.
Figure 10 with 1 supplement
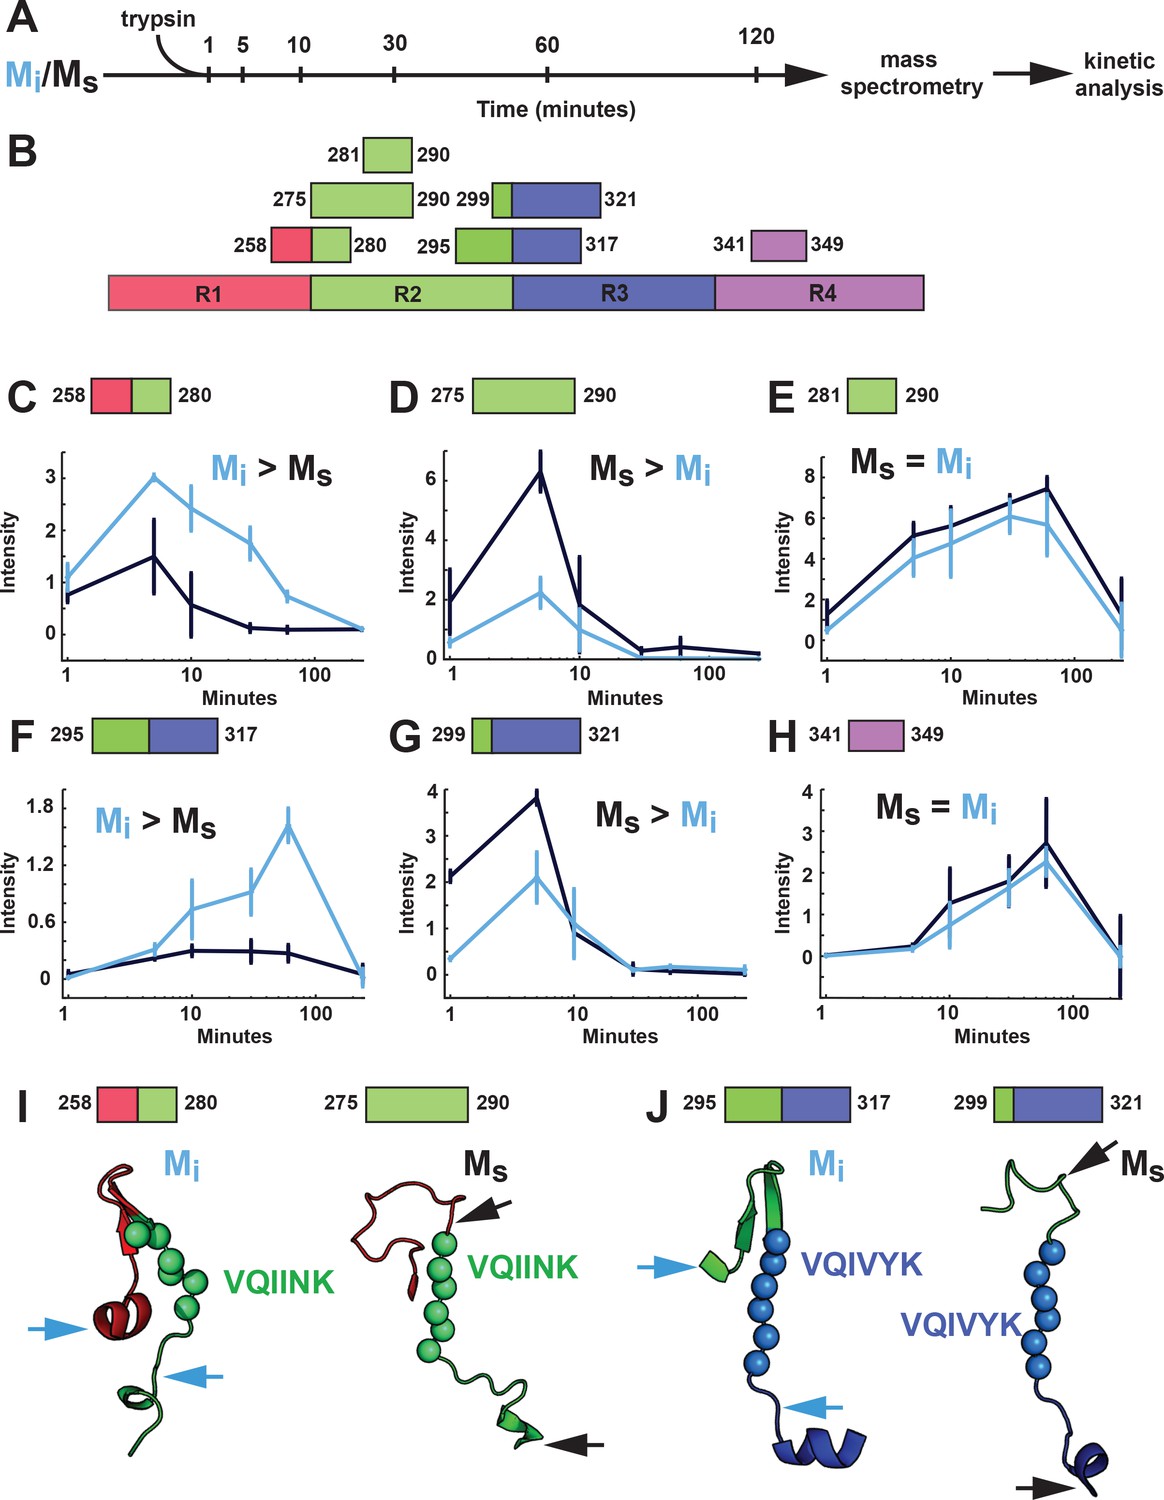
Proteolysis of Mi and Ms reveals distinct patterns.
(A) Mi and Ms were prepared as technical triplicates (N = 3), isolated by SEC, and passed through a 100kD filter immediately prior to exposure to trypsin for 1, 5, 10, 30, 60 and 120 min. Samples were analyzed by mass spectrometry and kinetic profiles were generated for peptides present at each time point. (B) Tau RD is colored in red (R1), green (R2), blue (R3) and indigo (R4). Identified peptides are shown with their position in the RD. (C–H) Kinetic profiles are indicated for peptides that were more abundant in Mi (C, F), Ms (D, G) or equal in Mi and Ms (E, H). Mi and Ms kinetic profiles are shown in blue and black, respectively. Fragments enriched in Mi or Ms were mapped onto corresponding regions in the structural models (I, J). The models are shown as cartoons colored in red (R1), green (R2) and blue (R3). Cleavage sites are indicated by arrows for Mi (blue) and Ms (black). See Figure 10—source data 1.
-
Figure 10—source data 1
Summary of peptides and their abundance identified in the triplicate Mi and Ms proteolysis experiment.
- https://doi.org/10.7554/eLife.36584.030
-
Figure 10—source data 2
Summary of ratiometric analysis of Mi and Ms peptide abundance.
- https://doi.org/10.7554/eLife.36584.031
Figure 10—figure supplement 1
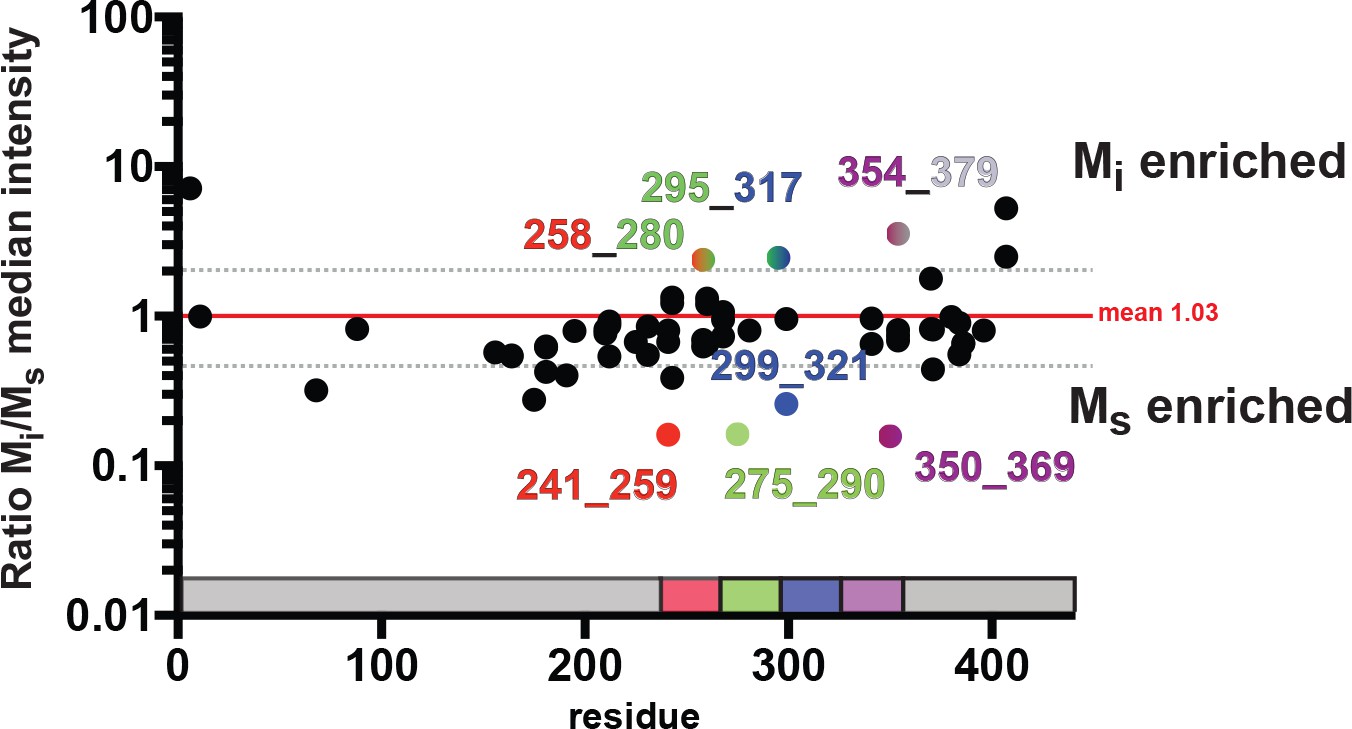
Proteolysis reveals localized differences between Mi and Ms.
The medians of the averaged (N = 3) kinetic profiles were compared as ratios for Mi and Ms. The data were compared to the mean of all ratios (red line) and standard deviation (dotted grey line). Peptides within the RD that are enriched in Mi or Ms are shown as colored dots according to location in the RD and labeled with N-term and C-term peptide positions. As a reference the tau RD is colored in red (R1), green (R2), blue (R3) and indigo (R4). Identified peptides are shown with their position in the RD. See Figure 10—source data 1 and 2.
Tables
Key resources table
| Reagent type (species) or resource | Designation | Source or reference | Identifiers | Additional information |
|---|---|---|---|---|
| Cell line (HEK293) | Tau RD P301S FRET Biosensor | Produced by Diamond lab, also available from ATCC | ATCC CRL-3275 | |
| biological sample (mouse) | Tau KO mouse | Jackson Laboratories | 7251 | |
| biological sample (human) | Alzheimer's Disease brain, stage VI, frozen | Washington University in St. Louis | 62579, 62732, 61473 | |
| biological sample (human) | Human normal brain | Washington University in St. Louis | 60974, 607, 64238 | |
| antibody | HJ8.5 | Produced by Diamond lab | N/A | Monoclonal antibody against human tau |
| antibody | Polyclonal Rabbit Anti-Human Tau | Dako, Denmark | A0024 | |
| antibody | ECL Anti-rabbit IgG Horseradish Peroxidase F(ab) fragment | GE Healthcare | NA9340V | |
| recombinant protein | Human tau 2N4R (Full Length WT-tau) | Produced by Diamond lab | N/A | MAEPRQEFEV MEDHAGTYGL GDRKDQGGYT MHQDQEGDTD AGLKESPLQT PTEDGSEEPG SETSDAKSTP TAEDVTAPLV DEGAPGKQAA AQPHTEIPEG TTAEEAGIGD TPSLEDEAAG HVTQARMVSK SKDGTGSDDK KAKGADGKTK IATPRGAAPP GQKGQANATR IPAKTPPAPK TPPSSGEPPK SGDRSGYSSP GSPGTPGSRS RTPSLPTPPT REPKKVAVVR TPPKSPSSAK SRLQTAPVPM PDLKNVKSKI GSTENLKHQP GGGKVQIINK KLDLSNVQSK CGSKDNIKHV PGGGSVQIVY KPVDLSKVTS KCGSLGNIHH KPGGGQVEVK SEKLDFKDRV QSKIGSLDNI THVPGGGNKK IETHKLTFRE NAKAKTDHGA EIVYKSPVVS GDTSPRHLSN VSSTGSIDMV DSPQLATLAD EVSASLAKQG L |
| recombinant protein | Tau (2A) | Produced by Diamond lab | N/A | MAEPRQEFEV MEDHAGTYGL GDRKDQGGYT MHQDQEGDTD AGLKESPLQT PTEDGSEEPG SETSDAKSTP TAEDVTAPLV DEGAPGKQAA AQPHTEIPEG TTAEEAGIGD TPSLEDEAAG HVTQARMVSK SKDGTGSDDK KAKGADGKTK IATPRGAAPP GQKGQANATR IPAKTPPAPK TPPSSGEPPK SGDRSGYSSP GSPGTPGSRS RTPSLPTPPT REPKKVAVVR TPPKSPSSAK SRLQTAPVPM PDLKNVKSKI GSTENLKHQP GGGKVQIINK KLDLSNVQSK AGSKDNIKHV PGGGSVQIVY KPVDLSKVTS KAGSLGNIHH KPGGGQVEVK SEKLDFKDRV QSKIGSLDNI THVPGGGNKK IETHKLTFRE NAKAKTDHGA EIVYKSPVVS GDTSPRHLSN VSSTGSIDMV DSPQLATLAD EVSASLAKQG L |
| recombinant protein | Cys-Tau (2A) | Produced by Diamond lab | N/A | MAEPRQEFEV MEDHACGTYGL GDRKDQGGYT MHQDQEGDTD AGLKESPLQT PTEDGSEEPG SETSDAKSTP TAEDVTAPLV DEGAPGKQAA AQPHTEIPEG TTAEEAGIGD TPSLEDEAAG HVTQARMVSK SKDGTGSDDK KAKGADGKTK IATPRGAAPP GQKGQANATR IPAKTPPAPK TPPSSGEPPK SGDRSGYSSP GSPGTPGSRS RTPSLPTPPT REPKKVAVVR TPPKSPSSAK SRLQTAPVPM PDLKNVKSKI GSTENLKHQP GGGKVQIINK KLDLSNVQSK AGSKDNIKHV PGGGSVQIVY KPVDLSKVTS KAGSLGNIHH KPGGGQVEVK SEKLDFKDRV QSKIGSLDNI THVPGGGNKK IETHKLTFRE NAKAKTDHGA EIVYKSPVVS GDTSPRHLSN VSSTGSIDMV DSPQLATLAD EVSASLAKQG L |
| commercial assay or kit | micro BCA Protein Assay Kit | Thermo Scientific | 23235 | |
| chemical compound | Heparin sodium salt from porcine intestinal mucosa | Sigma | H4784 |
Additional files
-
Transparent reporting form
- https://doi.org/10.7554/eLife.36584.032
Download links
A two-part list of links to download the article, or parts of the article, in various formats.
Downloads (link to download the article as PDF)
Open citations (links to open the citations from this article in various online reference manager services)
Cite this article (links to download the citations from this article in formats compatible with various reference manager tools)
Inert and seed-competent tau monomers suggest structural origins of aggregation
eLife 7:e36584.
https://doi.org/10.7554/eLife.36584


