Autophagy-dependent ribosomal RNA degradation is essential for maintaining nucleotide homeostasis during C. elegans development
- School of Life Sciences, Peking University, China
- National Institute of Biological Science, China
- Institute of Biophysics, Chinese Academy of Sciences, China
- University of Chinese Academy of Sciences, China
Figures
Figure 1 with 2 supplements

rnst-2 mutants accumulate enlarged lysosomes.
(A–I) Confocal fluorescence images of embryos at the 4-fold stage (4F, A–C), larvae 1 (L1, D–F) and adult hypodermis (G–I) in wild-type (WT, A, D, G), rnst-2(qx245) (B, E, H) and rnst-2(bp555) (C, F, I) expressing LAAT-1::GFP. (J–L”) Confocal fluorescence images of the hypodermis in wild-type (J–J″), rnst-2 (qx245) (K–K″) and rnst-2(bp555) (L–L″) adults expressing LAAT-1::GFP and stained by Lysotracker red. In (A–L’’), white arrowheads and arrows indicate globular and tubular lysosomes, respectively, and blue arrowheads indicate enlarged globular lysosomes. Scale bars: 5 µm. (M) Quantification of the average volume of lysosomes labeled by LAAT-1::GFP in 4-fold-stage embryos (4F), L1 larvae (L1) and adult hypodermis (day 3 of adulthood). (N) The percentage of LAAT-::GFP-positive lysosomes that were stained by lysotracker red was quantified in adult hypodermis. In (M, N), at least 10 worms were scored in each strain at each stage. Data are shown as mean ± SD. Two-way ANOVA with the Bonferroni post hoc test (M) or one-way ANOVA with Tukey’s post hoc test (N) was performed to compare mutant datasets with wild type. ***p<0.001, other points had p>0.05.
-
Figure 1—source data 1
Figure 1 numerical data.
- https://doi.org/10.7554/eLife.36588.005
-
Figure 1—source data 2
Figure 1—figure supplement 1 numerical data.
- https://doi.org/10.7554/eLife.36588.006
Figure 1—figure supplement 1
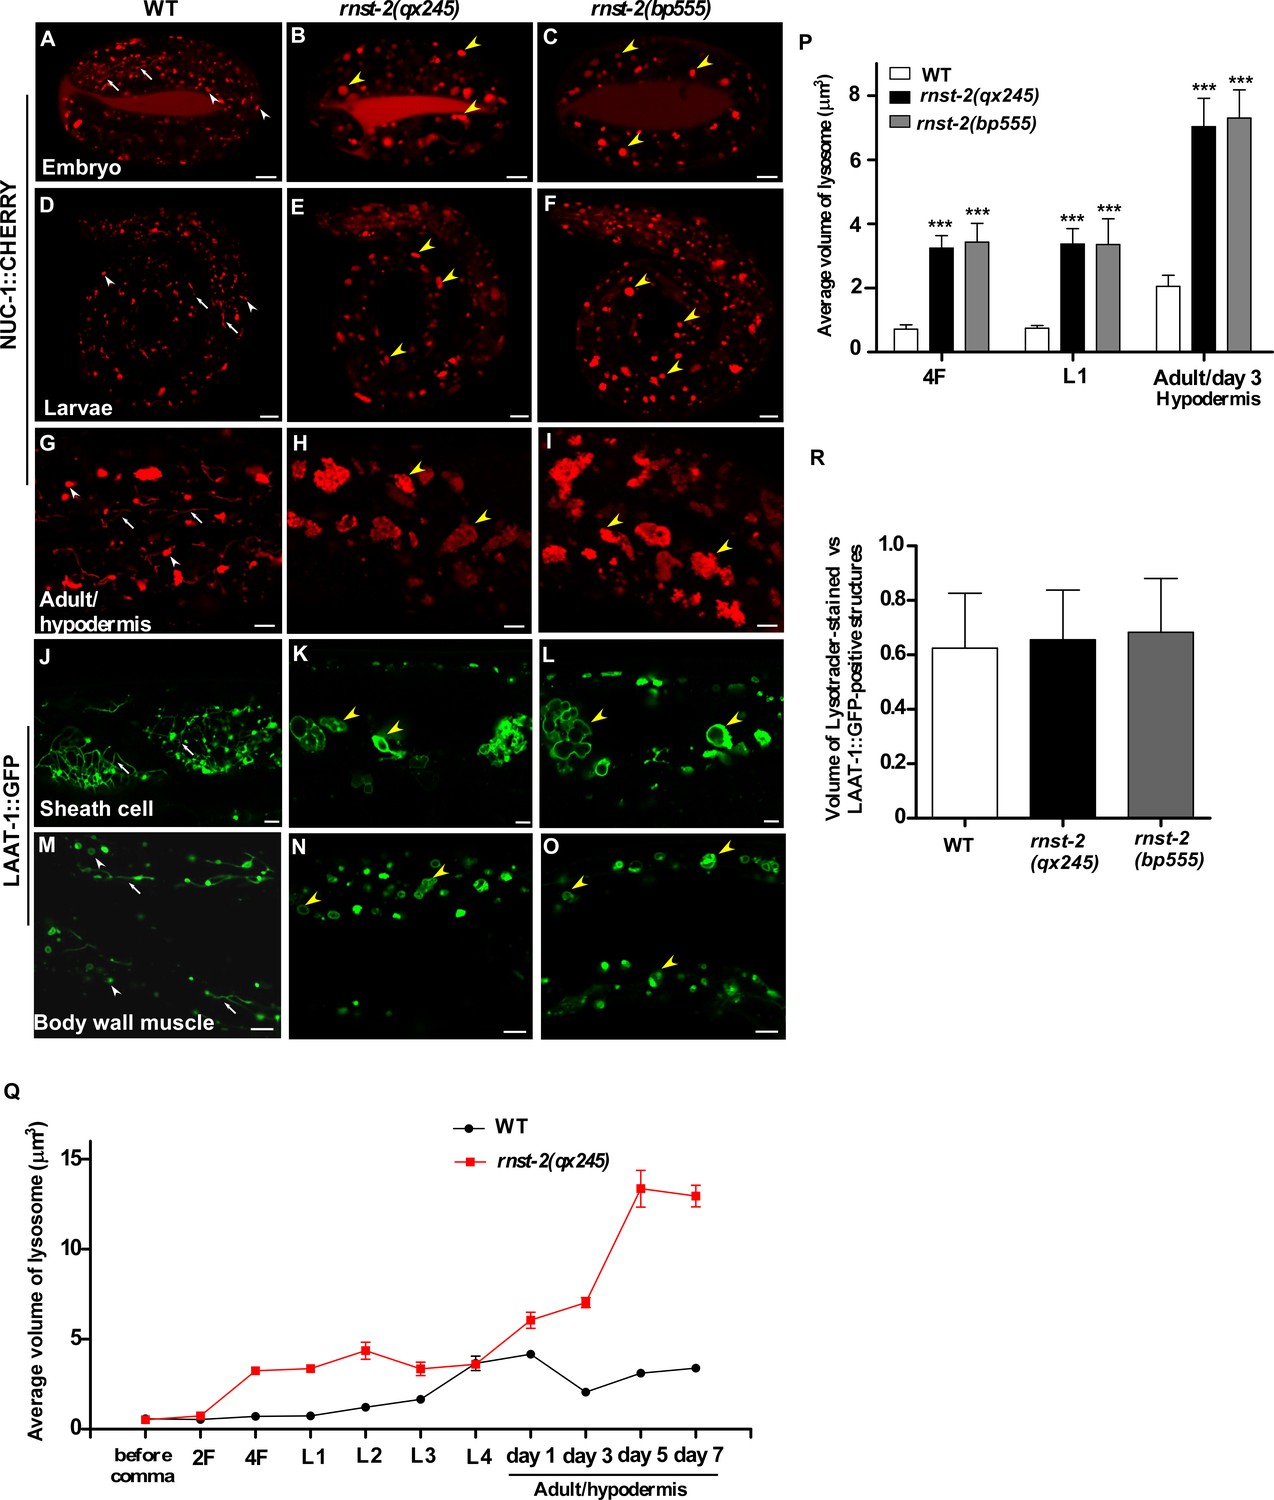
rnst-2 mutants accumulate enlarged lysosomes in multiple cell types.
(A–I) Confocal fluorescence images of embryos at the 4-fold stage (4F, (A–C), larvae 1 (L1, D–F) and adult hypodermis (G–I) in wild-type (WT, (A, D, G), rnst-2(qx245) (B, E, H) and rnst-2(bp555) (C, F, I) expressing NUC-1::CHERRY. (J–O) Confocal fluorescence images in sheath cells (J–L) and body wall muscle cells (M–O) in wild-type (J, M), rnst-2(qx245) (K, N) and rnst-2(bp555) (L, O) adults expressing LAAT-1::GFP driven by ced-1 (J–L) or myo-3 promoter (M–O). White arrowheads and arrows indicate globular and tubular lysosomes, and yellow arrowheads indicate enlarged lysosomes in rnst-2(qx245) and rnst-2(bp555). Scale bars: 5 µm. (P) Quantification of the volume of lysosomes labeled by NUC-1::CHERRY in 4-fold embryos (4F), L1 larvae (L1) and adult hypodermis (day 3 of adulthood). (Q) Quantification of the average volume of lysosomes labeled by NUC-1::CHERRY in wild type (WT) and rnst-2(qx245) at different stages. At least 10 worms were scored in each strain at each stage and data are shown as mean ± SEM. (R) Volume of lysotracker-stained- and LAAT-1::GFP-positive lysosomes was quantified in the adult hypodermis and compared. In (P, R), at least 10 worms were scored in each strain and data are shown as mean ± SD. Two-way ANOVA with the Bonferroni post hoc test (P) or one-way ANOVA with Tukey’s post hoc test (R) was performed to compare mutant datasets with wild type. ***p<0.001, other points had p>0.05.
Figure 1—figure supplement 2
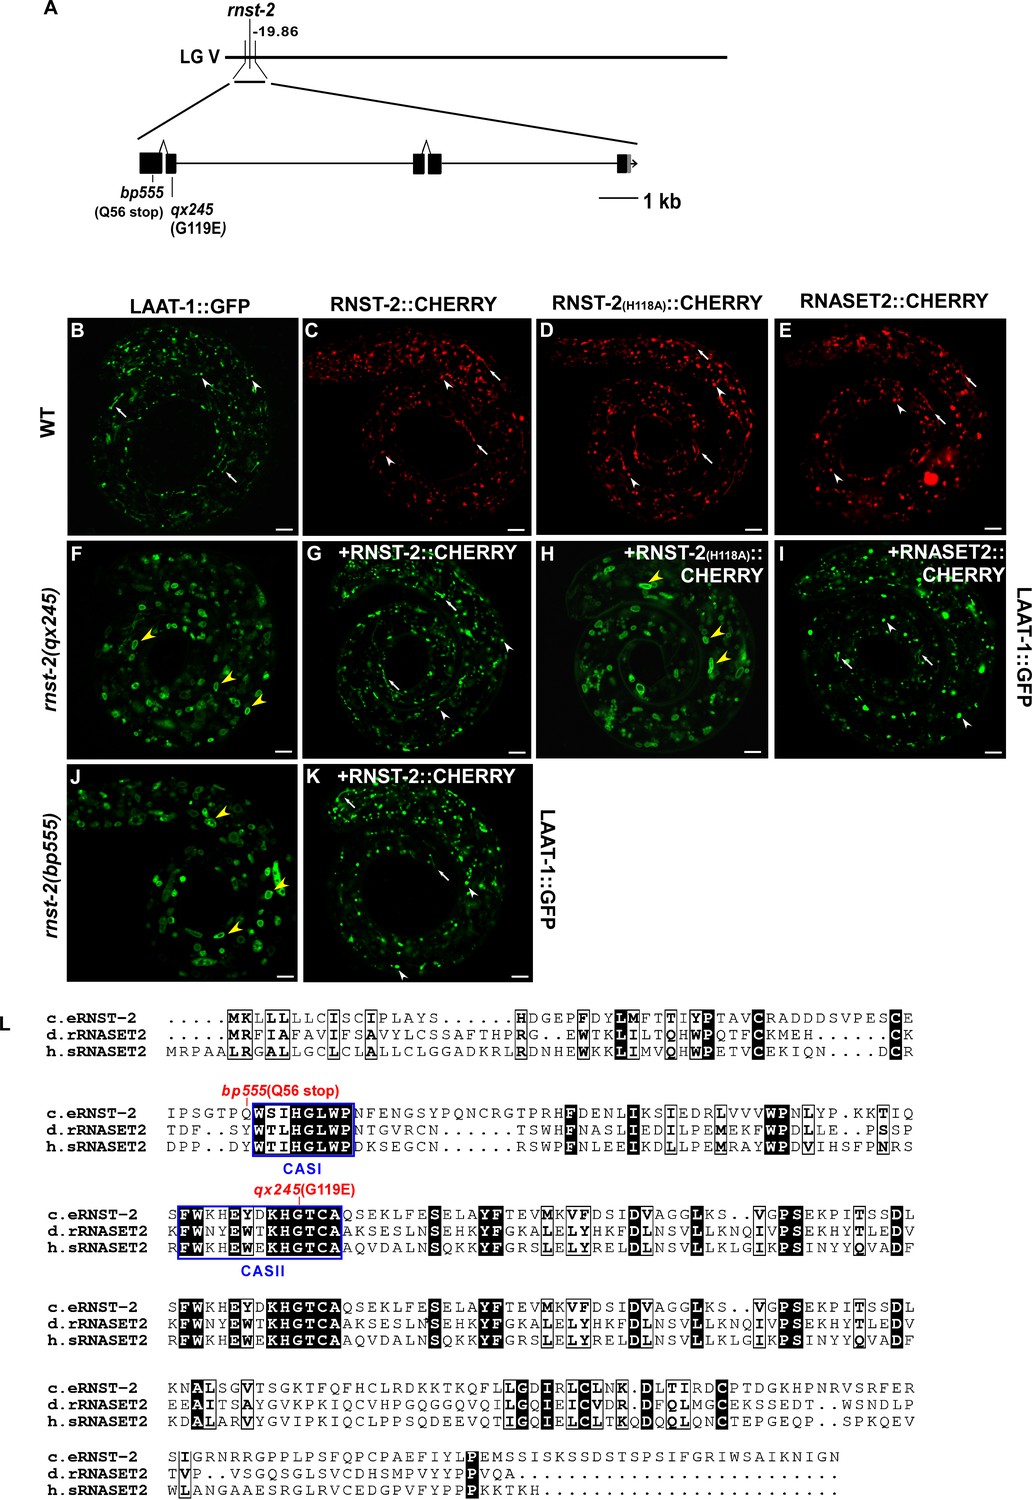
Molecular cloning of rnst-2.
(A) Cloning of rnst-2. The top bar indicates the genetic position of rnst-2. The rnst-2 gene structure is shown with filled boxes representing exons and thin lines indicating introns. The arrow delineates the direction of transcription. The position of the mutation site in qx245 and bp555 is indicated. (B, F–K) Confocal fluorescence images of lysosomes in the indicated strains at the L1 stage expressing LAAT-1::GFP. White arrowheads and arrows indicate globular and tubular lysosomes, respectively, and yellow arrowheads indicate enlarged lysosomes. (C–E) Confocal fluorescence images of wild-type larvae expressing RNST-2::CHERRY (C), RNST-2(H118A)::CHERRY (D) and human RNASET2::CHERRY (E) driven by the rnst-2 promoter. Scale bars in (B–K): 5 µm. (L) Sequence alignment of C. elegans (c.e) RNST-2, Drosophila melanogaster (d.r) RNASET2 and human (h.s) RNASET2. Identical residues are shaded in black and similar ones are marked in white boxes. Blue boxes indicate two conserved catalytic active sites (CAS). Mutations identified in different rnst-2 alleles are in red.
Figure 2
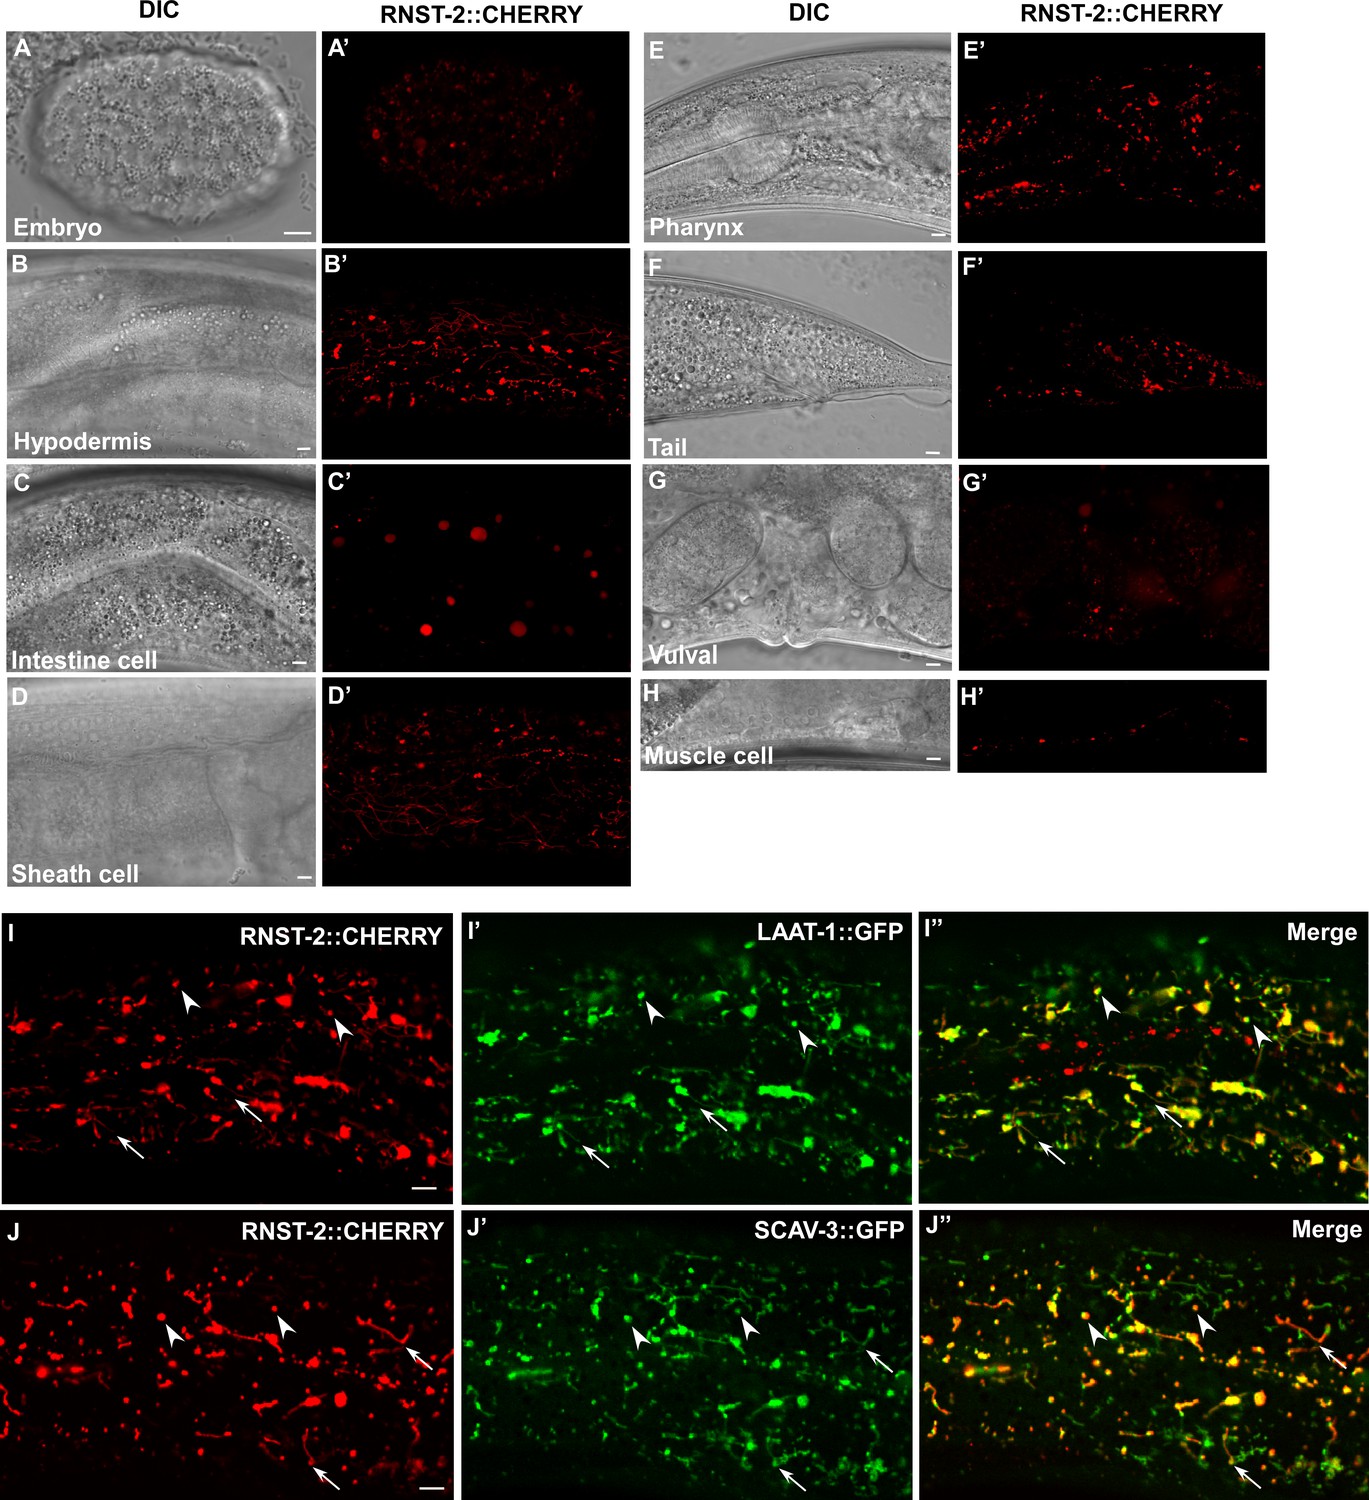
RNST-2 is widely expressed and localizes to lysosomes.
(A–H′) DIC and confocal fluorescence images of wild type expressing RNST-2::CHERRY driven by the rnst-2 promoter. RNST-2::CHERRY is expressed from early embryos (A, A’) to the adult stage in various cell types including hypodermis (B, B’), intestine (C, C’), sheath cell (D, D’), pharynx (E, E’), tail (F, F’), vulva (G, G’) and muscle cell (H, H’). (I–J″) Confocal fluorescence images of the hypodermis in wild type co-expressing RNST-2::CHERRY and LAAT-1::GFP (I–I″) or SCAV-3::GFP (J–J″). RNST-2 colocalizes with LAAT-1 and SCAV-3 to both globular (arrowheads) and tubular (arrows) lysosomes. Scale bars: 5 µm.
Figure 3 with 2 supplements
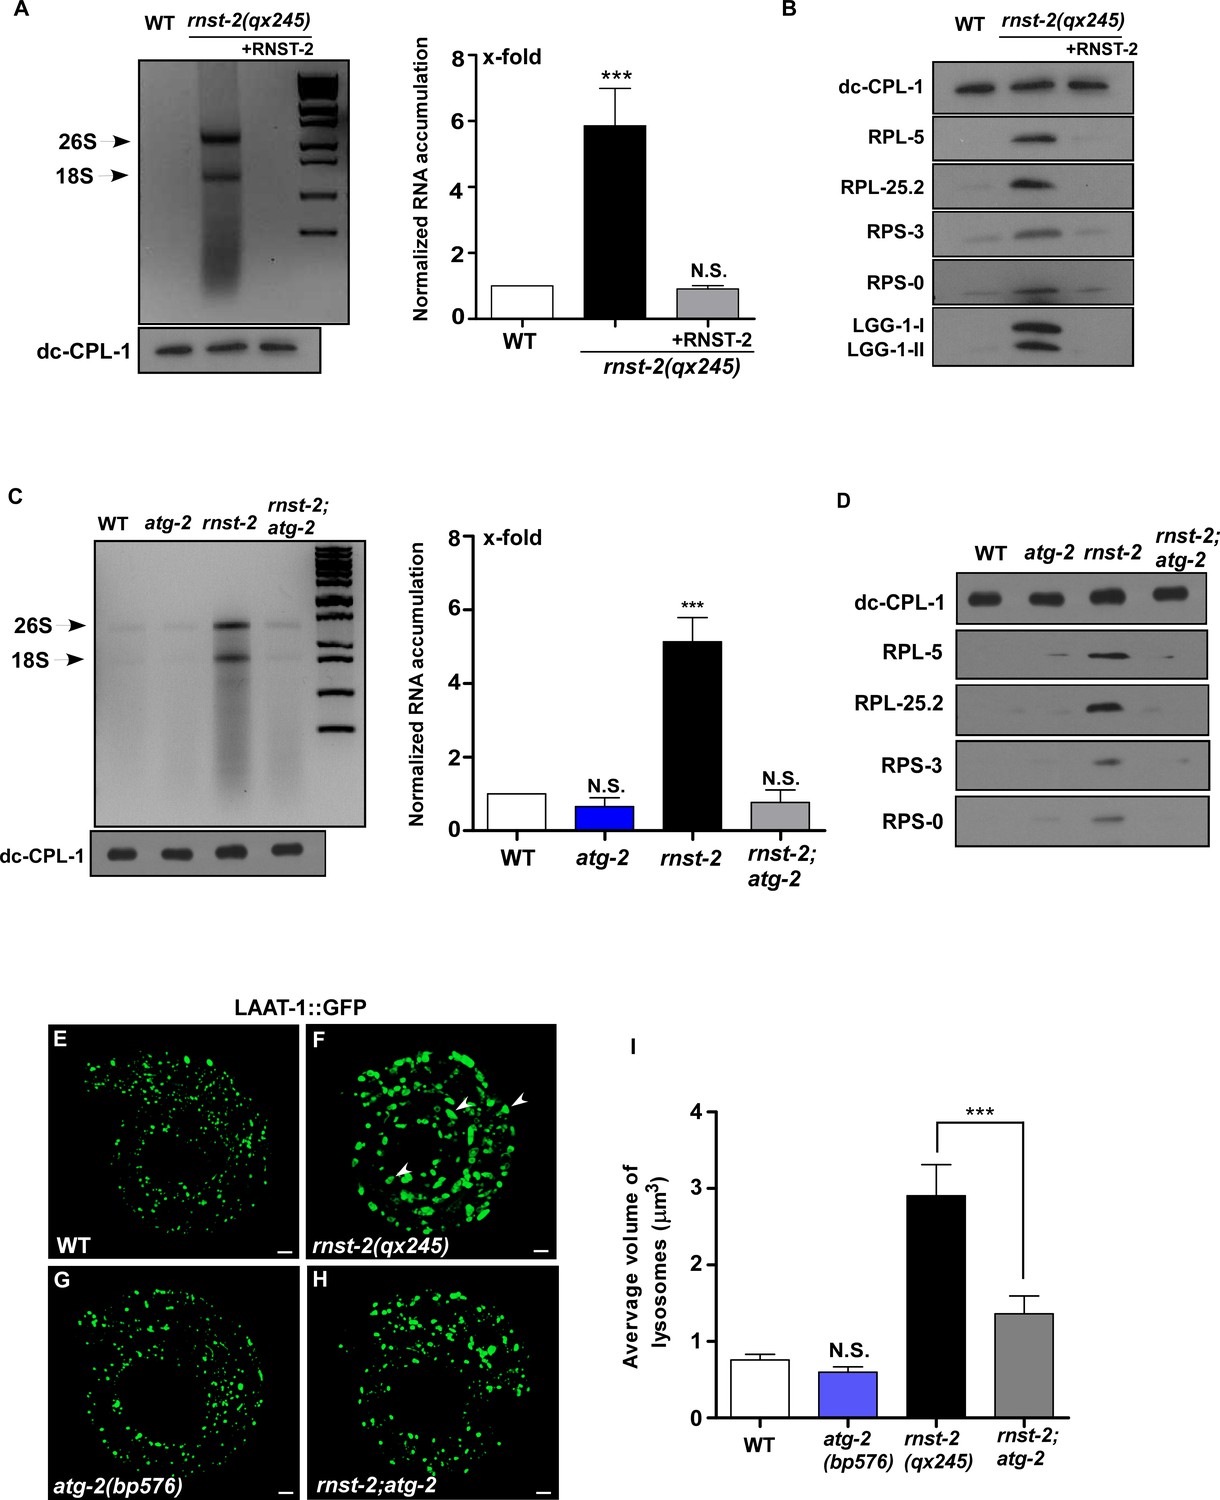
Loss of RNST-2 causes accumulation of rRNA and ribosomal proteins in lysosomes in an autophagy-dependent manner.
(A, C) RNA purified from lysosomes in the indicated strains was examined by agarose gel electrophoresis. Full processing of the lysosomal cathepsin CPL-1 (dc-CPL-1) was used to normalize the amount of lysosomes in each strain. The total extracted RNA was quantified and normalized to 1-fold in wild type (A, C, right panel). Abundant 26S and 18S rRNA was observed in lysosomes of rnst-2(qx245) mutants. At least three independent experiments were performed and data are shown as mean ± SD. (B, D) Accumulation of ribosomal proteins (large subunit: RPL-5, RPL-25.2; small subunit: RPS-3 and RPS-0) and LGG-1 in lysosomes was examined by western blot analysis in the indicated strains. Full processing of the lysosomal cathepsin CPL-1 (dc-CPL-1) was used to normalize the amount of lysosomes in each strain. (E–H) 3D reconstitution of the fluorescence images in 10–15 z-series (0.5 µm/section) in L1 larvae of the indicated strains expressing LAAT-1::GFP. Enlarged lysosomes (arrowheads) were observed in rnst-2(qx245). (I) Quantification of the average volume of lysosomes in the strains shown in (E–H). At least 10 worms were scored in each strain and data are shown as mean ± SD. In (A, C, I), one-way ANOVA with Tukey’s post hoc test was performed to compare all other datasets with wild type or datasets that are linked by lines (I). ***p<0.0001, N.S.: no significance.
-
Figure 3—source data 1
Figure 3 numerical data.
- https://doi.org/10.7554/eLife.36588.011
-
Figure 3—source data 2
Figure 3—figure supplement 1 numerical data.
- https://doi.org/10.7554/eLife.36588.012
-
Figure 3—source data 3
Figure 3—figure supplement 2 numerical data.
- https://doi.org/10.7554/eLife.36588.013
Figure 3—figure supplement 1
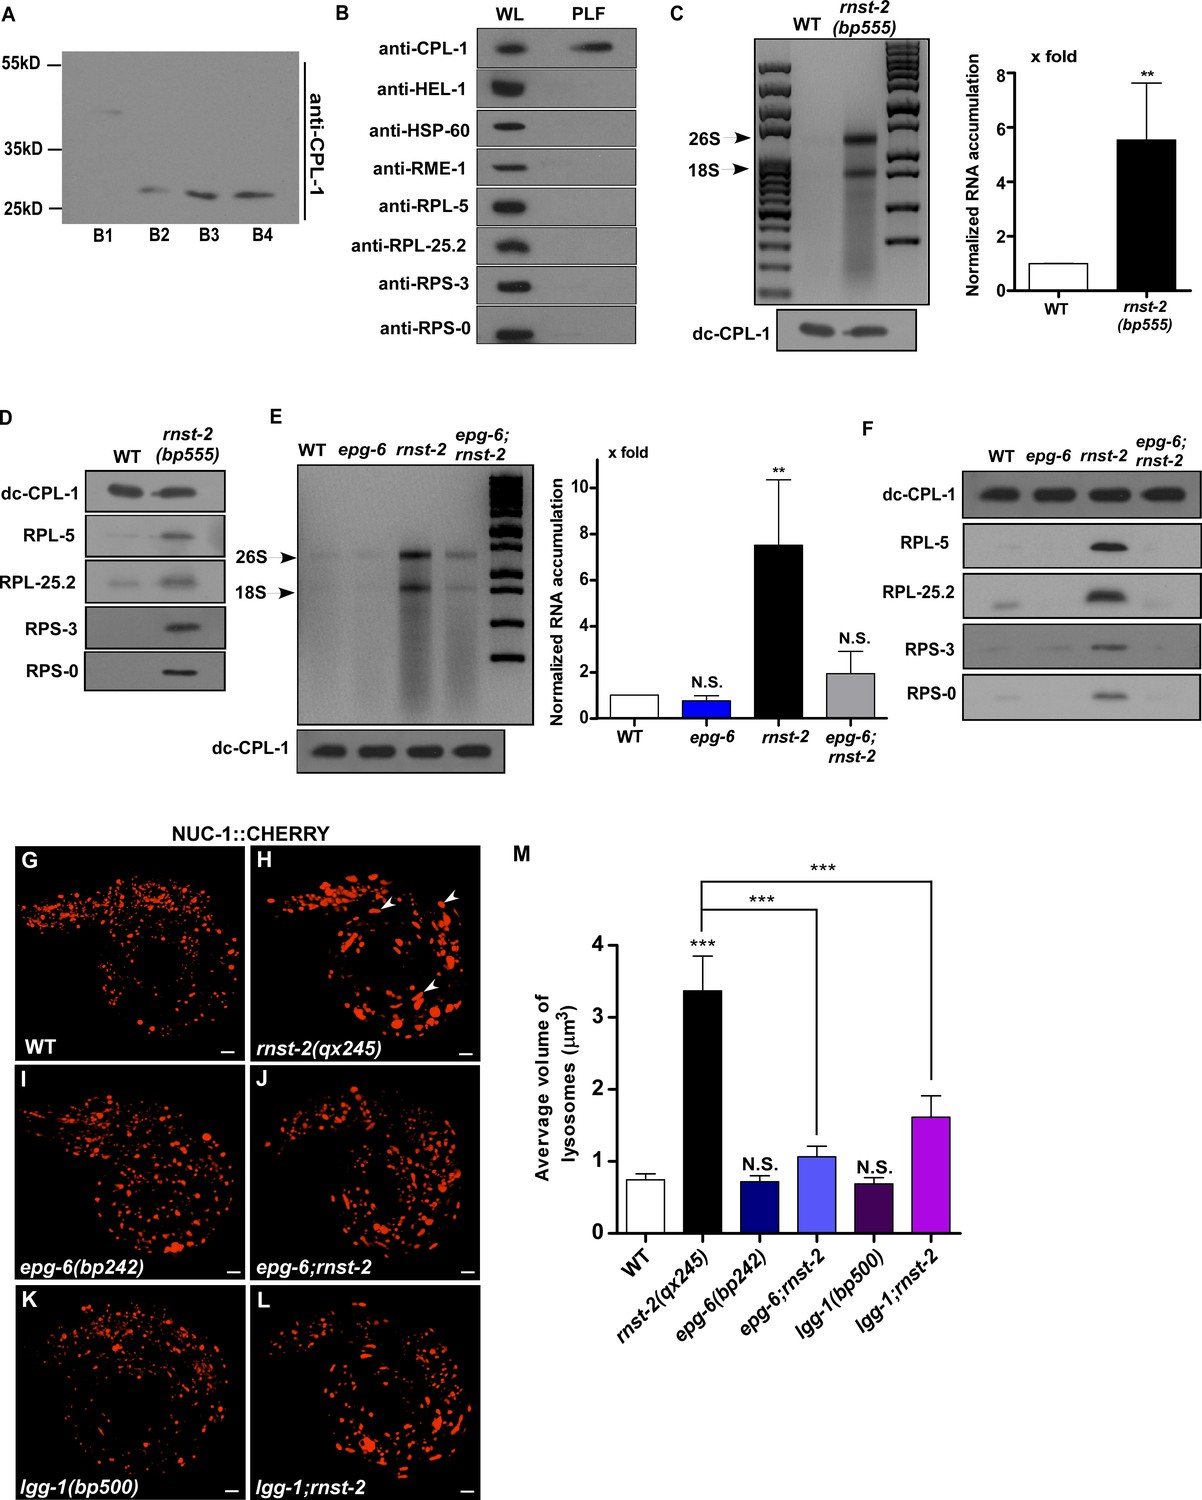
Lysosomal accumulation of rRNA and ribosomal proteins in rnst-2 is suppressed by blocking autophagy.
(A) The processing of the lysosomal cathepsin CPL-1 is revealed by western blot using anti-CPL-1 antibodies (full length: 38 KD, processed active form: 27 KD), and was used to determine the enrichment of lysosomes in different fractions (B1-4) separated by a density gradient as described in the Materials and methods. Fraction B3 was used as the purified lysosomal fraction (PLF). (B) The purity of PLF was examined by western blot using antibodies that recognize proteins in nuclei (anti-HEL-1), mitochondria (anti-HSP-60), endosomes (anti-RME-1) or ribosomes (anti-RPL-5, anti-RPL-25.2, anti-RPS-3, anti-RPS-0). The whole worm lysate (WL) and PLF was normalized using fully processed CPL-1. (C–F) Accumulation of RNA (C, E) and ribosomal proteins (D, F) in lysosomes was examined in the indicated strains. Fully processed CPL-1 (dc-CPL-1) was used to normalize the amount of lysosomes in different strains. Total RNA purified from lysosomes was quantified and normalized as 1-fold in wild type. At least three independent experiments were performed and data are shown as mean ± SD. (G–L) 3D reconstitution of the fluorescence images in 10–15 z-series (0.5 µm/section) in L1 larvae of the indicated strains expressing NUC-1::CHERRY. Arrowheads indicate enlarged lysosomes in rnst-2(qx245). (M) Quantification of the average volume of lysosomes in the indicated strains. At least 10 worms were quantified in each strain and data are shown as mean ± SD. In (C, E, M), Student’s two-tailed unpaired t test (C) or one-way ANOVA with Tukey’s post hoc test (E, M) was performed to compare other datasets with wild type or datasets that are linked by lines. ***p<0.0001, N.S.: no significance.
Figure 3—figure supplement 2
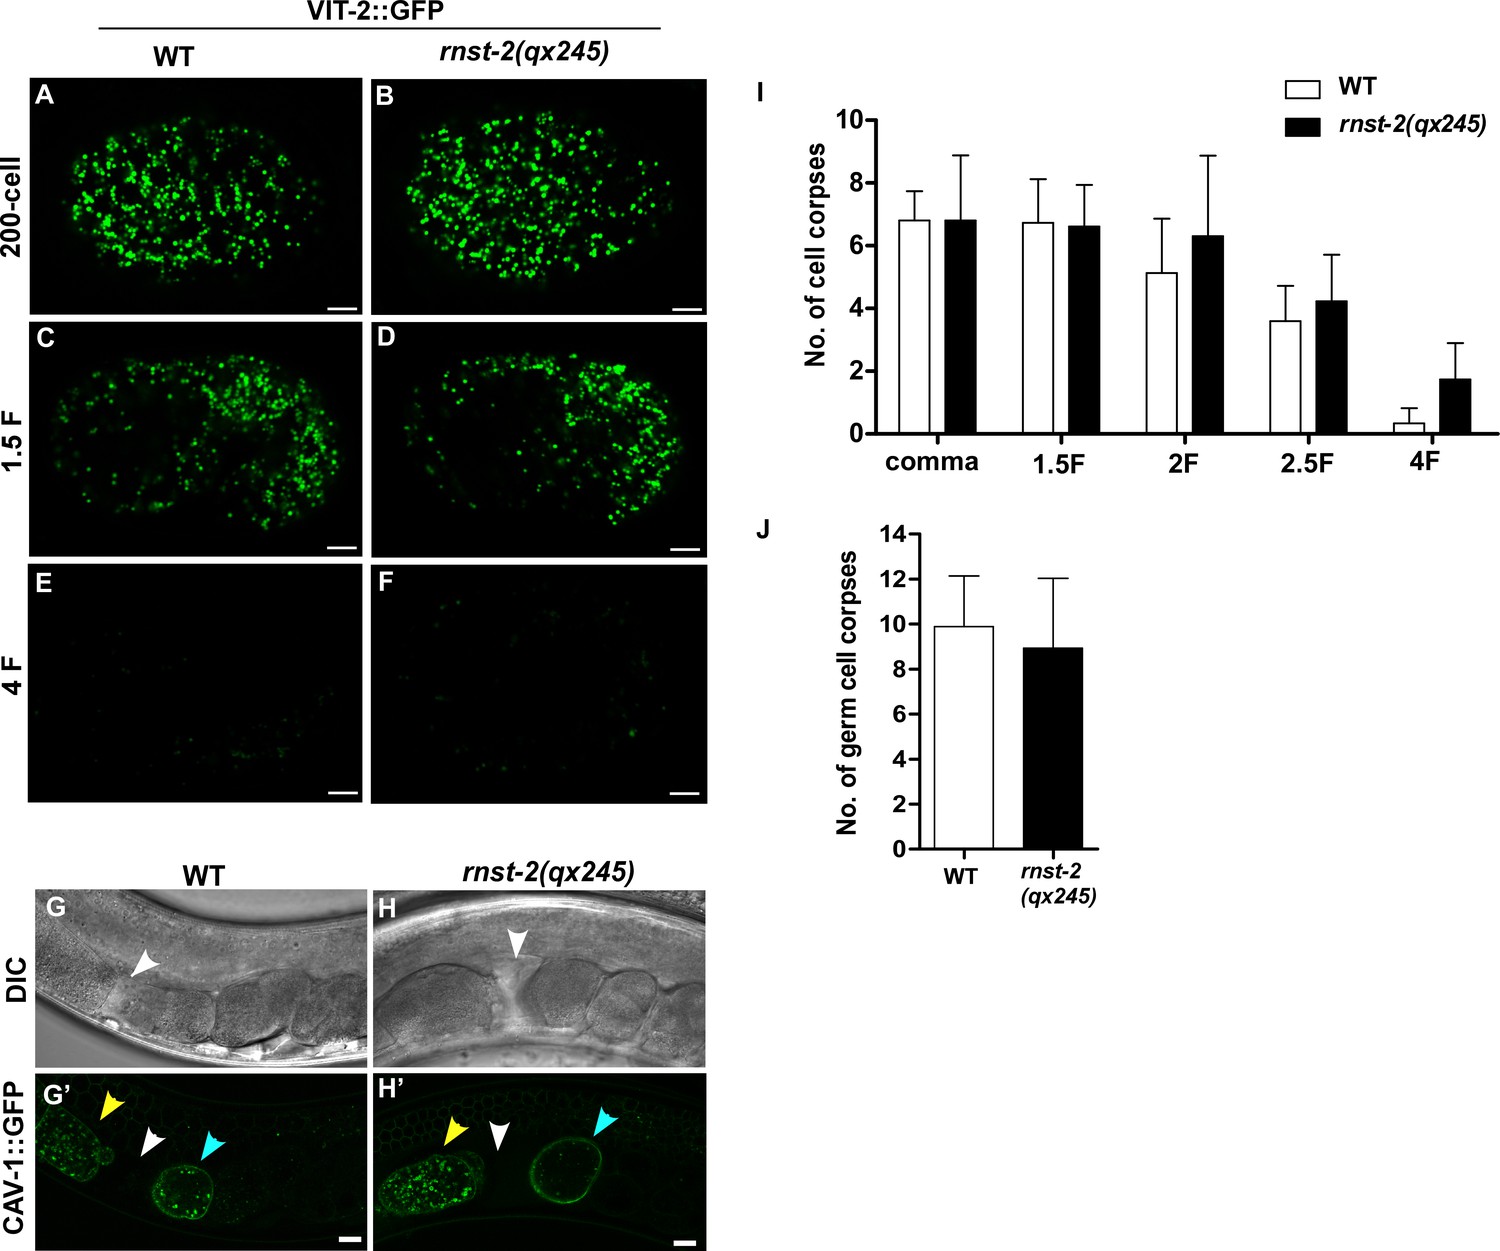
Loss of RNST-2 does not affect degradation of endocytic and phagocytic cargos.
(A–F) Confocal fluorescence images of embryos in wild type (A, C, E) and rnst-2(qx245) (B, D, F) expressing VIT-2::GFP at different stages. (G–H’) DIC and confocal fluorescence images of the day three adult in wild type (G, G’) and rnst-2(qx245) (H, H’) expressing CAV-1::GFP. White arrowheads indicate spermatheca, yellow and blue arrowheads indicate oocytes and embryos, respectively. Scale bars: 5 µm. (I, J) Quantification of embryonic (I) and germ cell corpses (J) in wild type and rnst-2(qx245). At least 10 worms were scored in each strain and data are shown as mean ± SD. Two-way ANOVA with the Bonferroni post hoc test (I) or Student’s two-tailed unpaired t test (J) was performed to compare other datasets with wild type. All points had p>0.05.
Figure 4 with 2 supplements
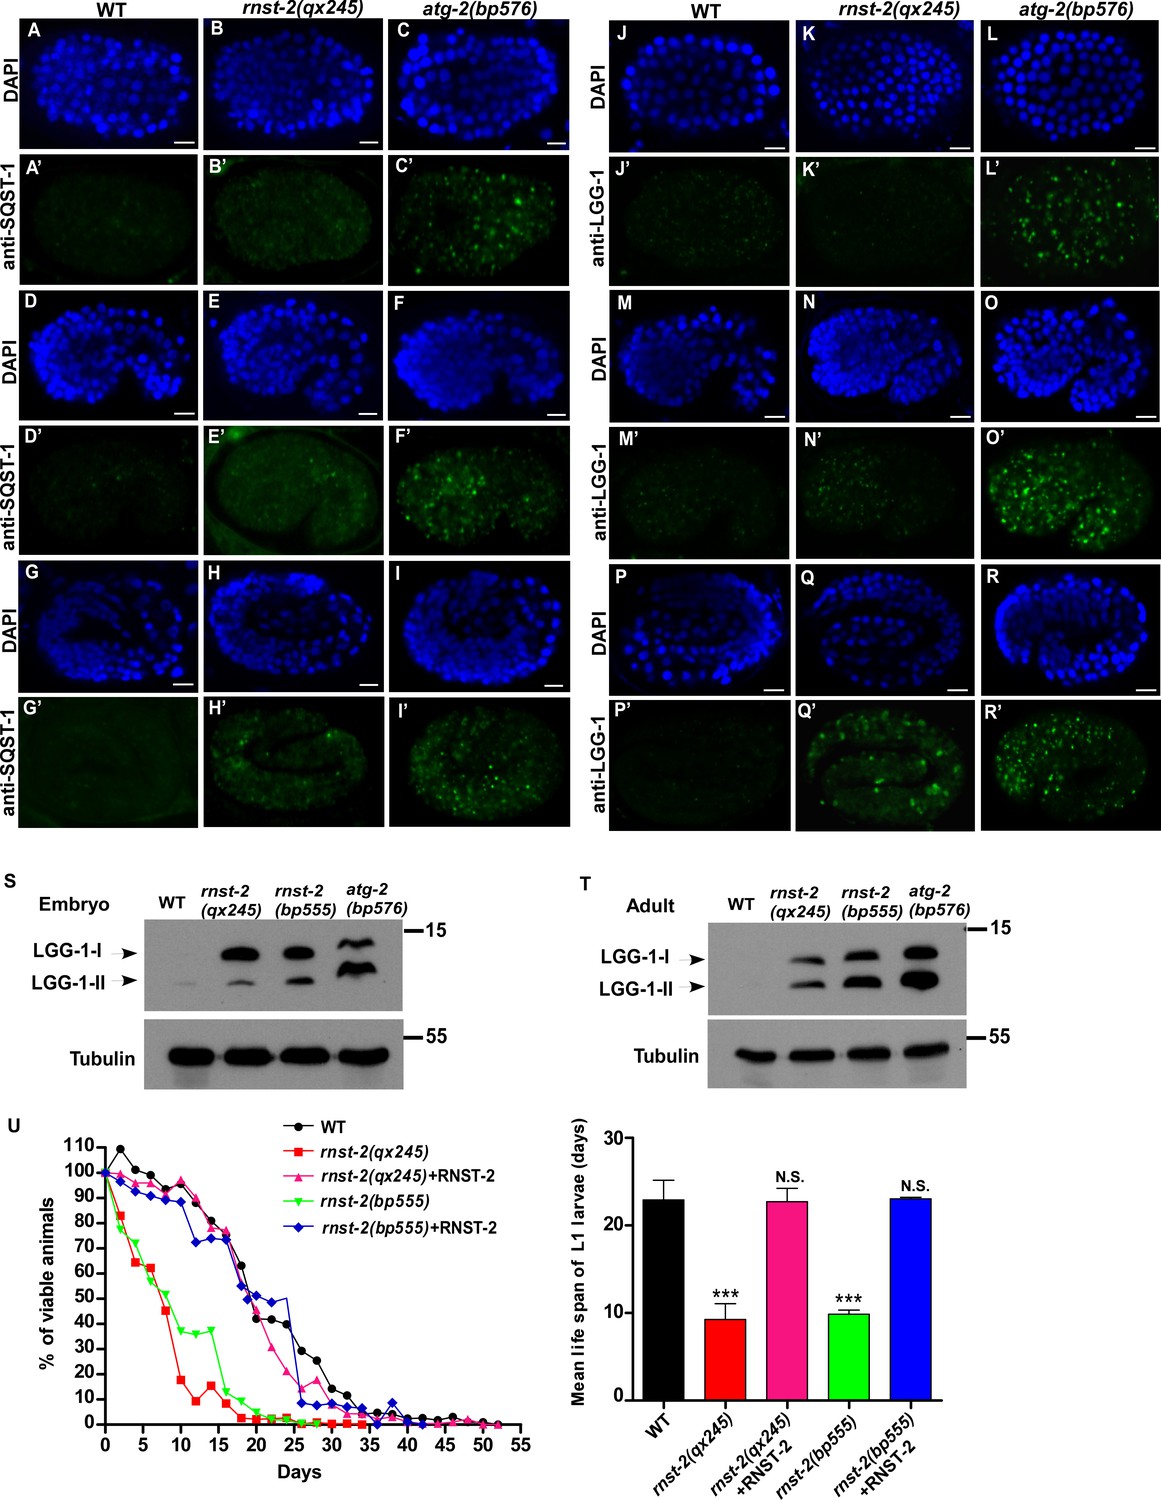
Autophagy is partially impaired in rnst-2 mutants.
(A–R’) Confocal fluorescence images of embryos in wild type (WT), rnst-2(qx245) and atg-2(bp576) at 200 cell (A–C’, J–L”), comma (D–F’, M–O’) and 4-fold (G–I’, P–R’) stages stained by anti-SQST-1 (A–I’) or anti-LGG-1 antibodies (J–R’). DAPI staining shows nuclei in each embryo. Scale bars: 5 µm. (S, T) Western blot analysis of LGG-1-I and LGG-1-II (lipid-conjugated form) in wild-type, rnst-2(qx245), rnst-2(bp555) and atg-2(bp576) at the embryonic (S) and adult stages (day 3 of adulthood) (T). (U) The survival of L1 larvae in the absence of food was quantified in the indicated strains. At least 200 animals were scored at each time point in each strain. three independent experiments were performed and the mean lifespan of L1 larvae in the absence of food was quantified (right panel). The data are shown as mean ± SD. One-way ANOVA with Tukey’s post hoc test was performed to compare mutant datasets with wild type. ***p<0.0001, N.S., no significance.
-
Figure 4—source data 1
Figure 4 numerical data.
- https://doi.org/10.7554/eLife.36588.017
Figure 4—figure supplement 1
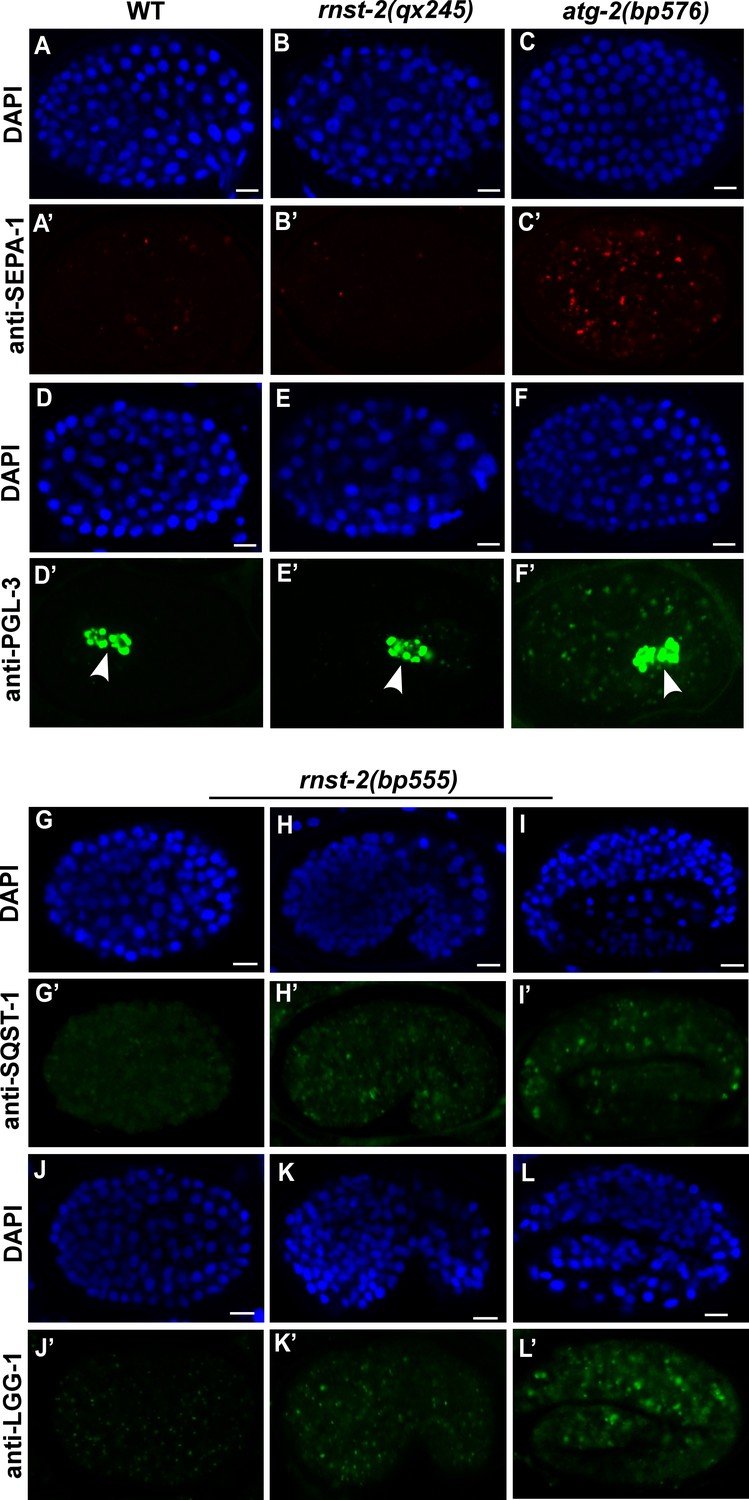
Autophagic clearance of PGL granule is not affected in rnst-2 mutants.
Confocal fluorescence images of embryos in wild type (A–A’, D–D’), rnst-2(qx245) (B–B’, E–E’), atg-2(bp576) (C–C’, F–F’) and rnst-2(bp555) (G–L’) stained by anti-SEPA-1 (A–C’), anti-PGL-3 (D–F’), anti-SQST-1 (G–I’) or anti-LGG-1 (J–L’) antibodies at 200 cell (A–G’, J, J’), comma (H, H’, K, K’) and 4-fold (I, I’, L, L’) stages. White arrowhead indicates PGL-3 in the germline precursor cells, which is not removed by autophagy. DAPI staining shows nuclei in each embryo. Scale bars: 5 µm.
Figure 4—figure supplement 2
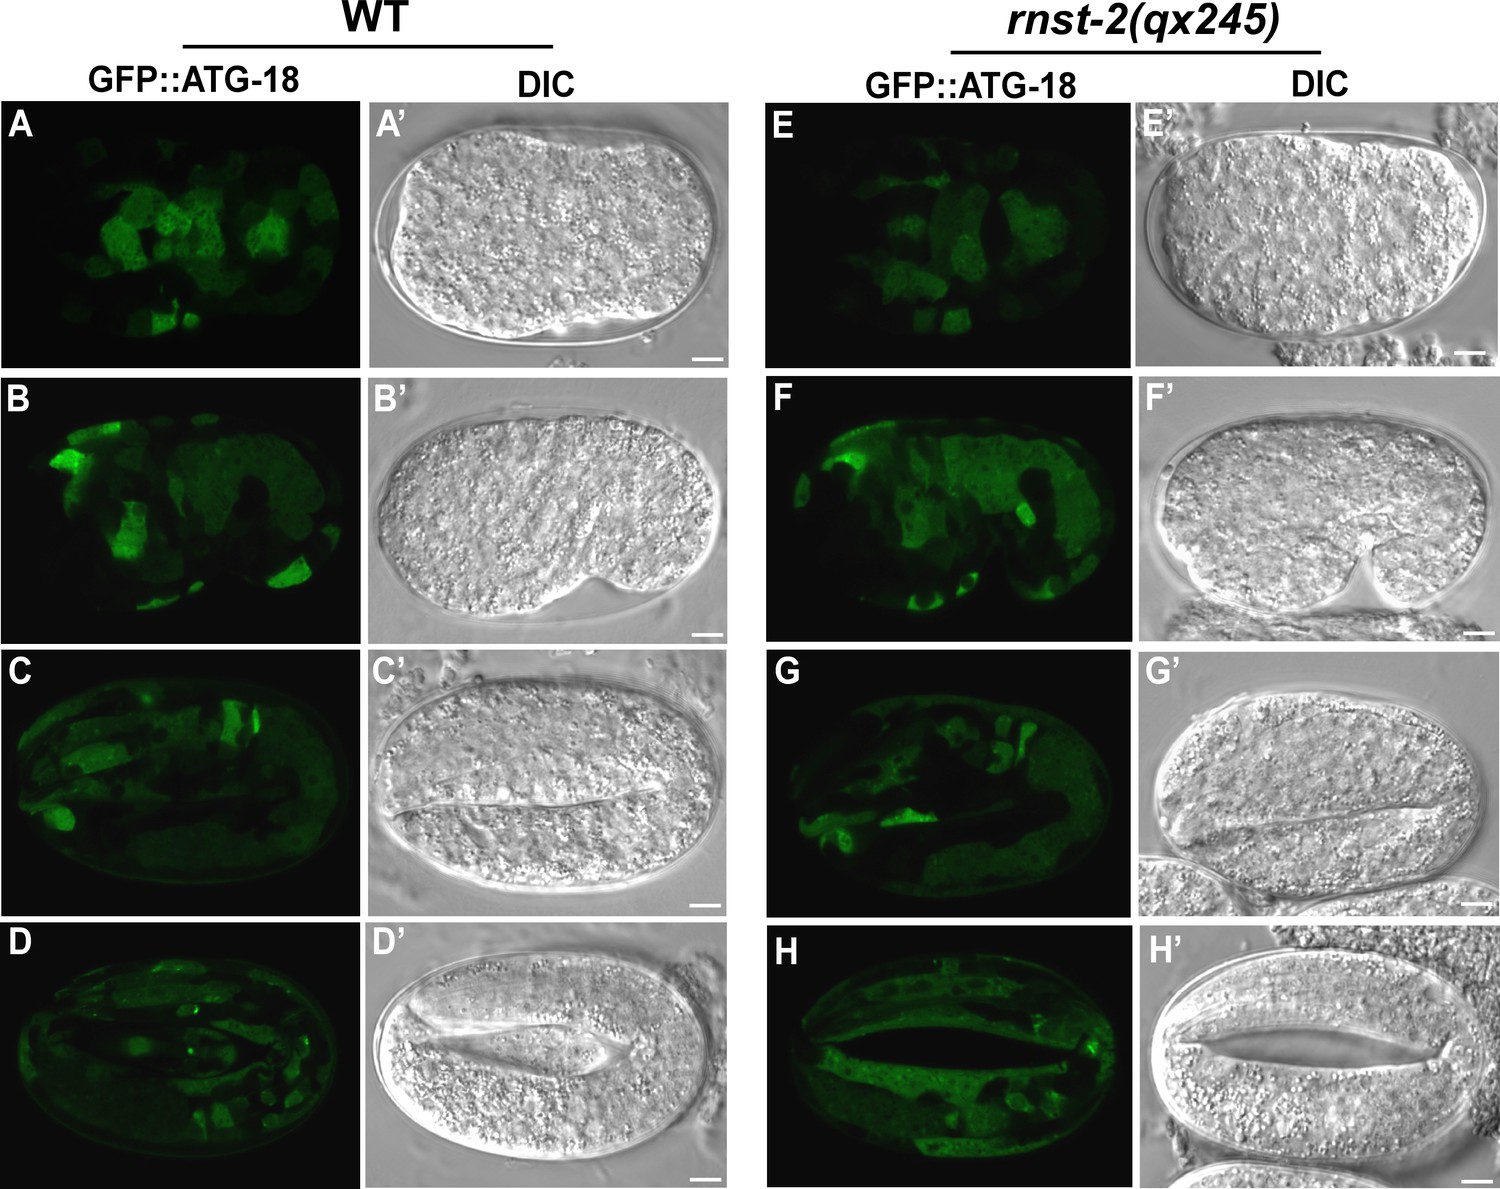
GFP::ATG-18 is diffuse in the cytoplasm of wild-type and rnst-2 mutant embryos.
DIC and confocal fluorescence images of embryos in wild type (A–D’) and rnst-2(qx245) (E– H’) expressing GFP::ATG-18 at pre-comma (A, A’, E, E’), comma (B, B’, F, F’), 2-fold (C, C’, G, G’) and 4-fold (D, D’, H, H’) stages. Scale bars: 5 µm.
Figure 5
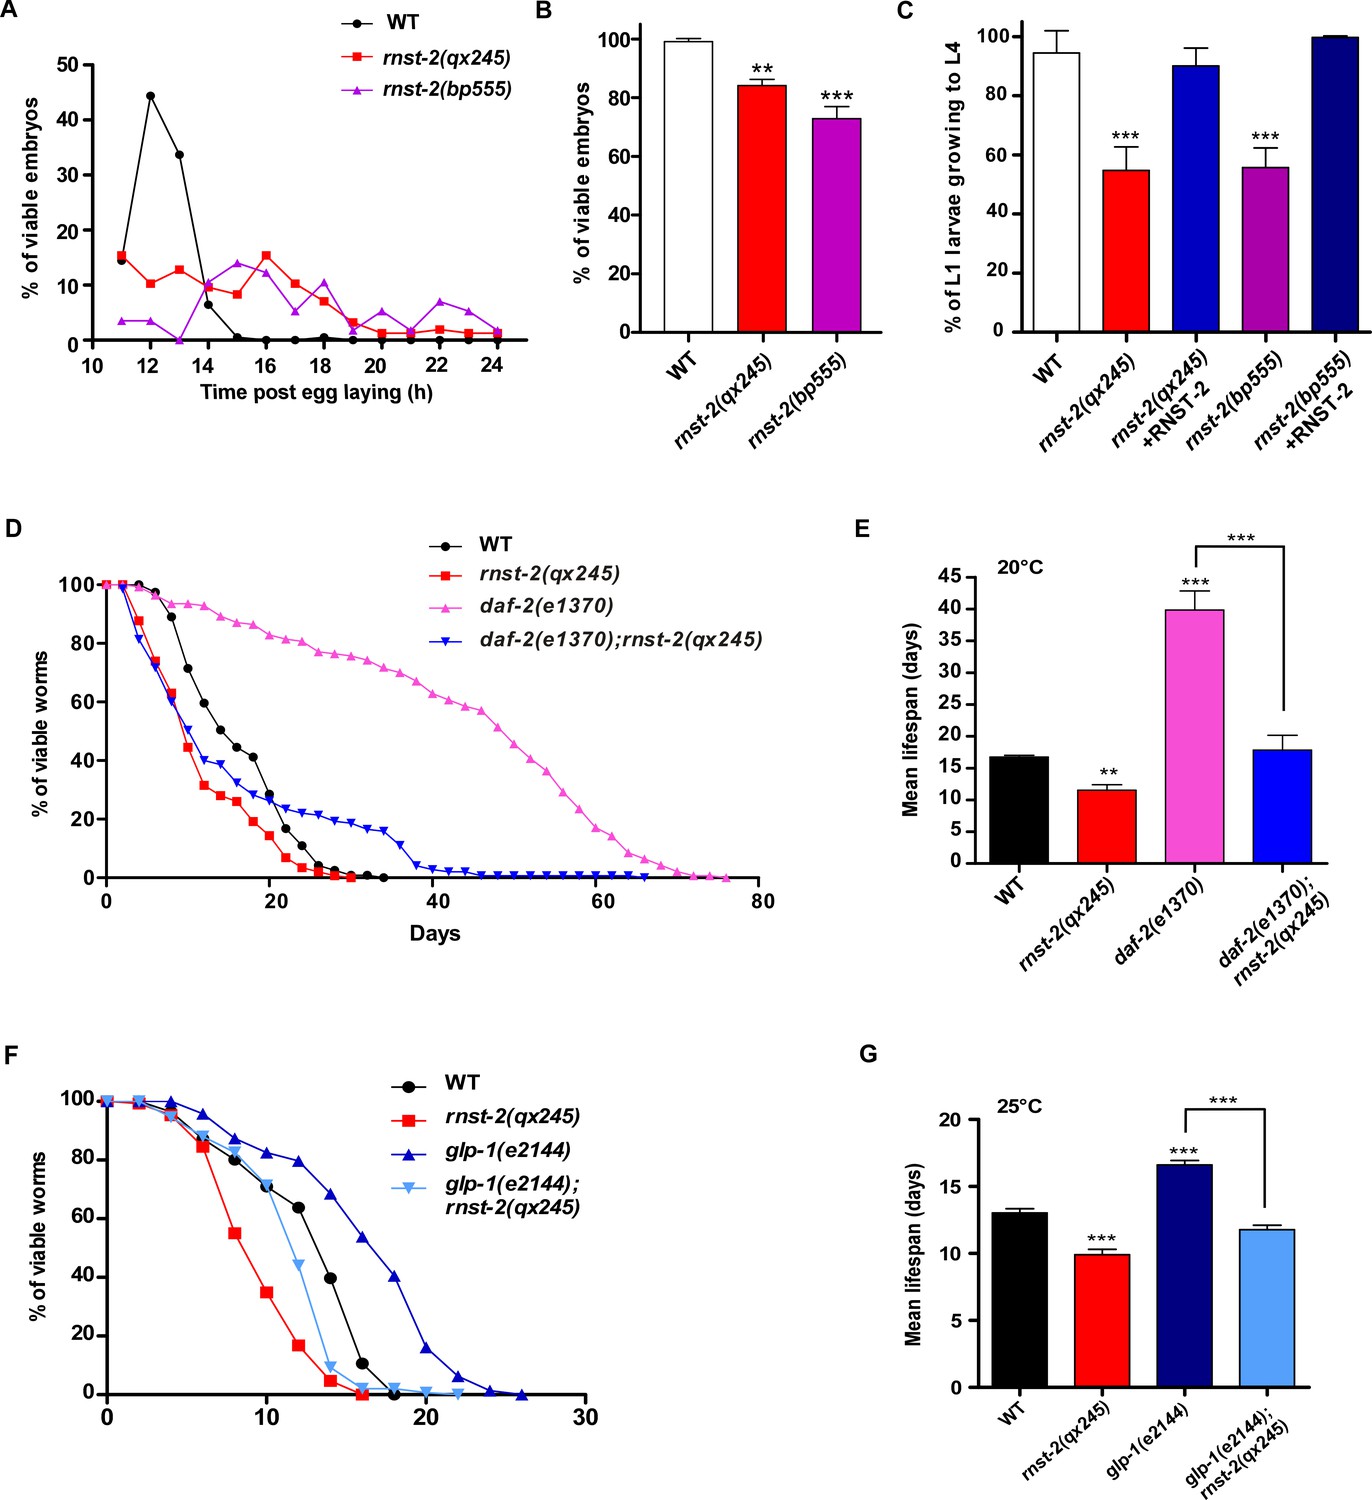
rnst-2 mutants are defective in embryogenesis and larval development, and are short-lived.
(A–C) Embryonic and larval development was examined in wild type, rnst-2(qx245) and rnst-2(bp555). At least 150 embryos and 100 larvae were examined in each strain and at least three independent experiments were performed. (D–G) Lifespan analyses were performed in the indicated strains. More than 100 worms were examined in each strain and three independent experiments were performed. The mean lifespan in the indicated strains was quantified and is shown in (E, G). Data are shown as mean ± SD. One-way ANOVA with Tukey’s post hoc test was performed to compare datasets with wild type or datasets that are linked by lines. *p<0.05, **p<0.001, ***p<0.0001.
-
Figure 5—source data 1
Figure 5 numerical data.
- https://doi.org/10.7554/eLife.36588.019
Figure 6 with 2 supplements
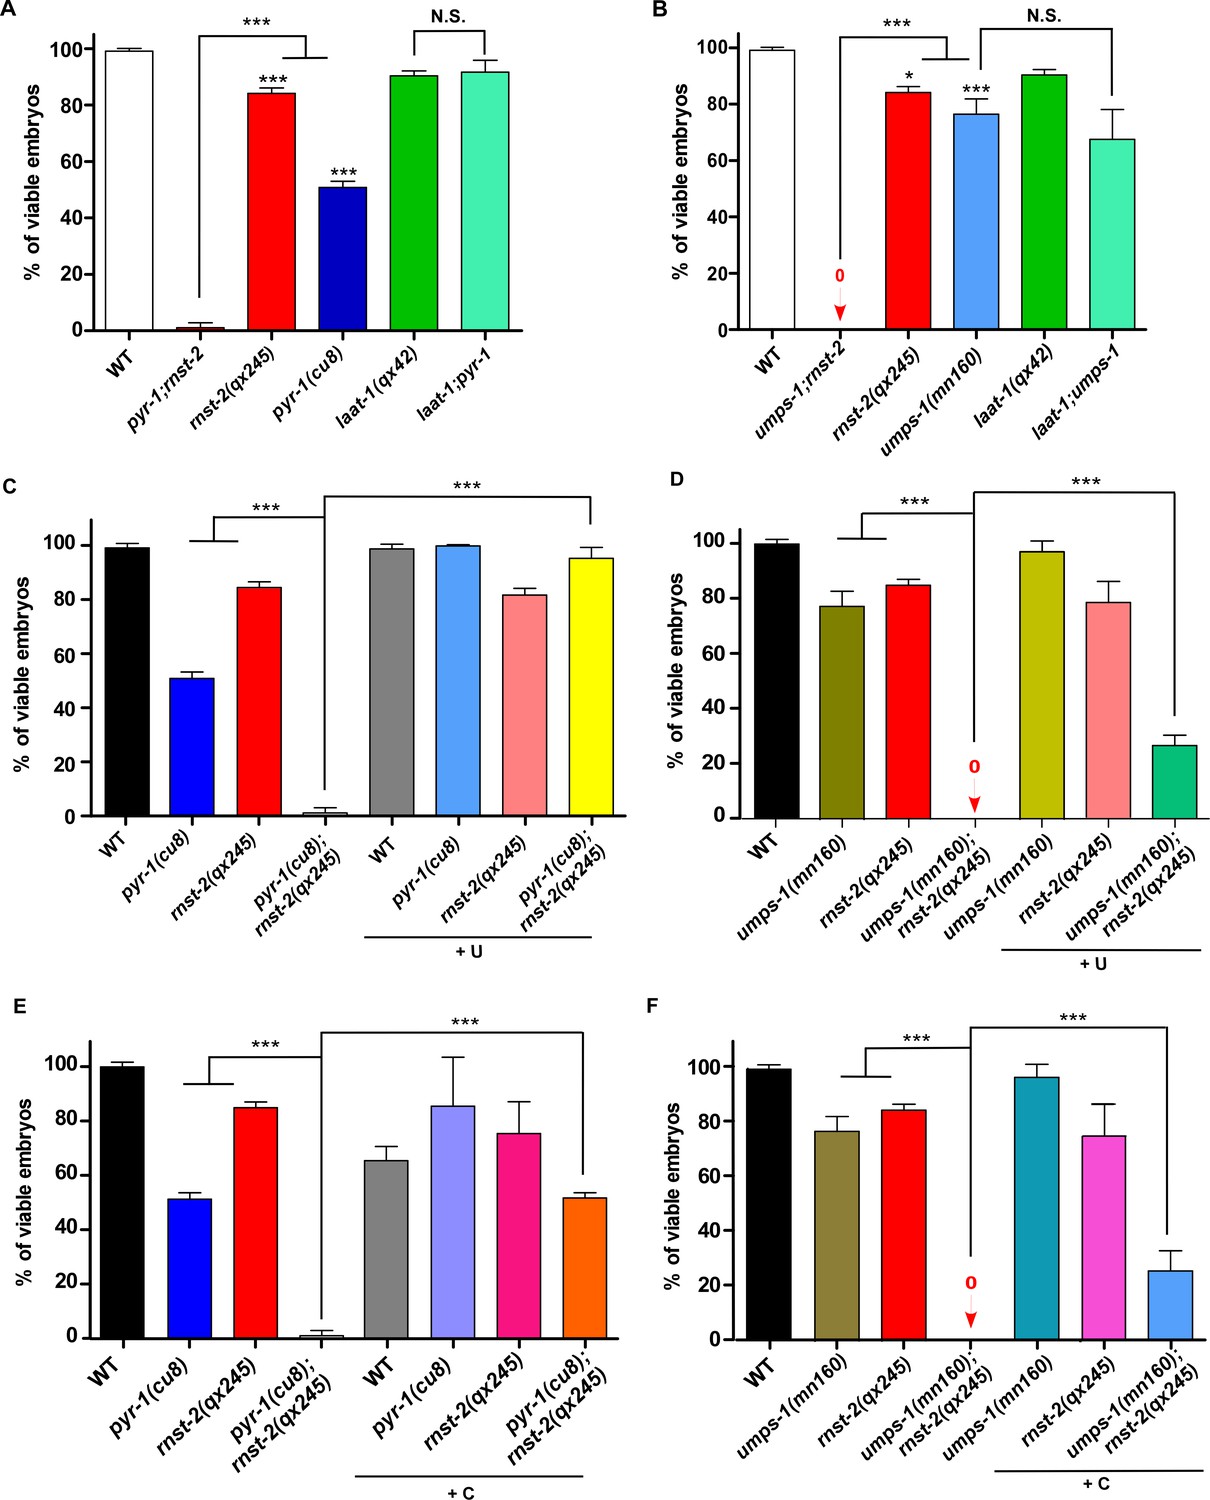
RNST-2 maintains pyrimidine availability for embryonic development.
The percentage of viable embryos was scored in the indicated strains without (A, B) or with uridine (C, D) or cytidine supplementation (E, F). At least 150 embryos were examined in each strain and three independent experiments were performed. Data are shown as mean ± SD. One-way ANOVA with Tukey’s post hoc test was performed to compare all other datasets with wild type or datasets that are linked by lines. *p<0.05, **p<0.001, ***p<0.0001, N.S.: no significance.
-
Figure 6—source data 1
Figure 6 numerical data.
- https://doi.org/10.7554/eLife.36588.023
-
Figure 6—source data 2
Figure 6—figure supplement 1 numerical data.
- https://doi.org/10.7554/eLife.36588.024
-
Figure 6—source data 3
Figure 6—figure supplement 2 numerical data.
- https://doi.org/10.7554/eLife.36588.025
Figure 6—figure supplement 1
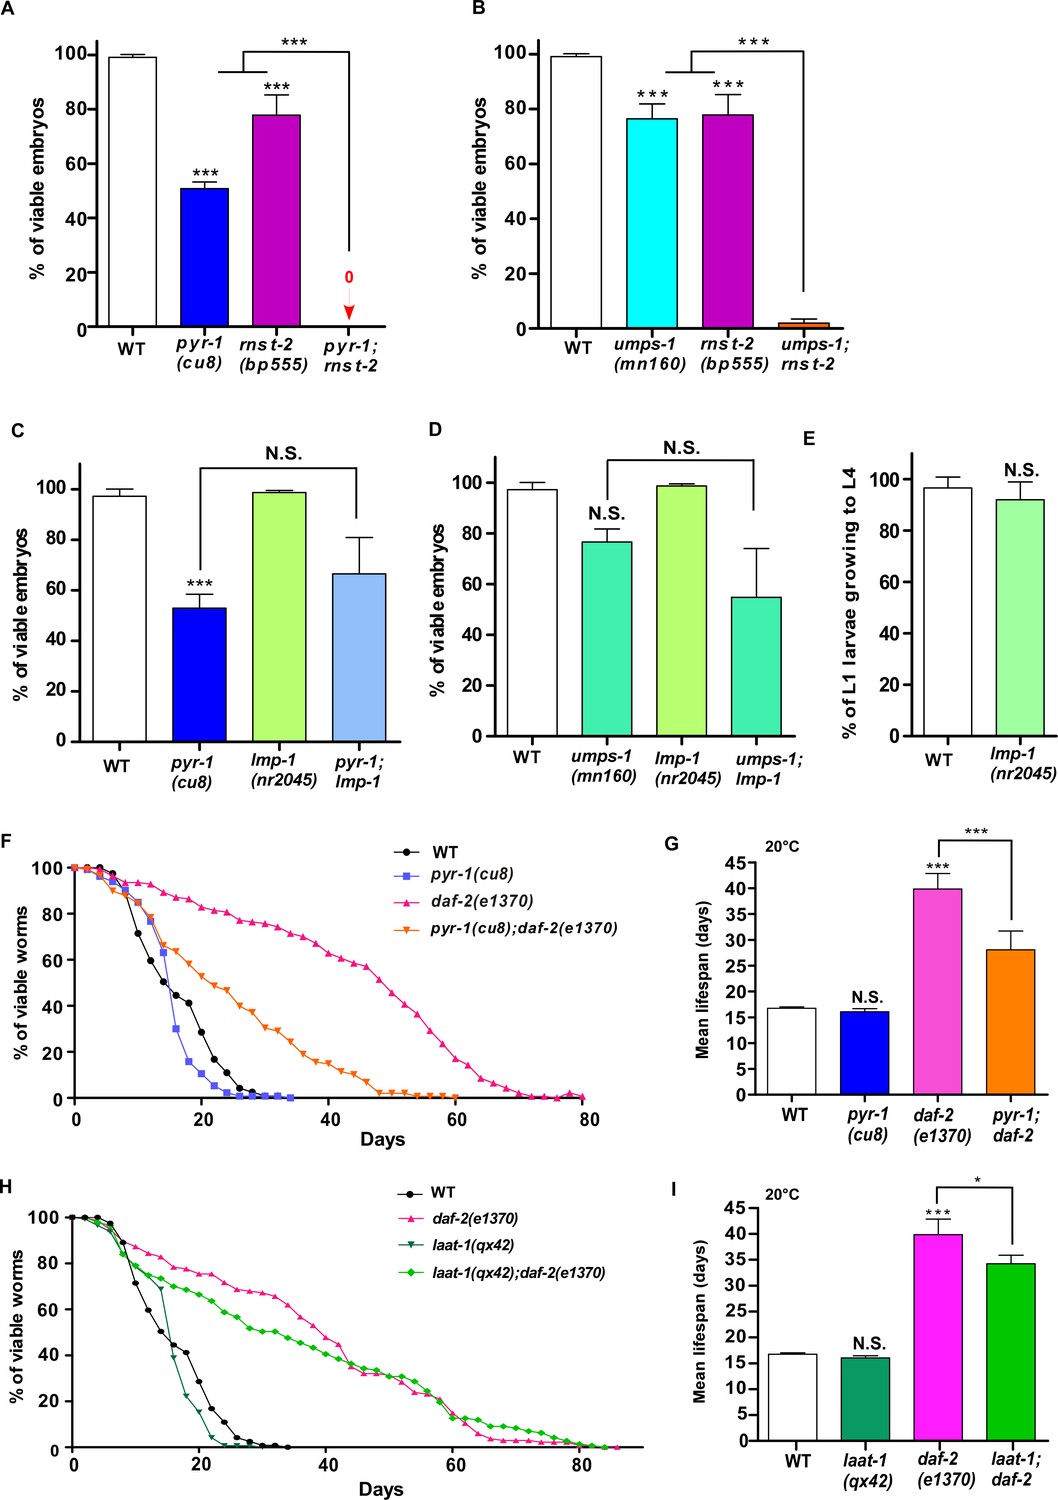
Loss of RNST-2 function but not a general lysosomal defect leads to synthetic embryonic lethality in pyr-1 and umps-1 mutants.
(A–E) The percentage of viable embryos (A–D) and L1 larvae growing to L4 (E) was quantified in the indicated strains. At least 150 embryos or 100 larvae were examined in each strain and at least three independent experiments were performed. (F–I) Lifespan analyses were performed in the indicated strains. More than 100 worms were examined in each strain and three independent experiments were performed. The mean lifespan in the indicated strains was quantified and is shown in (G, I). In (A–E, G, I), data are shown as mean ± SD. One-way ANOVA with Tukey’s post hoc test (A–D, G, I) or Student’s two-tailed unpaired t test (E) was performed to compare datasets with wild type or datasets that are linked by lines. *p<0.05, **p<0.001, ***p<0.0001, N.S.: no significance.
Figure 6—figure supplement 2
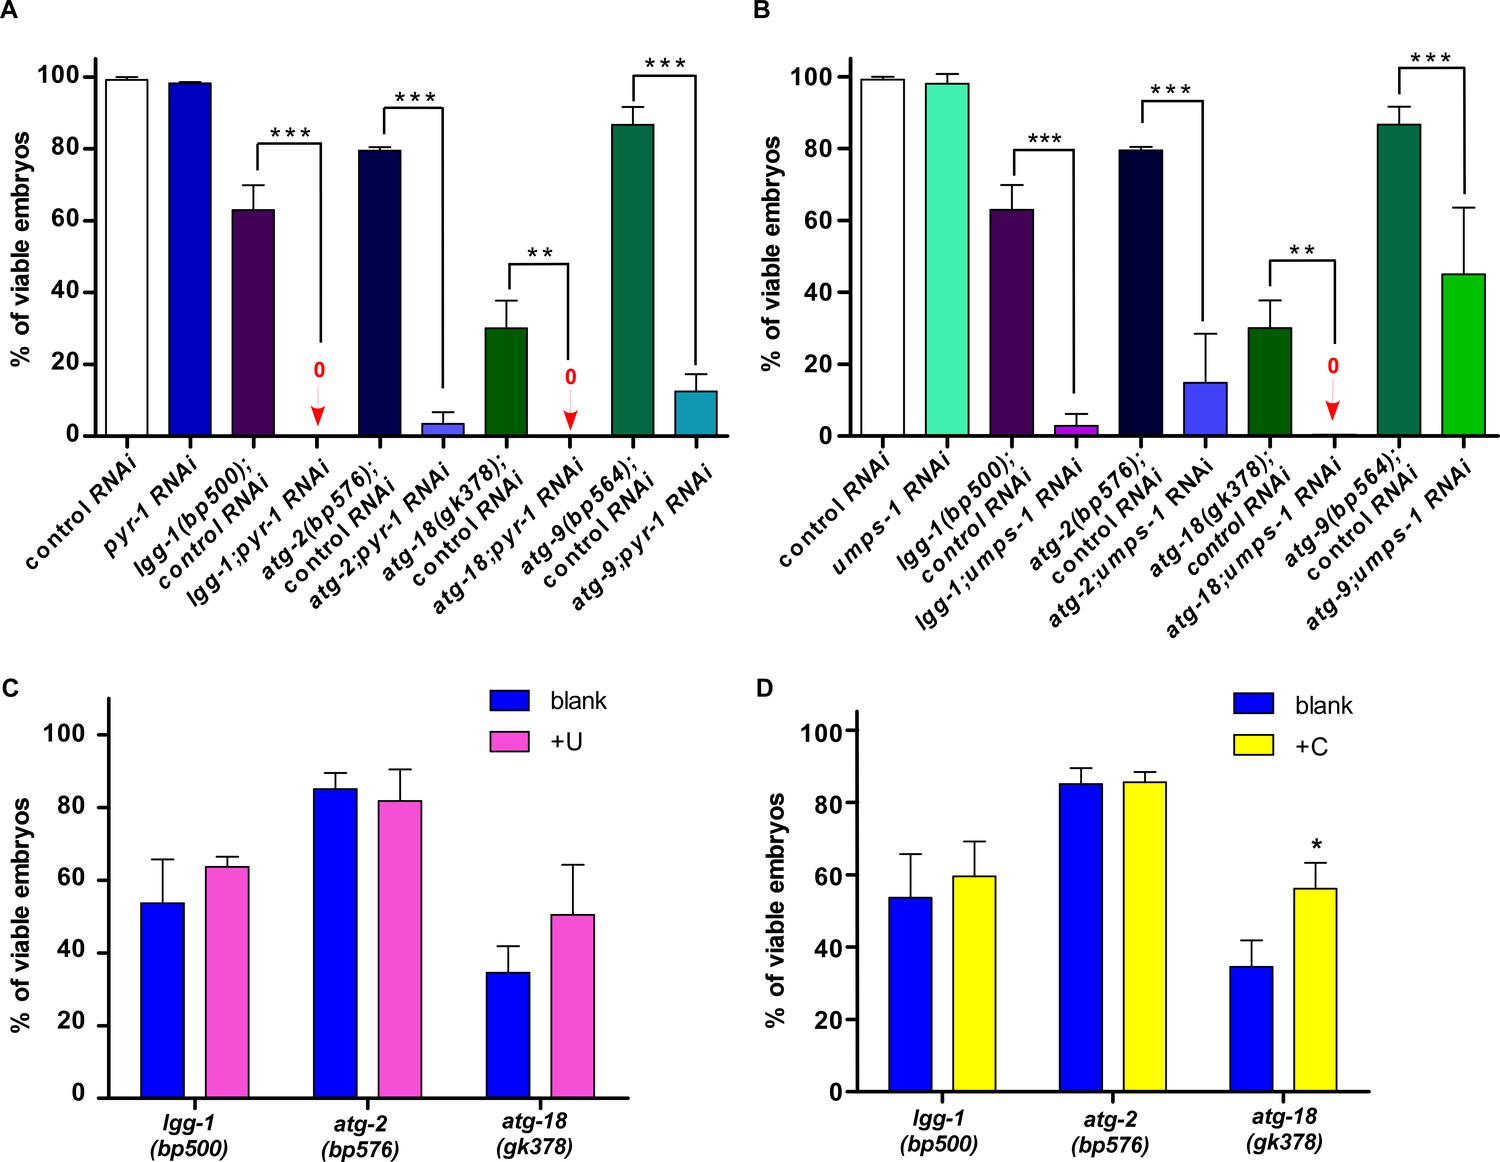
Autophagy is important for maintaining pyrimidine availability during embryonic development.
The percentage of viable embryos was quantified in the indicated strains without (A, B) or with uridine (C) or cytidine (D) treatment. At least 150 embryos were examined in each strain/treatment and at least three independent experiments were performed. One-way ANOVA with Tukey’s post hoc test (A, B) or Two-way ANOVA with the Bonferroni post hoc test (C, D) was performed to compare datasets with wild type or datasets that are linked by lines. *p<0.05, **p<0.001, ***p<0.0001, all other points had p>0.05.
Author response image 1
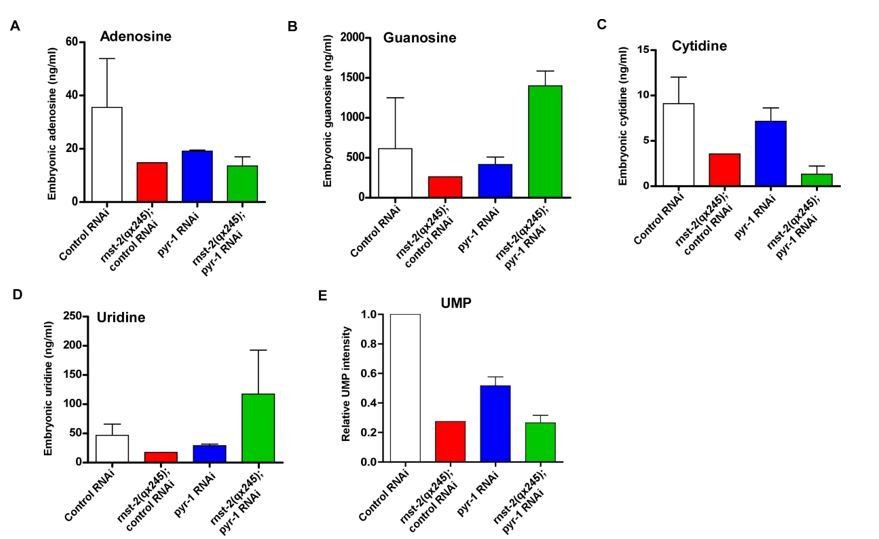
Quantitative analysis of nucleosides.
Mix-staged embryos were collected and ground. The metabolites were extracted, and nucleosides and UMP were analyzed by LC/MS. The level of each nucleoside is presented as the absolute concentration, and the UMP level is presented as normalized intensity on the basis of the total peak area.
Tables
Key resources table
| Reagent type (species) or resource | Designation | Source or reference | Identifiers | Additional information |
|---|---|---|---|---|
| Gene (C. elegans) | rnst-2 | WBGene00019624 | Other name: CELE_K10C9.3 | |
| rpl-5 | WBGene00004416 | Other name: CELE_F54C9.5 | ||
| rpl-25.2 | WBGene00004439 | Other name: CELE_F52B5.6 | ||
| rps-3 | WBGene00004472 | Other name: CELE_C23G10.3 | ||
| rps-0 | WBGene00004469 | Other name: CELE_B0393.1 | ||
| Gene (human) | rnaset2 | National Center for Biotechnology Information | Gene ID: 8635 | |
| Strain (C. elegans) | N2 | CGC | RRID:WB-STRAIN:N2_(ancestral) | wild type (Bristol) |
| XW1624 | DOI: 10.1126/science.1220281 | laat-1(qx42) | ||
| XW5331 | DOI: 10.1016/j.cell.2010.04.034 | lgg-1(bp500) | ||
| OK286 | DOI: 10.1042/BJ20131085 | RRID:WB-STRAIN:OK286 | pyr-1(cu8) | |
| HZ1690 | DOI 10.1016/j.devcel.2011.06.024 | RRID:WB-STRAIN:HZ1690 | epg-6(bp242) | |
| SP507 | DOI: 10.1042/BJ20131085 | RRID:WB-STRAIN:SP507 | umps-1(mn160) | |
| CF1041 | DOI: 10.1126/science.1139952 | daf-2(e1370) | ||
| HZ1687 | DOI: 10.1083/jcb.201209098 | RRID:WB-STRAIN:HZ1687 | atg-9(bp564) | |
| VC893 | DOI: 10.1016/j.cell.2010.04.034 | RRID:WB-STRAIN:VC893 | atg-18(gk378) | |
| XW10781 | this paper | rnst-2(qx245) | ||
| XW15104 | this paper | rnst-2(bp555) | ||
| HZ1683 | DOI 10.1016/j.devcel.2011.06.024 | RRID:WB-STRAIN:HZ1683 | atg-2(bp576) | |
| CF1903 | CGC | RRID:WB-STRAIN:CF1903 | glp-1(e2144) | |
| XW5097 | RRID:WB-STRAIN:PD4482 | lmp-1(nr2045) | ||
| XW7251 | DOI: 10.1126/science.1220281 | qxIs354 (Pced-1LAAT-1::GFP) | ||
| XW5399 | DOI: 10.1126/science.1220281 | qxIs257 (Pced-1NUC-1::CHERRY) | ||
| XW8056 | DOI: 10.1083/jcb.201602090 | qxIs430 (Pscav-3SCAV-3::GFP) | ||
| XW10197 | DOI: 10.1083/jcb.201602090 | qxIs468 (Pmyo-3LAAT-1::GFP) | ||
| XW642 | DOI: 10.1091/mbc.10.12.4311 | bIs1 (Pvit-2VIT-2::GFP) | ||
| RT688 | DOI: 10.1126/science.1220281 | pwIs281 (Ppie-1CAV-1::GFP) | ||
| XW8293 | DOI: 10.15252/embr.201438618 | qxEx4098 (Pced-1GFP:ATG-18) | ||
| XW12615 | this paper | qxIs544 (Prnst-2RNST-2::CHERRY) | ||
| XW13567 | this paper | qxEx6614 (Prnst-2RNST-2(H118A)::CHERRY) | ||
| XW8783 | this paper | qxEx4279 (Pmyo-3LAAT-1::GFP) | ||
| XW17778 | this paper | qxEx8302 (Prnst-2RNASET2-CHERRY) | ||
| Antibody | anti-RPL-5 (rat polyclonal) | this paper | WB(1:300) | |
| anti-RPL-25.2 (rat polyclonal) | this paper | WB(1:300) | ||
| anti-RPS-0 (rat polyclonal) | this paper | WB(1:1000) | ||
| anti-RPS-3 (rat polyclonal) | this paper | WB(1:1000) | ||
| anti-CPL-1 (rat polyclonal) | DOI: 10.1126/science.1220281 | WB(1:500) | ||
| anti-LGG-1 (rat polyclonal) | DOI: 10.1016/j.cell.2010.04.034 | WB(1:1000); Immunostaining(1:1000) | ||
| anti-alpha-Tubulin (mouse monoclonal) | Sigma-Aldrich (Missouri, USA) | Cat #T5168; RRID:AB_477579 | WB(1:10000) | |
| anti-SQST-1 (rat polyclonal) | DOI: 10.1016/j.cell.2010.04.034 | Immunostaining (1:1000) | ||
| anti-PGL-3 (rat polyclonal) | DOI: 10.1016/j.cell.2010.04.034 | Immunostaining (1:1000) | ||
| anti-SEPA-1 (rabbit polyclonal) | DOI: 10.1016/j.cell.2010.04.034 | Immunostaining (1:1000) | ||
| anti-HSP-60 (mouse polyclonal) | DOI: 10.1126/science.1220281 | WB(1:1000) | ||
| anti-HEL-1 (rabbit polyclonal) | DOI: 10.1126/science.1220281 | WB(1:500) | ||
| anti-RME-1 (mouse polyclonal) | DOI: 10.1126/science.1220281 | WB(1:1000) | ||
| Plasmids for generating transgenic strains | pPD49.26-Prnst-2RNST- 2::CHERRY | this paper | Cloning described in 'Plasmid construction' | |
| pPD49.26-Prnst-2 RNASET2::CHERRY | this paper | Cloning described in 'Plasmid construction' | ||
| pPD49.26-Prnst-2 RNST-2(H118A)::CHERRY | this paper | Cloning described in 'Plasmid construction' | ||
| pPD49.26-Prnst-2RNST- 2(cDNA)::CHERRY | this paper | Cloning described in 'Plasmid construction' | ||
| Plasmids for protein expression | pET-21b-rpl-25.2 | this paper | Cloning described in 'Plasmid construction' | |
| pET-21b-rpl-5 | this paper | Cloning described in 'Plasmid construction' | ||
| pET-21b-rps-0 | this paper | Cloning described in 'Plasmid construction' | ||
| pET-21b-rps-3 | this paper | Cloning described in 'Plasmid construction' | ||
| Commercial assay or kit | Lysosome Isolation Kit | Sigma-Aldrich (Missouri, USA) | Cat #LYSISO1 | |
| RNeasy Plus Universal Mini Kit | QIAGEN (Hilden, Germany) | Cat #73404 | ||
| Chemical compound, drug | Uridine | Sigma-Aldrich (Missouri, USA) | Cat #U3003 | |
| Cytidine | Sigma-Aldrich (Missouri, USA) | Cat #C4654 | ||
| DAPI | Vector Laboratories (California, USA) | Cat #H-1200; RRID:AB_2336790 | ||
| LysoTracker red | Invitrogen (Oregon, USA) | Cat #L7528 | ||
| Software, algorithm | Velocity | PerkinElmer (Massachusetts, USA) | ||
| Zen | Carl Zeiss (Oberkochen, Germany) | RRID:SCR_01367 |
Additional files
-
Transparent reporting form
- https://doi.org/10.7554/eLife.36588.026
Download links
A two-part list of links to download the article, or parts of the article, in various formats.
Downloads (link to download the article as PDF)
Open citations (links to open the citations from this article in various online reference manager services)
Cite this article (links to download the citations from this article in formats compatible with various reference manager tools)
Autophagy-dependent ribosomal RNA degradation is essential for maintaining nucleotide homeostasis during C. elegans development
eLife 7:e36588.
https://doi.org/10.7554/eLife.36588


