Dynamic density shaping of photokinetic E. coli
- Università di Roma "Sapienza", Italy
- Institute of Nanotechnology (NANOTEC-CNR), Italy
Figures
Figure 1
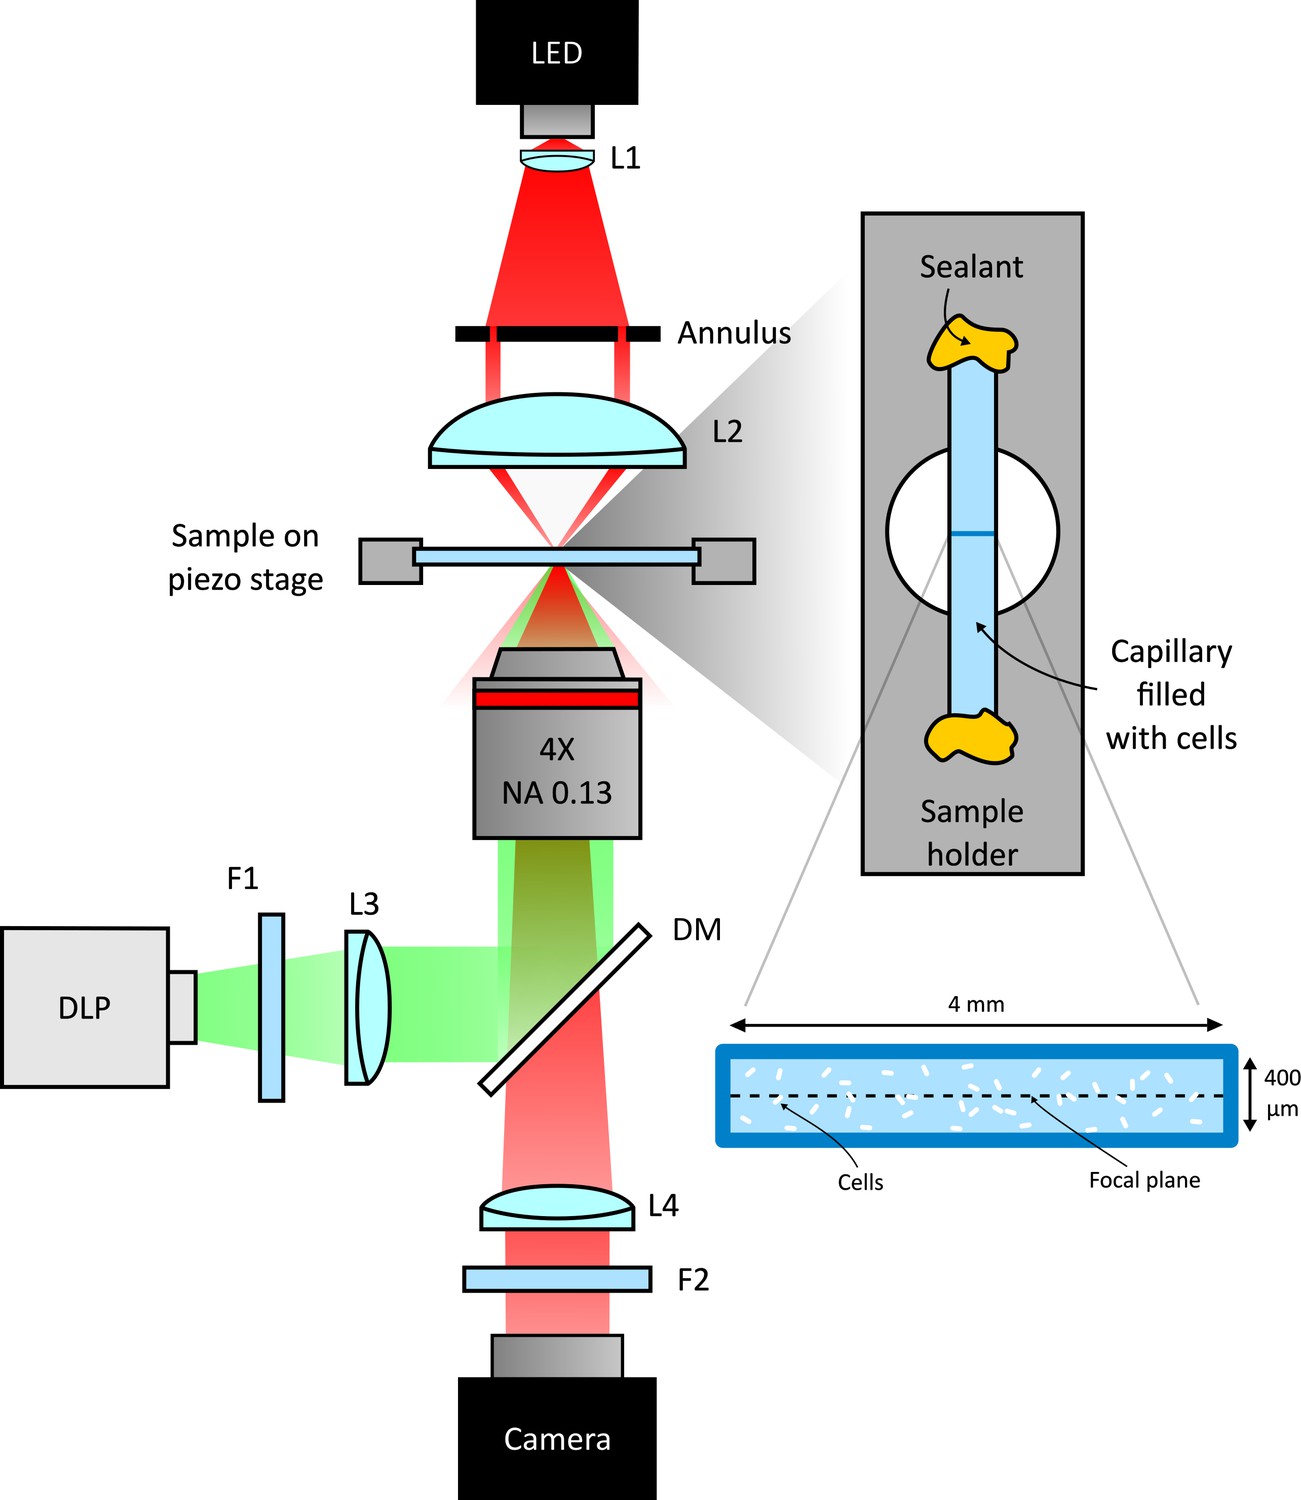
Scheme of the experimental setup.
Schematic representation of the custom inverted-microscope used in the experiments (see Materials and methods). Green light from a DMD based DLP projector is filtered by a bandpass filter F1 (central wavelength 520 nm) and than coupled to the microscope objective through a dichroic mirror (DM). A long pass filter (F2) prevents illumination light to reach the camera. Bacteria are sealed in a square microcapillary glued on a metallic sample holder with a circular aperture.
Figure 2
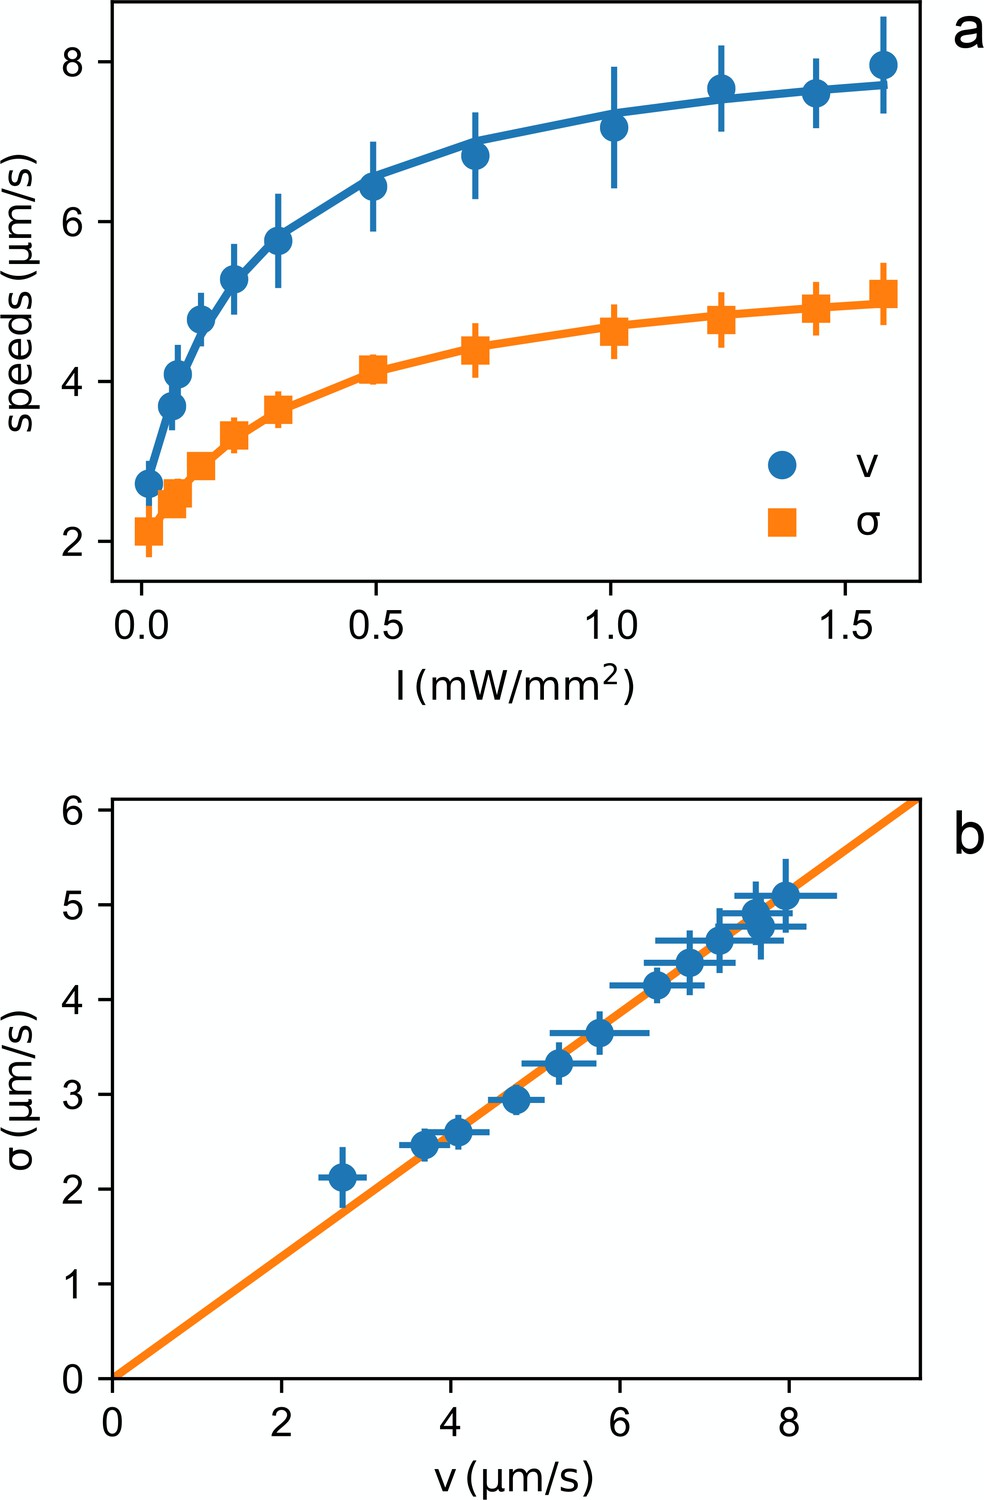
Light dependent speed distribution.
(a) Mean value (circles) and standard deviation (squares) of bacterial speeds as a function of light power density. Symbols and error bars are respectively the mean and standard deviation of 14 repeated measurements of and . Curves are fits with hyperbolas. (b) Parametric plot of vs. The line is a linear fit passing through zero.
-
Figure 2—source data 1
Source data for Figure 2
- https://doi.org/10.7554/eLife.36608.005
Figure 3
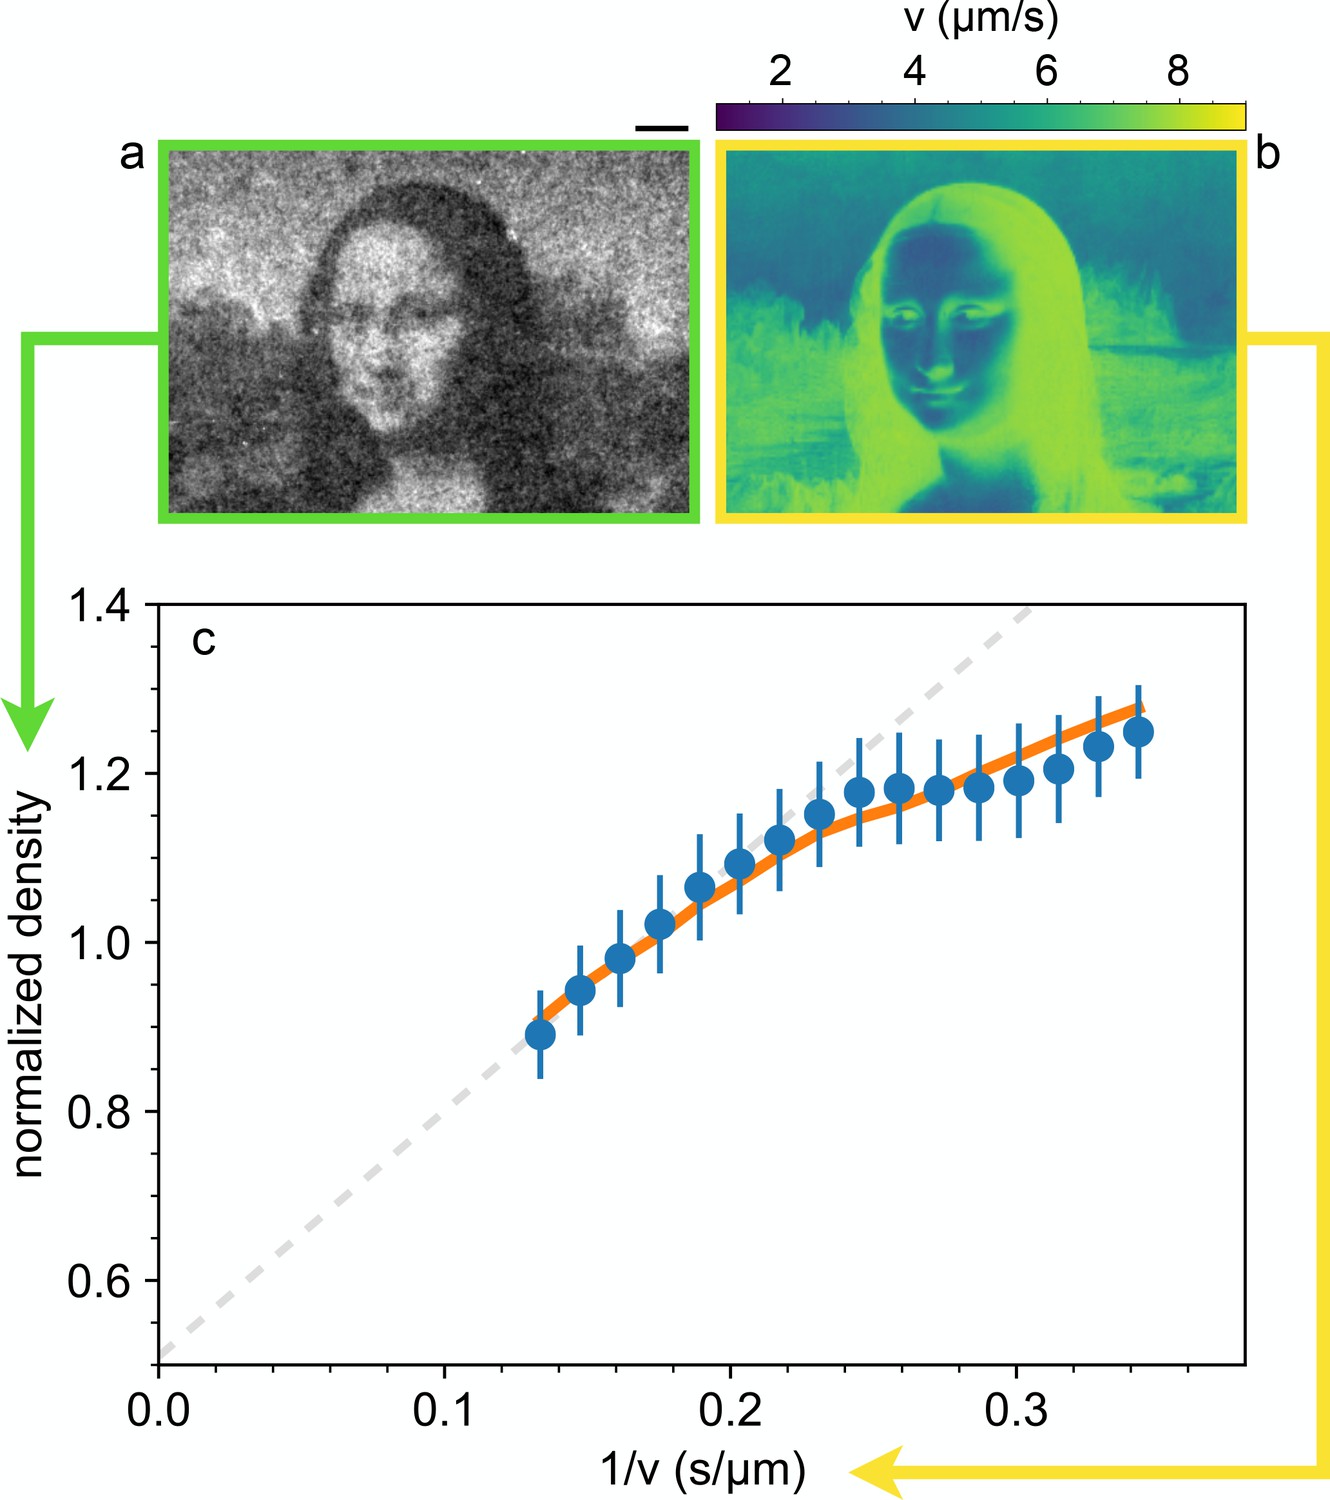
Shaping density with light.
(a) Dark-field microscopy image of the sample obtained after projecting a static light pattern for 4 min (averaged for 2 min). Scale bar 100 µm. (b) Local speed map obtained by interpolating the data-points of Figure 2(a) at the values of the local (projected) light intensity pattern. (c) The circles represent the mean value of the normalized sample density over image pixels corresponding to the same light intensity, plotted as a function of the corresponding inverse local speed. The dashed line is a linear fit of the high-speed points. The error bars are the standard deviation of the density at the same value of the computed inverse average speed. Solid line represent the prediction from the memory blur model described in the text.
-
Figure 3—source data 1
Source data for Figure 3
- https://doi.org/10.7554/eLife.36608.007
Figure 4
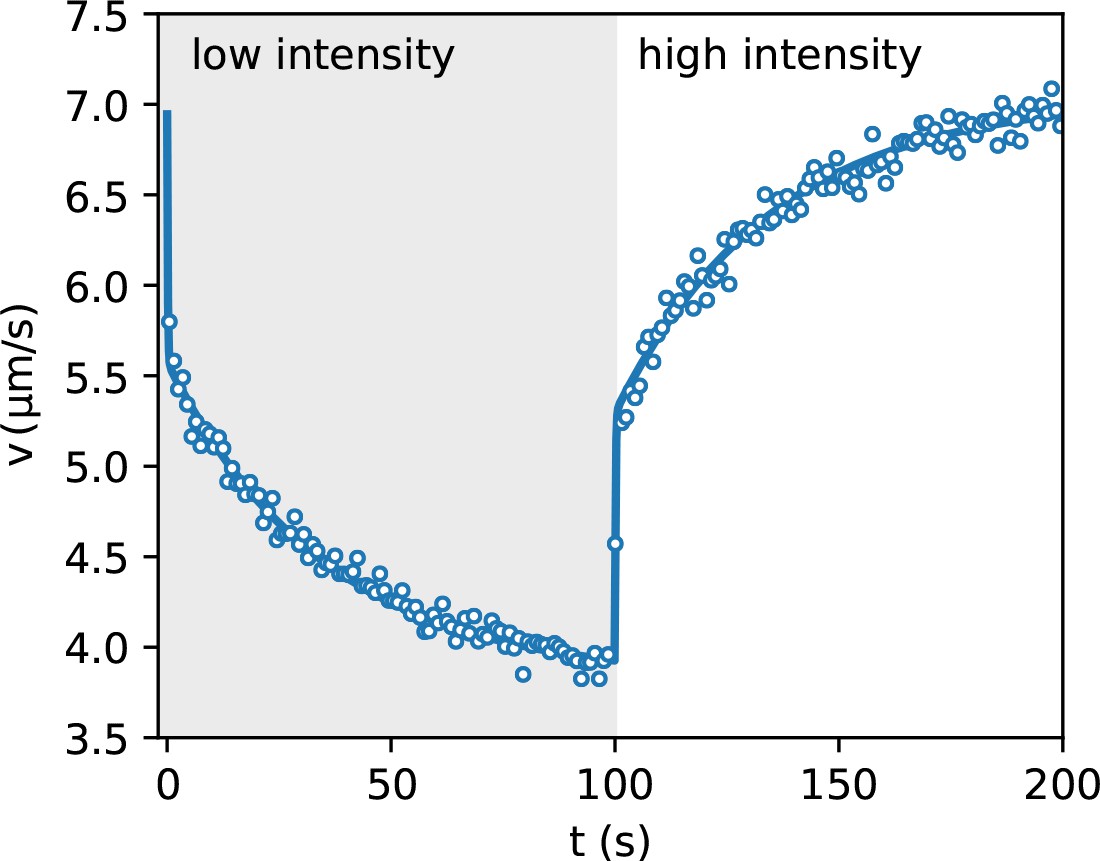
Speed response to light step.
Average bacteria speeds as a function of time during periodic illumination with a square wave of period 200 s. Open circles represent experimental data averaged over eight periods while solid line is a fit with a step response followed by an exponential relaxation.
-
Figure 4—source data 1
Source data for Figure 4
- https://doi.org/10.7554/eLife.36608.009
Figure 5

Improved density control with a feedback loop.
(a) Time evolution of the distance from the target normalized to the initial value (circles) before and after activating the feedback loop (gray area). The yellow and green bars indicate the time interval over which we average the density maps (shown in (b)) before and after feedback respectively. The full curve is a fit with a double exponential. (b) Comparison of the density map obtained by averaging for 2 min before (top) and after the feedback loop has been turned on (bottom) (see colored bars in (a)). (c) Time averaged density profile (6 min) with feedback on. (d) Projected light intensity patterns at (left) and after feedback optimization (right). Scale bars are 100 µm.
-
Figure 5—source data 1
Source data for Figure 5
- https://doi.org/10.7554/eLife.36608.011
Figure 6
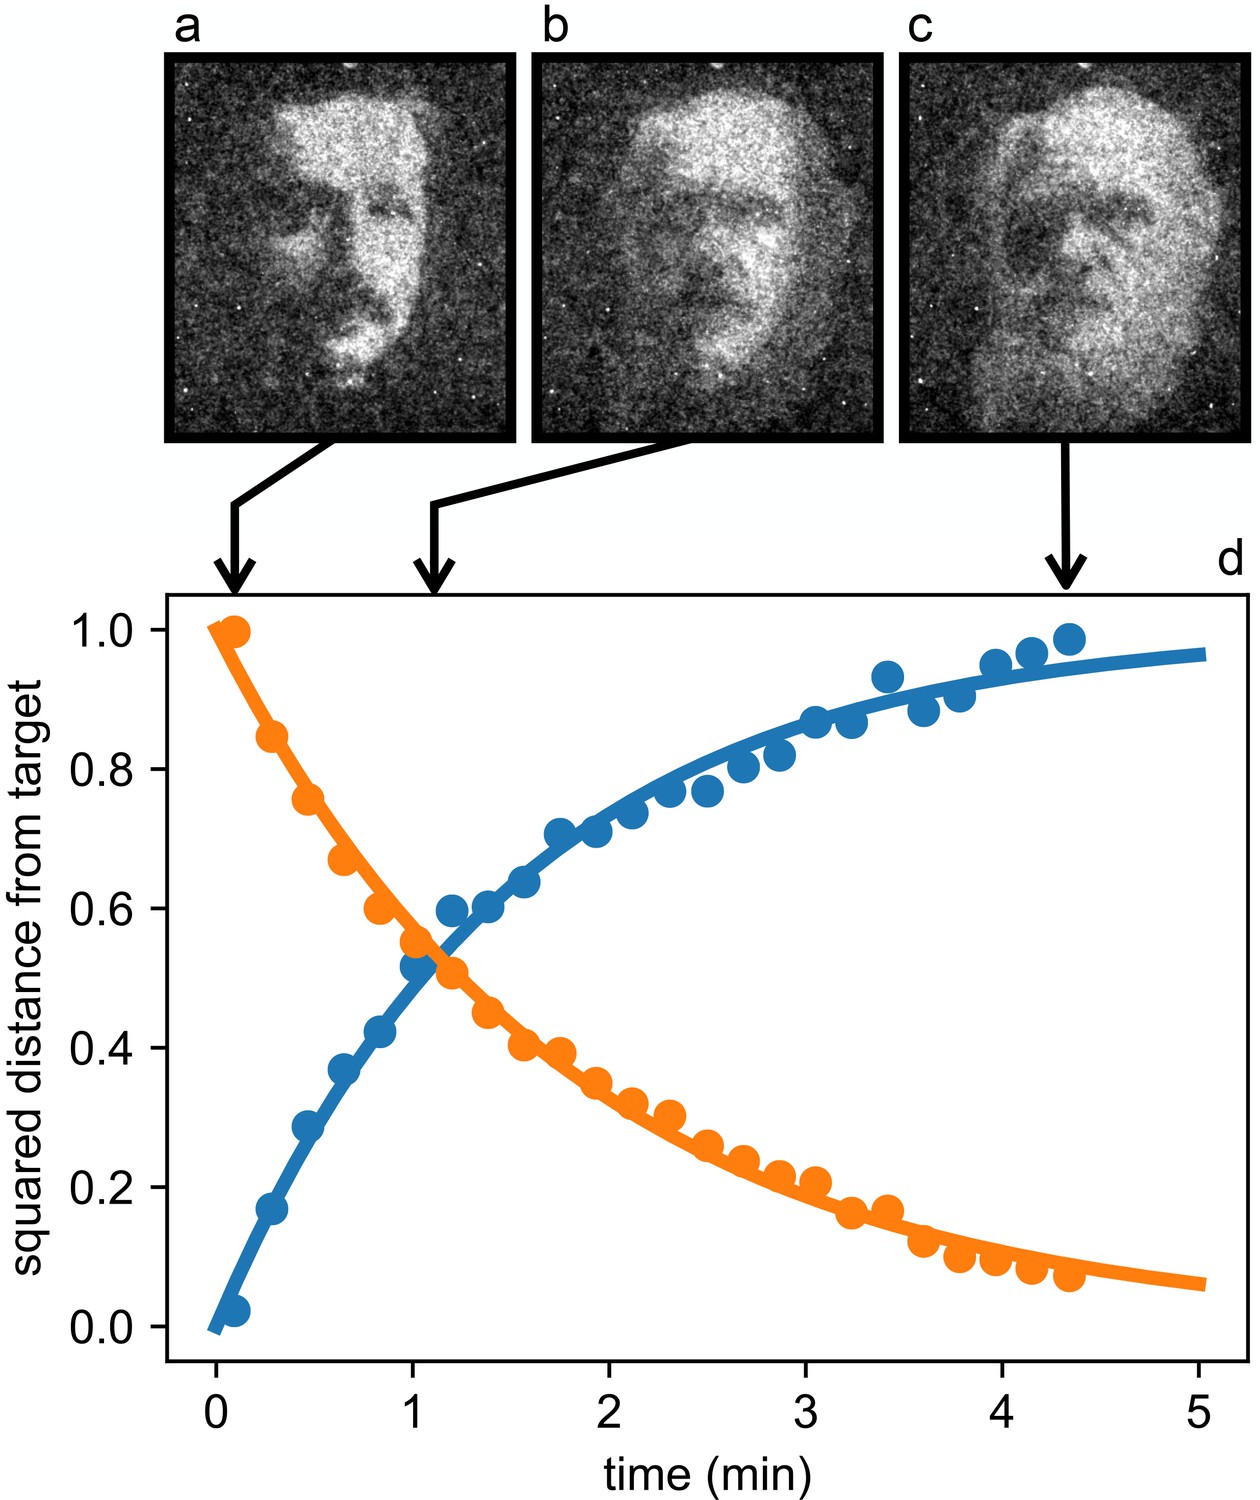
Reconfigurable density patterns.
Starting from the stationary density modulation (a) we switch to a new light pattern at time 0 and record the density distribution of bacteria as it morphs through the intermediate state (b) and reaches the final state (c). (d) Time evolution of the normalized squared distances between instantaneous density maps and the initial (blue circles) and final (orange circles) targets. Curves are exponential fits.
-
Figure 6—source data 1
Source data for Figure 6
- https://doi.org/10.7554/eLife.36608.013
Videos
Video 1
The video shows the dynamic morphing of a layer of photokinetic bacteria from an Albert Einstein's to a Charles Darwin's portrait (total time 5 min).
https://doi.org/10.7554/eLife.36608.014Additional files
-
Transparent reporting form
- https://doi.org/10.7554/eLife.36608.015
Download links
A two-part list of links to download the article, or parts of the article, in various formats.
Downloads (link to download the article as PDF)
Open citations (links to open the citations from this article in various online reference manager services)
Cite this article (links to download the citations from this article in formats compatible with various reference manager tools)
Dynamic density shaping of photokinetic E. coli
eLife 7:e36608.
https://doi.org/10.7554/eLife.36608


