Identification of a transporter complex responsible for the cytosolic entry of nitrogen-containing bisphosphonates
- Harvard University, United States
- Howard Hughes Medical Institute, United States
- University of California, San Francisco, United States
- Whitehead Institute for Biomedical Research, United States
- Massachusetts Institute of Technology, United States
- Koch Institute for Integrative Cancer Research, United States
- Broad Institute of MIT and Harvard, United States
- Institute for Public Health, Washington University School of Medicine, United States
Figures
Figure 1 with 1 supplement
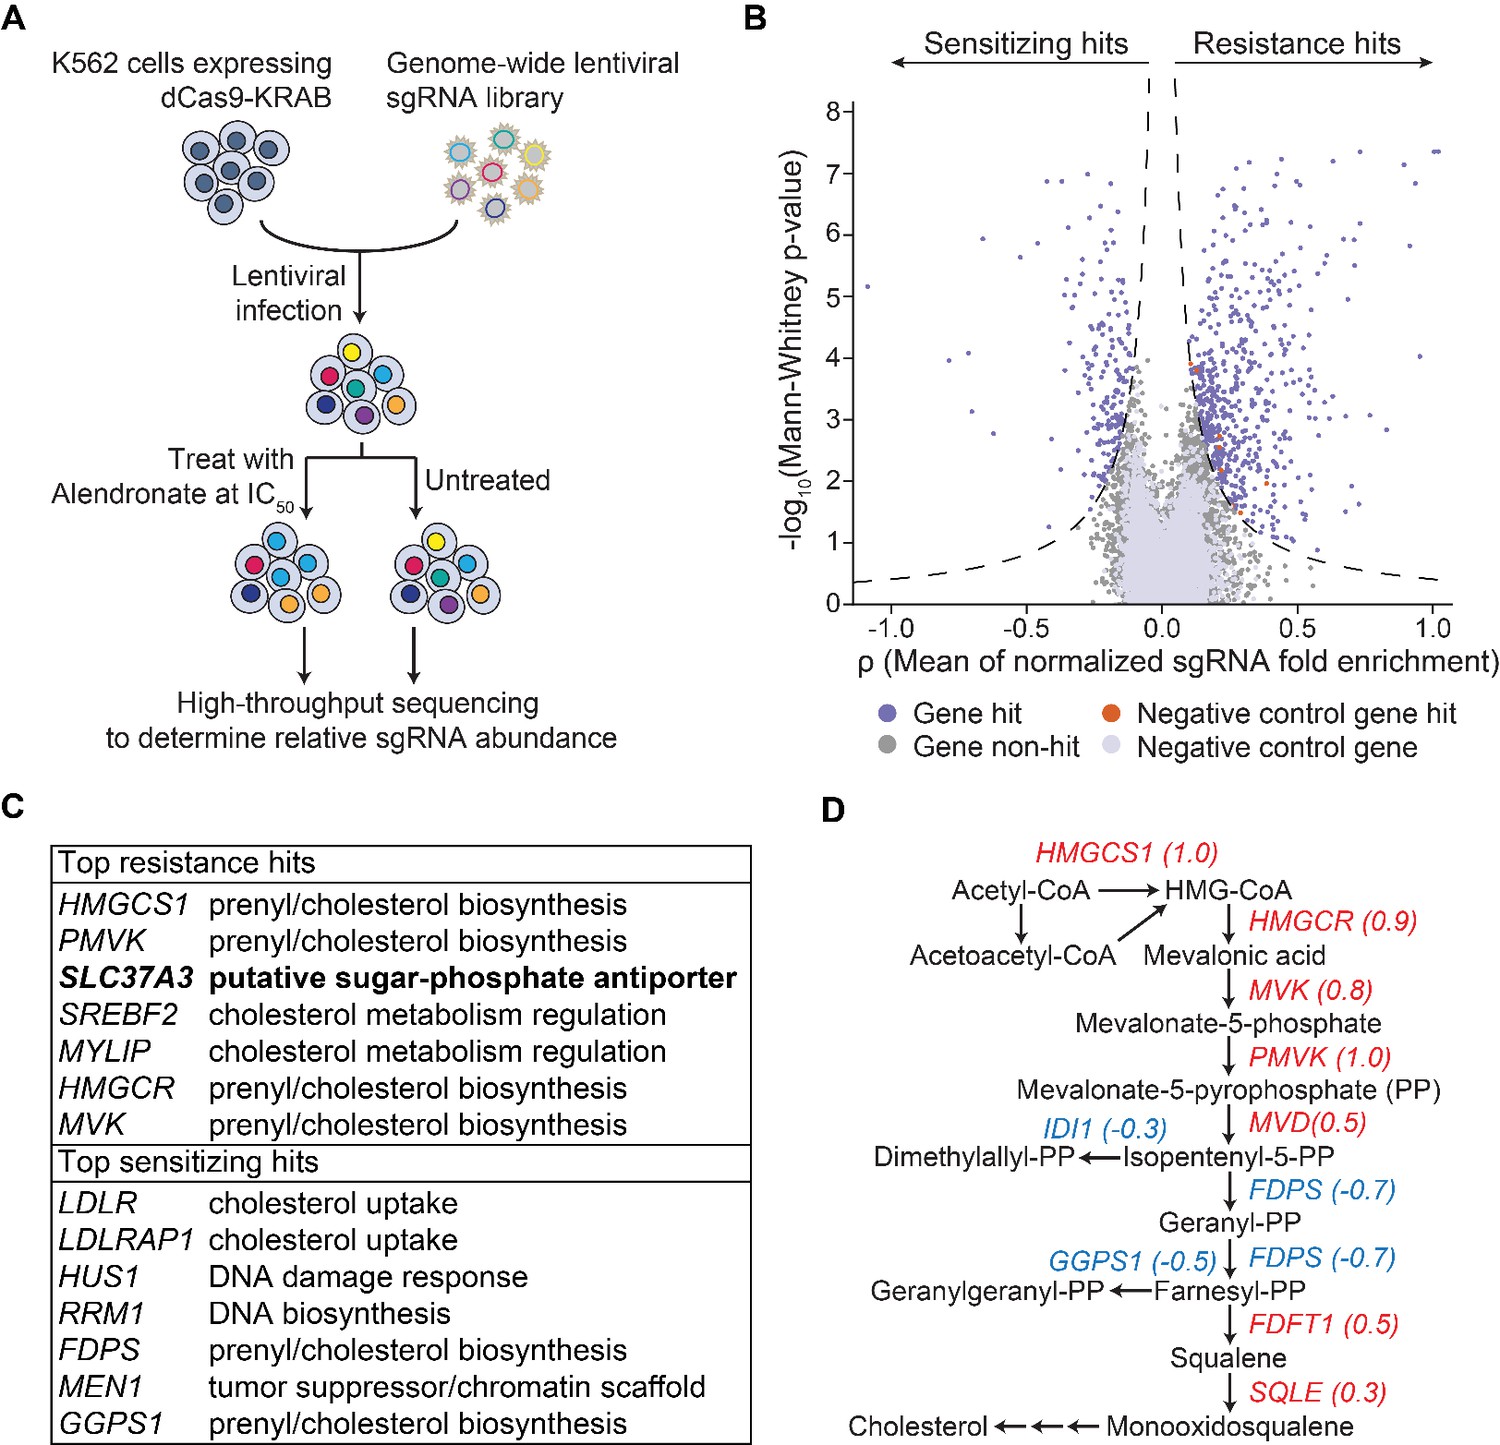
An unbiased CRISPRi screen identifies genetic targets of alendronate.
(A) Schematic illustrating the workflow of the genome-wide CRISPRi screen. The IC50 of alendronate in K562 cells is 250 μM. (B) Volcano plot showing, for each gene, a ρ score that averages the normalized fold enrichment (in the treated population compared to the untreated control) of the gene’s three most effective sgRNAs, and a Mann-Whitney P-value for fold enrichment (Gilbert et al., 2014). The dashed lines represent thresholds used to identify significant hits. Positive ρ scores correspond to resistance hits and negative scores to sensitizing hits. (C) Gene names and annotated functions of the top seven resistance and sensitizing hits. Genes are sorted by the absolute values of their ρ scores in descending order. SLC37A3 is marked in bold. (D) Diagram of the mevalonate pathway, with genes in the pathway that were identified as significant hits marked with their ρ scores. Resistance hits are color-coded in red and sensitizing hits in blue.
Figure 1—figure supplement 1
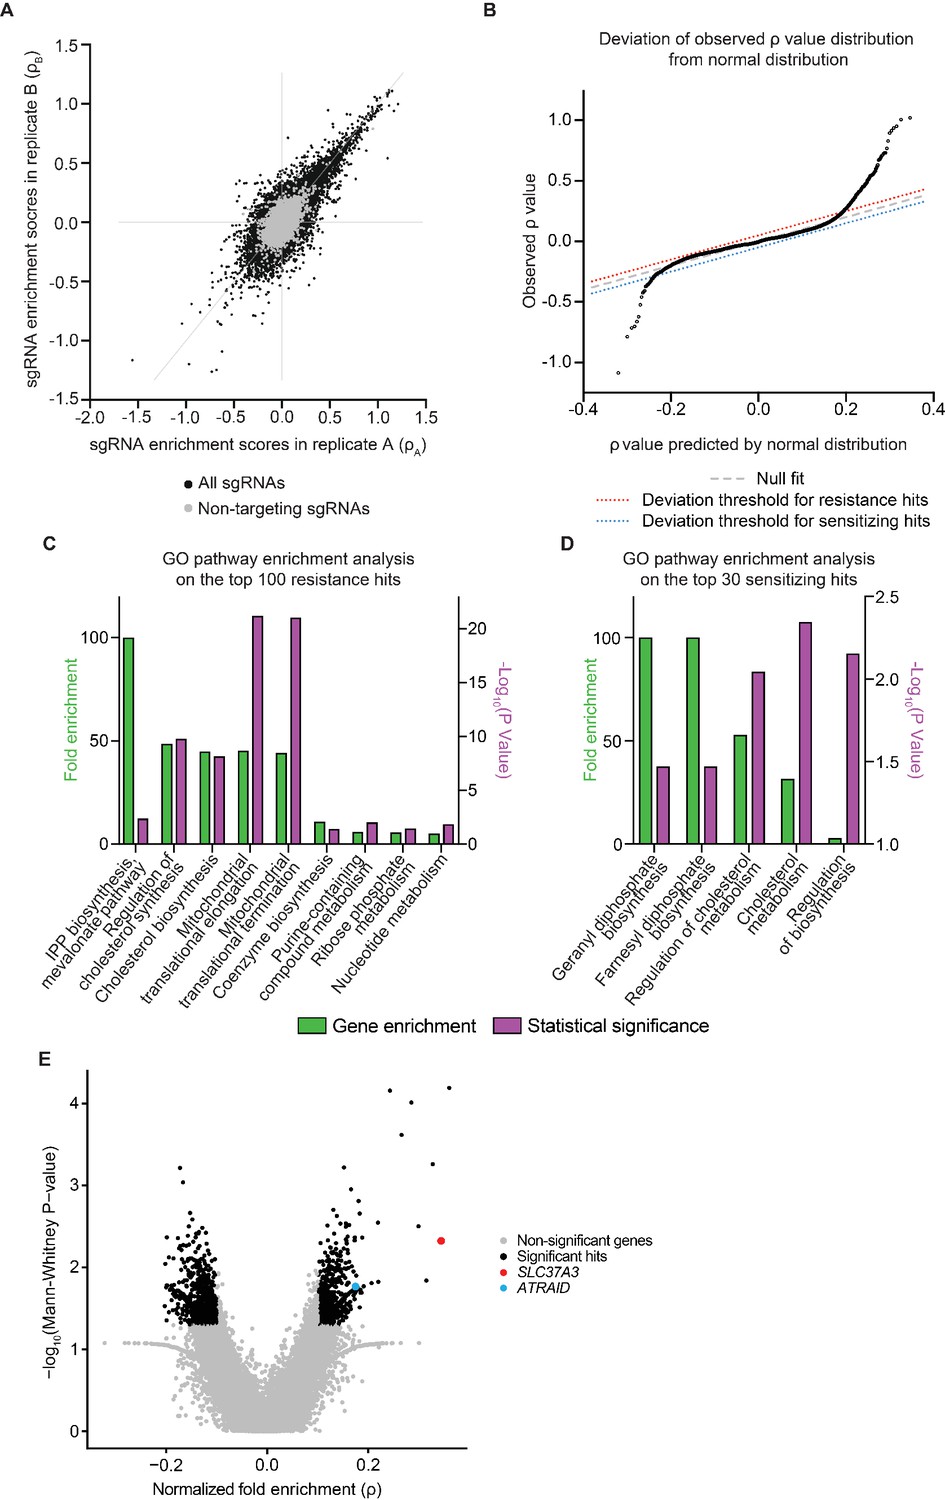
Additional analysis of the whole-genome CRISPRi screen.
(A) Evaluation of the reproducibility of the CRISPRi screen. The enrichment score (ρ) of each sgRNA was calculated separately from two biological replicates of the CRISPRi screen and compared in a scatter plot. Data points corresponding to negative control sgRNAs are colored in gray. (B) Quantile-quantile plot comparing the distribution of observed average sgRNA enrichment scores (ρ scores) of each gene in the genome with a Gaussian distribution that has the same mean and standard deviation. The dashed gray line represents the predicted location of data points if the distribution of ρ scores is indeed Gaussian. The large deviations from the gray line observed at the two ends of the distribution indicate that the silencing of those genes has stronger effects than expected by pure Gaussian noise and is therefore likely to be biologically meaningful. The dotted lines are arbitrary thresholds set to select resistance hits (red dotted line) and sensitizing hits (blue dotted line) that deviate significantly from Gaussian predictions. 398 resistance hits and 28 sensitizing hits passed the thresholds. (C–D) Gene Ontology (GO) pathway enrichment analysis of the top 100 resistance hits (C) and the top 30 sensitizing hits (D) identified in the CRISPRi screen. Only the most specific subclasses that are statistically significant are shown. Both fold enrichment of pathway genes and P-values of fold enrichment are displayed. Fold enrichment values were clipped at 100 fold. P-values were corrected for multiple testing using Bonferroni correction. Note that genes involved in the mevalonate pathway, which includes IPP biosynthesis, geranyl phosphate synthesis and farnesyl phosphate synthesis, are significantly enriched in top hits from the screen. IPP: isopentenyl pyrophosphate. (E) Volcano plot showing the results from a second CRISPRi screen using zoledronate, another representative N-BP, as the selection agent. Plot layout is the same as in Figure 1B. SLC37A3 and ATRAID are highlighted in red and cyan, respectively. Significant hits were defined as genes that had a fold enrichment with an absolute value larger than 0.1, and a P-value smaller than 0.05.
Figure 2 with 2 supplements

SLC37A3 and ATRAID are functionally related genes required for the mechanism of action of N-BPs.
(A–D) Dose response curves of wild-type, ATRAIDKO and SLC37A3KO K562 cells (A) and HEK 293 T cells (B), and wild-type and SLC37A3KO RAW cells (both undifferentiated macrophages, (C), and differentiated osteoclasts, (D) to alendronate. Cells were treated with a series of doses of alendronate (x-axis) for 48 hr. Relative cell viability was determined by measuring post-treatment total cellular ATP levels and normalizing to those in untreated cells (y-axis). Data depict mean with s.d. for biological triplicate measurements. (E) Immunoblots measuring alendronate-induced reduction in protein prenylation in wild-type and knockout K562 and HEK 293 T cells. Cells were treated with indicated doses of alendronate for 24 hr before analysis by immunoblotting. (F) Immunoblots comparing alendronate-induced reduction in protein prenylation in single and double-knockout HEK 293 T cells. Experimental procedure is as in (C). Note that higher alendronate doses were used in (F) compared to (E) to induce detectable levels of unprenylated proteins. ALN: alendronate.
Figure 2—figure supplement 1
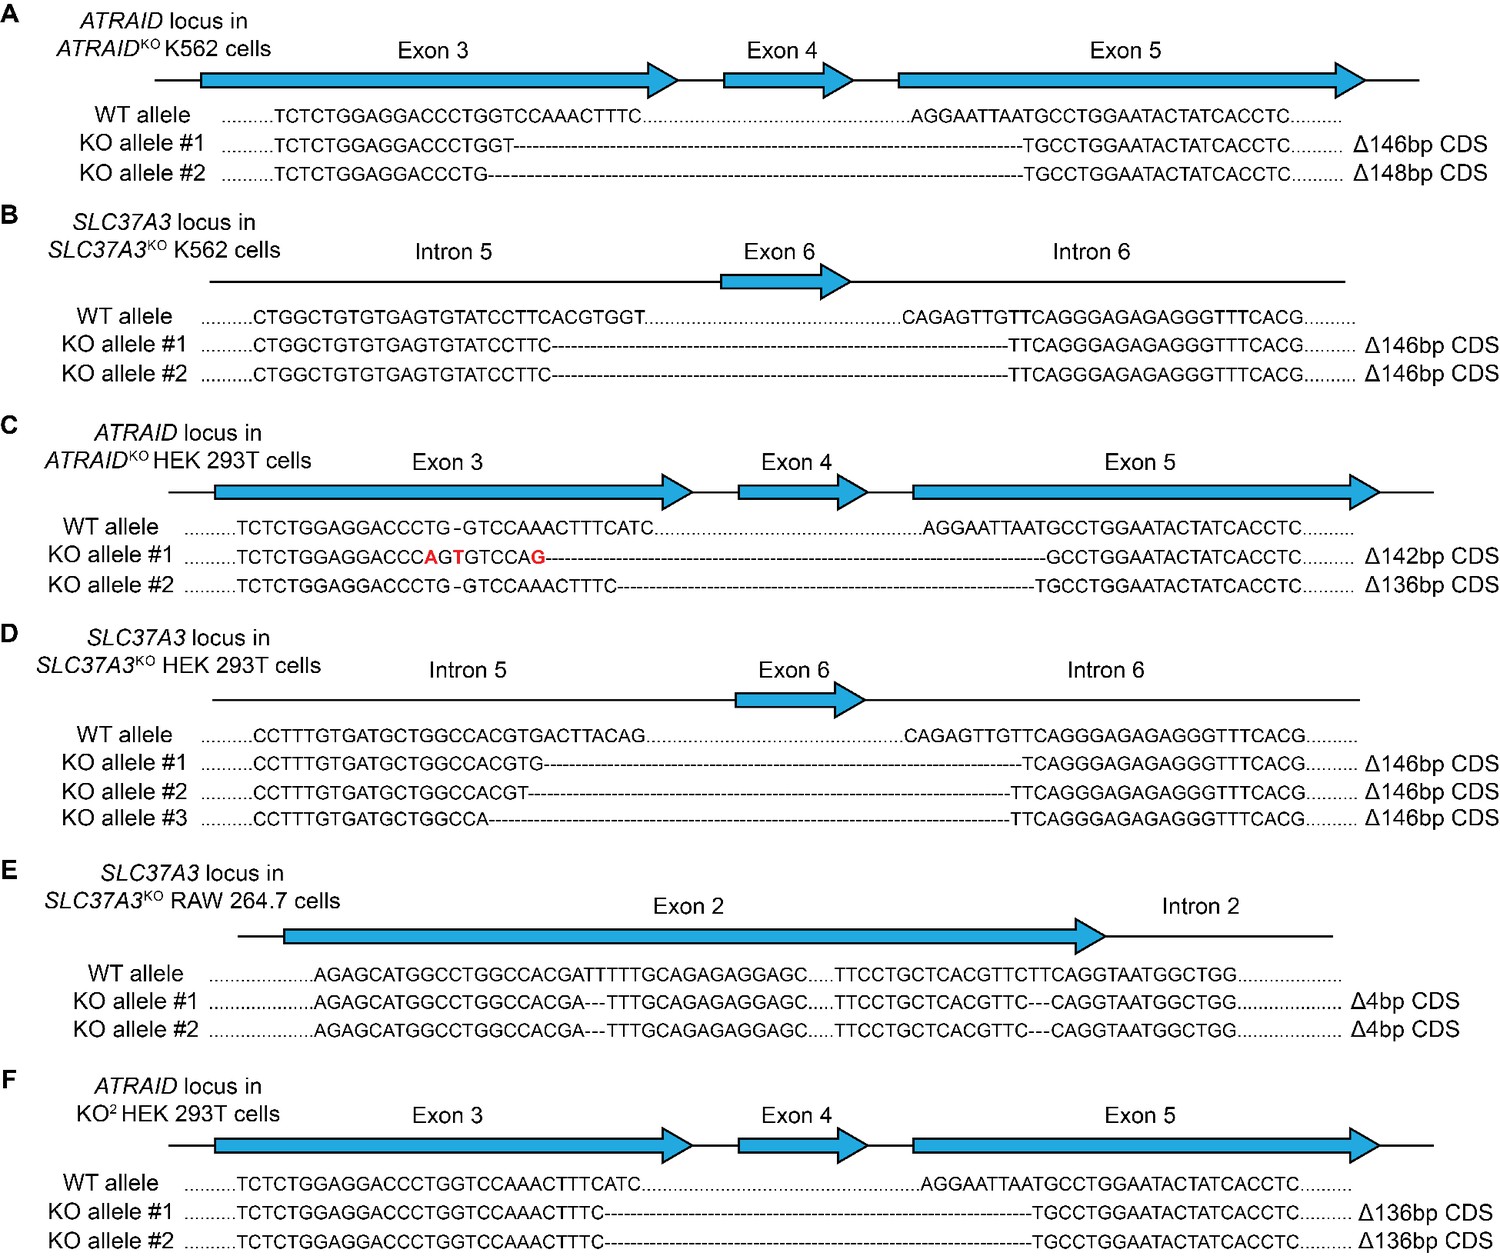
Genotypes of knockout cells used in this study.
(A–F) Sequences of the ATRAID (A, C and F) or SLC37A3 locus (B, D and E) in ATRAIDKO (A) and SLC37A3KO (B) K562 cells, ATRAIDKO (C), SLC37A3KO (D) and KO2 (F) HEK 293 T cells, and SLC37A3KO (E) RAW 264.7 cells, showing that truncations in ATRAID and SLC37A3 coding sequences (CDS) have caused frame shifts in the knockout cell lines. The SLC37A3 locus in KO2 HEK 293 T cells is identical to that in SLC37A3KO HEK 293 T cells. Introns and exons are not drawn to scale. Note that more than two alleles are present for the SLC37A3 locus in HEK 293 T cells as these cells are hypo-triploidic. KO2: ATRAIDKO; SLC37A3KO.
Figure 2—figure supplement 2
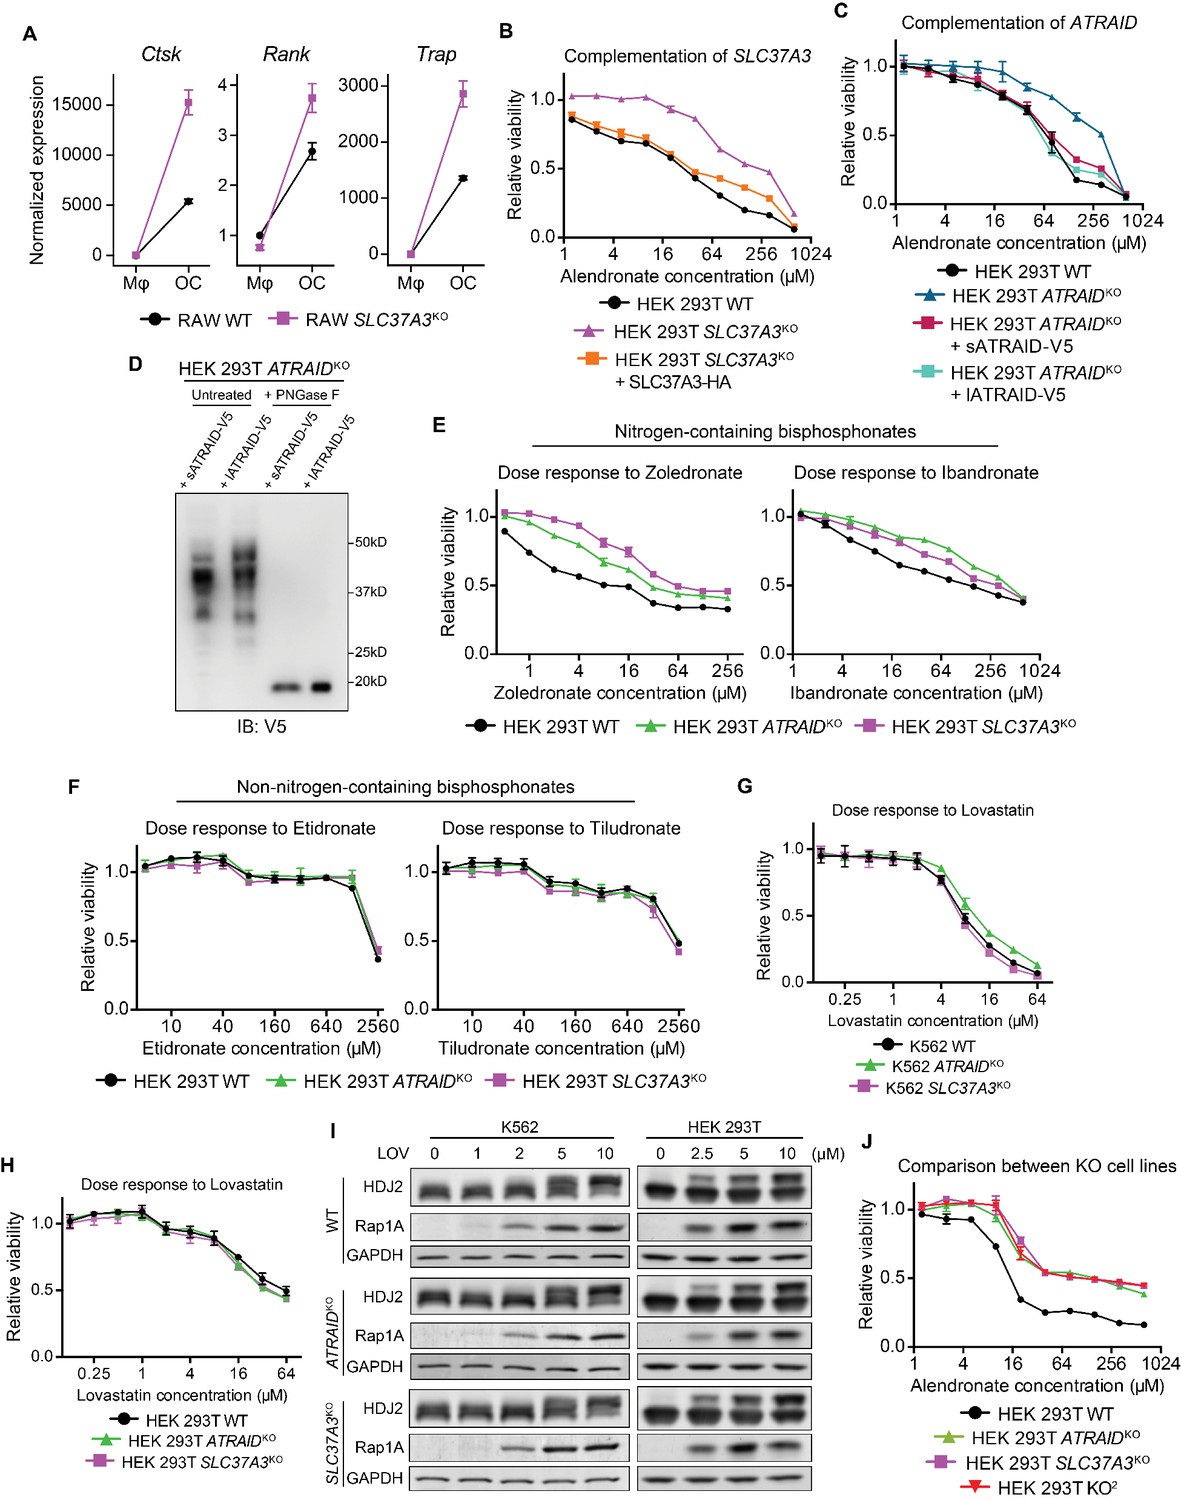
Additional evidence that validates SLC37A3 and ATRAID as functionally related genes required for the mechanism of action of N-BPs.
(A) Expression of osteoclast markers (Ctsk, Rank and Trap) in undifferentiated RAW macrophages (Mφ) and differentiated RAW osteoclasts (OC), demonstrating successful differentiation of RAW cells. (B–C) Dose responses to alendronate in SLC37A3KO or ATRAIDKO HEK 293 T cells complemented with epitope tagged SLC37A3 or ATRAID, respectively, compared with those in wild-type, ATRAIDKO and SLC37A3KO cells. (D) Immunoblot comparing the short isoform of ATRAID (sATRAID) with the long isoform of ATRAID (lATRAID), showing that the long isoform of ATRAID is expressed as the same protein as the short isoform of ATRAID. Note that unequal amount of protein was loaded in each lane to obtain even exposure. The amount of protein loaded from left to right was: 100 µg, 40 µg, 10 µg and 4 µg, respectively. (E–F) Dose response curves of wild-type, ATRAIDKO and SLC37A3KO HEK 293 T cells to nitrogen-containing bisphosphonates (E) and non-nitrogen-containing bisphosphonates (F). (G–H) Dose response curves of wild-type, ATRAIDKO and SLC37A3KO K562 cells (G) and HEK 293 T cells (H) to lovastatin. (I) Immunoblots measuring lovastatin-induced reduction in protein prenylation in wild-type, ATRAIDKO and SLC37A3KO K562 cells and HEK 293 T cells. (J) Dose response to alendronate in KO2 HEK 293 T cells, compared with those in wild-type, ATRAIDKO and SLC37A3KO cells. For (B–C), (E–H) and (J), data depict mean with s.d. for biological triplicate measurements. LOV: lovastatin. KO2: ATRAIDKO; SLC37A3KO. PNGase F: peptide: N-glycosidase F, an enzyme that removes asparagine (N)-linked sugar modifications on glycoproteins.
Figure 3 with 2 supplements
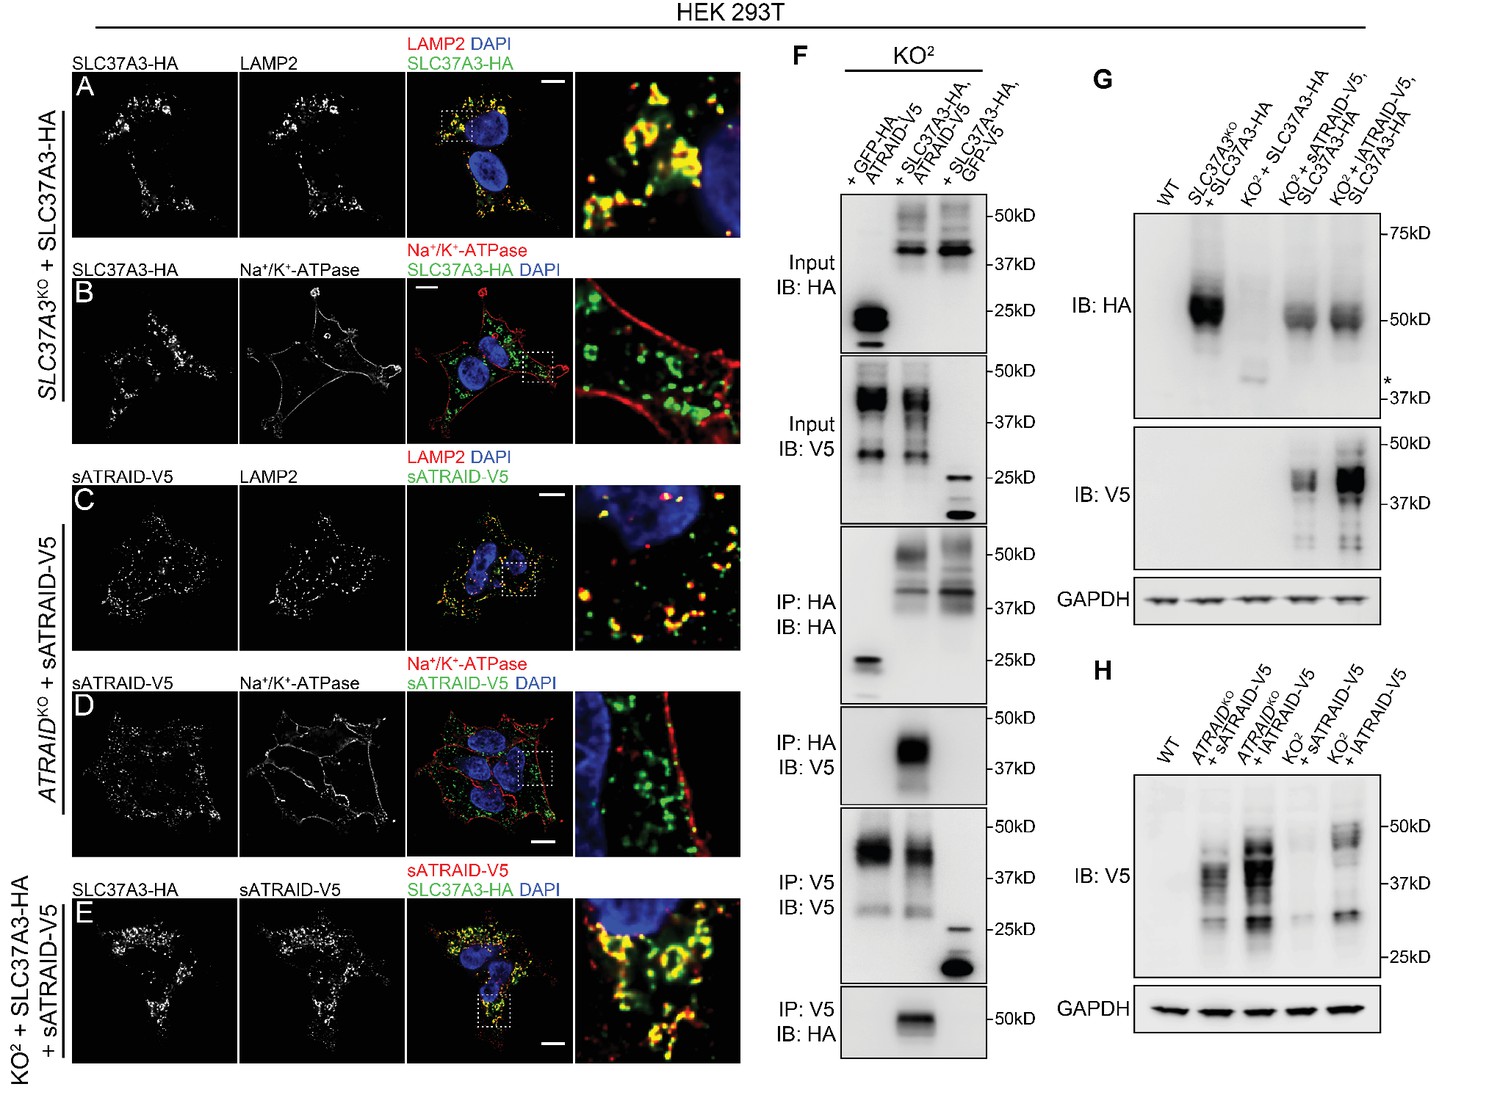
SLC37A3 and ATRAID form a lysosomal complex and are inter-dependent for their stable expression.
(A–D) Localization of HA-tagged SLC37A3 (SLC37A3-HA) (A–B) and V5-tagged short isoform of ATRAID (sATRAID-V5) (C–D) shown with markers for lysosomes (LAMP2, (A and C) and the plasma membrane (Na+/K+-ATPase, (B and D). (E) Co-localization of SLC37A3-HA and sATRAID-V5. Nuclei were stained with DAPI in blue. Scale bars represent 10 µm. Each image displayed is the representative example chosen from at least five similar images. (F) Reciprocal co-IP of SLC37A3A3-HA and sATRAID-V5 in KO2 HEK 293 T cells stably overexpressing both proteins. In each negative control cell line, one of the two tagged proteins was replaced with GFP tagged with the same epitope. (G) Immunoblots measuring SLC37A3-HA protein levels in various cells, showing that deletion of ATRAID significantly reduces the protein level of SLC37A3-HA. The un-glycosylated population of SLC37A3 that appears in the absence of ATRAID is marked with an asterisk. (H) Immunoblots measuring ATRAID-V5 protein levels in various cells, demonstrating that deletion of SLC37A3 significantly reduces the protein level of ATRAID-V5. IP, immunoprecipitation. IB, immunoblot. KO2: ATRAIDKO; SLC37A3KO.
Figure 3—figure supplement 1

Additional evidence supporting that SLC37A3 and ATRAID form a lysosomal complex.
(A) mRNA levels of ATRAID and SLC37A3 in various HEK 293 T cells used in this study. Data depict mean and s.d. for technical triplicate measurements. (B) Dose responses to alendronate in KO2 HEK 293 T cells complemented with either only SLC37A3-HA or both ATRAID-V5 and SLC37A3-HA, compared with those in wild-type and KO2 HEK 293 T cells. Data depict mean and s.d. for biological triplicate measurements. (C–H) Localization of SLC37A3-HA (C), sATRAID-V5 (D) or lATRAID-V5 (F–H) shown with LAMP2 (F), EEA1 (C, D and H) and Na+/K+-ATPase (G), and co-localization of SLC37A3-HA and lATRAID-V5 (E). Scale bars represent 10 µm. Each image displayed is the representative example chosen from at least five similar images. Note that in E), there exists a subpopulation of lATRAID-V5 that localizes to the plasma membrane but not with SLC37A3-HA. Such distribution is likely a result of a higher-than-endogenous expression level of lATRAID-V5 in KO2 +SLC37A3-HA + lATRAID-V5 HEK 293 T cells (A), as such distribution is not observed in ATRAIDKO +lATRAID-V5 HEK 293 T cells (G), which express lATRAID-V5 at a lower-than-endogenous level (A). KO2: ATRAIDKO; SLC37A3KO. sATRAID: short isoform of ATRAID. lATRAID: long isoform of ATRAID.
Figure 3—figure supplement 2
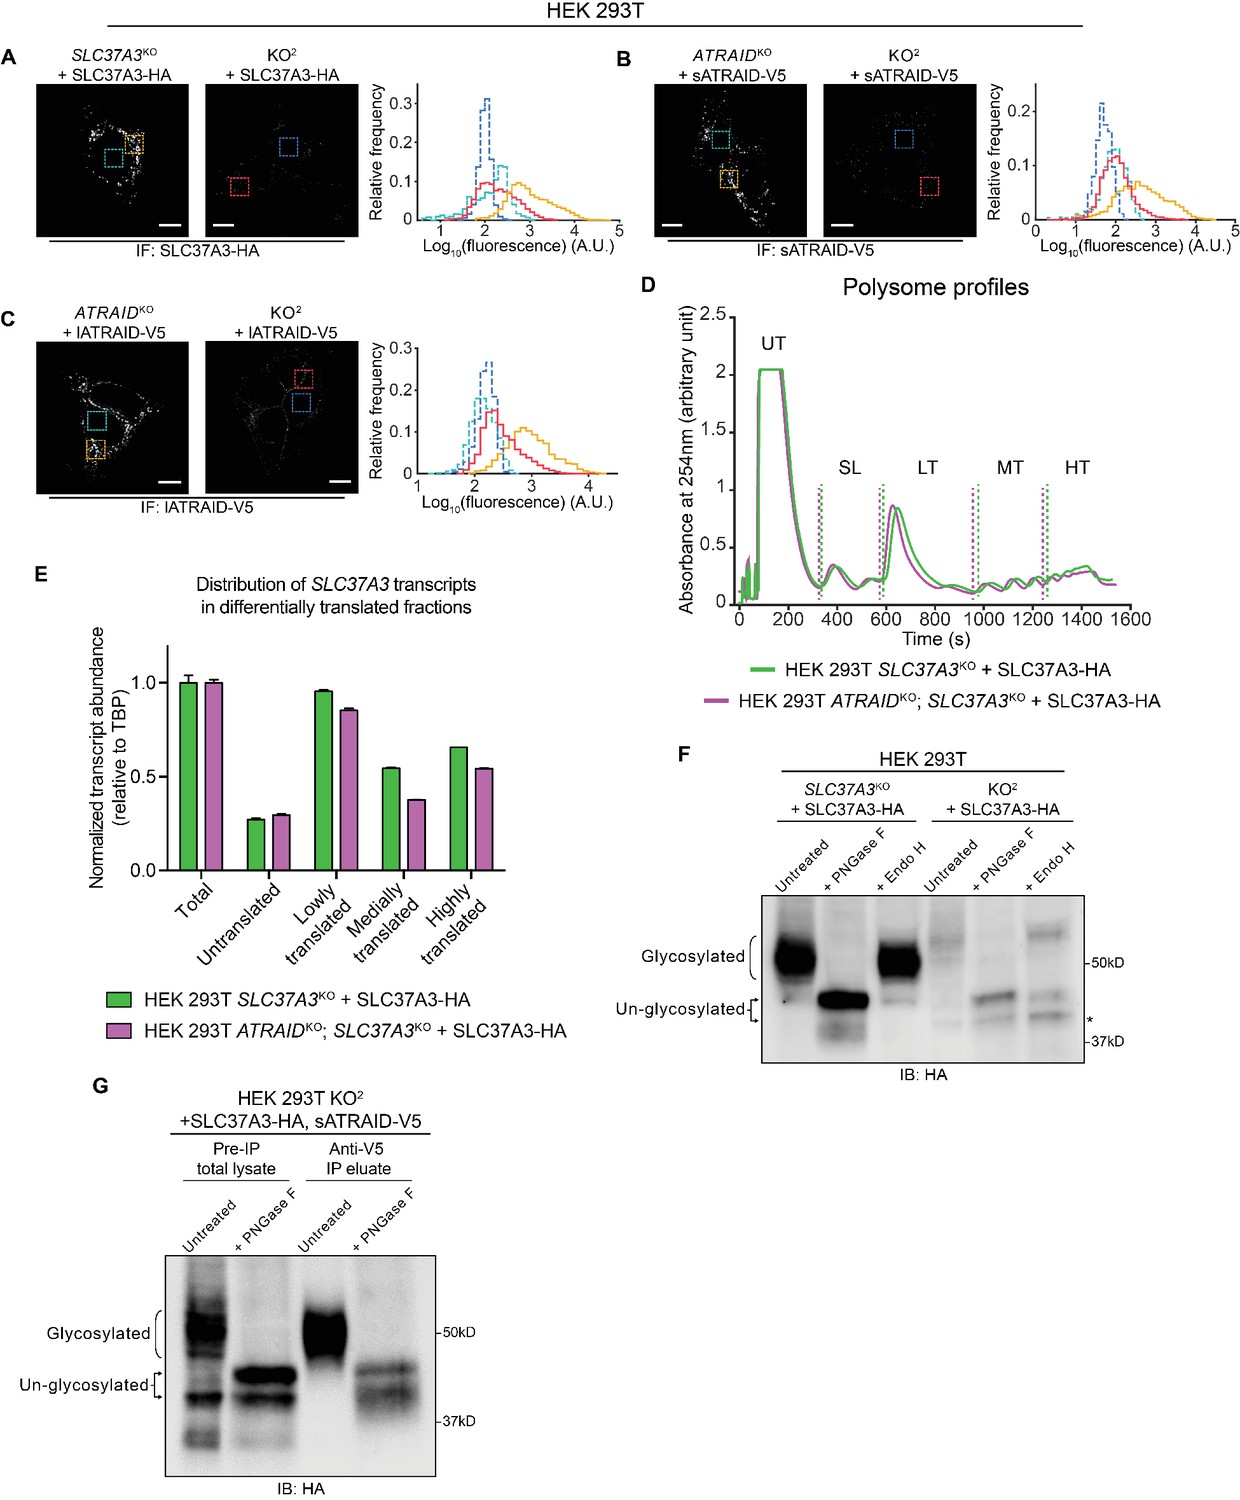
Additional evidence supporting that SLC37A3 and ATRAID depend on each other for stable expression.
(A–C) Analysis of IF images comparing the expression levels of SLC37A3-HA (A) or both isoforms of ATRAID-V5 (B and C) in their respective single knockout backgrounds and the KO2 background. The two images in each sub-figure were acquired with the same setting and adjusted to the same contrast. In each image a background area (turquoise or blue, inside nuclei, where no stain should be present) and a signal area (orange or red) were selected and the distribution of pixel values within each area was plotted in a histogram. The outlines in the histogram are color-coded to match the boarders of selected areas. (D–E) Polysome profiling experiment assessing the translation efficiency of SLC37A3 transcripts in SLC37A3KO and KO2 backgrounds. Lysates from indicated cell lines were analyzed on a gradient station and fractionated into five fractions: untranslated transcripts (UT), small and large ribosome subunits (SL), lowly translated transcripts (LT), medially translated transcripts (MT) and highly translated transcripts (HT). The level of SLC37A3 transcripts relative to the level of TBP (TATA-binding protein) transcripts in each fraction was measured and plotted. The SL fraction was excluded from the analysis. A total RNA fraction was included as a reference. No overall shift was observed in the distribution of SLC37A3 transcripts in the KO2 background compared to that in the SLC37A3KO background, suggesting that the translation efficiency of SLC37A3 is not affected by the absence of ATRAID. (F) Immunoblot comparing the glycosylation patterns of SLC37A3 in SLC37A3KO and KO2 backgrounds. Lysates from SLC37A3KO + SLC37A3-HA (lane 1–3) and KO2 + SLC37A3-HA (lane 4–6) HEK 293 T cells were left untreated (lane 1 and 4), treated with PNGase-F (lane 2 and 5), or with Endo H (lane 3 and 6). The band corresponding to an un-glycosylated population of SLC37A3 that is present in the absence of ATRAID but not in the presence of ATRAID is marked with an asterisk. (G) Immunoblot comparing the glycosylation patterns of total cellular SLC37A3 and the sub-population of SLC37A3 that interacts with ATRAID. In KO2 HEK 293 T cells over-expressing SLC37A3-HA and sATRAID-V5, proteins that interact with sATRAID-V5 were purified with immuno-precipitation against V5 epitope and compared with total proteins in the lysate. The pre-IP total lysate (lane 1–2) and anti-V5 IP eluate (lane 3–4) were either left untreated (lane 1 and 3) or treated with PNGase F (lane 2 and 4) and analyzed by blotting against SLC37A3-HA. IF: immunofluorescence. IB: immunoblot. KO2: ATRAIDKO; SLC37A3KO. PNGase F: peptide: N-glycosidase F, an enzyme that removes all asparagine (N)-linked sugar modifications from glycoproteins. Endo H: endoglycosidase H, an enzyme that only removes high mannose sugar moieties on ER glycoproteins that have not been processed by the Golgi apparatus.
Figure 4 with 1 supplement
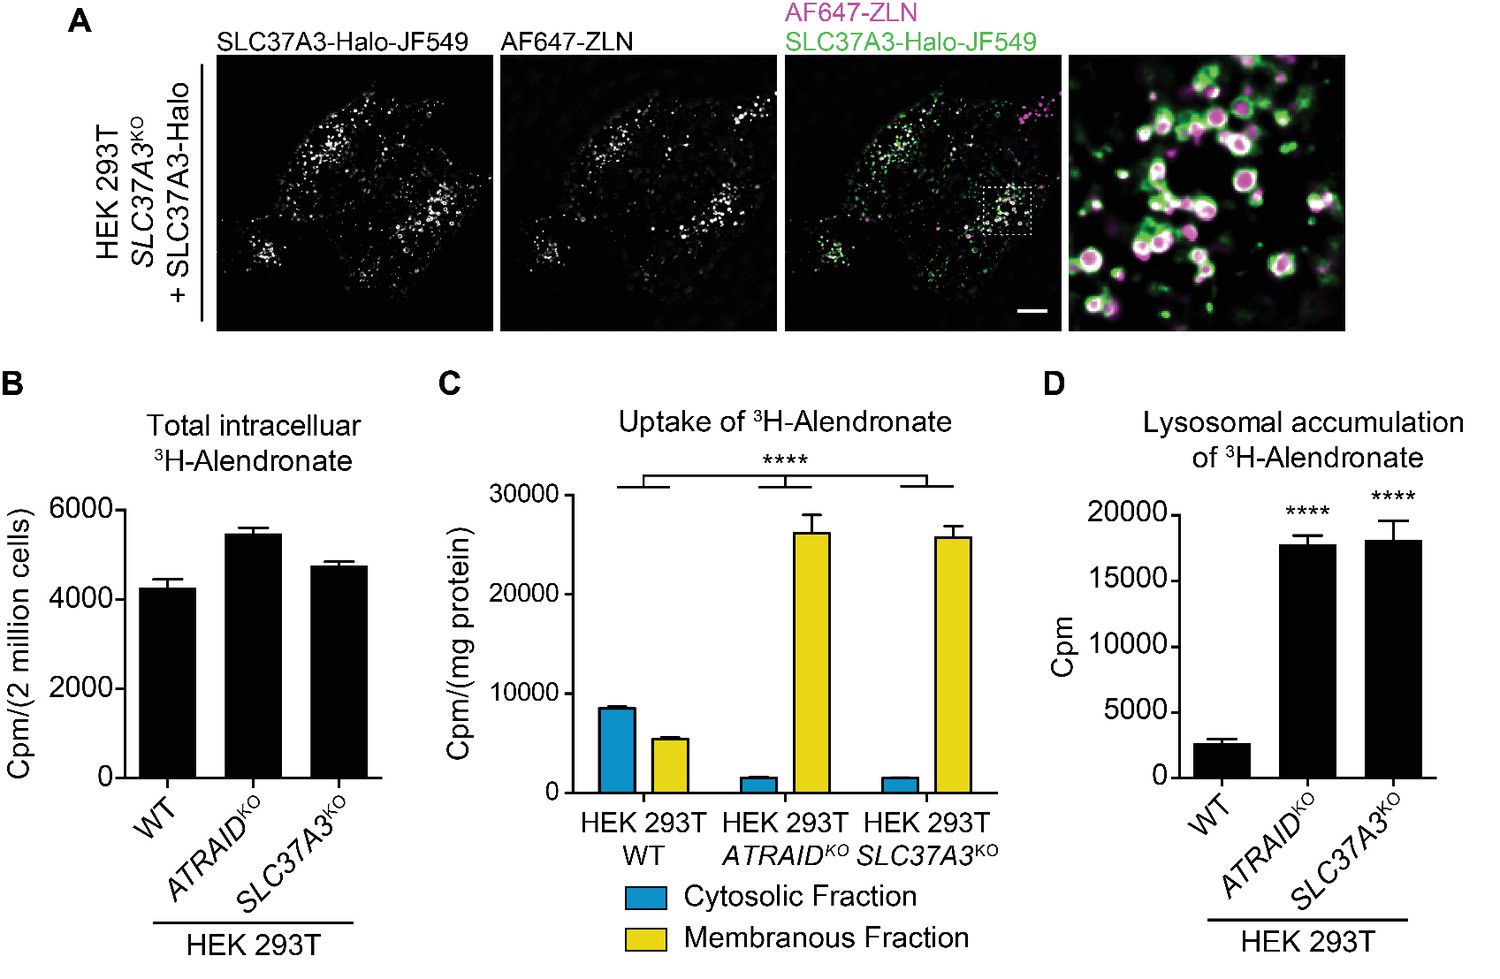
SLC37A3 and ATRAID transport N-BPs from the lumen of lysosomes into the cytosol.
(A) Live imaging of HEK 293 T cells that express Halo tagged SLC37A3 (SLC37A3-Halo) and have internalized AlexaFlour 647 labeled zoledronate (AF647-ZLN). SLC37A3-Halo is labeled with Janelia flour 549 (JF549). SLC37A3-Halo is expressed at a lower-than-endogenous level and has been verified to be functional (data not shown). The scale bar represents 10 µm. The image displayed is a representative example chosen from five similar images. (B) Radioactive uptake assay measuring total intracellular radioactivity in indicated HEK 293 T cells treated with 3H-alendronate. Data depict mean and s.d. for biological triplicate measurements. (C) Radioactive uptake assay measuring levels of radioactivity in subcellular fractions in indicated HEK 293 T cells treated with 3H-alendronate. Data depict mean with s.d. for biological duplicate measurements. Significance was determined using unpaired two-way ANOVA test. Effect of genotype: F(2,6) = 74.93, p<0.0001; effect of subcellular location: F(1,6) = 864.9, p<0.0001; effect of interaction between genotype and subcellular location: F(2,6) = 312.4, p<0.0001. (D) Radioactive uptake assay measuring levels of radioactivity in lysosomes purified from indicated HEK 293 T cells treated with 3H-alendronate. Data depict mean and s.d. for biological triplicate measurements. Significance was determined using two-tailed unpaired t-test with equal s.d. Comparison between wild-type and ATRAIDKO cells: df = 4, t = 36.24, p<0.0001. Comparison between wild-type and SLC37A3KO cells: df = 4, t = 17.96, p<0.0001. HEK 293 T cells were treated with 1 μCi/mL 3H-alendronate for 24 hr in (B–C) and 3 hr in (D). ****: p<0.0001.
Figure 4—figure supplement 1

Quality controls for the radioactive uptake assays.
(A) Immunoblot against markers for cytosol (GAPDH), plasma membrane (Caveolin1), early endosome (EEA1), lysosome (LAMP1), nucleosol (RaN-BP3), and nucleoskeleton (LaminB1) in cytosolic fractions and membranous fractions in wild-type, ATRAIDKO and SLC37A3KO HEK 293 T cells, demonstrating successful subcellular fractionation in the fractionation-based radioactive uptake assay. Cyt: cytosolic fraction. Mem: membranous fraction. Tot: total cell lysate. (B–D) Localization of HA tagged TMEM192 (TMEM192-HA), a lysosomal protein we expressed in wild-type (B), ATRAIDKO (C) and SLC37A3KO (D) HEK 293 T cells and used as a handle to immuno-precipitate lysosomes, shown with a lysosomal marker, LAMP2, demonstrating correct localization of TMEM192-HA to lysosomes and, consequently, successful purification of lysosomes in the lysosome-purification-based uptake assay. Scale bars represent 10 µm. Each image displayed is the representative example chosen from at least five similar images.
Tables
Key resources table
| Reagent type (species) or resource | Designation | Source or reference | Identifiers | Additional information |
|---|---|---|---|---|
| Gene (Homo sapiens) | SLC37A3 | NA | NCBI: 84255 | |
| Gene (Mus musculus) | Slc37a3 | NA | NCBI: 72144 | |
| Gene (H. sapiens) | ATRAID | NA | NCBI: 51374 | |
| Cell line (H. sapiens) | K562 | ATCC | ATCC: CCL-243, RRID:CVCL_0004 | |
| Cell line (H. sapiens) | HEK 293T | ATCC | ATCC: CRL-3216, RRID:CVCL_0063 | |
| Cell line (M. musculus) | RAW 264.7 | ATCC | ATCC: TIB-71, RRID:CVCL_0493 | |
| Cell line (H. sapiens) | K562 SLC37A3 knock-out | this paper | SLC37A3 was deleted by removing exon 6 | |
| Cell line (H. sapiens) | HEK 293T SLC37A3 knock-out | this paper | SLC37A3 was deleted by removing exon 6 | |
| Cell line (H. sapiens) | K562 ATRAID knock-out | this paper | ATRAID was deleted by trucating exon 3, 4 and 5 | |
| Cell line (H. sapiens) | HEK 293T ATRAID knock-out | this paper | ATRAID was deleted by trucating exon 3, 4 and 5 | |
| Cell line (H. sapiens) | HEK 293T KO2 (double knock-out) | this paper | ATRAID was deleted in the SLC37A3 knockout background | |
| Cell line (M. musculus) | RAW Slc37a3 knock-out | this paper | Slc37a3 was deleted by introducing microdeletions in exon 2 | |
| Transfected construct (H. sapiens) | HEK 293T SLC37A3KO + SLC37A3-HA | this paper | An HA-tagged SLC37A3 CDS under PGK promoter was integrated in to the AAVS1 expression harbor inSLC37A3 knockout background | |
| Transfected construct (H. sapiens) | HEK 293T ATRAIDKO + s/lATRAID-V5 | this paper | A V5-tagged short/long ATRAID CDS under PGK promoter was integrated in to the AAVS1 expression harbor in ATRAID knockout background | |
| Transfected construct (H. sapiens) | HEK 293T KO2 + SLC37A3-HA | this paper | An HA-tagged SLC37A3 CDS under PGK promoter was integrated in to the AAVS1 expression harbor in double knockout background | |
| Transfected construct (H. sapiens) | HEK 293T KO2 + SLC37A3-HA + s/lATRAID-V5 | this paper | letiviral vectors containing V5-tagged short/long ATRAID CDS under PGK promoter was transduced intoKO2 + SLC37A3-HA background | |
| Antibody | anti-HA (rat mAb) | Sigma-Aldrich | Sigma-Aldrich: 11867423001, RRID:AB_390918 | |
| Antibody | anti-V5 (rabbit mAb) | Cell Signaling Technology | Cell Signaling Technology: 13202, RRID:AB_2687461 | |
| Antibody | anti-V5 (mouse mAb) | ThermoFisher | ThermoFisher: R960-25, RRID:AB_2556564 | |
| Antibody | anti-LAMP2 (mouse mAb) | Santa Cruz Biotechnology | Santa Cruz: sc-18822, RRID:AB_626858 | |
| Antibody | anti-ATP1A1 (mouse mAb) | Abcam | Abcam: ab7671, RRID:AB_306023 | |
| Antibody | anti-Rap1A (goat pAb) | Santa Cruz Biotechnology | Santa Cruz: sc-1482 | This item has been discontinued due to animal welfare concerns |
| Antibody | anti-HDJ2 (mouse mAb) | ThermoFisher | ThermoFisher: MS-225-P0, RRID:AB_10982482 | |
| Antibody | anti-GAPDH (rabbit mAb) | Cell Signaling Technology | Cell Signaling Technology: 2118, RRID:AB_561053 | |
| Recombinant DNA reagent | pSpCas9(BB)−2A-GFP | Addgene | Addgene: 48138 | |
| Recombinant DNA reagent | AAVS1-Puro-PGK1−3 × FLAG-TwinStrep | Addgene | Addgene: 68375 | |
| Recombinant DNA reagent | pLenti PGK Hygro DEST (w530-1) | Addgene | Addgene: 19066 | |
| Recombinant DNA reagent | AAVS1-Puro-PGK1-SLC37A3-HA | this paper | The FLAG-TwinStrep sequence in AAVS1-Puro-PGK1−3 × FLAG TwinStrep was replaced with an HA-tagged SLC37A3 CDS. | |
| Recombinant DNA reagent | AAVS1-Puro-PGK1-s/lATRAID-V5 | this paper | The FLAG-TwinStrep sequence in AAVS1-Puro-PGK1−3 × FLAG TwinStrep was replaced with an V5-tagged short/long ATRAID CDS. | |
| Recombinant DNA reagent | pLenti PGK Hygro s/lATRAID-V5 | this paper | A V5-tagged short/long ATRAID CDS was inserted under the PGK promoter for lentiviral expression | |
| Sequence-based reagent | sgRNA_human_ATRAID_exon3_1 | this paper | sequence: GCCTGATGAAAGTTTGGACC | a sgRNA targeting exon 3 of ATRAID for generating knock-out cells |
| Sequence-based reagent | sgRNA_human_ATRAID_exon3_2 | this paper | sequence: CCCTGGTCCAAACTTTCATC | a sgRNA targeting exon 3 of ATRAID for generating knock-out cells |
| Sequence-based reagent | sgRNA_human_ATRAID_exon5 | this paper | sequence: GTCCTGGAGGAATTAATGCC | a sgRNA targeting exon 5 of ATRAID for generating knock-out cells |
| Sequence-based reagent | sgRNA_human_SLC37A3_intron5_1 | this paper | sequence: GTGTGAGTGTATCCTTCACG | a sgRNA targeting intron 5 of SLC37A3 for generating knock-out cells |
| Sequence-based reagent | sgRNA_human_SLC37A3_intron5_2 | this paper | sequence: GCCAGTGCCTGTAAGTCACG | a sgRNA targeting intron 5 of SLC37A3 for generating knock-out cells |
| Sequence-based reagent | sgRNA_human_SLC37A3_intron6 | this paper | sequence: GTAGCAAGTCAGAGTTGTTCA | a sgRNA targeting intron 6 of SLC37A3 for generating knock-out cells |
| Sequence-based reagent | sgRNA_mouse_ SLC37A3_exon1_1 | this paper | sequence: TCTCTGCAAAAATCGTGGCC | a sgRNA targeting exon 2 of SLC37A3 for generating knock-out cells |
| Sequence-based reagent | sgRNA_mouse_SLC37A3_exon1_2 | this paper | sequence: TGTTCCTGCTCACGTTCTTC | a sgRNA targeting exon 2 of SLC37A3 for generating knock-out cells |
| Peptide, recombinant protein | HA peptide | ThermoFisher | ThermoFisher: 26184 | |
| Peptide, recombinant protein | V5 peptide | APExBIO | APExBIO: A6005 | |
| Commercial assay or kit | CellTiter-Glo | Promega | Promega: G7572 | |
| Commercial assay or kit | anti-HA affinity matrix | Sigma-Aldrich | Sigma-Aldrich: A2095 | |
| Commercial assay or kit | anti-V5 affinity matrix | Sigma-Aldrich | Sigma-Aldrich: A7345 | |
| Chemical compound, drug | alendronate | Sigma-Aldrich | Sigma-Aldrich: A4978 | |
| Chemical compound, drug | zoledronate | Sigma-Aldrich | Sigma-Aldrich: SML0223 | |
| Chemical compound, drug | ibandronate | Sigma-Aldrich | Sigma-Aldrich: I5784 | |
| Chemical compound, drug | lovastatin | Sigma-Aldrich | Sigma-Aldrich: PHR1285 | |
| Chemical compound, drug | AlexaFlour 647 labeled zoledronate | BioVinc | BioVinc: AF647-ZOL | |
| Chemical compound, drug | digitonin | Millipore-Sigma | Millipore-Sigma:300410 | |
| Chemical compound, drug | saponin | Sigma-Aldrich | Sigma-Aldrich: 47036 | |
| Software, algorithm | Huygens Professional | Scientific Volume Imaging | RRID:SCR_014237 |
Additional files
-
Supplementary file 1
A data table containing statistical information on all genes targeted in the CRISPRi screen using alendronate as the selection agent.
Information on three phenotypic scores, gamma (impact of CRISPRi silencing on basal cell growth), rho (impact of CRISPRi silencing on alendronate-mediated inhibition of cell growth) and tau (combined impact of CRISPRi silencing on overall cell growth in the presence of alendronate), are reported for all genes targeted in the screen in each replicate of the screen (RepA and RepB) as well as the average of the two replicates (ave_RepB_RepA). Specifically, numeric values and statistical significance of the three phenotypic scores are listed for all genes targeted in the screen.
- https://doi.org/10.7554/eLife.36620.013
-
Supplementary file 2
A data table containing statistical information on all genes targeted in the CRISPRi screen using zoledronate as the selection agent.
Statistical information reported is the same as in Supplementary file 1.
- https://doi.org/10.7554/eLife.36620.014
-
Transparent reporting form
- https://doi.org/10.7554/eLife.36620.015
Download links
A two-part list of links to download the article, or parts of the article, in various formats.
Downloads (link to download the article as PDF)
Open citations (links to open the citations from this article in various online reference manager services)
Cite this article (links to download the citations from this article in formats compatible with various reference manager tools)
Identification of a transporter complex responsible for the cytosolic entry of nitrogen-containing bisphosphonates
eLife 7:e36620.
https://doi.org/10.7554/eLife.36620


