A novel pH-dependent membrane peptide that binds to EphA2 and inhibits cell migration
- University of Tennessee, United States
- University of Akron, United States
- Case Western Reserve University, United States
- MetroHealth Medical Center, United States
- Graduate School of Genome Science and Technology, University of Tennessee, United States
- Oak Ridge National Laboratory, United States
- National Institute for Mathematical and Biological Synthesis, University of Tennessee, United States
Figures
Figure 1 with 4 supplements
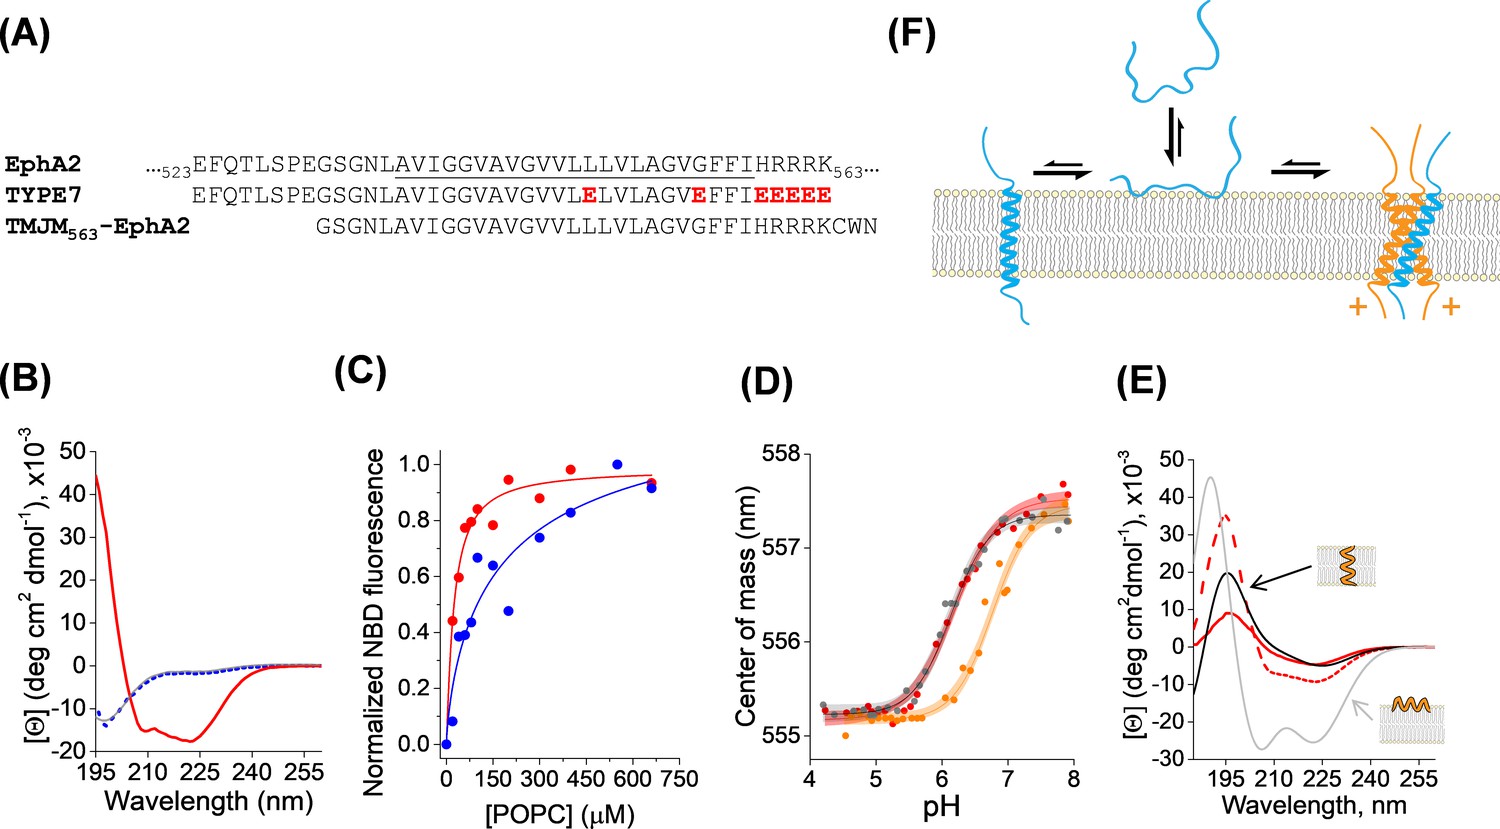
Membrane interaction of TYPE7.
(A) Top, partial amino acid sequence of the human EphA2 receptor showing the TM helix (underlined), preceded by a short extracellular segment, and followed by the start of the juxtamembrane segment. Residue numbers in the sequence of EphA2 are shown. Middle, sequence of the TYPE7 peptide, where the acidic residues introduced are shown in red. Bottom, sequence of the TMJM563-EphA2 peptide used in panel D. (B) Circular dichroism determination of TYPE7 secondary structure in buffer at pH 8 (grey line), and in the presence of POPC vesicles at pH 8 (dotted blue line) and after acidification to pH 4 (red line). (C) TYPE7 binding to POPC vesicles at pH 5 (red) and pH 8 (blue). Lines are fittings to Equation. 3, used to determine the Kp values. Lipid binding was measured using the environmentally-sensitive dye NBD attached to the Nt of TYPE7. (D) Determination of the pH midpoint (pH50) for the insertion of TYPE7 into POPC vesicles. TYPE7 data is shown in red symbols. Data obtained in vesicles containing the GWALP23 peptide control are shown in grey, and in vesicles containing TMJM563-EphA2 in orange. Peptide insertion was monitored by following changes in the NBD spectral center of mass (Equation. 1) (Scott et al., 2017; Barrera et al., 2002). Control OCD experiments showed that TMJM563-EphA2 formed a TM helix (Figure 1—figure supplement 4). The lines correspond to the fitting to the data using Equation. 2 and 95% confidence intervals are shown as shaded areas (n = 6). (E) OCD determination of the membrane orientation of TYPE7. Data were obtained in POPC (16:0,18:1-PC, dashed red line) and 22:1,22:1-PC (continuous red line). The theoretical spectra for a perfectly transmembrane (0°, black line) and peripheral (90°, grey line) helix are shown as a reference. (F) Cartoon of the different states TYPE7 (blue) adopts, and how TMJM563-EphA2 (orange) promotes the TM state of TYPE7. Arrows represent approximate equilibrium conditions found at pH ~6.5. The (+) symbols represent basic residues in the juxtamembrane segment of EphA2.
Figure 1—figure supplement 1
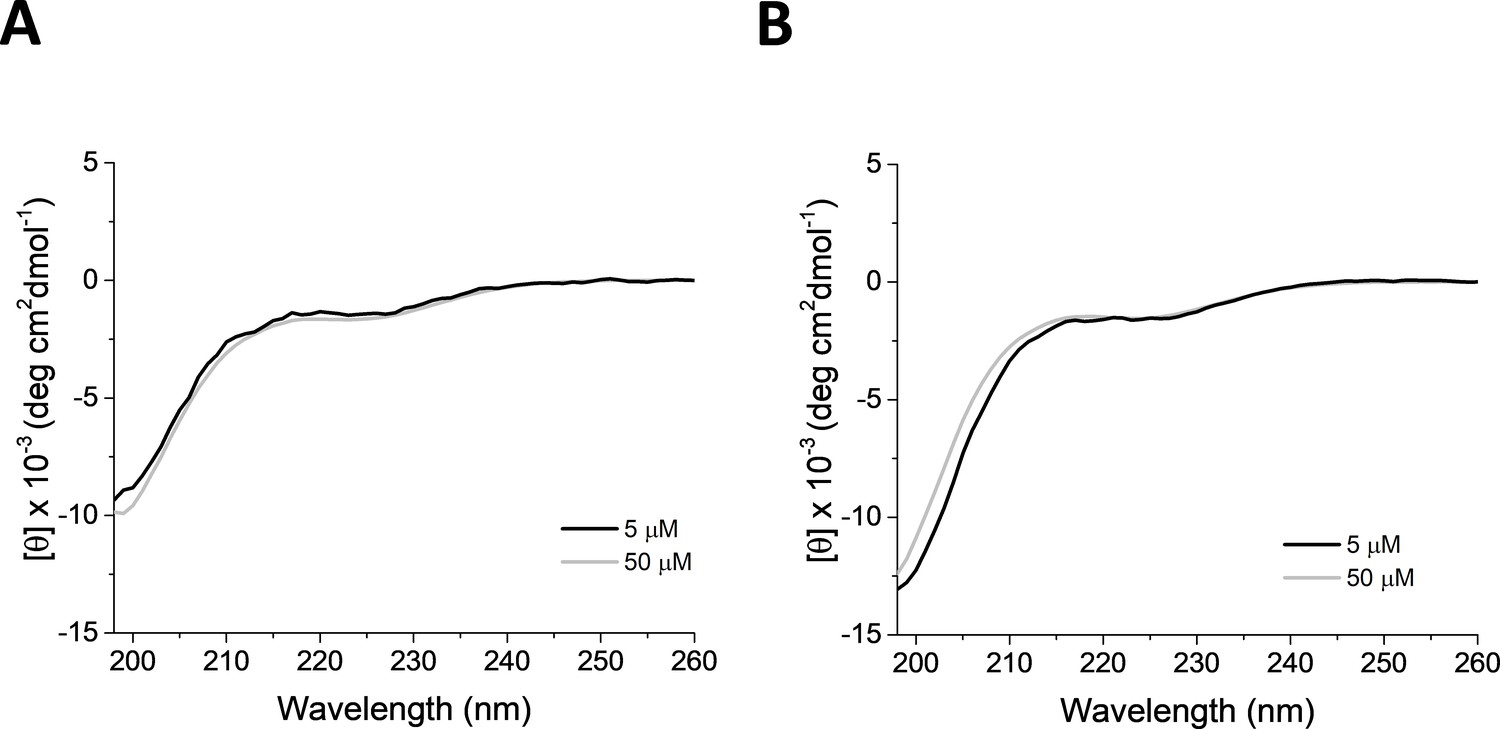
TYPE7 solubility.
Circular dichroism (CD) solubility studies of TYPE7 in PBS (11.9 mM NaPi, 137 mM NaCl, 2.7 mM KCl, pH 7.4) (A) and 10 mM NaPi pH 8 (B) solutions. Normalized CD spectra show a single minimum at 200 nm. The lack of significant secondary structure suggests that the peptide is not aggregated at the two concentrations tested, 5 μM and 50 μM (black and grey lines, respectively); n = 3.
Figure 1—figure supplement 2
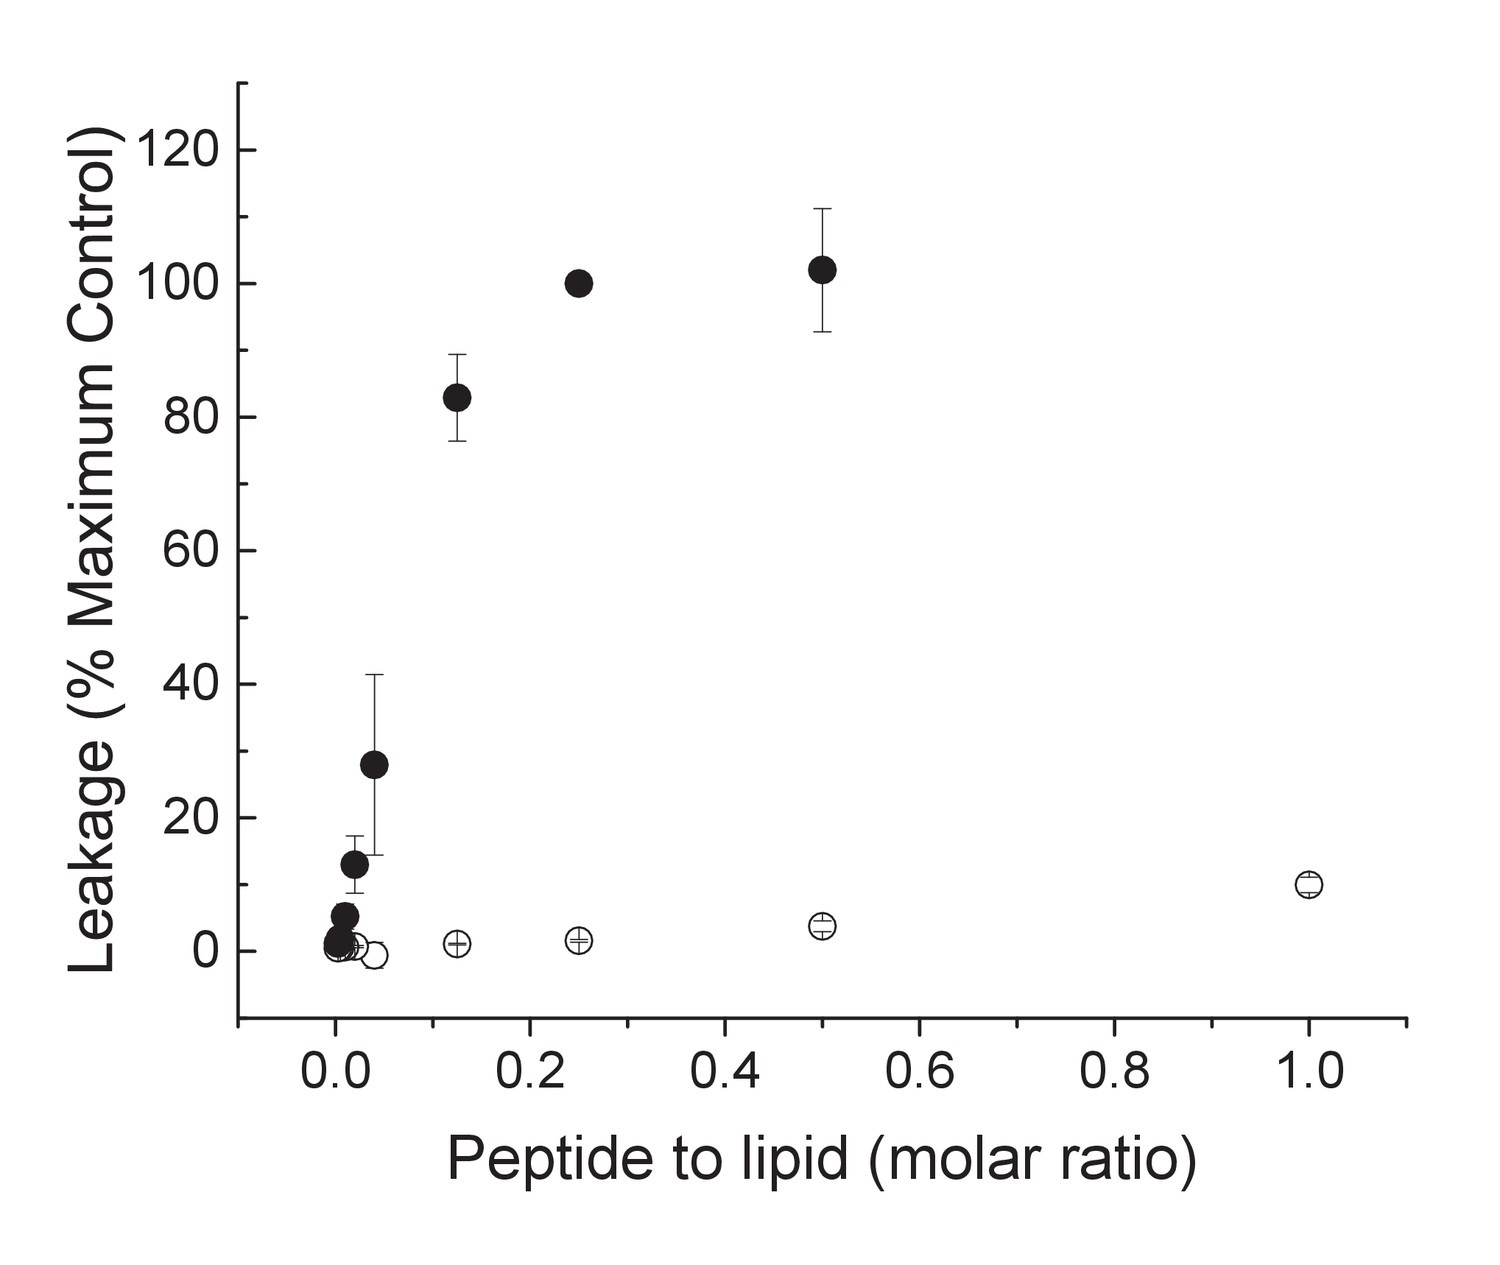
TYPE7 does not induce significant membrane leakage.
The release of calcein encapsulated in POPC vesicles was measured by following the fluorescence intensity at 485 nm after addition of TYPE7 (open symbols). For a constant POPC concentration, different peptide concentrations were tested, for a 0.0025 – 1.0 mol % TYPE7:POPC molar ratio range. Mellitin was used as a positive control for leakage (closed symbols). Maximum leakage was achieved by addition of Triton X-100. Mean ±S.D., n = 3.
Figure 1—figure supplement 3

TYPE7 is not toxic, and shows a pH-dependent interaction with cells.
(A) TYPE7-bodipy FL-X binding to H358 cells at pH 5, 6 and 7. Data at different pH values were normalized to maximum fluorescence. Mean ±S.D., n = 3. Student’s t-test; *p<0.05; **p<0.01 and NS: not significant. (B) H358 cells were treated with increasing concentrations of TYPE7 (0.5, 1 and 2 μM) during 24 hr. Cell viability was assessed using the MTS assay. The results indicate that TYPE7 does not cause toxicity to treated cells. Mean ±S.D., n = 3. (C) We threaded the sequence of TYPE7 (blue) onto one of the helices of the published dimeric structure of the transmembrane domain of EphA2 (PDB: 2K9Y) (orange). The residues substituted with glutamic acid are shown as spheres on TYPE7 outside the helix interface. The corresponding EphA2 residues are highlighted on the opposite orange helix.
Figure 1—figure supplement 4
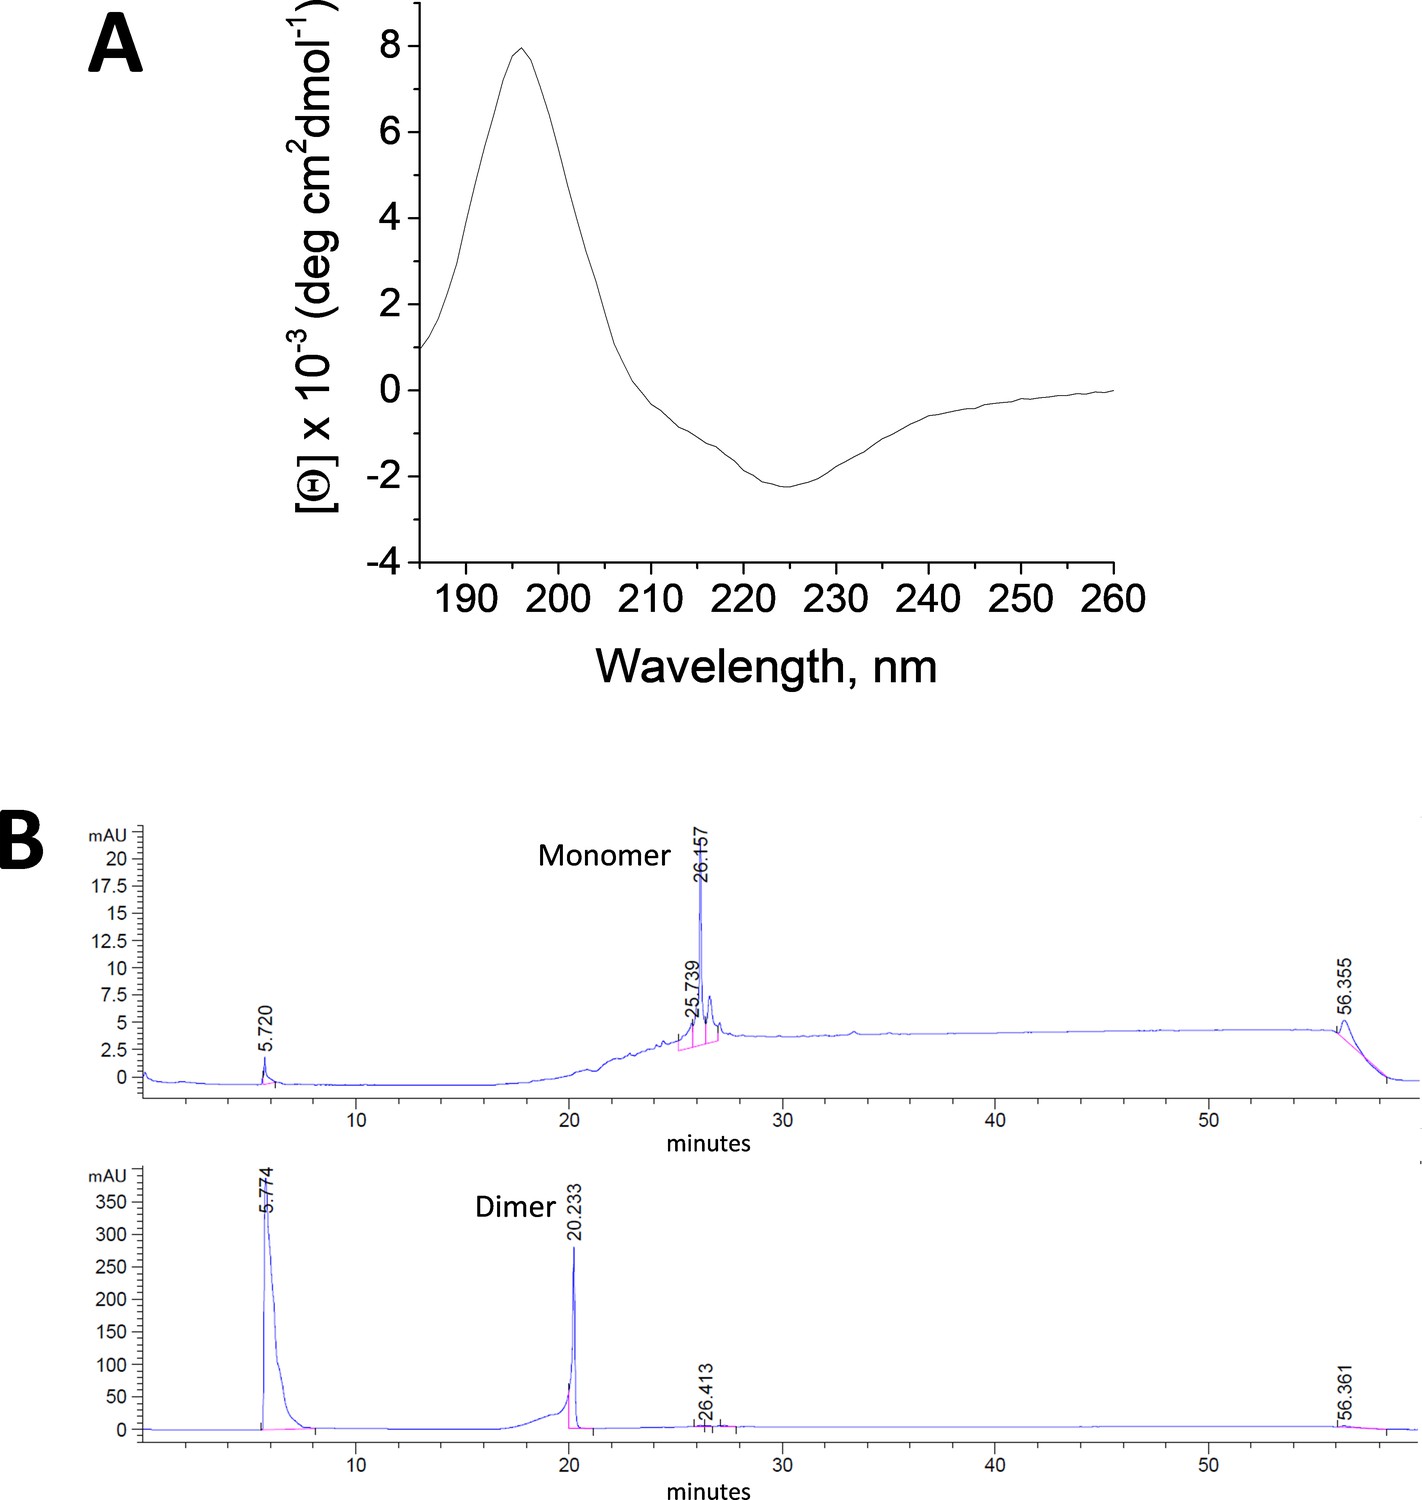
TM-EphA2 peptide inserts into membranes as a transmembrane helix.
(A) OCD spectrum of TMJM563-EphA2 in POPC (16:0,18:1-PC) bilayers. (B) HPLC data showing that TMJM563-EphA2 does not dimerize using a disulfide bond. Top, chromatogram showing the elution of the TMJM563-EphA2 monomer at 26.2 min. Bottom, control experiment where TMJM563-EphA2 dimerization was induced by oxidation with 10 mM copper phenanthroline for 3.5 hr. A dimeric peak appears at 20.2 min, which was not observed in the absence of oxidizing agent.
Figure 2
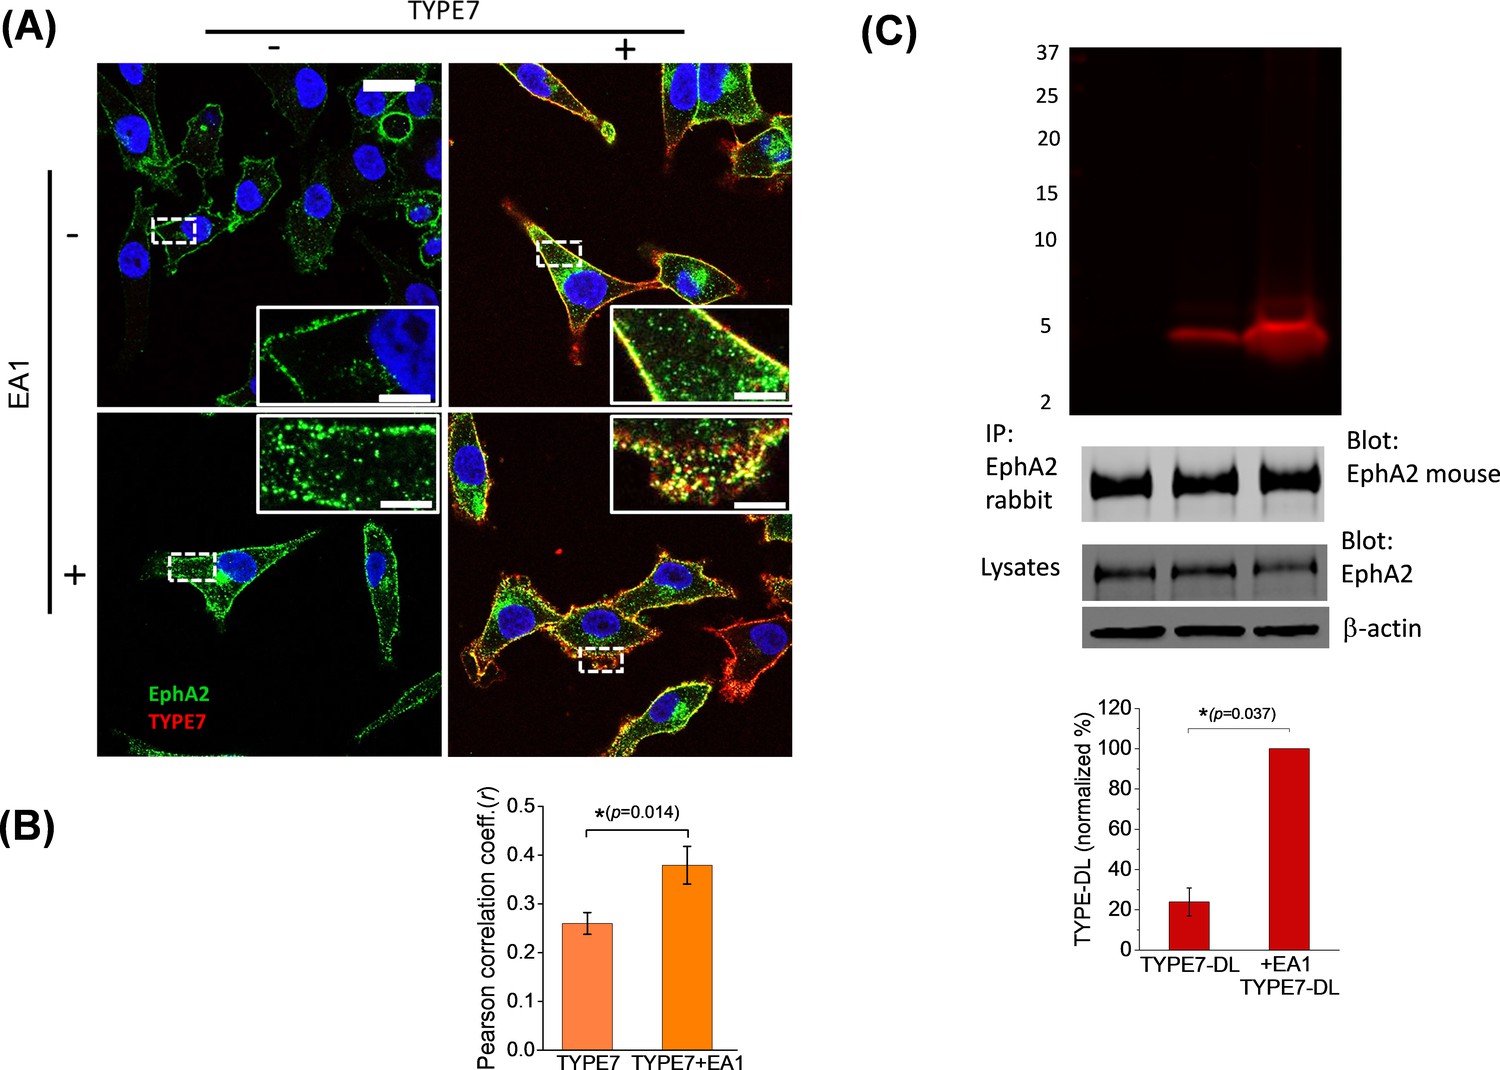
TYPE7 interacts with endogenous EphA2 in cells.
(A) Confocal microscopy shows co-localization of TYPE7 and EphA2. A375 cells were incubated in the presence (+) or absence (-) of 0.5 µg/mL EA1 and 0.2 µM TYPE7-Alexa568 (red) for 5 min at room temperature. Cells were fixed and endogenous EphA2 was labeled via immunofluorescence (green). Images were collected using a 63x objective, and insets show images corresponding to the white dashed areas collected with a 100x objective. Scale bars are 20 µm and 5 µm, respectively. (B) The Pearson correlation coefficient (r) was calculated for cells incubated with TYPE7 in the absence and presence of EA1. Bar graph shows mean ±S.D. Student’s t-test was performed for 14 – 17 images. *p<0.05, with as effect size of 0.80 standard deviations, n = 2. (C) Top, SDS-PAGE showing that TYPE7-DL co-precipitates with endogenous EphA2 when using a polyclonal anti-rabbit EphA2 antibody. Middle, control Western blots of EphA2 immunoprecipitation blotted with mouse anti-EphA2 show that similar amounts of endogenous EphA2 were pulled down in all samples. Total cell lysates blotted with EphA2 and β-actin indicate that similar levels of protein were loaded. Bottom, quantification of the fluorescent bands. Bar graph shows mean ±S.D. as a percentage of maximum intensity. A Mann-Whitney test was performed (*p<0.05), n = 3.
Figure 3 with 5 supplements
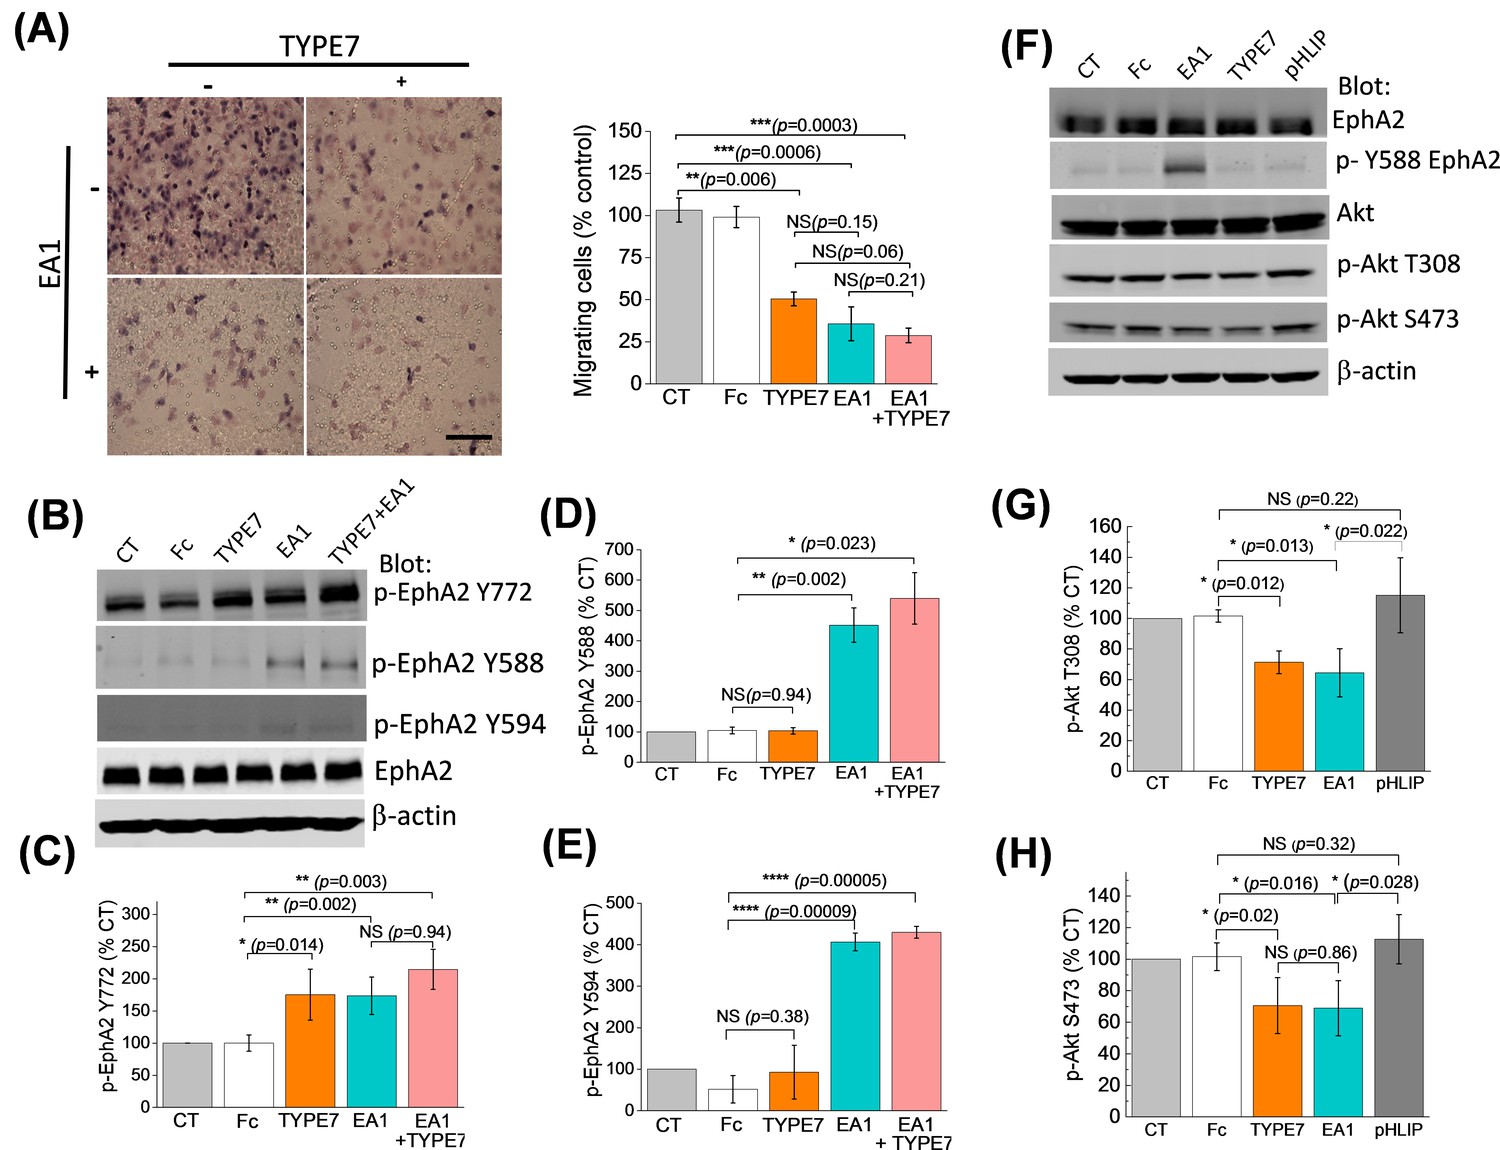
TYPE7 decreases cell migration, and induces EphA2 phosphorylation at Y772 and Akt de-phosphorylation.
(A) Left, cell migration was measured in the presence and absence of TYPE7 and EA1 using a Boyden cell chamber assay. Representative images are shown. Right, quantification of migrating cells, showing that incubation with TYPE7 reduced A375 cell migration to a similar degree as EA1, with effect sizes of 8.4 and 12.6 standard deviations from control, respectively. N = 3. Cells were treated with an isolated Fc group as a control for the Fc present in EA1. Scale bar is 200 µm (B–E), Phosphorylation of Y772 and JMS phosphorylation at Y588 and Y594. A representative Western blot is shown (B). Band intensity was quantified for p-Y772 (C), p-Y588 (D), and p-Y594 (E). We found that incubation with TYPE7 increased phosphorylation of Y772 as efficiently as EA1, with effect sizes of 5.1 and 7.7 standard deviations from control, respectively. Mean ±S.D. are shown. n = 5. (F–H), Phosphorylation levels of Akt. A representative Western blot is shown (F) and band intensity was quantified for p-T308 (G) and p-S473 (H). Lysates were blotted against total EphA2 to detect total protein levels, and β-actin as a loading control. Student’s t-test was performed to obtain p values (*p<0.05; **p<0.01; ***p<0.001; ****p<0.0001 and NS, not significant).
Figure 3—figure supplement 1
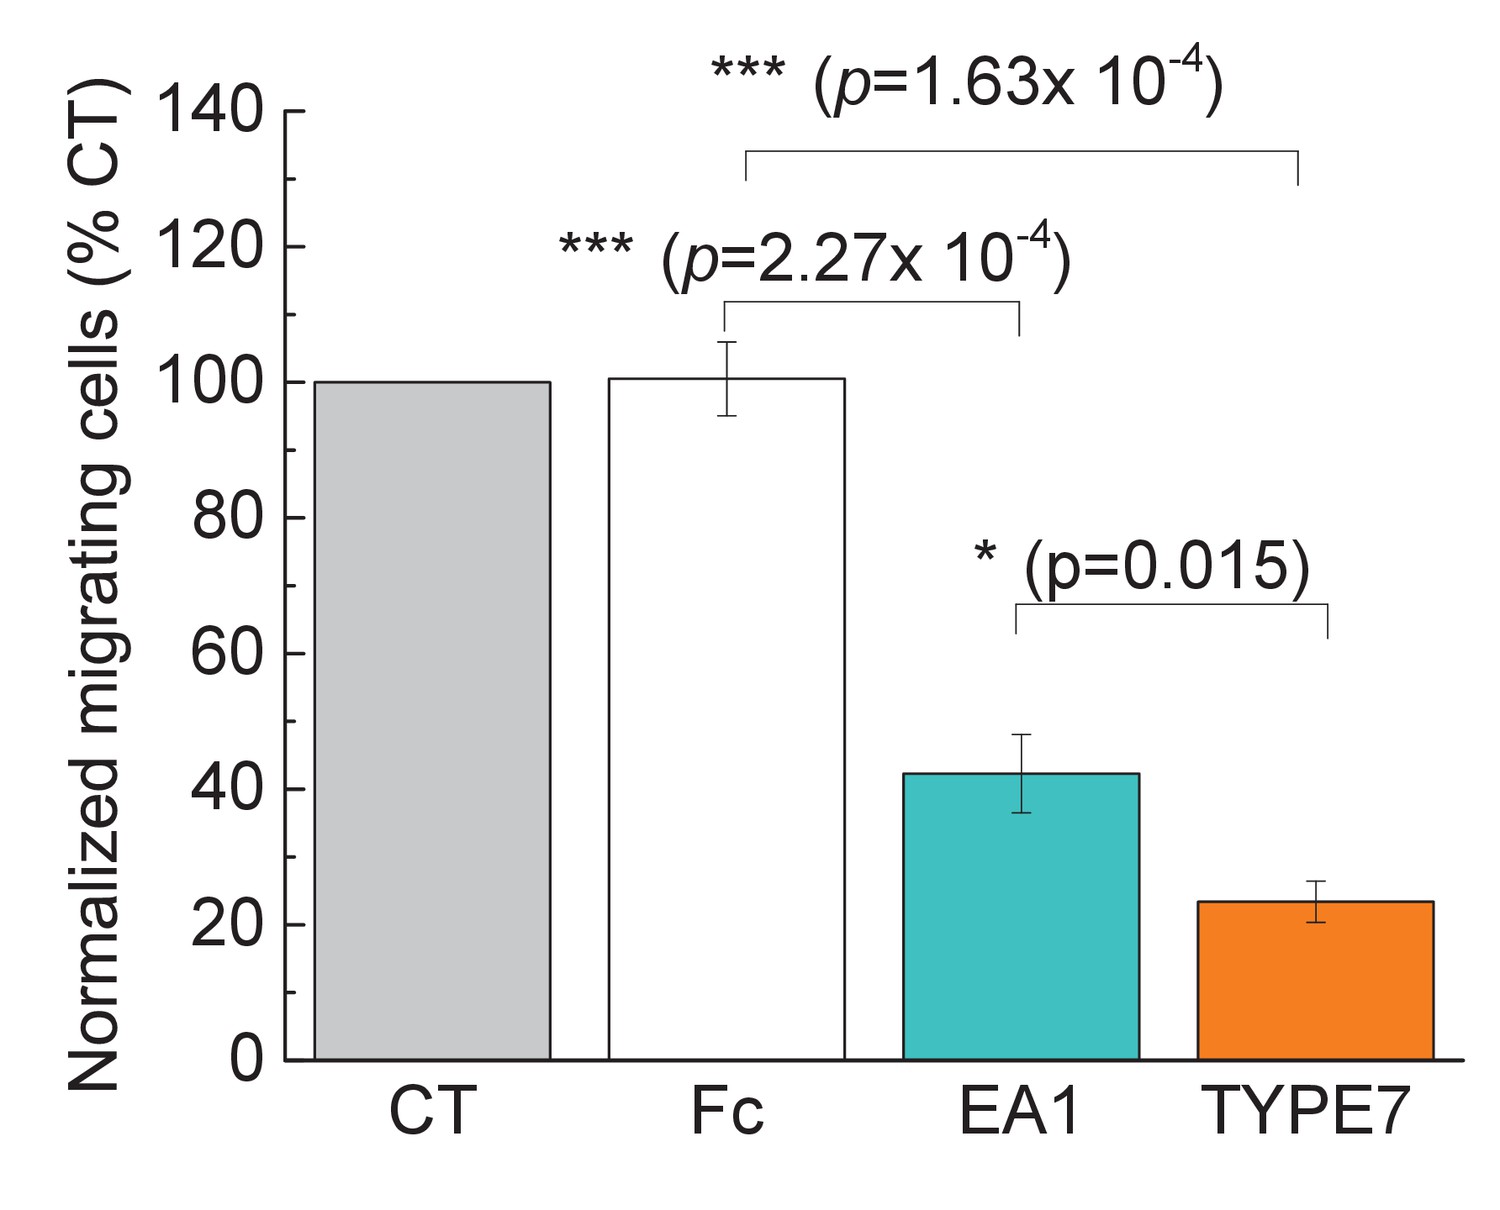
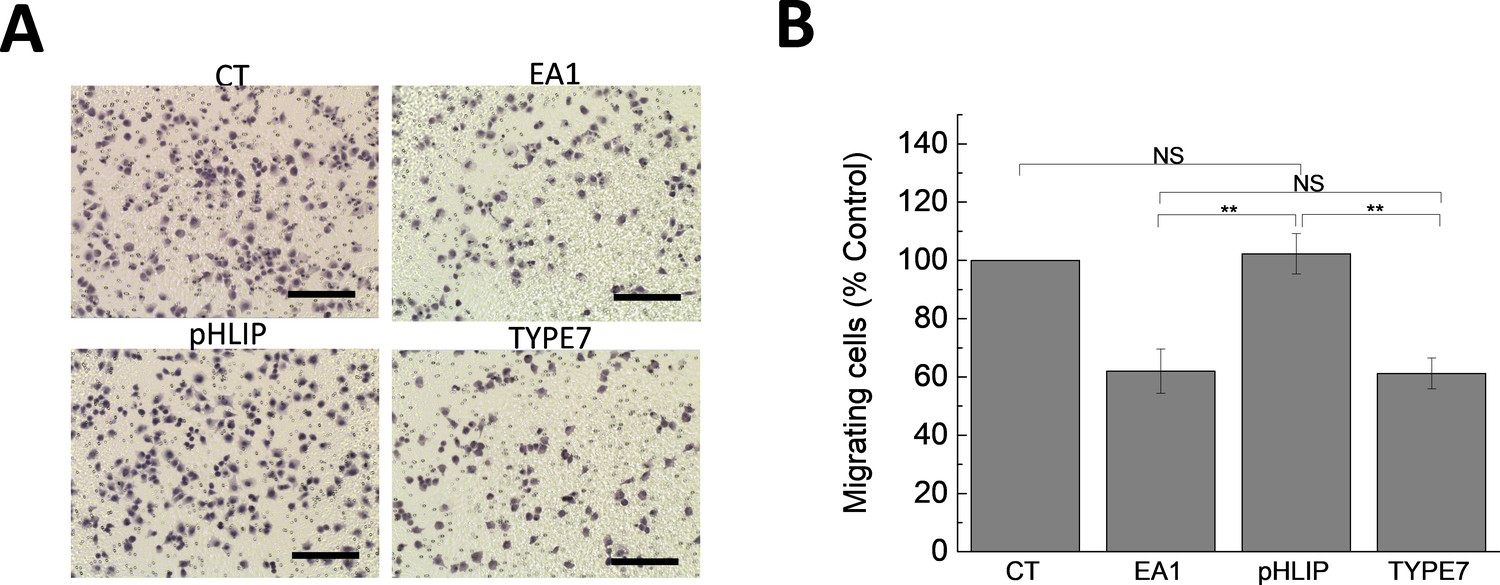
TYPE7 decreases cell migration in H358 cells.
Cell migration was measured in the presence and absence of TYPE7 and EA1 using a Boyden cell chamber assay, and the number of migrating cells was normalized to control conditions (CT). The experiment was performed with cells treated with 1 μg/mL Fc, 1 μg/mL EA1, or 2 μM of pHLIP or TYPE7. Statistical analysis was performed by using a Student’s t-test; *p<0.05, ***p<0.001. n = 3.
Figure 3—figure supplement 2
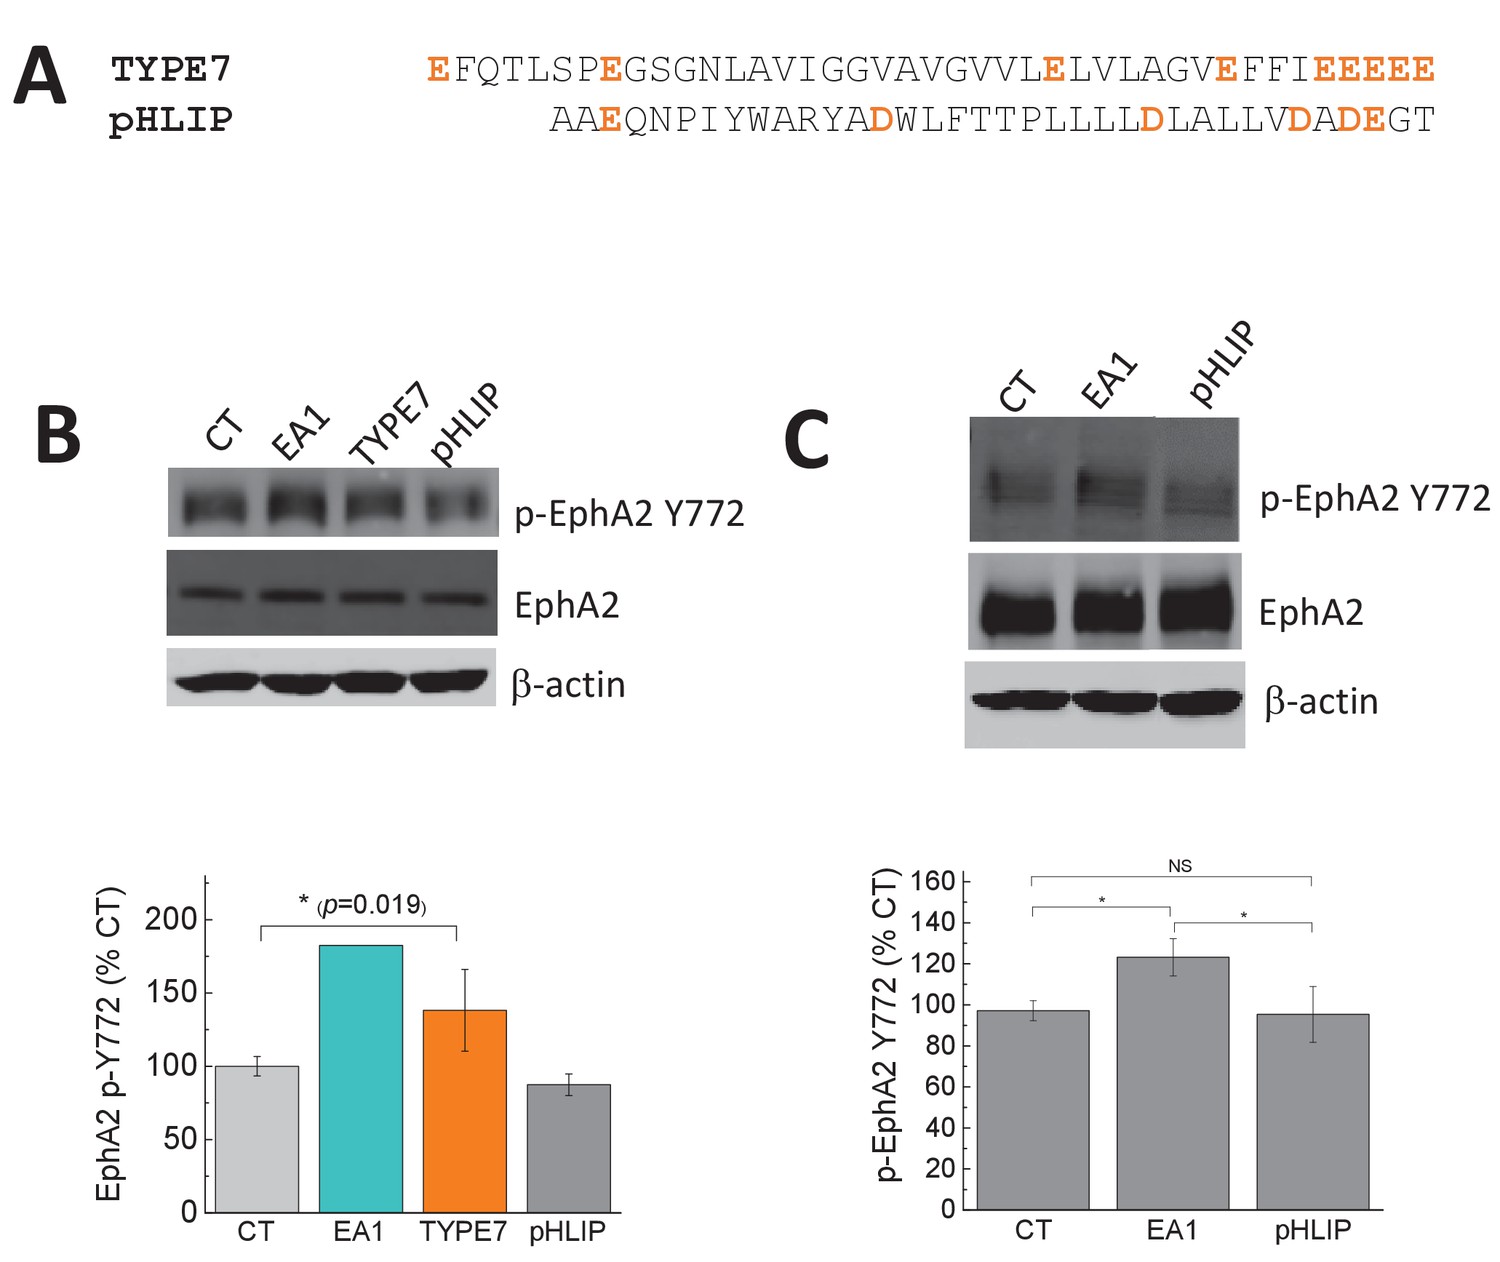
The control pHLIP peptide does not affect the phosphorylation of EphA2 at Y772.
(A) Comparison of the sequences of TYPE7 and pHLIP, with acidic residues marked in orange. Experiments were performed in A375 cells (B) and H358 cells (C). Top panels, cell lysates were blotted with anti-phospho-EphA2 Y772, and EphA2 and anti-β-actin as loading controls; Bottom panels, quantification of p-EphA2 Y772 bands. Cells were treated with Fc, TYPE7 (2 μM), pHLIP (2 μM), or EA1 (0.5 μg/mL). Statistical analysis was performed using a Student’s t-test; *p<0.05, NS = no significant differences. n = 4 – 6 for panel B, and n = 3 for panel C. All experiments were performed at pH 7.4, except pHLIP in panel B, which was performed at pH 4.2 to ensure complete TM helix formation of pHLIP.
Figure 3—figure supplement 3
The control pHLIP peptide does not affect cell migration.
(A) Boyden chamber assay was performed with A375 cells treated with 1 μg/mL Fc (CT), 1 μg/mL EA1, 2 μM pHLIP or 2 μM TYPE7. Scale bars are 200 μm. (B) Image quantification. Cells treated with pHLIP migrated similarly as CT. On the contrary, as shown in Figure 3A, TYPE7 and EA1 induced similar levels of cell migration inhibition. Statistical analysis was performed by using a Student’s t-test. **p<0.01, NS = no significant differences. n = 3.
Figure 3—figure supplement 4
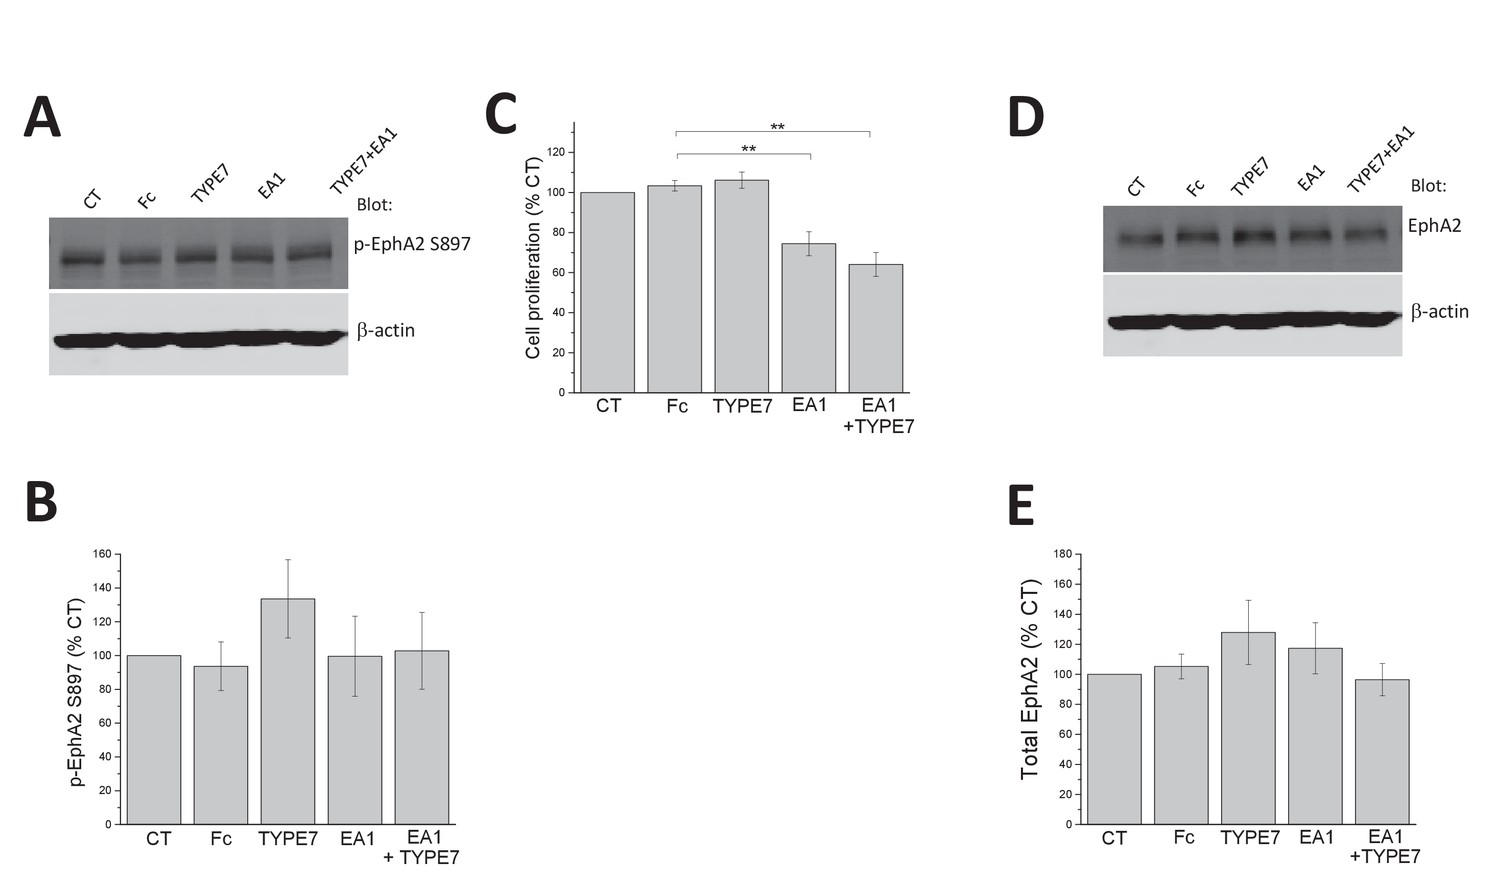
EphA2 expression levels and phosphorylation at S897 are not affected by TYPE7.
(A) H358 cells were treated with Fc (0.5 μg/mL), TYPE7 (2 μM) or EA1 (0.5 μg/mL). The cell lysates were blotted with anti-phospho-EphA2 S897 and anti-β-actin to assess total protein loading. (B) EphA2-phospho-S897 quantification of five independent experiments. Statistical analysis was performed by using a Student’s t-test, which indicated no significant differences between samples and controls. (C) MTS cell proliferation assay. A375 cells were treated with Fc (0.5 μg/mL), EA1 (3 μg/mL), TYPE7 (2 μM) and TYPE7 +EA1 for 48 hr. No significant differences between Fc control and TYPE7 treated cells were found using a Student’s t-test; **p<0.01. Mean ±S.D., n = 3. (D–E) EphA2 expression levels do not change after TYPE7 treatment. Student’s t-test was performed and no significant differences were found between samples. Mean ±S.D., n = 5.
Figure 3—figure supplement 5
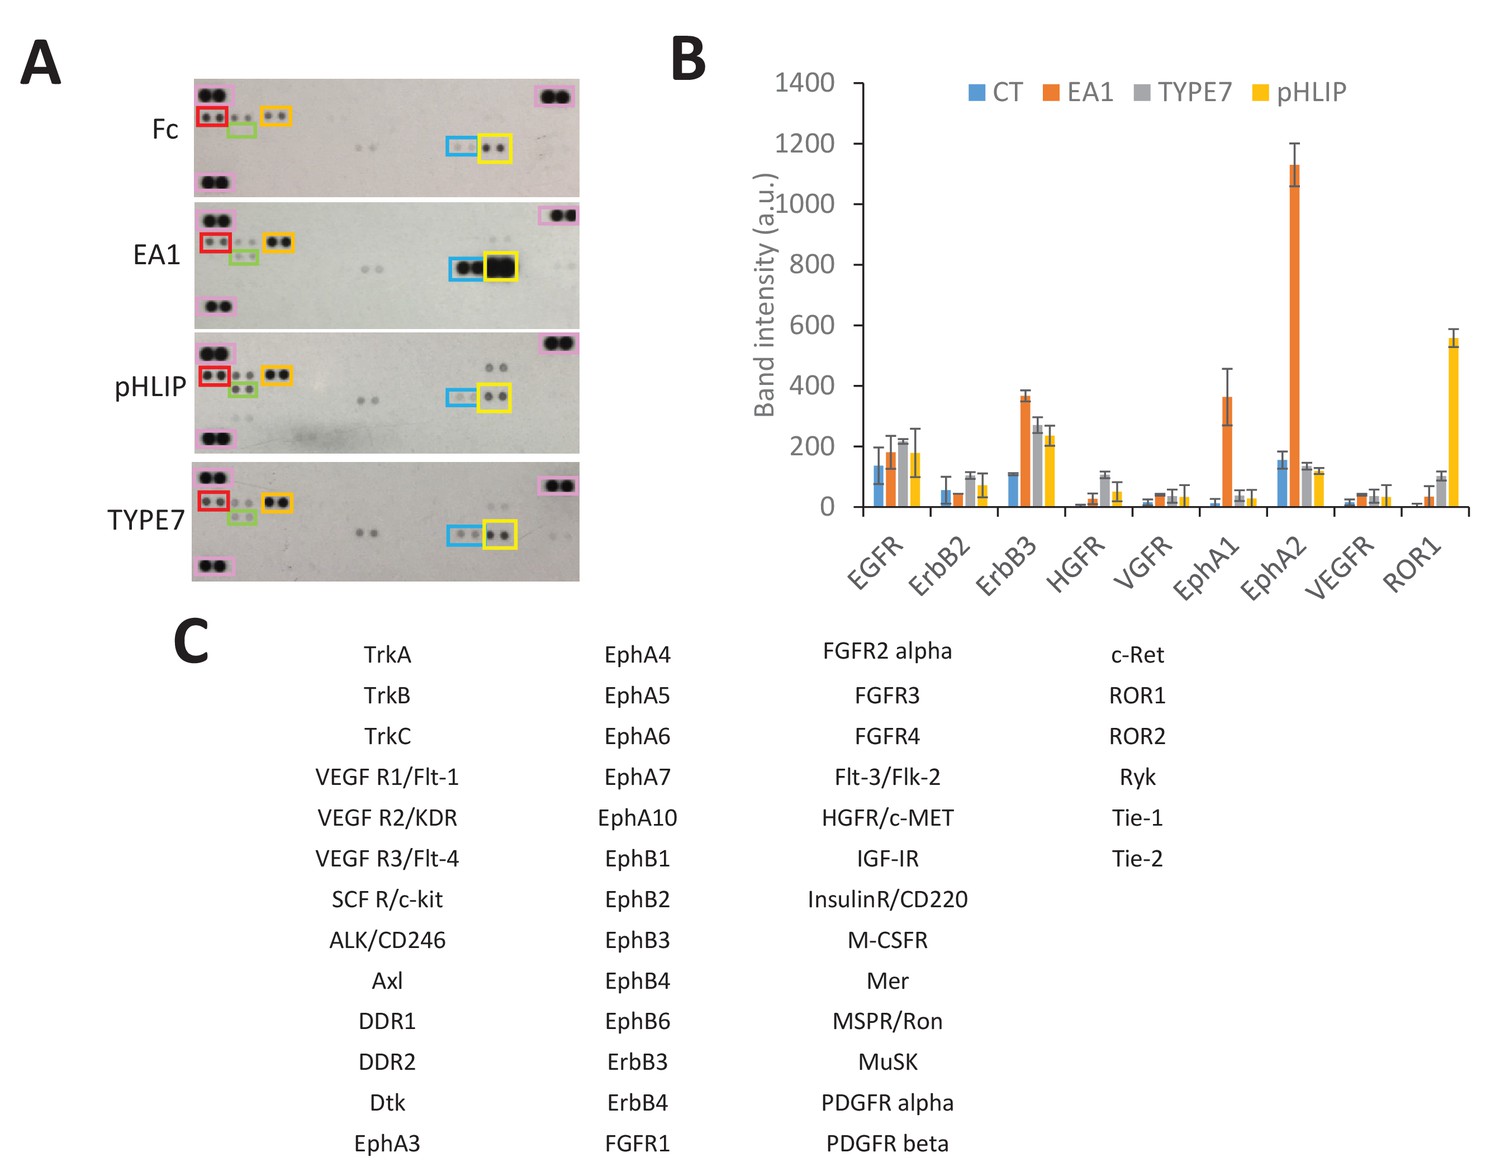
Human Phospho-Tyrosine RTK array.
(A) H358 cells were treated with Fc (0.5 mg/mL), TYPE7 (2 μM), pHLIP (2 μM) or EA1 (0.5 mg/mL). After treatment, cell lysates were incubated overnight with array membranes to detect tyrosine phosphorylation of 49 different RTKs. The three pairs of reference spots used for blot alignment are boxed pink. Boxed RTK are: EphA1 (blue), EphA2 (yellow), HGFR/c-MET (green), EGFR (red) and ErbB3 (orange). (B) Bar graph shows mean and standard deviation of selected RTKs. The table on the right shows the identity of all the RTKs. (C) pHLIP weakly promotes phosphorylation of ErbB3 and HGFR/c-MET, as TYPE7 does. Since pHLIP does not induce EphA2 phosphorylation at Y772 (Figure 3—figure supplement 2) or affects cell migration (Figure 3—figure supplement 3), this evidence logically argues against activation of those RTKs being involved in the TYPE7 regulation of these events.
Figure 4 with 3 supplements
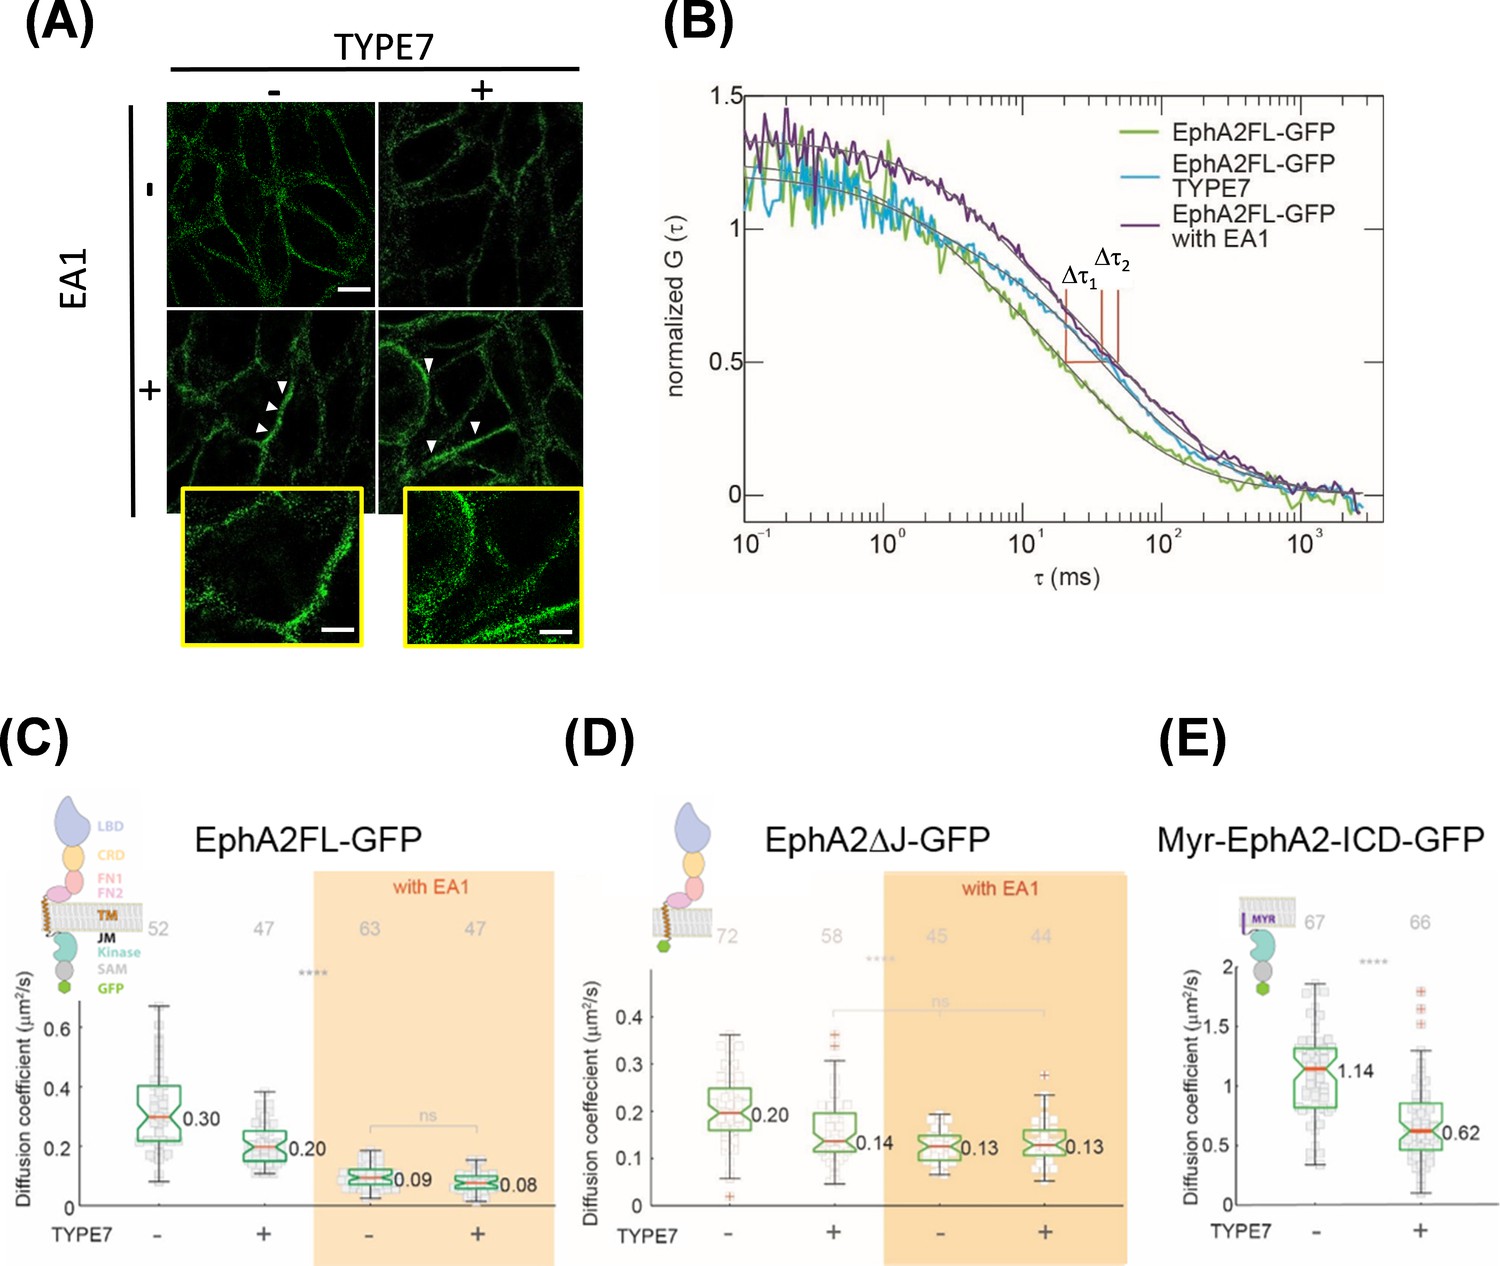
TYPE7 induces formation of oligomers of EphA2.
(A) Super-resolution SIM data. H358 cells were incubated in the presence (+) or absence (-) of 0.5 µg/mL EA1 and 2 µM TYPE7. Representative images show fluorescence obtained using an anti-EphA2 antibody (n = 4). Scale bar is 10 µm. Insets magnify areas with clusters, and the scale bars are 5 µm. (B) Representative FCS autocorrelation curves for EphA2FL-GFP in control conditions (green) or in the presence of TYPE7 (blue) and EA1 (magenta). Δτ1 and Δτ2 represent the changes in dwell time. (C–E) Diffusion coefficient results, containing graphic models describing the EphA2 constructs used. (C) Box-whisker plot of measurement of the FCS diffusion coefficient of EphA2FL-GFP. (D) Diffusion coefficient of EphA2ΔJ-GFP. (E) Diffusion coefficient of Myr-EphA2 ICD-GFP. Diffusion coefficients collected from cells with and without TYPE7 treatment are reported along with EA1 ligand stimulation (orange boxes). The median values are reported next to the box plots. Each data point is the average of five 10 s FCS measurements on one cell. The grey numbers on top of the plots are the total number of cells measured. Criteria for the box, median, quartiles, whiskers and outliers are described elsewhere (Shi et al., 2017). One-way ANOVA tests were performed to obtain the p values (****p<0.0001; ns, not significant).
Figure 4—figure supplement 1
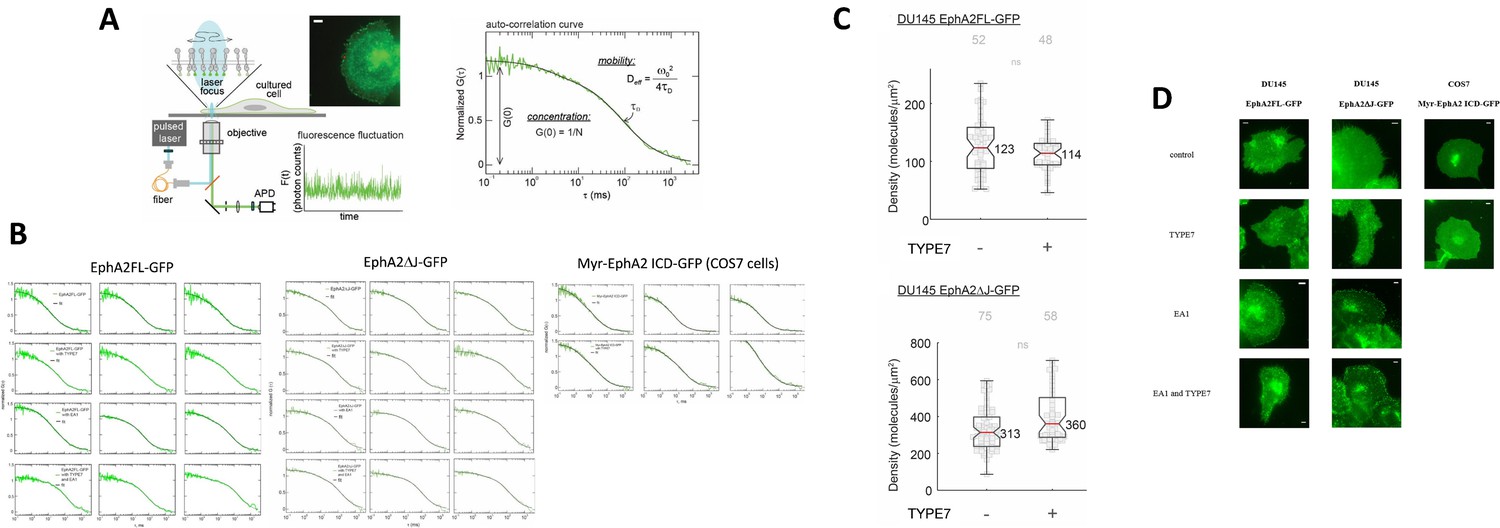
FCS supplement.
(A) FCS experiments. Schematic diagram of a FCS experiment. A 488 nm laser beam is focused at the peripheral membrane area of a cultured cell to excite the GFP tag on the diffusive receptors. The emitted photons are collected through the objective and directed to an avalanche photodiode (APD). The fluorescence fluctuation caused by the diffusion of receptors is recorded and transformed into the auto-correlation function. Insert: epi-fluorescence image of DU145 cell expressing GFP-tagged receptors; the red dot represents the position of laser beam. Scale bar is 5 μm. In the auto-correlation curve, τD and G(0) report on the mobility and the concentration of the diffusive receptors, respectively. (B) FCS auto-correlation curves for the three EphA2 constructs. Three curves are shown for each experimental condition. (C) Receptor density of EphA2FL-GFP in DU145 cell membranes. Median density value is reported for EphA2FL-GFP and EphA2ΔJ-GFP. Each data point is the average of five 10 s FCS measurements on one cell. 52 cells were measured. (D) Representative epi-fluorescence images of cells used for FCS measurements under different conditions of TYPE7 and EA1 treatment. Scale bars are 5 μm.
Figure 4—figure supplement 2
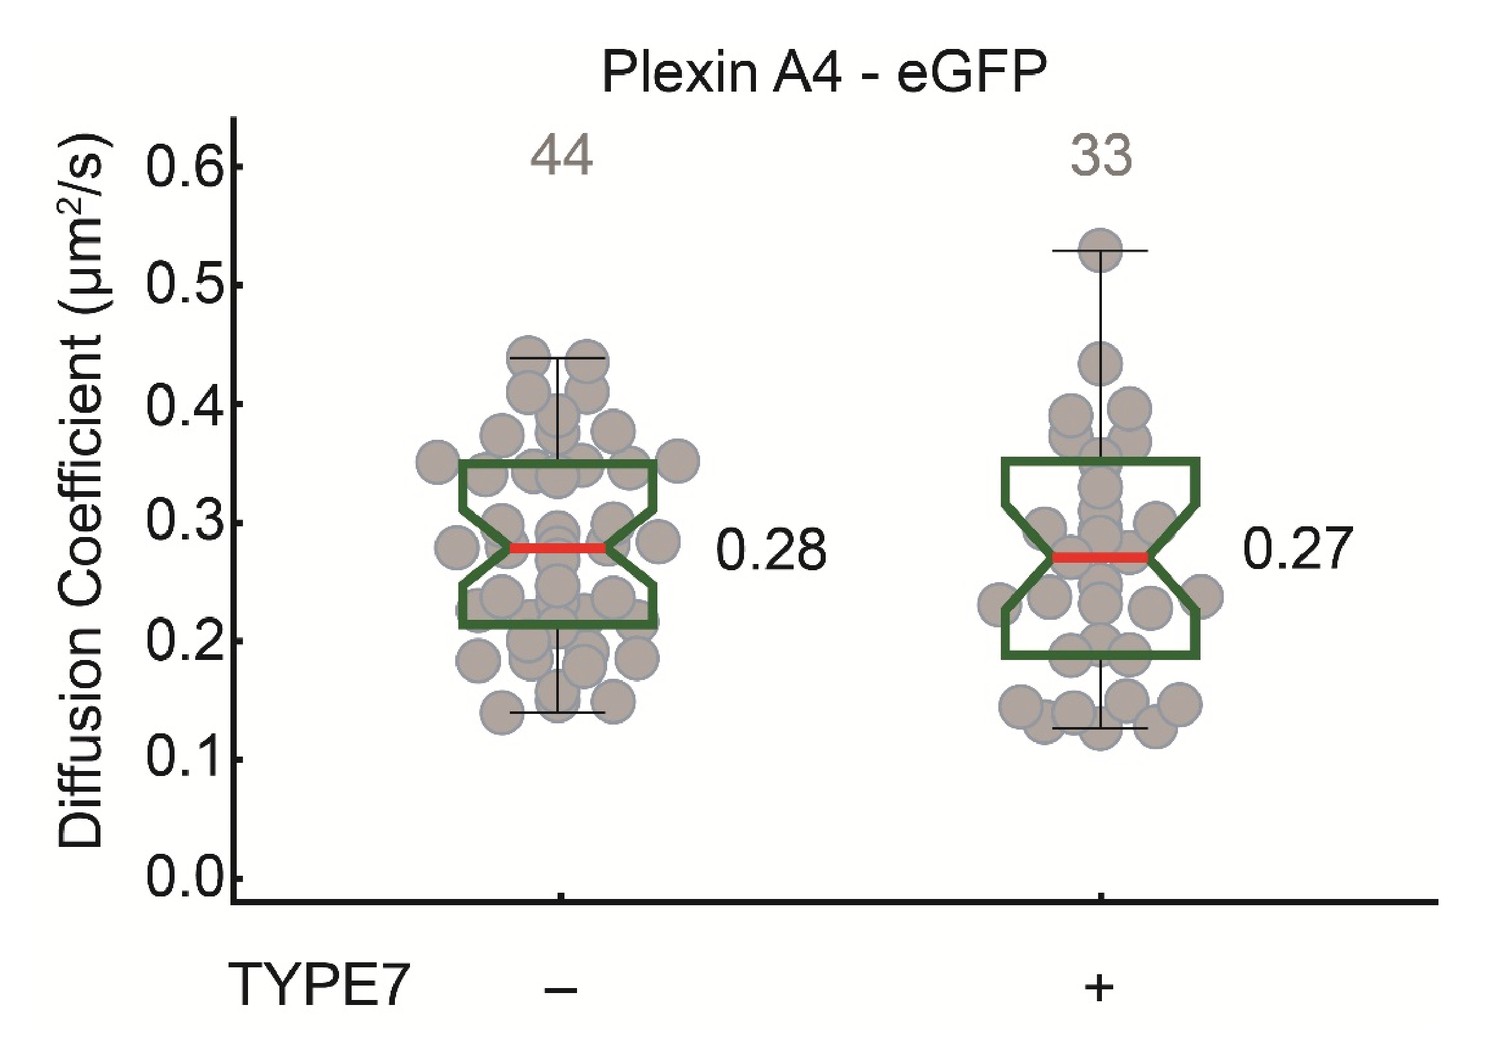
TYPE7 does not affect diffusion of PlexinA4, another single-pass transmembrane receptor.
Box-whisker plot of measurement of the FCS diffusion coefficient of Plexin A4-eGFP wild type in COS-7 cells before and after TYPE7 stimulation.
Figure 4—figure supplement 3

Human phospho-kinase array studies of TYPE7 specificity.
H358 cells were treated for 10 min with TYPE7 (2 μM) and the following controls: Fc (CT), EA1 (0.5 μg/mL) and pHLIP (2 μM). After treatment, cell lysates were incubated overnight with array membranes (R and D Systems ARY003B) for duplicated detection of phosphorylation of 43 total kinases (A) and their substrates (B). Myristoylated Src family kinases are boxed: top (Hck, Fyn and Src), middle (Yes and Lyn), and bottom (Lck). The pHLIP peptide was used as a control for specificity. The array contains the following proteins, in order from top to bottom, and then left to right: p38α, ERK1/2, JNK 1/2/3, GSK-3α/β, p53, EGFR, MSK1/2, AMPKα1, Akt, p53, TOR, CREB, HSP27, AMPKα2, β-Catenin, p70 S6 Kinase, p53, c-Jun, Src, Lyn, Lck, STAT2, STAT5a, p70 S6 Kinase, RSK1/2/3, eNOS, Fyn, Yes, Fgr, STAT6, STAT5b, STAT3, p27, PLC-g1, Hck, Chk-2, FAX, PDGFRb, STAT5a/b, STAT3, WNK1, PYK2, PRAS40 and HSP60. (C) Quantification of Akt phosphorylation (p–S473).
Figure 5

Cartoon depicting the different domains forming EphA2, which compares the activation mechanism of ephrinA1 (left) with the proposed TYPE7 mechanism (right), where the JMS is not phosphorylated and EphA2 assembles into smaller oligomers.
Figure is not to scale.
Additional files
-
Source data 1
- https://doi.org/10.7554/eLife.36645.019
-
Transparent reporting form
- https://doi.org/10.7554/eLife.36645.020
Download links
A two-part list of links to download the article, or parts of the article, in various formats.
Downloads (link to download the article as PDF)
Open citations (links to open the citations from this article in various online reference manager services)
Cite this article (links to download the citations from this article in formats compatible with various reference manager tools)
A novel pH-dependent membrane peptide that binds to EphA2 and inhibits cell migration
eLife 7:e36645.
https://doi.org/10.7554/eLife.36645


