H3.3K27M mutant proteins reprogram epigenome by sequestering the PRC2 complex to poised enhancers
- Irving Cancer Research Center, Columbia University, United States
- Mayo Clinic, United States
Figures
Figure 1 with 1 supplement
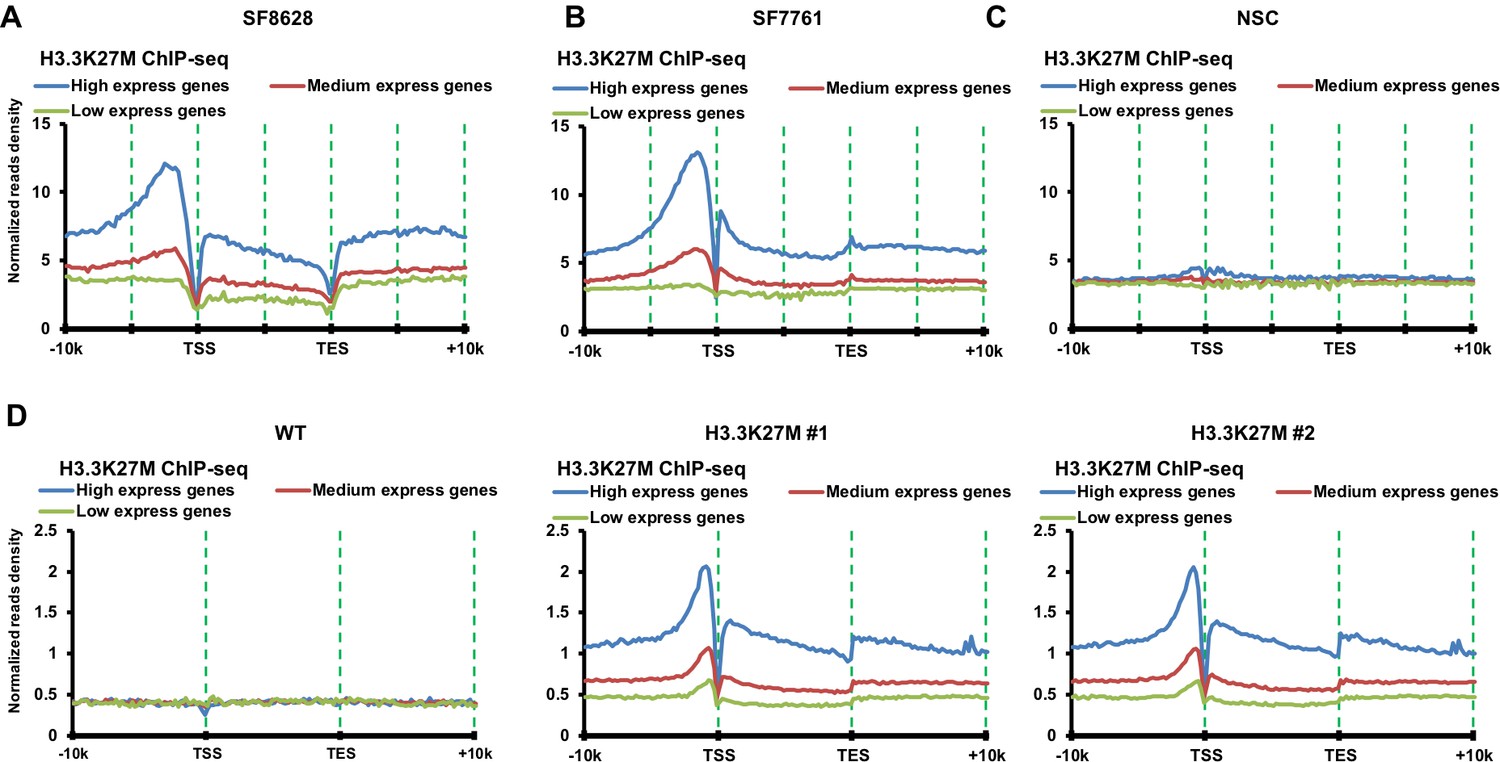
H3.3K27M mutant proteins are enriched at highly transcribed genes compared to lowly expressed genes in DIPG cells and mouse ES cells with H3.3K27M mutation.
(A–C) H3.3K27M mutant proteins are enriched at highly transcribed genes compared to lowly expressed genes in DIPG cells. The average read density of H3.3K27M ChIP-seq in two H3.3K27M mutant lines SF8628 (A) and SF7761 (B), and reference human neuro stem cells (NSC, C) with wild type H3.3 from 10 Kb upstream of TSS to 10 Kb downstream of TES is calculated. The read density was normalized to Reads Per Kilo-base per 10 million mapped reads. The entire human genes were split into three groups according to their expression levels in the corresponding cell lines: highest expressed genes, medium expressed genes, and low expressed genes. (D) H3.3K27M mutant proteins are enriched at highly transcribed genes compared to lowly expressed genes in mouse ES cells. The experiments were performed as described in (A). The entire mouse genes were split into three groups according to their expression levels in wild type mouse ES cells using mouse ES cell gene expression dataset at GEO (GSE8024): high express genes, medium express genes, and low express genes.
Figure 1—figure supplement 1
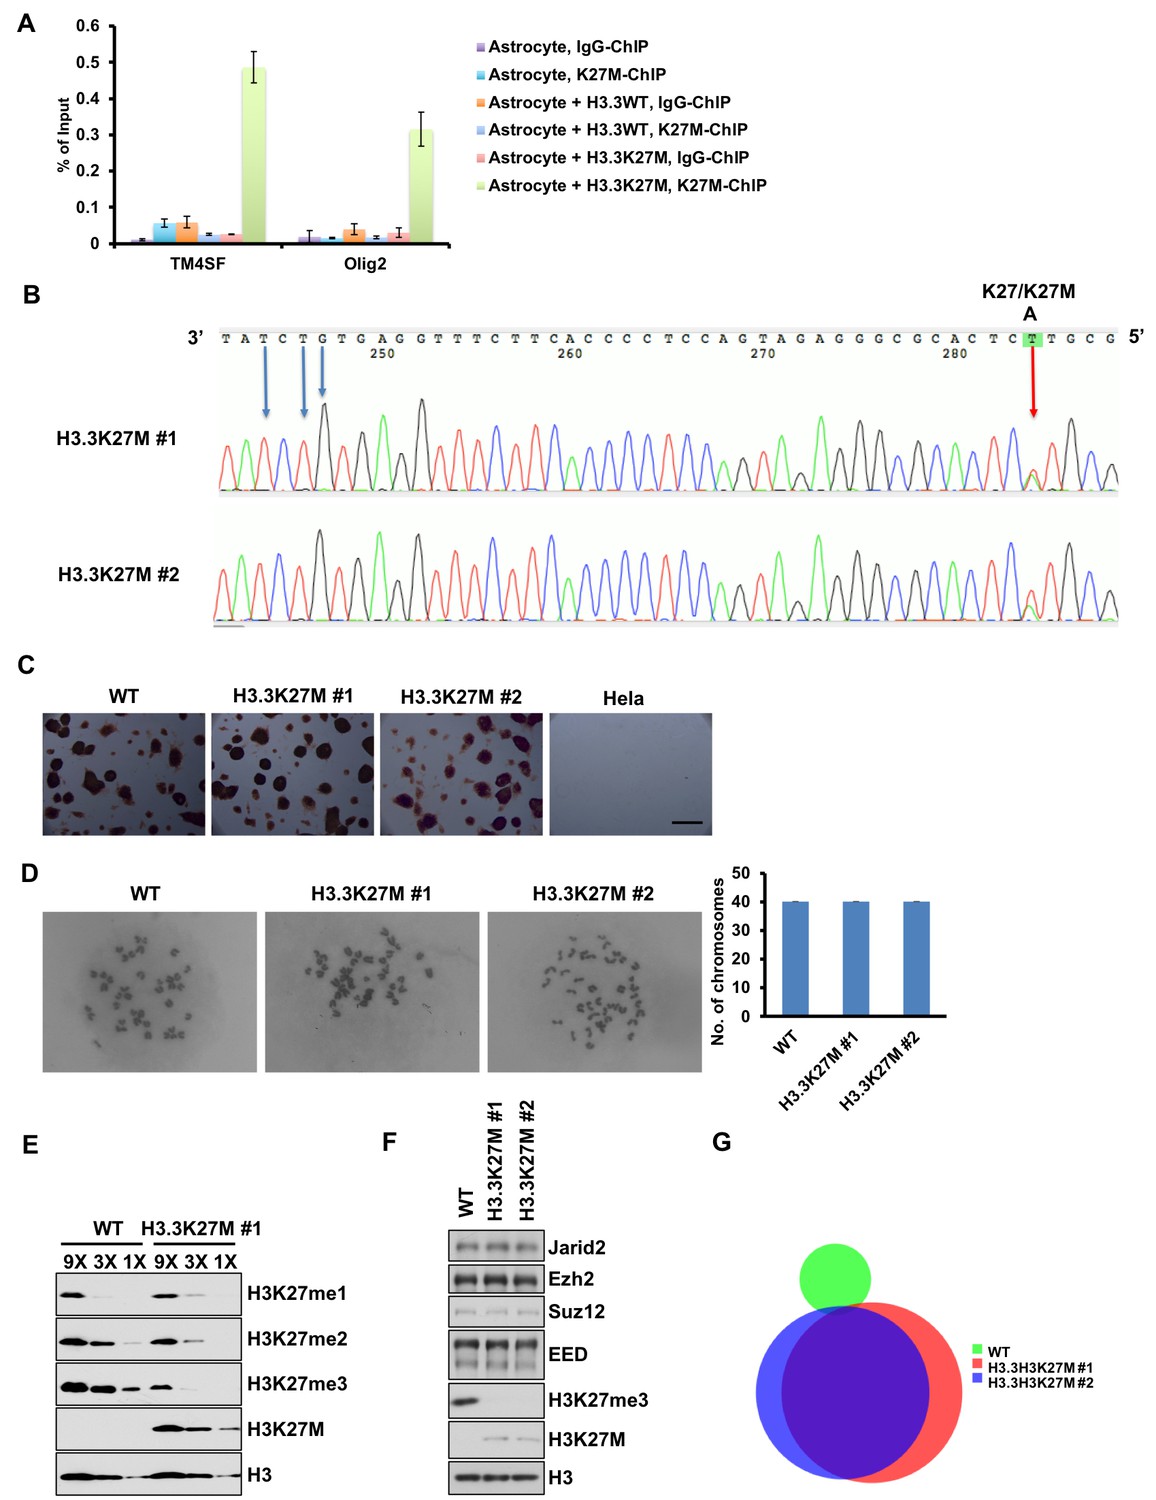
Site-specific mutation at the H3F3A gene, resulting in expression of the H3.3K27M proteins in mouse ES cells does not change cell identity.
(A) Antibodies against H3K27M are specific for ChIP analysis. ChIP assays were performed in three cell lines (astrocyte, astrocytes expressing wild type histone H3.3 (H3.3WT) and H3.3K27M mutant proteins (H3.3K27M)) using antibodies against H3K27M. IgG was used as control. The enrichments of H3.3K27M at TM4SF and Olig2 loci were analyzed by real-time PCR. Data are mean ± SD (N = 3 independent replicates). (B) One allele of the H3F3A gene is mutated in two independent mouse ES cell clones. The H3F3A gene locus was amplified by PCR from genomic DNA and then subjected to sanger sequencing. The red arrow indicates the K27M mutation site and blue arrows indicate the synonymous mutations that prevent cutting of donor DNA by the CRISPR/Cas9. The presence of A/T nucleotides indicates the heterozygous H3.3K27M mutations in both clones. (C) The H3.3K27M mutant ES cells show similar alkaline phosphatase staining. Representative images of alkaline phosphatase, which is expressed highly in ES cells but not in differentiated cells, staining of wild type (WT) and two H3.3K27M mutant clones. HeLa cells were used as negative controls. Bar, 200 µm. (D) The karyotypes of each of the two H3.3K27M mutant clones are normal. Representative images of chromosome spread results are shown in the left panel. Quantification results of chromosome numbers from 15 chromosome spread images are shown in the right panel. (E) H3K27me2/me3 is reduced in the H3.3K27M mutant cells. The levels of H3K27me1/me2/me3 in different amount of cell extracts prepared from WT and H3.3K27M mutant clone #1 were analyzed by Western blot. (F) PRC2 complexes show similar levels in wild type and H3.3K27M mutated mouse ES cells. WT mouse ES cells and two independent clones as in (B) were analyzed by Western blot using indicated antibodies. (G) Venn diagram illustration of H3.3K27M peaks in WT and two H3.3K27M mutant mouse ES cell lines.
Figure 2 with 1 supplement

Ezh2 is sequestered at poised enhancers with H3.3K27M mutant proteins.
(A) A large fraction of Ezh2 peaks unique in H3.3K27M mutant mouse ES cells was identified. The percentage of peaks (Y-axis) in each category (WT unique peaks, H3.3K27M unique peaks, and overlap peaks) of H3K27me3 and Ezh2 ChIP-seq (X-axis) is shown as indicated. The overlapped H3K27me3 and Ezh2 ChIP-seq peaks from two independent H3.3K27M mutant clones were used for the analysis. Peaks unique in WT: ChIP-seq peaks only identified in WT mouse ES cells but not in each of the two H3.3K27M clones. Peaks unique in H3.3K27M: the peaks are present in both H3.3K27M clones but not in WT mouse ES cells. Common peaks: the peaks present in both WT and two H3.3K27M clones. (B) The Integrative Genomics Viewer (IGV) tracks showing input, Ezh2, H3.3K27M, and H3K27me3 distributions of common Ezh2 peaks and Ezh2 peaks unique in H3.3K27M as in (A) in each of the two H3.3K27M mutant mouse ES clone. (C) Boxplot showing that H3.3K27M mutant proteins are low at common Ezh2 peaks compared to peaks unique in H3.3K27M. P value was calculated by two-tailed Student’s t test. (D) At the Ezh2 peaks unique to H3.3K27M mutant cells, H3K27me3 levels in H3.3K27M mutant cells are low compared to wild type cells. P value was calculated by two-tailed Student’s t test. (E) Heatmap showing genomic annotation of two groups of Ezh2 peaks. The common peaks: Ezh2 peaks present both in WT and H3.3K27M cells. H3.3K27M unique peaks: Ezh2 peaks only present in both two H3.3K27M clones. The peak number in each cluster (N) is indicated. Genomic annotation of each Ezh2 ChIP-seq peaks was performed by Perl (https://www.perl.org/). Black and white represents the presence and absence of the annotated element or histone marks, respectively. Promoter is defined as 2 Kb upstream and 1 Kb downstream of TSS. Bivalent promoters are downloaded from BGDB database (http://dailab.sysu.edu.cn/bgdb/). The histone mark and EP300 ChIP-seq datasets of mouse ES cells are from ENCODE (https://www.encodeproject.org/). (F–G) Ezh2 and H3.3K27M were enriched at the poised enhancers. Ezh2 (F) and H3.3K27M (G) ChIP-PCR results were shown. The enrichment of Ezh2 and H3.3K27M at three poised enhancers, labeled as enhancer 1 to 3, and one strong PRC2 site, Hoxa1, was analyzed by ChIP-PCR. Actin was used as the negative control for the Ezh2 ChIP and Hoxa1 was used as the negative control for the H3.3K27M ChIP. Data are mean ± SD (N = 3 independent replicates, *p<0.05, **p<0.01). (H) Heatmaps showing unsupervised clustering analysis of Ezh2 peaks for the overlap with H3.3K27M and H3K27me3 ChIP-seq in SF8628 as well as for their overlap with promoters, H3K4me1, H3K4me3 and H3K27me3 at NPCs. The histone ChIP-seq datasets for neuro precursor cells (NPC) are from ENCODE (https://www.encodeproject.org/).
-
Figure 2—source data 1
The source data to plot the bar chart in Figure 2A.
- https://doi.org/10.7554/eLife.36696.006
-
Figure 2—source data 2
The source data to plot the bar chart in Figure 2F.
- https://doi.org/10.7554/eLife.36696.007
Figure 2—figure supplement 1
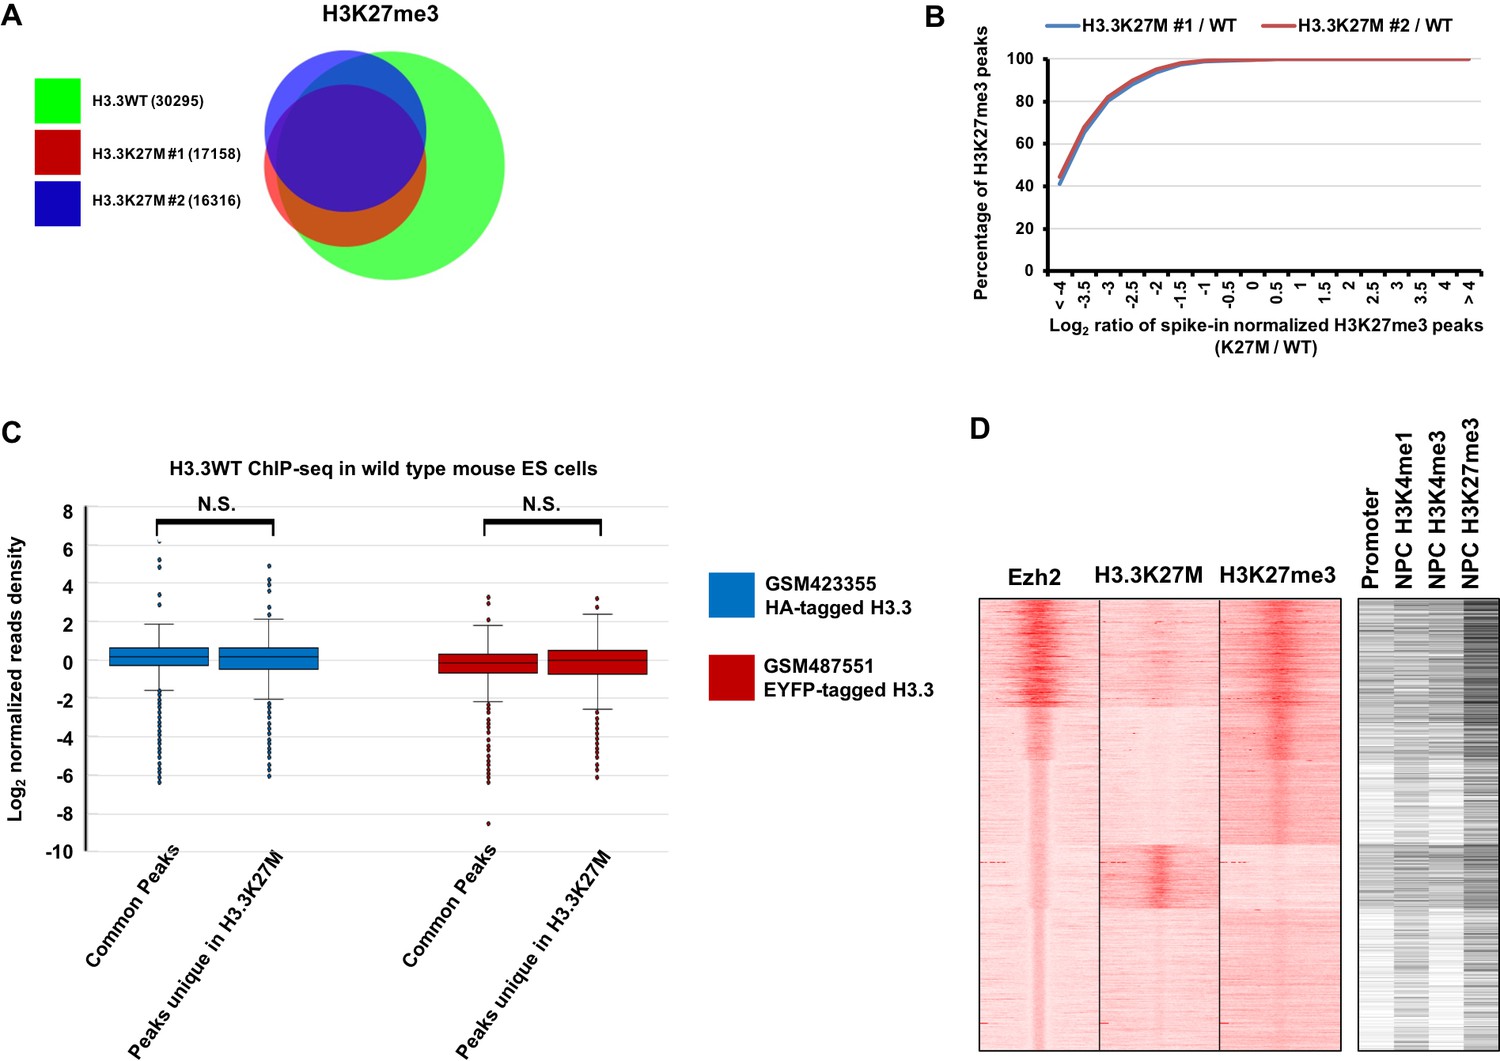
A large number of Ezh2 peaks uniques in H3.3K27M mutant mouse ES cells is identified.
(A) Venn diagram illustration of H3K27me3 peaks in the wild type (WT) and two H3.3K27M mutant mouse ES clones and their overlap. The number of peaks identified in each cell line was shown in the key. (B) Compared to WT mouse ES cells, H3K27me3 levels at all peaks in H3.3K27M mutant ES cells were reduced. H3K27me3 ChIP-seq was performed in WT and two H3.3K27M mutant clones spiked-in with chromatin from Drosophila. H3K27me3 peaks were identified and cumulative distribution analysis of the Log2 ratio of H3K27me3 levels between mutant and WT cells (K27M/WT) was shown (X-axis). The percentage of H3K27me3 peaks at each ratio was shown at the Y-axis. Note that the percentage of H3K27me3 peaks reaches 100 with a Log2 ratio of H3K27me3 levels (K27M/WT) less than 0, which indicates the levels of H3K27me3 at all H3K27me3 peaks identified in H3.3K27M mutant ES cells are reduced compared to WT mouse ES cells. (C) Boxplot showing that the enrichments of wild type H3.3 proteins at common Ezh2 peaks found in both WT and H3.3K27M mutant cells are similar to those at Ezh2 peaks unique to H3.3K27M mutant cells. The HA- and EYFP-tagged H3.3 ChIP-seq results were downloaded from GSM423355 and GSM487551, respectively and used for the analysis. P value was calculated by two-tailed Student’s t test. (D) Heatmap of the clustered Ezh2 peaks from Piunti et al. (Piunti et al., 2017) shows their corresponding H3.3K27M and H3K27me3 ChIP-seq signals in SF8628 cells. The analysis was performed as described in Figure 2H and the histone ChIP-seq datasets in NPC are from ENCODE (https://www.encodeproject.org/). The enrichment of H3.3K27M and H3K27me3 could be seen in some groups of genes, which is not seen in Figure 2H. This difference may be due, in part, to the fact that different antibodies were used in these two studies.
Figure 3 with 2 supplements
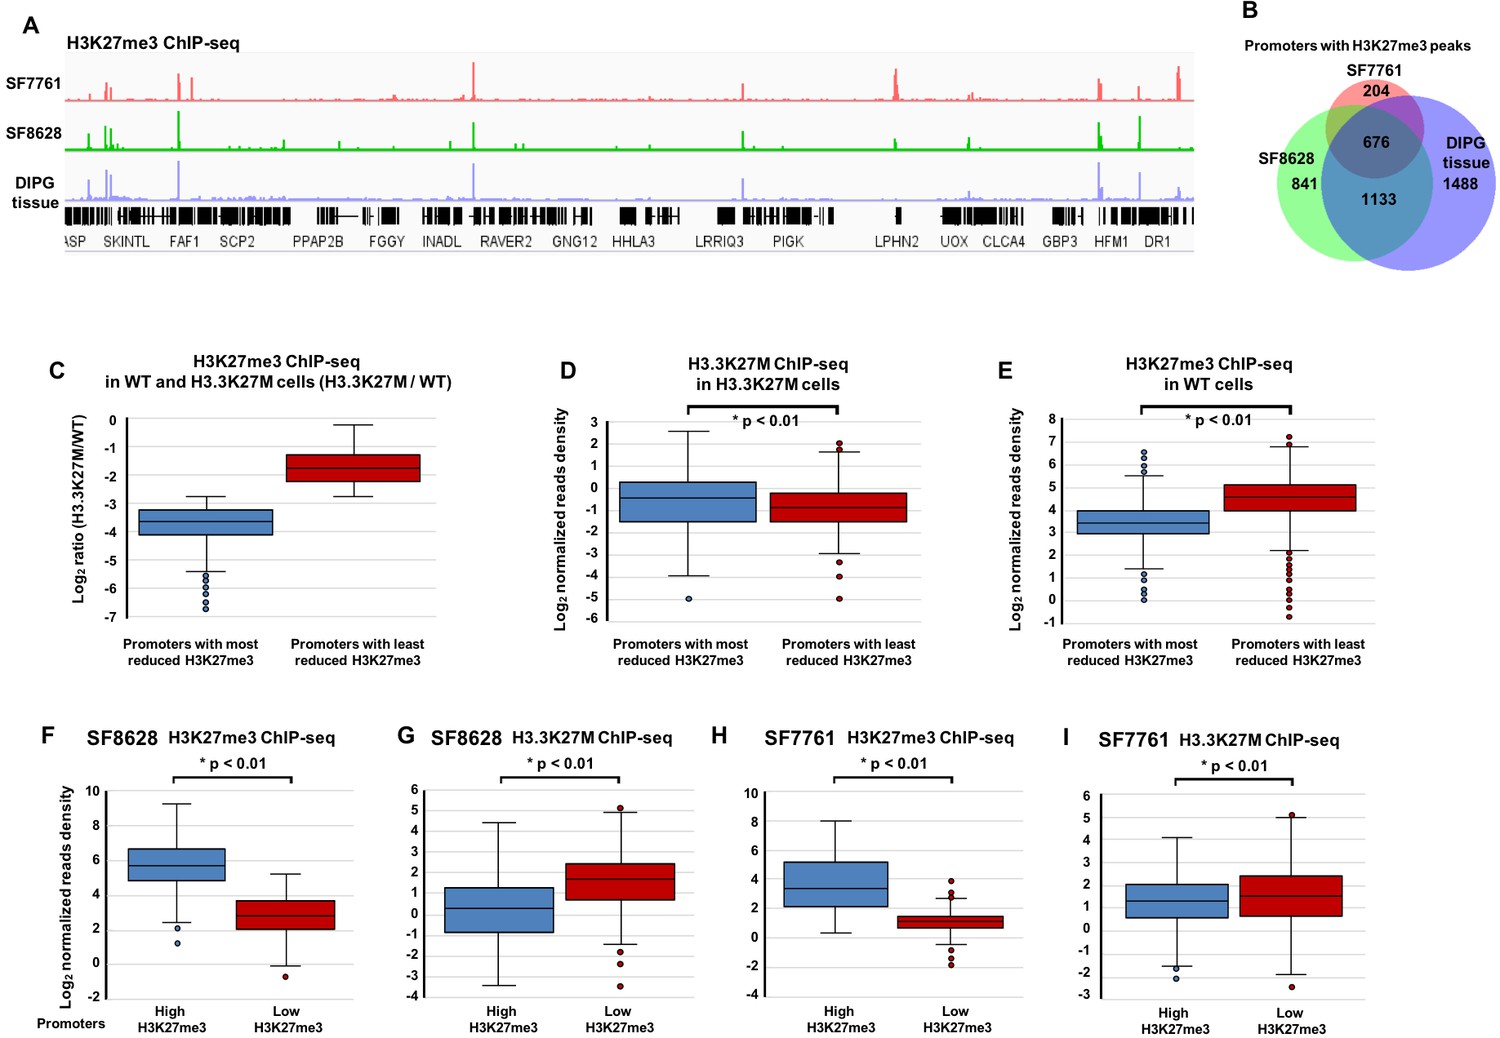
H3.3K27M levels on chromatin are low at gene promoters with H3K27me3.
(A) Representative Integrative Genomics Viewer shows the distribution of H3K27me3 in two DIPG cancer cell lines (SF7761 and SF8628) and one DIPG primary tissue. RefSeq genes are shown at the bottom. (B) Venn diagram illustration represents the promoters with H3K27me3 peaks among SF7761, SF8628, and DIPG tissue. (C–E) Boxplot showing that H3.3K27M mutant proteins at gene promoters with the least reduced H3K27me3 are low compared to those with the most reduced H3K27me3 in H3.3K27M mutant mouse ES cells. Base on the average ratio of H3K27me3 ChIP-seq read density in H3.3K27M cells (C), H3K27me3 peaks in H3.3K27M mutant cells were separated into two groups, the most and least reduced, used to calculate the average read density of H3.3K27M ChIP-seq (D), and the read density of H3K27me3 ChIP-seq in WT cells (E). P value was calculated by two-tailed Student’s t test. (F–I) The levels of H3K27me3 and H3.3K27M show an inverse-relationship in DIPG cells. 4195 and 3568 promoters with H3K27me3 ChIP-seq peaks were identified in ‘tumour-initiating cells’ for SF8628 and SF7761, respectively, before introducing the H3.3K27M mutation (see Figure 3—figure supplement 2 for details). Based on the average H3K27me3 ChIP-seq read density in either SF8628 or SF7761 line, these promoters were separated into two groups, promoters with the highest H3K27me3 and promoters with lowest H3K27me3 in each line and used to calculate H3K27me3 read density and H3.3K27M read density in each line independently. P value was calculated by two-tailed Student’s t test.
Figure 3—figure supplement 1
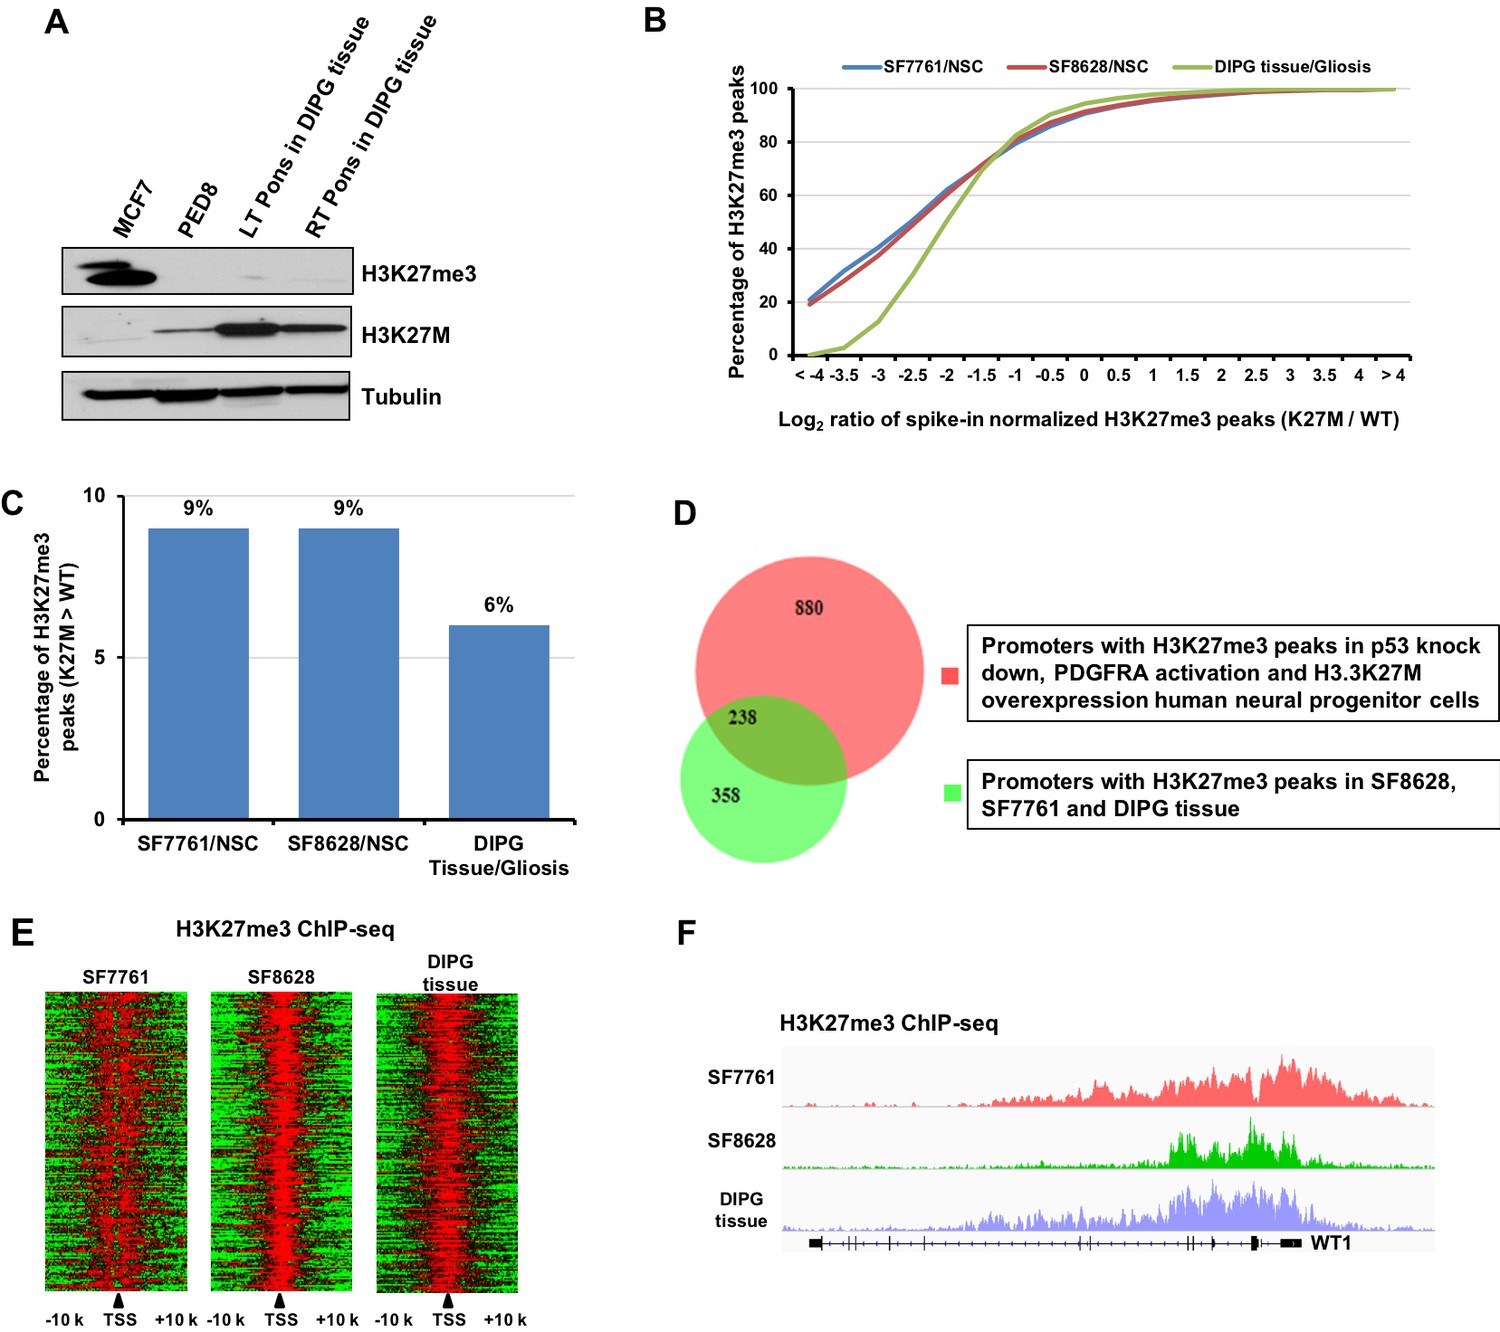
A small fraction of H3K27me3 peaks shows an equal or higher level of H3K27me3 in DIPG tumor cells than the corresponding reference cells.
(A) The level of H3K27me3 is reduced dramatically in H3.3K27M cell line PED8 and in two distinct regions of a DIPG primary tissue. Primary tissues from a patient autopsy sample were separated into left and right Pons. MCF7 cells (the breast cancer cells) were used as a negative control. H3K27M proteins were detected by Western blot using antibodies against H3K27M. (B) Compared to the reference human NSC or H3 wild type control gliosis tissue, a fraction of H3K27me3 peaks exhibits an increased level of H3K27me3 while most others are reduced in DIPG cells and primary DIPG tissues. H3K27me3 ChIP-seq was performed in cell lines (SF7761, SF8628, and NSC) and tissues (gliosis and DIPG tissue) with spiked-in chromatin from Drosophila or sf9 cells. H3K27me3 peaks were identified and cumulative distribution analysis of the Log2 ratio of the H3K27me3 levels between DIPG cells and the reference NSC or between the DIPG tissue and gliosis tissue was shown (X-axis). (C) The percentage of H3K27me3 peaks that had higher H3K27me3 levels in H3.3K27M DIPG cells or tissue than the corresponding reference cells was shown. (D) Venn diagram illustration of genes with H3K27me3 peaks obtained through the transformation of human NPCs by p53 knockdown, expression of PDGFRA mutation and H3.3K27M as well as those identified from SF8628, SF7761 and DIPG tissues. The H3K27me3 ChIP-seq dataset in NPCs was from Funato et al. (Funato et al., 2014). The gene promoters with H3K27me3 peaks in all of SF8628, SF7761 and DIPG tissues were used for comparison. (E) Heatmaps represent the signal of H3K27me3 from 10 Kb up- to 10 Kb down-stream of TSS of 676 genes identified in Figure 3B. (F) A genome browser track example for the H3K27me3 occupancy at Wilms Tumor 1 (WT1) locus in the two DIPG line and tissue.
Figure 3—figure supplement 2
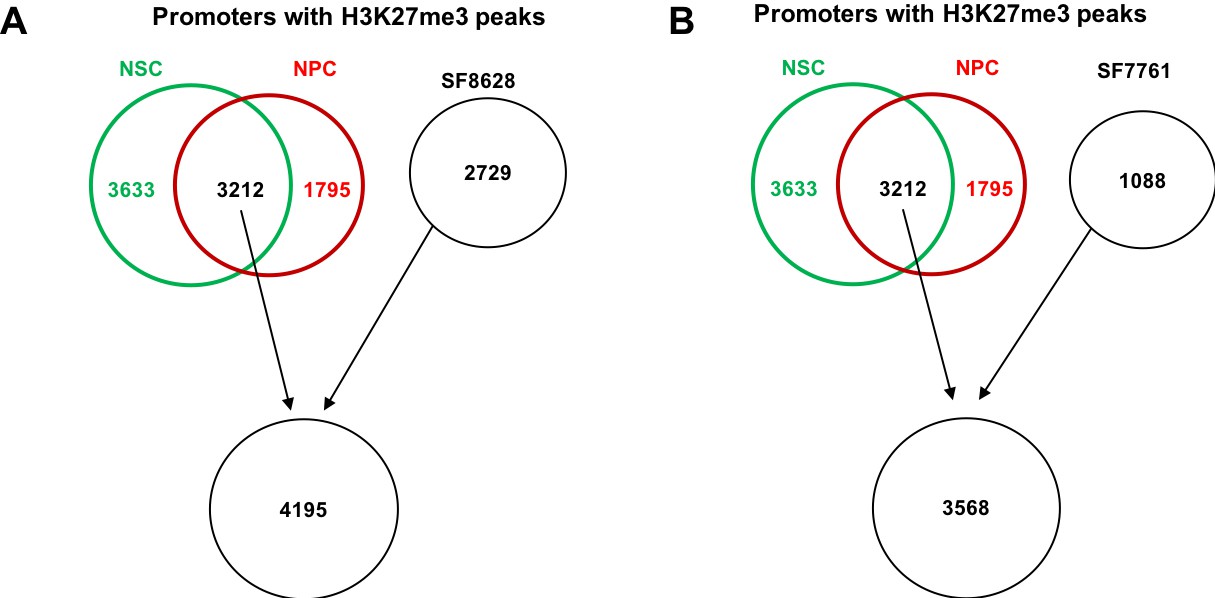
In silico identification of H3K27me3 peaks at tumor-initiating cells of SF8628 and SF7761.
The diagram shows how gene promoters with H3K27me3 were identified in tumor-initiating cells of SF8628 (A) and SF7761 (B). Based on the average level of H3K27me3 at these gene promoters, gene promoters were separated into two groups, those with high levels of H3K27me3 and those with low levels of H3K27me3 in each cell line. The enrichment of H3K27me3 and H3.3K27M mutant proteins in each H3.3K27M mutant line at these two group of gene promoters was calculated as shown in Figure 3F–3I. The promoters with H3K27me3 ChIP-seq peaks overlapped in both control cells (NSC and NPC) were chosen to potentially increase the stringency of peak identification.
Figure 4 with 1 supplement
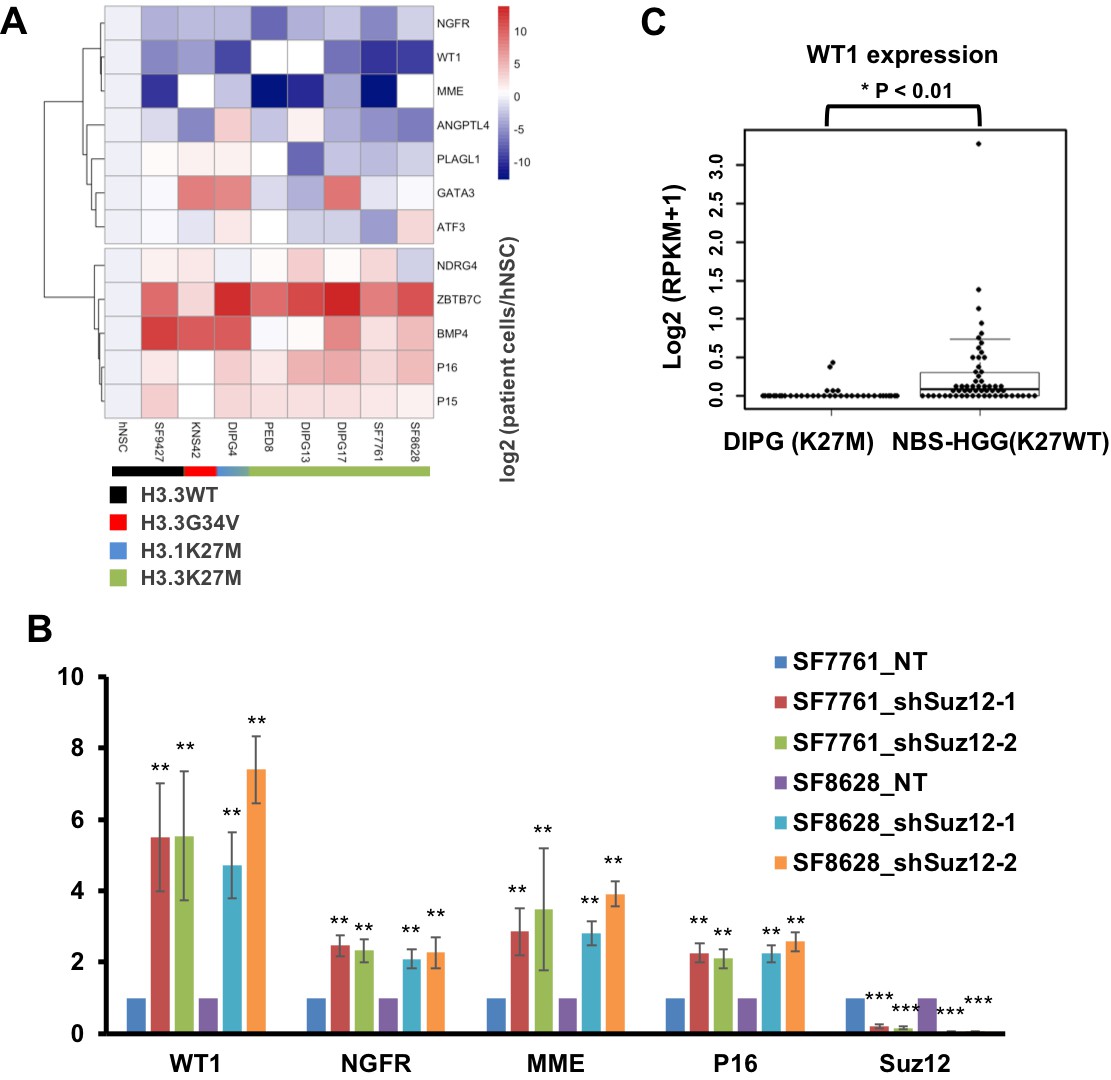
Several TSGs including WT1 are silenced through H3K27me3-mediated mechanism in DIPG cells with H3.3K27M mutation.
(A) Analysis of expression levels of 12 different tumor suppressor genes (TSGs) in different DIPG lines and human NSC. Expressions of 12 different TSGs in tumor lines, with the mutation status of histone H3 shown at the bottom, were analyzed by quantitative RT-PCR and clustered hierarchically. Data are mean (N = 3 independent replicates). (B) Depletion of Suz12 increases the expression of WT1 in DIPG lines. The expression levels of three most silenced TSGs as well as p16 were analyzed in two H3.3K27M mutant tumor cells (SF7761 and SF8628) after depletion of Suz12. Data are mean ± SD (N = 3 independent replicates, **p<0.01). (C) Box plot of gene expression levels of WT1 in DIPG with H3.3K27M (n = 37) and non-brainstem pediatric high-grade glioma (NBS-HGG) with wild type H3.3 (n = 58) tumor tissues (Wu et al., 2014). P value was calculated by two-tailed Student’s t test.
-
Figure 4—source data 1
The source data to plot the bar chart in Figure 4B.
- https://doi.org/10.7554/eLife.36696.013
Figure 4—figure supplement 1
H3K27me3 and Ezh2 are enriched at the promoters of TSGs in DIPG cells.
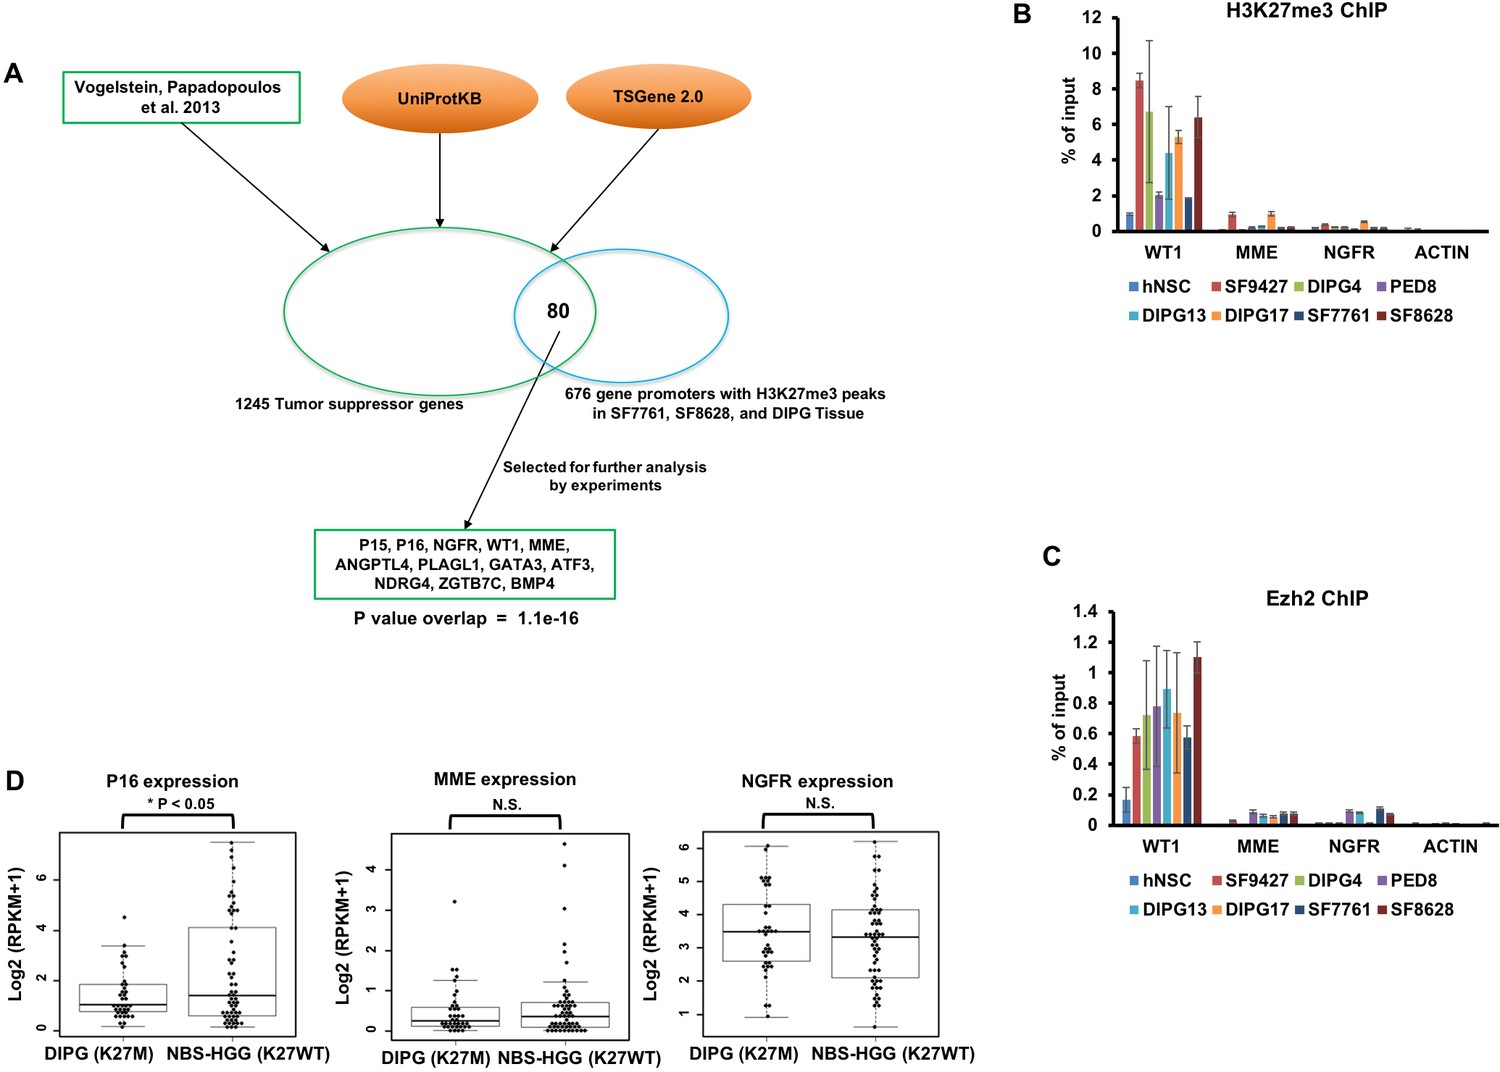
(A) A diagram shows how the candidate TSGs were identified. Combining TSGs listed in three datasets, 1,245 TSGs were identified. Based on H3K27me3 ChIP-seq in two DIPG cell lines (SF7761, SF8628) and one DIPG tissue, 676 gene promoters with H3K27me3 peaks in all three samples were identified, of which 80 are TSGs. The p value for the overlap was calculated by Fisher’s test. (B and C) H3K27me3 and Ezh2 were enriched at the WT1 promoter in multiple tumor lines. H3K27me3 (B) and Ezh2 (C) ChIP-PCR results were shown. hNSC: human neural stem cells. SF9427: a high grade glioma cell line with wild type H3.3. DIPG4 is a DIPG line with the H3.1K27M mutation, and PED8, DIPG13, DIPG17, SF7761 and SF8628 are DIPG cell lines with H3.3K27M mutation (See Supplementary file 1). Data are mean ± SD (N = 2 independent replicates). (D) Box plot of gene expression levels of p16, MME and NGFR in DIPG with H3.3K27M (n = 37) and non-brainstem pediatric high-grade glioma (NBS-HGGs) with wild type H3.3 (K27WT, n = 58). The RNA-seq datasets of these tumor tissues are from public datasets (Wu et al., 2014). P value was calculated by two-tailed Student’s t test. N.S., Not Significant.
Figure 5 with 1 supplement
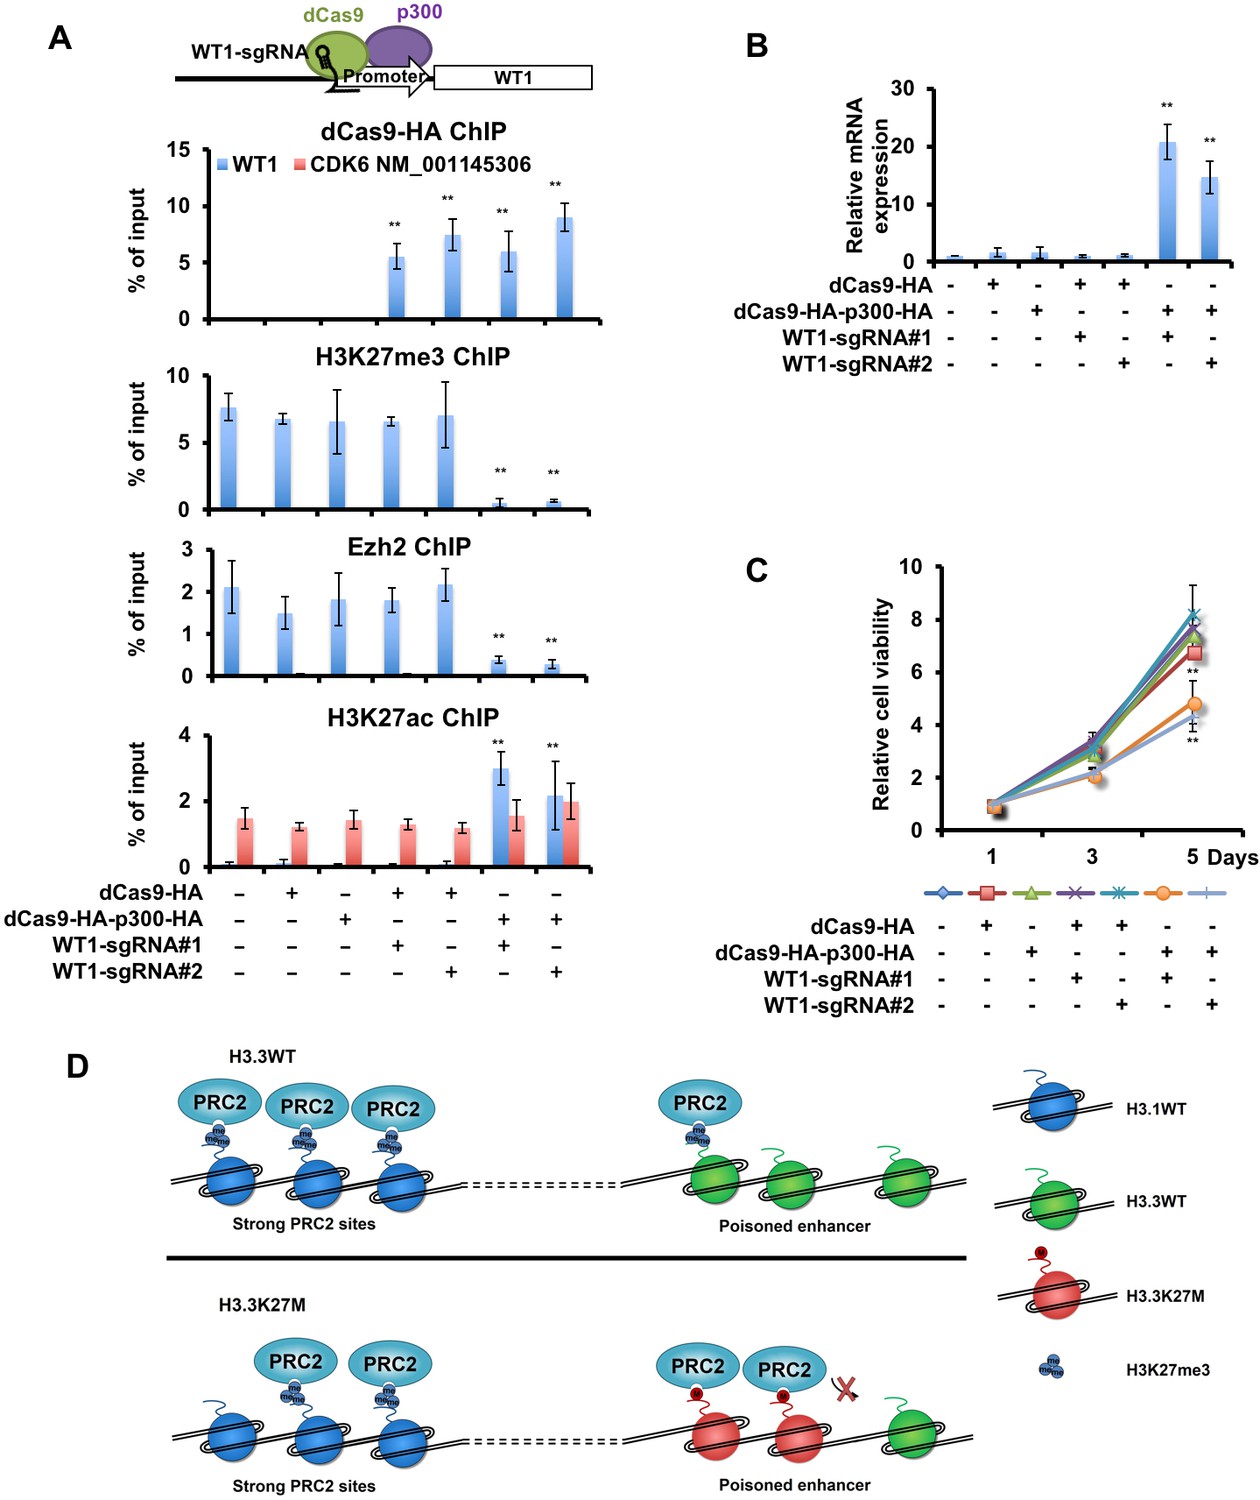
An increase in WT1 expression inhibits the proliferation of H3.3K27M mutant cells.
(A) Targeting p300 to the WT1 promoter results in an increase in H3K27ac and a reduction of H3K27me3. Top: a schematic strategy for targeting dCas9-HA-p300-HA fusion proteins to the promoter of WT1. ChIP-PCR analysis of dCas9-HA and dCas9-HA-p300-HA fusion proteins (first panel), H3K27me3 (second panel), Ezh2 (third panel), and H3K27ac (last panel) at the promoter of WT1 was performed using SF8628 cells transfected with indicated combinations of dCas9-HA, dCas9-HA-p300-HA and two different sgRNAs targeting to the WT1 promoter. Data are mean ± SD (N = 3 independent replicates, **p<0.01). (B) The expression of WT1 increases after targeting dCas9-HA-p300-HA to the WT1 promoter. The expression of WT1 was analyzed by quantitative RT-PCR. Data are mean ± SD (N = 3 independent replicates, **p<0.01). (C) SF8628 cell proliferation is inhibited by targeting dCas9-HA-p300-HA to the WT1 promoter. Data are mean ± SD (N = 3 independent replicates, **p<0.01). (D) A model for reduction and retention of H3K27me3 in cells with H3.3K27M mutation. In wild type cells, the PRC2 complex co-localizes with H3K27me3 peaks at the major PRC2 sites. Since these genes are silenced, the levels of H3.3 are low. Poised enhancers contain low levels of H3K27me3, PRC2 complex and H3.3. In H3.3K27M mutant cells, the PRC2 complexes, once recruited to the poised enhancers, are trapped there, likely due to higher concentration of H3.3K27M mutant proteins at poised enhancers. This will lead to a reduction of the PRC2 complex at strong PRC2 sites and a global reduction of H3K27me3. However, the amount of H3.3K27M mutant proteins at major PRC2 sites are low and thus having limited effect on the ability of the PRC2 complex, which is at reduced levels compared to wild type cells, to methylate H3K27.
-
Figure 5—source data 1
The source data to plot the bar chart in Figure 5A.
- https://doi.org/10.7554/eLife.36696.016
-
Figure 5—source data 2
The source data to plot the bar chart in Figure 5B.
- https://doi.org/10.7554/eLife.36696.017
-
Figure 5—source data 3
The source data to plot the bar chart in Figure 5C.
- https://doi.org/10.7554/eLife.36696.018
Figure 5—figure supplement 1
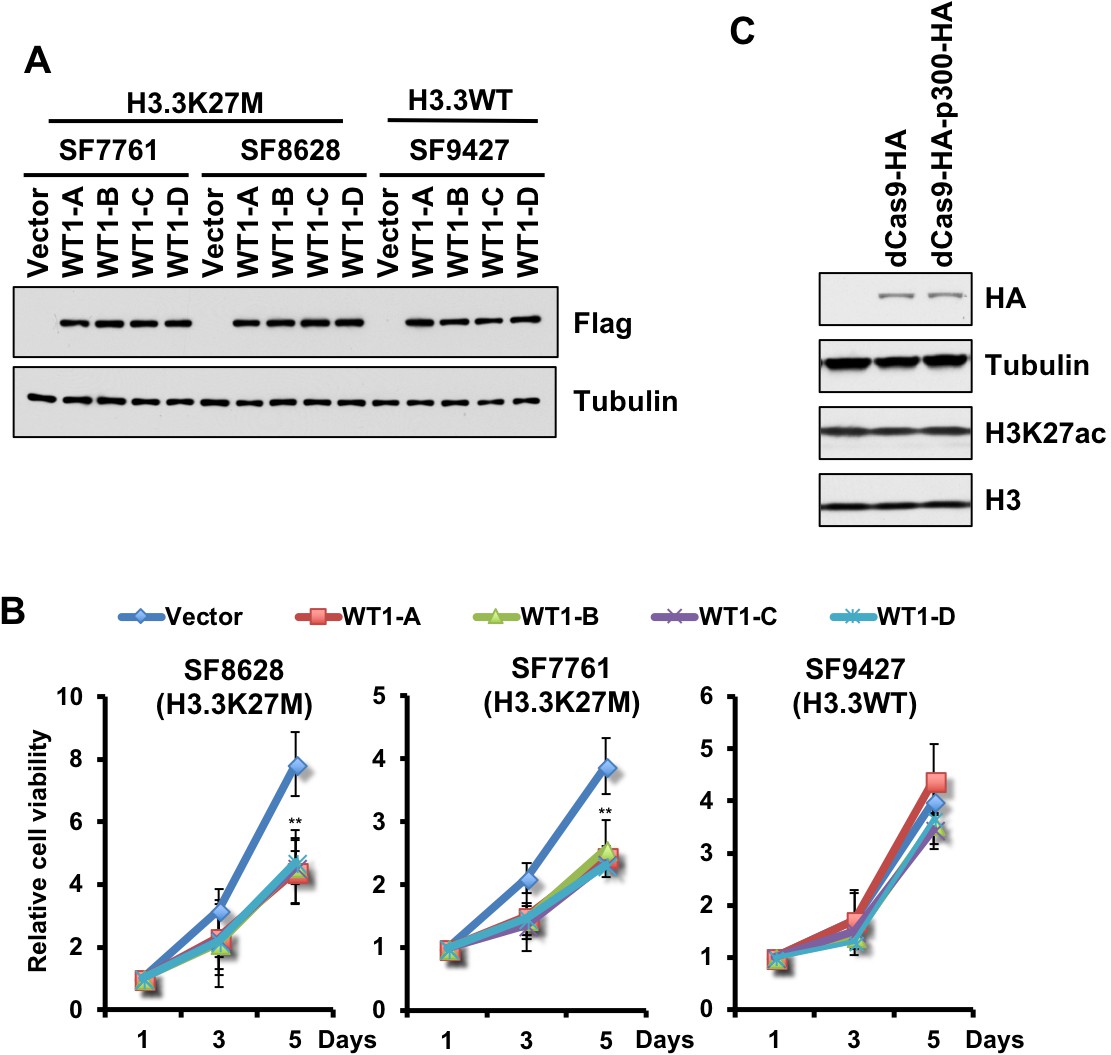
Forced expression of WT1 inhibits the proliferation of DIPG cells with H3.3K27M mutation.
(A–B) Cell proliferations of two DIPG cell lines were inhibited by overexpression of different WT1 isoforms. The expression of different Flag-tagged WT1 isoforms in two DIPG lines (SF7761 and SF8628) and one tumor line with wild type H3.3 (SF9427) was analyzed by Western blot using the indicated antibodies (A). Cell proliferation at different days of WT1 expression was monitored by cell titer-blue assay (B). Data are mean ± SD (N = 3 independent replicates, **p<0.01). (C) Expression of dCas9-HA and dCas9-HA-p300-HA does not affect the total level of H3K27ac in cells. dCas9-HA and dCas9-HA-p300-HA were over-expressed in SF8628 cells and total levels of H3K27ac in whole cell extracts were analyzed by Western blot.
Tables
Key resources table
| Reagent type (species) or resource | Designation | Source or reference | Identifiers | Additional information |
|---|---|---|---|---|
| Cell line (H. sapiens) | SF7761 | PMID: 23603901 | RRID:CVCL_IT45 | Growth in neural stem cell media as neurosphere |
| Cell line (H. sapiens) | SF8628 | PMID: 25401693 | RRID:CVCL_IT46 | Growth in DMEM as monolayer |
| Cell line (H. sapiens) | KNS42 | PMID: 25401693 | RRID:CVCL_0378 | Growth in DMEM as monolayer |
| Cell line (H. sapiens) | SF9427 | PMID: 25401693 | Growth in DMEM as monolayer | |
| Cell line (H. sapiens) | PED8 | PMID: 26376656 | Growth in neural stem cell media as neurosphere | |
| Antibody | H3K27me3 | Cell Signaling | C36B11, RRID:AB_2616019 | 1.4 µg for ChIP, 1:1000 for Western blot |
| Antibody | Ezh2 | Cell Signaling | 5246, RRID:AB_10694683 | 5 µg for ChIP, 1:1000 for Western blot |
| Antibody | Suz12 | Cell Signaling | 3737S, RRID:AB_2196850 | 1:1000 for Western blot |
| Antibody | H3K27ac | Abcam | ab4729, RRID:AB_2118291 | 2 µg for ChIP, 1:1000 for Western blot |
| Antibody | H3K4me1 | Abcam | ab8895, RRID:AB_306847 | 2 µg for ChIP, 1:1000 for Western blot |
| Antibody | α-Tubulin | Sigma | T9026, RRID:AB_477593 | 1:1000 for Western blot |
| Antibody | FLAG | Sigma | F1804, RRID:AB_262044 | 2 µg for ChIP, 1:1000 for Western blot |
| Antibody | H3K27M | Millipore | ABE419, RRID:AB_2728728 | 2 µg for ChIP, 1:1000 for Western blot |
| Antibody | HA | This study | 12CA5 | 2 µg for ChIP, 1:1000 for Western blot |
| Antibody | H3 | PMID: 23603901 | 1:10000 for Western blot | |
| Commercial assay or kit | SuperScript III First-Strand kit | Invitrogen | 18080–051 | |
| Commercial assay or kit | RNeasy Mini Kit | Qiagen | 74104 | |
| Commercial assay or kit | QiaQuick PCR purification kit | Qiagen | 28104 | |
| Commercial assay or kit | ssoAdvanced Universal SYBR Green Supermix | Bio-Rad | 1725274 | |
| Commercial assay or kit | cell titer blue assay kit | Promega | G8081 | |
| Software, algorithm | Bowtie2 | PMID: 22388286 | RRID:SCR_005476 | |
| Software, algorithm | MACS2 | PMID: 18798982 | RRID:SCR_013291 | |
| Software, algorithm | Bedtools | PMID: 20110278 | RRID:SCR_006646 |
Additional files
-
Supplementary file 1
Tables of cell lines, tissues and oligonucleotides used.
- https://doi.org/10.7554/eLife.36696.019
-
Transparent reporting form
- https://doi.org/10.7554/eLife.36696.020
Download links
A two-part list of links to download the article, or parts of the article, in various formats.
Downloads (link to download the article as PDF)
Open citations (links to open the citations from this article in various online reference manager services)
Cite this article (links to download the citations from this article in formats compatible with various reference manager tools)
H3.3K27M mutant proteins reprogram epigenome by sequestering the PRC2 complex to poised enhancers
eLife 7:e36696.
https://doi.org/10.7554/eLife.36696


