The adipocyte hormone leptin sets the emergence of hippocampal inhibition in mice
- Aix-Marseille University UMR 1249, INSERM (Institut National de la Santé et de la Recherche Médicale) Unité 1249, INMED (Institut de Neurobiologie de la Méditerranée), France
- Plateforme Post-Génomique, INMED, France
- Washington State University, United States
- University of Exeter Medical School, United Kingdom
Figures
Figure 1 with 3 supplements
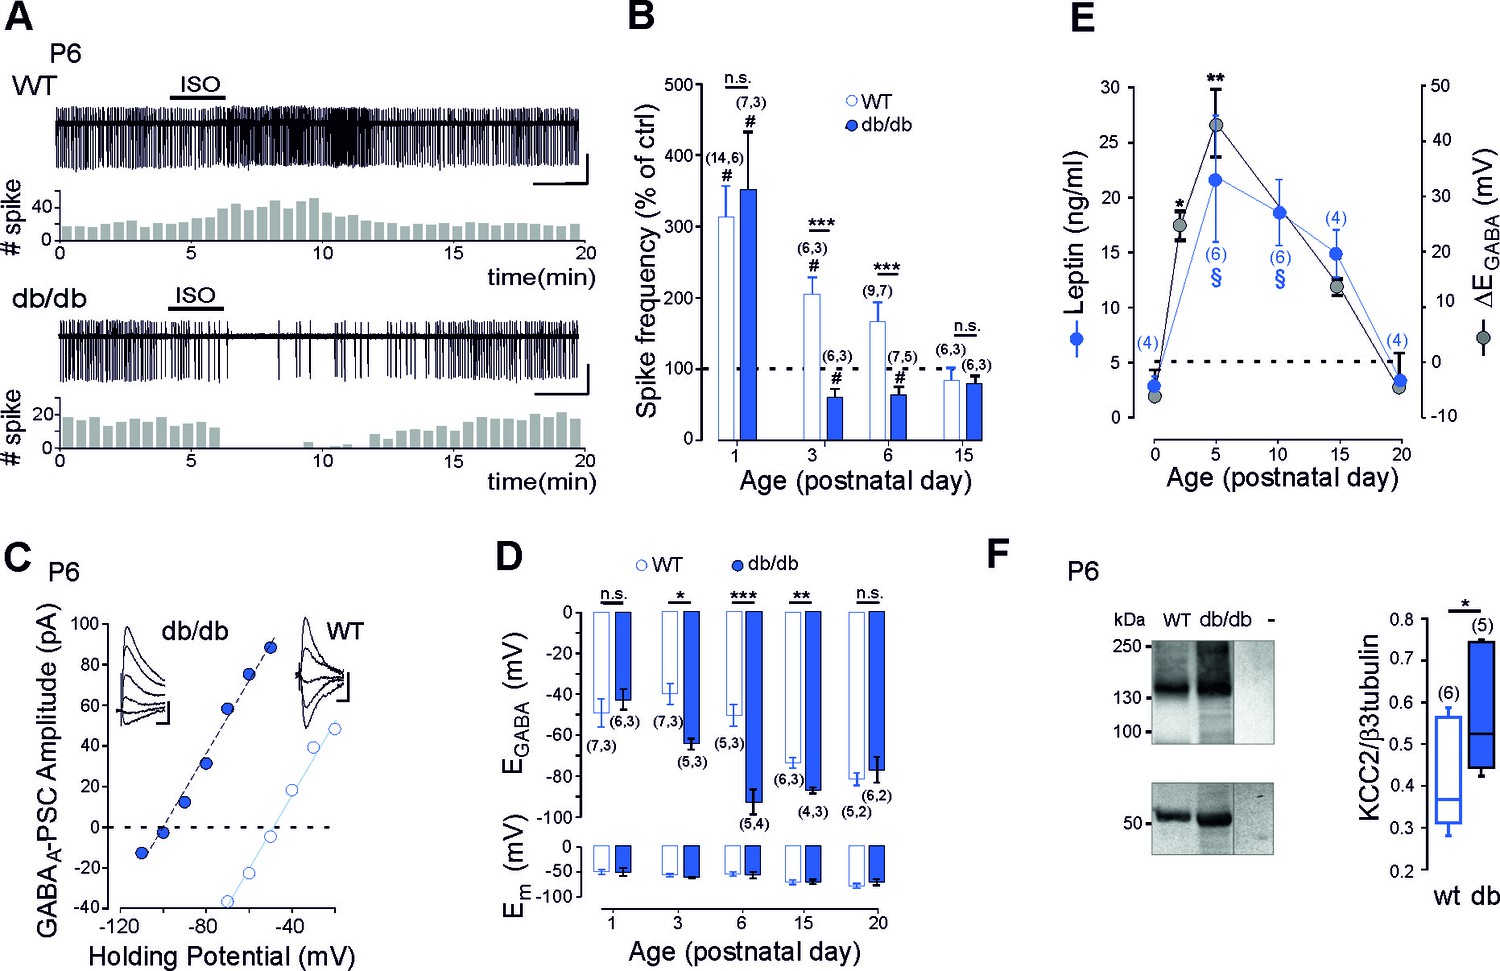
Early GABA developmental sequence in leptin-receptor deficient mice.
(A) Cell attached recordings of CA3 pyramidal neurons on acute hippocampal slices. Scale bar, 2 min, 50 pA. Corresponding time course of spike frequency changes are shown under each trace. (B) Developmental changes of isoguvacine action on spike activity. Mean ± SEM. (C) Current-voltage relationships for evoked GABAergic synaptic currents. Insets: examples of GABAergic synaptic current evoked at holding potentials ranging from −110 to −60 mV (10 mV increment) in db/db and from −70 to −30 (10 mV increment) in wt CA3 pyramidal neuron. Scale bar, 10 ms, 20 pA. (D) Developmental changes in EGABA and Em at zero current. Mean ± SEM. In B and D, the number of cells recorded and number of mice used are indicated in parenthesis; #p<0.05 when compared to pre-isoguvacine values, two-tailed paired Student’s t-test, *p<0.05, **p<0.01 and ***p<0.001 when compared to age-matched wt, two-tailed unpaired Student’s t-test. (E) Developmental profile of plasma leptin levels in the wt (blue circle) and developmental profile of ΔEGABA (gray circle). ΔEGABA was calculated as the difference in EGABA values between the wt and db/db at each developmental stage depicted in D. Numbers in parenthesis indicate the number of mice used. Mean +SEM. §p<0.05 when compared to P0 plasma leptin values, *p<0.05 and **p<0.01 when compared to P0 ΔEGABA values, one way ANOVA followed by a Tukey’s post hoc test. (F) Left: representative immuno-blots for hippocampal panKCC2 and β3-tubulin in wt and db/db mice (first two lanes). The third lane (-) illustrates background (empty well). Right: box plots of normalized pan KCC2 in P6 wt and db/db hippocampi. Numbers in parenthesis indicate the number of mice used. *p<0.05, two-tailed unpaired Student’s t-test.
-
Figure 1—source data 1
Advanced onset of GABA inhibition in leptine receptor deficient mice.
- https://doi.org/10.7554/eLife.36726.007
Figure 1—figure supplement 1
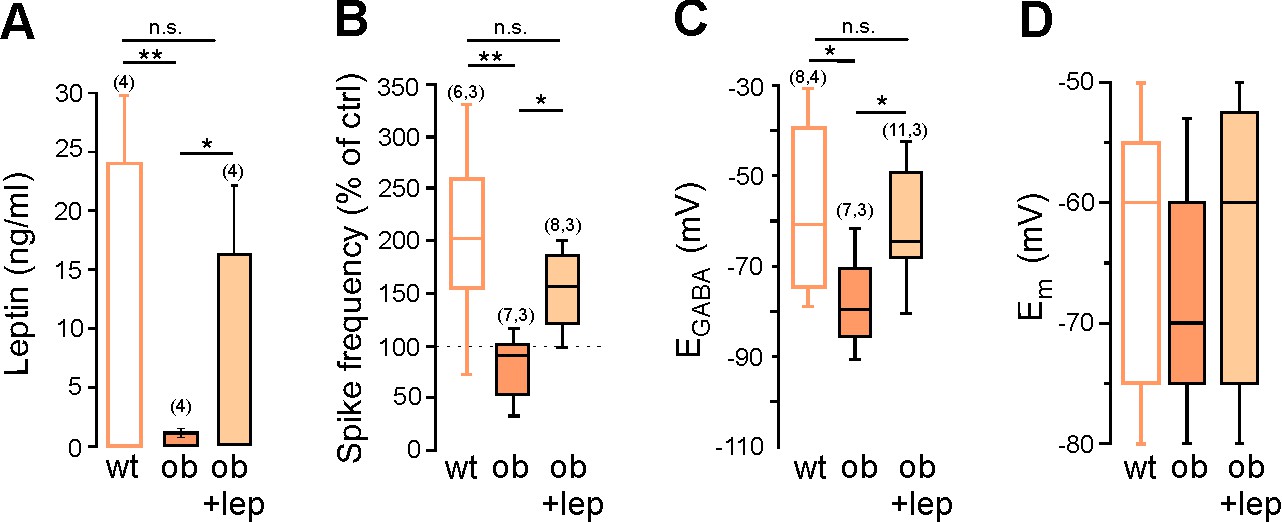
Leptin controls GABA signaling in the mice hippocampus in vivo.
(A) Plasma leptin levels in P8 wt, ob/ob and leptin-treated ob/ob mice (ob +lep, 5 mg/kg twice a day sub-cutaneous from P3 to P8, n = 4, blood samples were collected 30 min after the last injection). (B) Box plot of isoguvacine action on spike frequency in wt mice, ob/ and leptin-treated ob/ob mice at P8. (C,D) Box plots of EGABA and Em at zero current in 4 wt mice, ob/ob and leptin-treated ob/ob CA3 pyramidal neurons. The cells recorded and number of animal used are indicated in parenthesis *p<0.05, **p<0.01, one way ANOVA followed by a Tukey’s post hoc test.
-
Figure 1—figure supplement 1—source data 1
Advanced onset of GABA inhibition in leptine deficient mice.
- https://doi.org/10.7554/eLife.36726.004
Figure 1—figure supplement 2
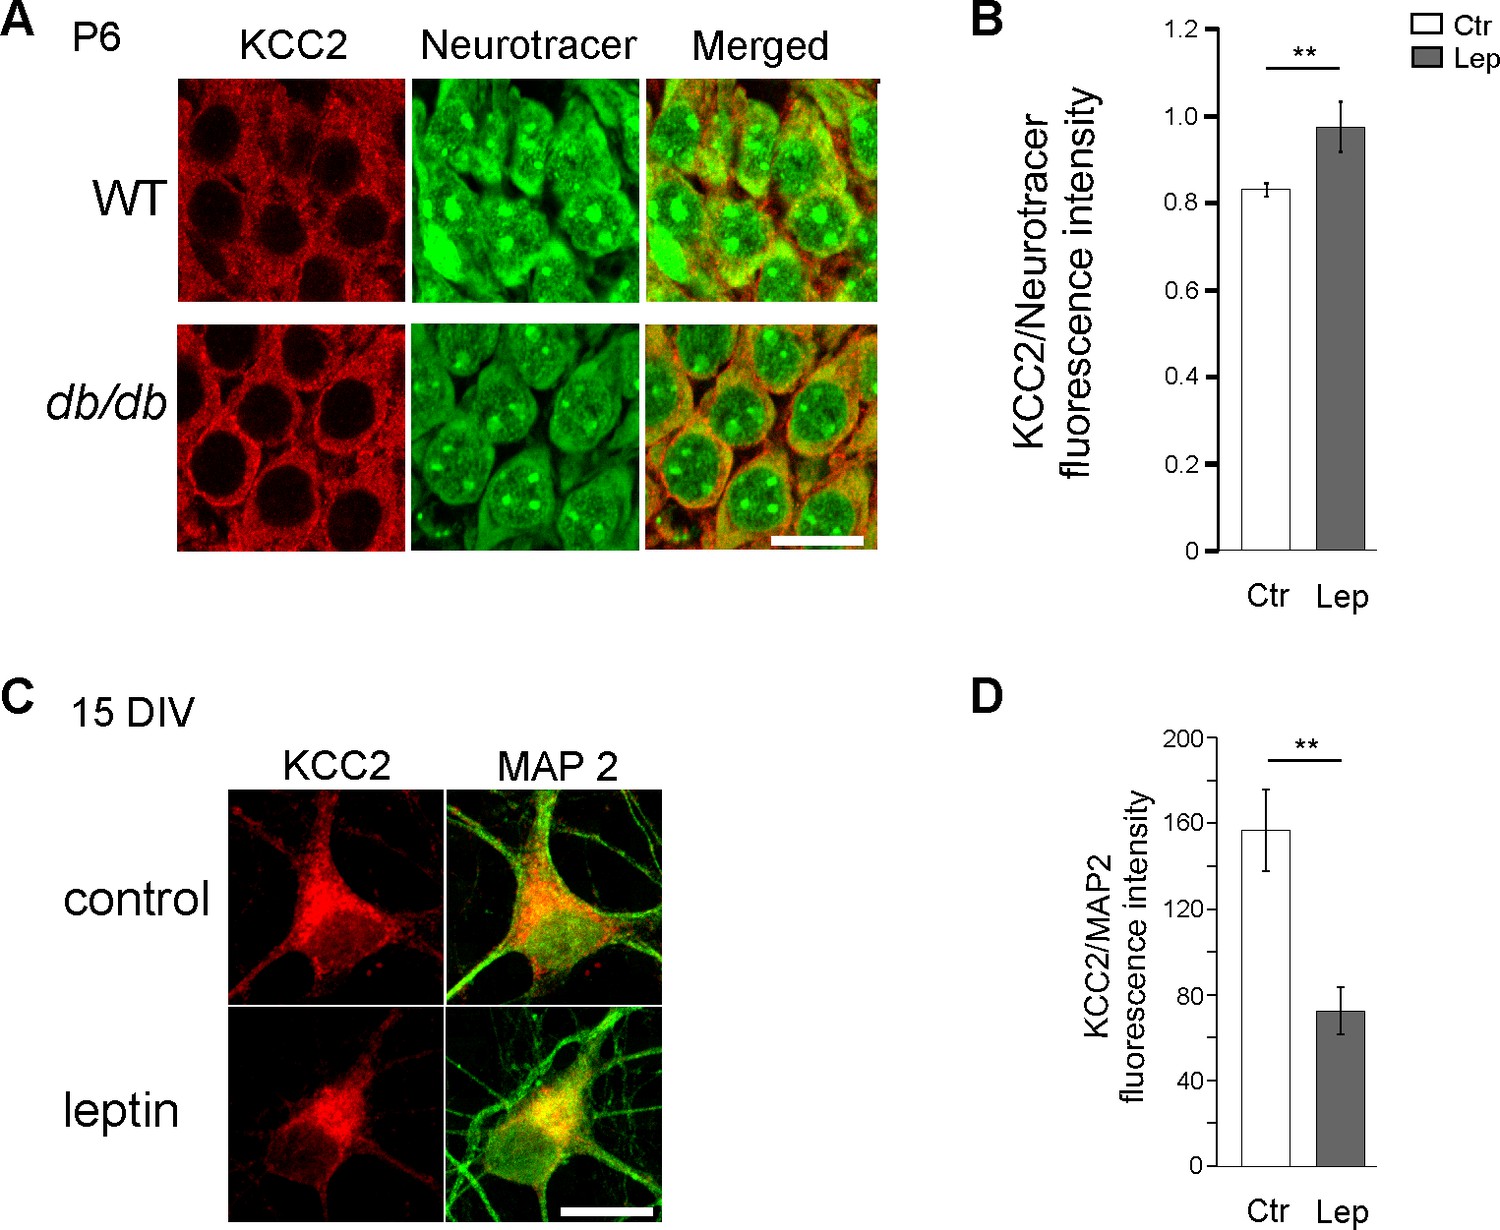
KCC2 expression in db/db hippocampal neurons in vivo and leptin-treated hippocampal neuronal cultures in vitro.
(A) Confocal images showing KCC2 immuno-labeling in the CA3 pyramidal layer of wt and db/db hippocampi at P6. (B) Summary plot of the normalized KCC2 fluorescence intensity ratio in P6 wt and db/db hippocampal CA3 pyramidal layer. Calibration bar 20 µm. 3 wt and db/db littermate animals. mean ±sem. **p<0.01, two-tailed unpaired Student’s t-test. (C) Examples of KCC2 and MAP2 immunostaining in control and leptin-treated (100 nM, 24 hr) cultured hippocampal neurons (15 DIV). Scale bar 20 µM. (C) Summary plots of the normalized KCC2 fluorescence intensity in control (n = 30) and leptin-treated (n = 45) hippocampal neurons. Pooled data from 3 different cultures.
Figure 1—figure supplement 3
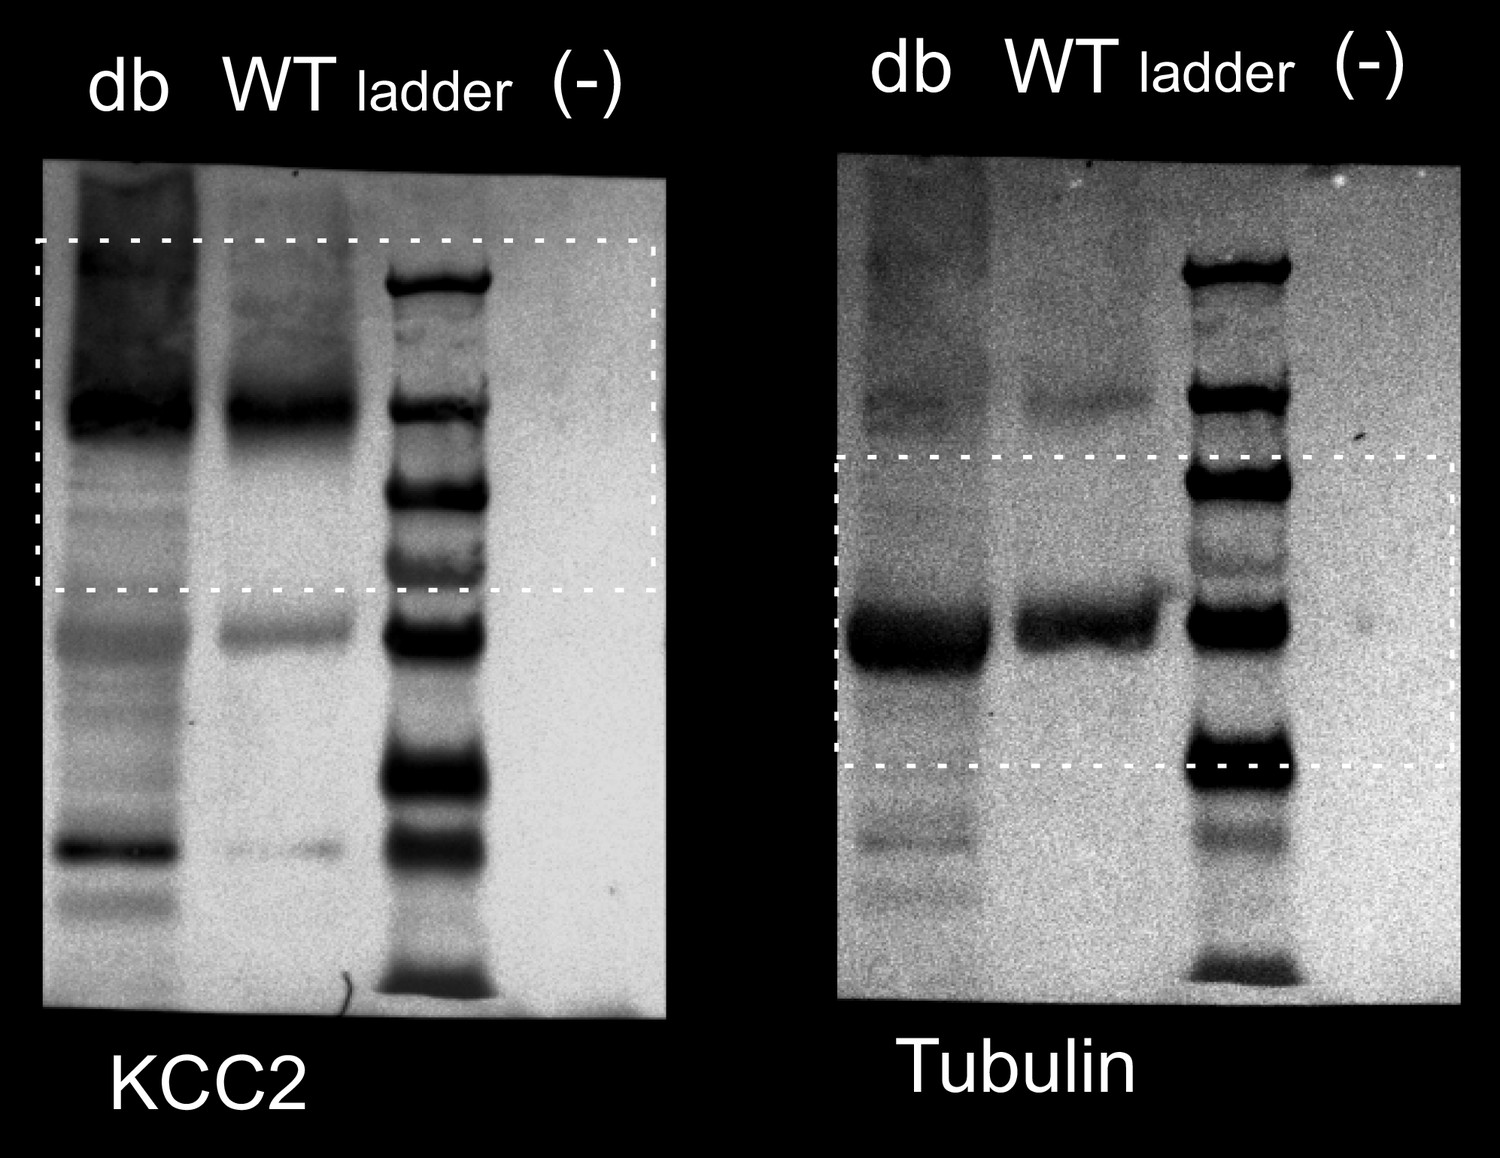
Raw blots for panel F (WT and db).
https://doi.org/10.7554/eLife.36726.006
Figure 2
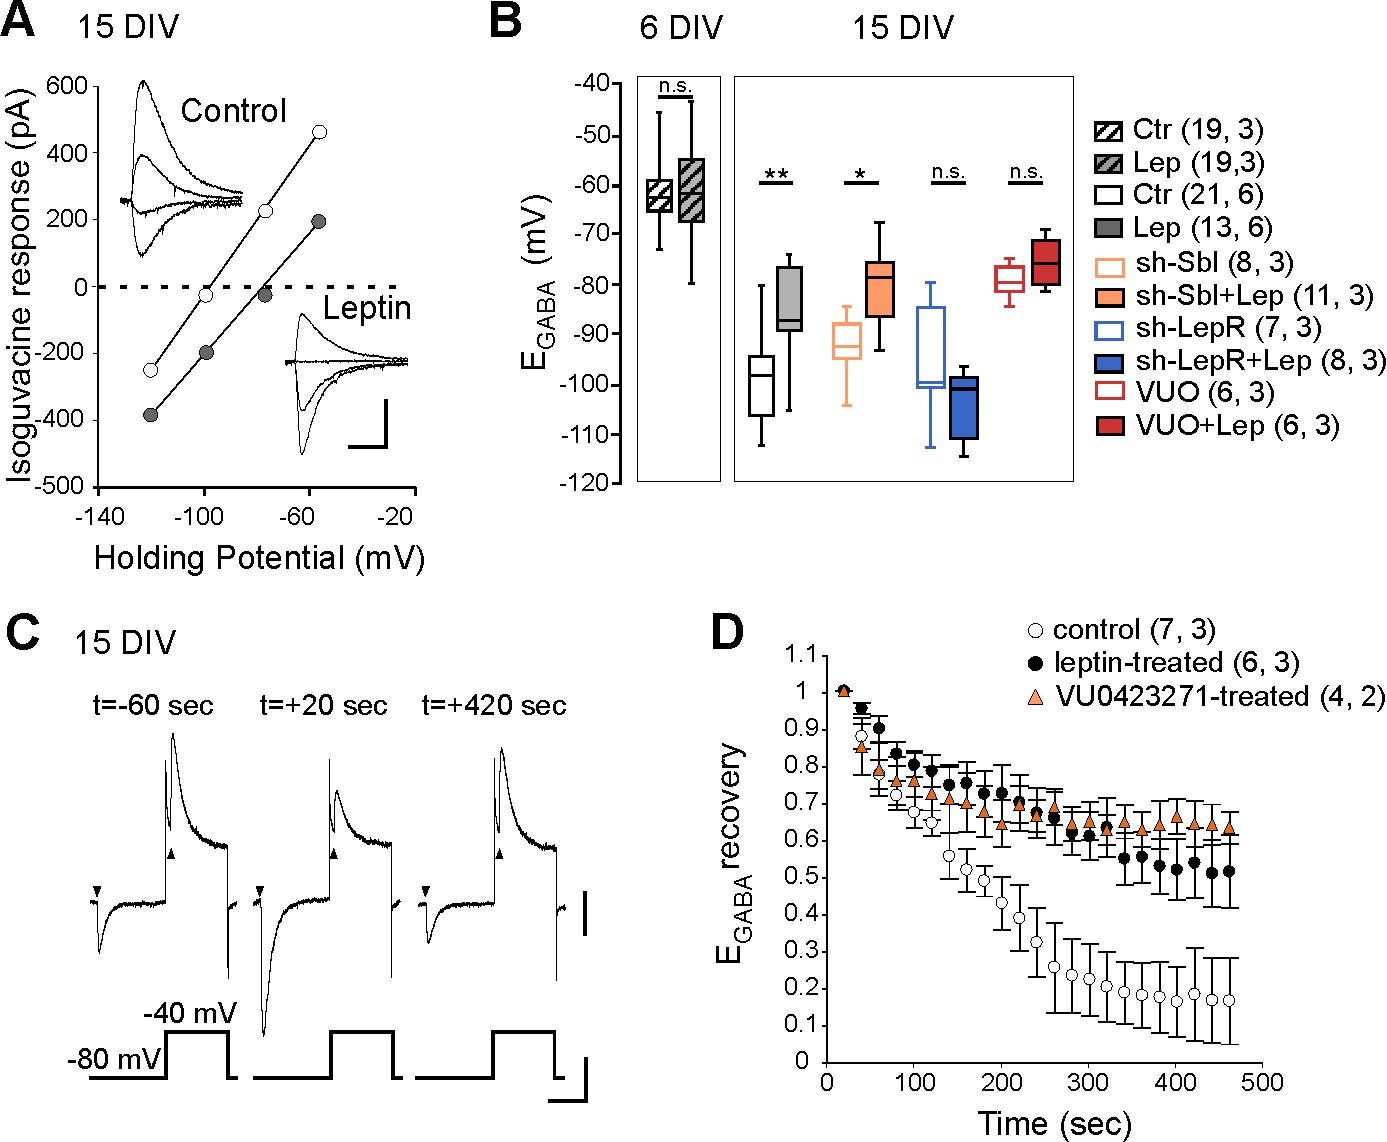
Leptin down-regulates KCC2 activity in cultured hippocampal neurons.
(A) I-V relationships for isoguvacine currents in vehicle (control) and leptin-treated (100 nM, 24 hr) hippocampal (15 DIV) cultures. Gramicidin perforated patch clamp recordings. Insets depict the isoguvacine currents. Scale bar, 500 ms, 100 pA. (B) Box plots of EGABA in the indicated conditions. *p<0.05, **p<0.01, ANOVA followed by a Tukey’s post hoc test. (C) Examples of isoguvacine currents (arrow heads) recorded at −80 and −40 mV before (t=-60 sec) and after (t = +20 and +420 s) neuronal chloride loading in control neuronal culture (15 DIV). Gramicidin perforated patch clamp recordings. Scale bar, 100 pA, 40 mV, 1 s. (D) Summary plots of normalized EGABA recovery after neuronal chloride loading in the indicated conditions. Mean ± SEM. In B and D, the number of cells recorded and number of cultures used are indicated in parenthesis.
-
Figure 2—source data 1
Leptin decreases KCC2 activity in cultured hippocampal neurons.
- https://doi.org/10.7554/eLife.36726.009
Figure 3
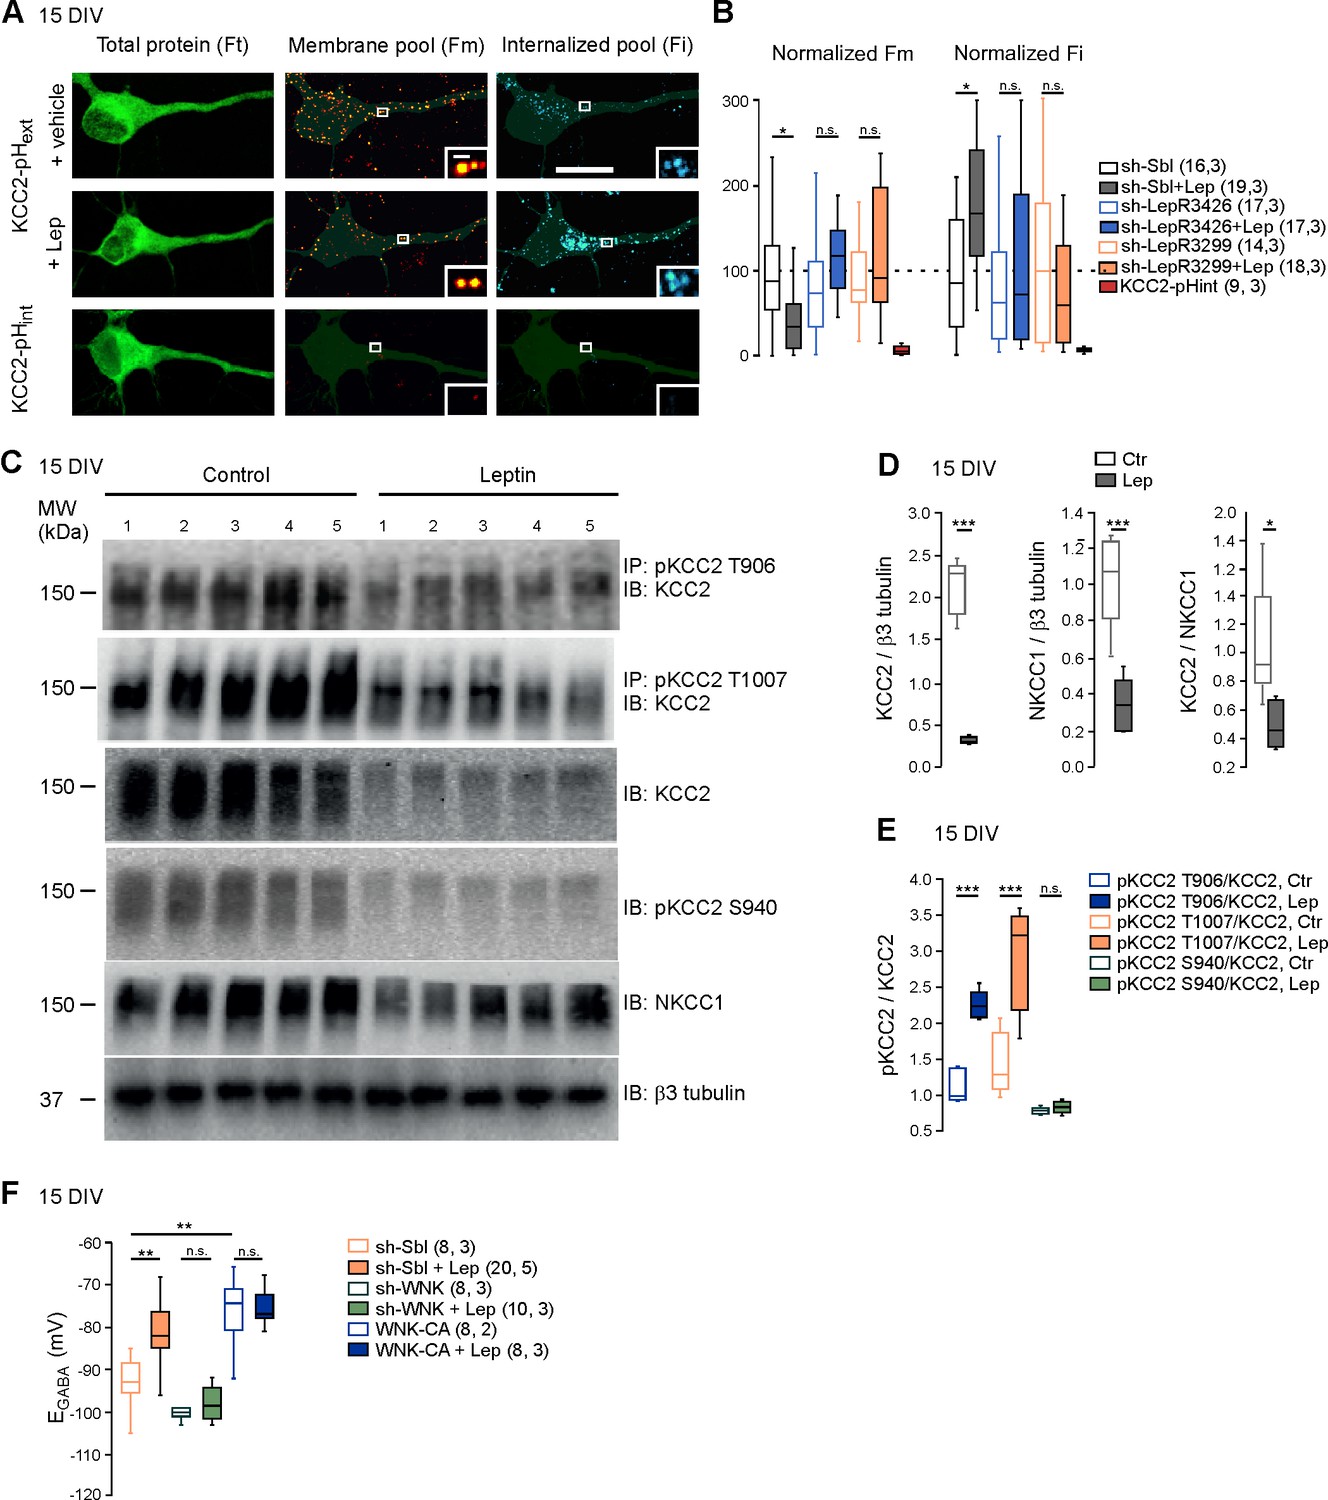
Leptin reduces the plasma membrane expression of KCC2 and modulates its phosphorylation state in cultured hippocampal neurons.
(A) Representative images illustrating total, membrane and internalized pools of KCC2 with external tag (KCC2-pHext) in vehicle and leptin-treated (100 mM, 24 hr) cultured hippocampal neurons expressing a scramble Sh-RNA (Sh-Sbl). Neurons expressing KCC2 with internal tag (KCC2-pHint) were proceeded in parallel experiments to ensure that immunocytochemistry on living neurons does not permeabilized the membrane. Scale bars 20 μm and 1 μm. (B) Box plots of normalized membrane (Fm) and internalized (Fi) fluorescence in vehicle and leptin-treated (+Lep) cultured neurons expressing the indicated constructs. *p<0.05, one way ANOVA followed by a Tukey’s post hoc test. (C) Western blots and quantifications (D and E) of KCC2, NKCC1, KCC2/NKCC1 ratio and the threonine 906, threonine 1007 and serine 940-phosphorylated forms of KCC2 in control and leptin (100 nM, 24 hr)-treated hippocampal neuronal cultures (DIV15, five independent neuronal cultures). ***p<0.001, two-tailed unpaired Student’s t-test. (F) Box plots of EGABA in the indicated conditions. Gramicidin perforated patch clamp recordings were performed on hippocampal neuronal cultures at 15 DIV. **p<0.01, ***p<0.001, one way ANOVA followed by a Tukey’s post hoc test. In B and F, the number of cells recorded and number of cultures used are indicated in parenthesis.
-
Figure 3—source data 1
Leptine controls the membrane expression of KCC2 and its phosphorylated state in hippocampal culture via the WNK pathway.
- https://doi.org/10.7554/eLife.36726.011
Figure 4 with 3 supplements

Hyperleptinemia and maternal obesity delay the GABA developmental sequence and downregulate KCC2 expression.
(A) Cell attached recordings of CA3 pyramidal neurons on acute hippocampal slices obtained from pups of normal diet (ND) and diet-induced obese (DIO) dams at P10. (B) Developmental changes of isoguvacine action on spike frequency. Mean +SEM. (C) Cell attached recordings of CA3 pyramidal neurons on acute hippocampal slices obtained from vehicle-treated (sham) and leptin-treated mice at P10. (D) Box plots of isoguvacine action on spike activity. In B and D, number of cells recorded and number of mice used are indicated in parenthesis; #p<0.05 when compared to pre-isoguvacine values, two-tailed paired Student’s t-test and *p<0.05 and **p<0.01 when compared to age matched ND-pups (B and C) or sham-pups (E), two-tailed unpaired Student’s t-test. (E) Representative immuno-blots for hippocampal panKCC2 and β3-tubulin in offspring of DIO and ND dams at P13 and in control (sham) and leptin-treated (Lep) mice at P10. The third lanes (-) illustrate background (empty wells). (F) Normalized panKCC2 immunoreactivity in ND (n = 6 pups) and sham (n = 3 pups), in offspring of DIO (n = 5 pups) and in leptin-treated mice (n = 5 pups). Mean +SEM. *p<0.05, two-tailed unpaired Student’s t-test.
-
Figure 4—source data 1
Maternal obesity and hyperleptinemia delayed the emergence of functional GABAergic inhibition.
- https://doi.org/10.7554/eLife.36726.016
Figure 4—figure supplement 1
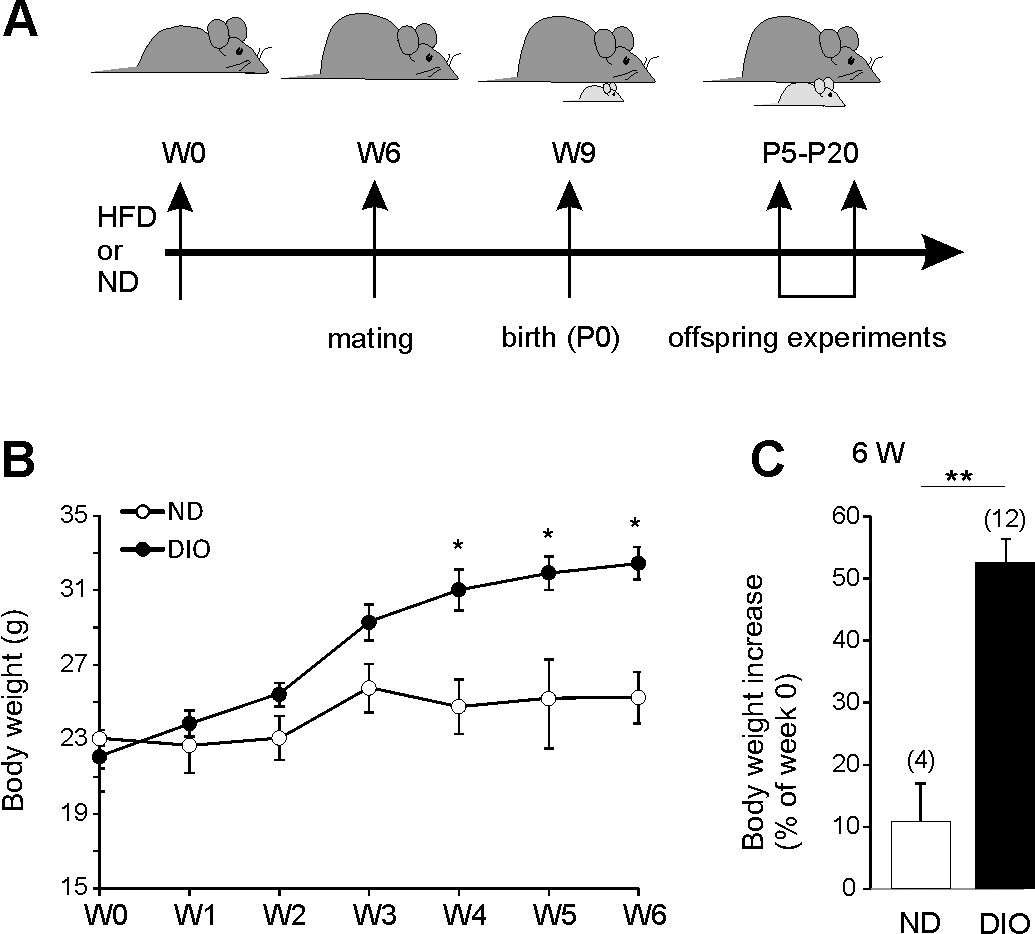
High fat diet induced obesity.
(A) Experimental overview. (B) Body weight curves of adult (8 weeks old) female mice fed with normal diet (10% kcal from fat, ND white symbols, n = 4) or a high-fat diet (60% kcal from fat, HFD, n = 12). (C) Average body weight increase after 6 weeks of food supply. *p<0.05, **p<0.01, two-tailed unpaired Student’s t-test.
Figure 4—figure supplement 2
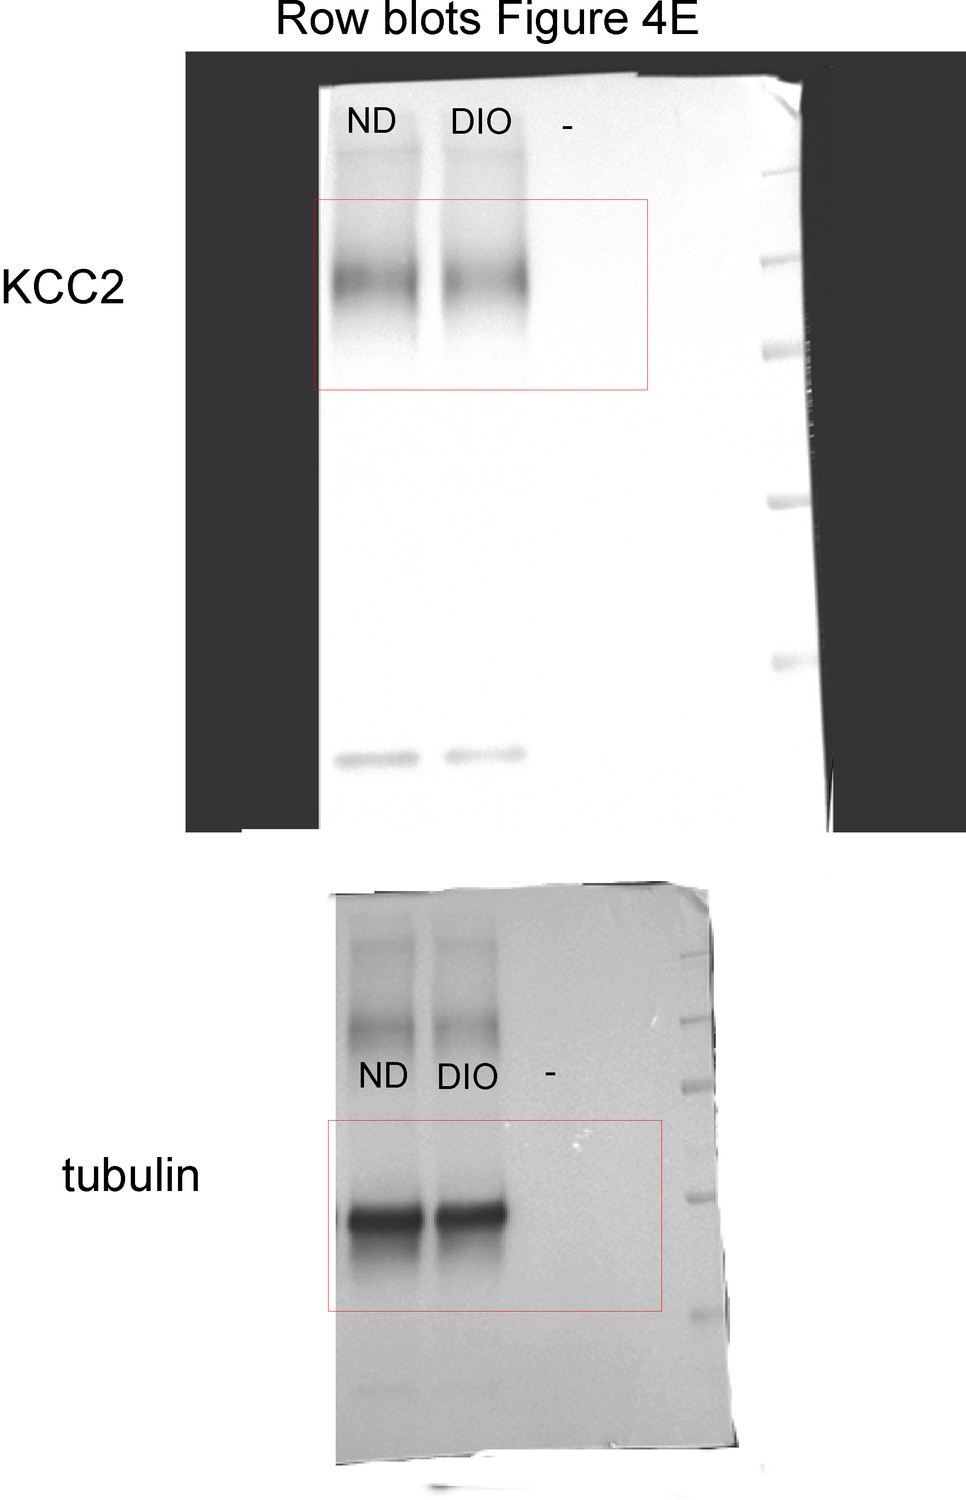
Raw blots for panel E (ND and DIO).
https://doi.org/10.7554/eLife.36726.014
Figure 4—figure supplement 3
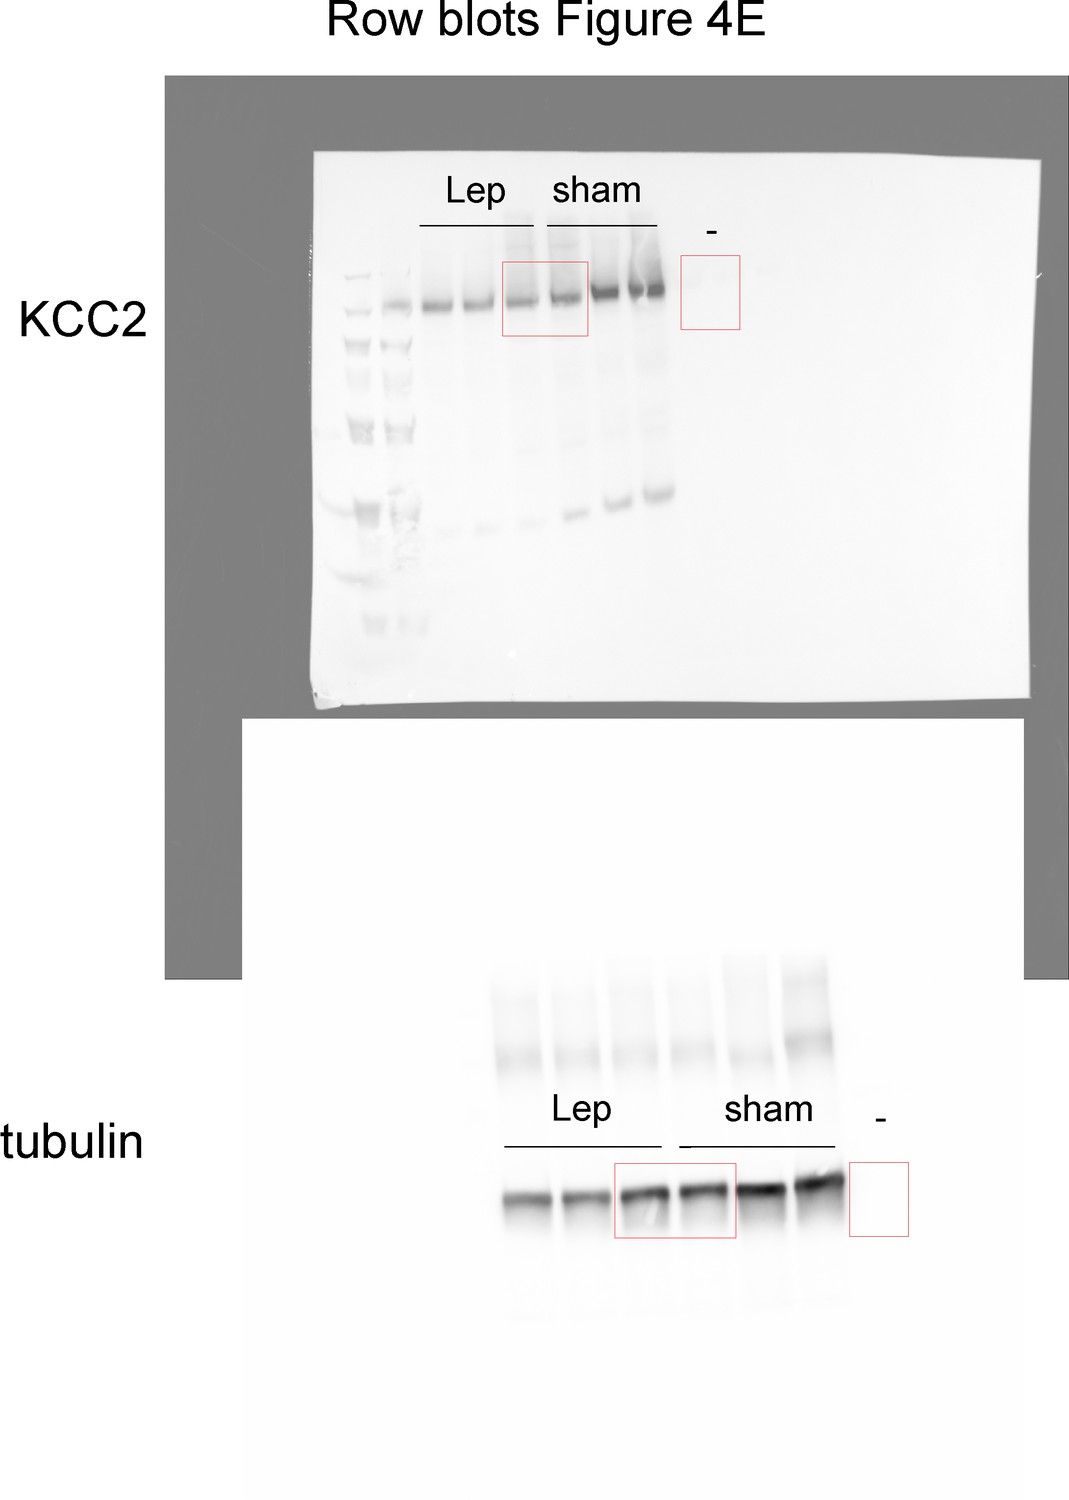
Raw blots for panel E (Lep and sham).
https://doi.org/10.7554/eLife.36726.015Tables
Key resources table
| Reagent type (species) or resource | Designation | Source or reference | Identifiers | Additional information |
|---|---|---|---|---|
| Genetic reagent (M. musculus) | B6.Cg-Lepob/J | The Jackson Laboratory | RRID:IMSR_JAX:000632 | |
| Genetic reagent (M. musculus) | B6.BKS-Leprdb | The Jackson Laboratory | RRID:IMSR_JAX:000697 | |
| Transfected DNA construct | shLepR 3426 | PMID:24877561, DOI: 10.1210/me.2013–1332 | Dr. G. Wayman (Washington State University) | |
| Transfected DNA construct | shLepR 3299 | PMID:24877561, DOI: 10.1210/me.2013–1332 | Dr. G. Wayman (Washington State University) | |
| Transfected DNA construct | WNK shRNA | PMID: 26126716, DOI: 10.1126 /scisignal.aaa0354 | ||
| Transfected DNA construct | WNK-CA | PMID: 26126716, DOI: 10.1126 /scisignal.aaa0354 | ||
| Transfected DNA construct | KCC2-pHluorin | PMID: 24928908, DOI: 10.15252 /embr.201438840 | ||
| Antibody | Mouse anti-β3 tubulin | Sigma-Aldrich | RRID:AB_477590, Cat# T8660 | WB (1:10 000) |
| Antibody | Rabbit anti-KCC2 | US Biological | RRID:AB_2188802, Cat# K0120-07 | WB (1:2000) |
| Antibody | Donkey anti-chiken Alexa488 | Fluoprobes | RRID: AB_2686906, Cat# FP-SA5110 | IHC (1:1000) |
| Antibody | Chicken anti-MAP2 | Abcam | RRID:AB_2138153, Cat# ab5392 | IHC (1:2000) |
| Antibody | Donkey Anti-rabbit Cy3 | Chemicon | RRID:AB_92588, Cat# AP182C | IHC (1:1000) |
| Antibody | mouse Anti-GFP | Novus Biologicals | RRID:AB_531011, Cat# NB 600–597 | |
| Antibody | NKCC1 total | the Division of Signal Transduction Therapy Unit (DSTT) at the University of Dundee | dundee (S022D) | WB (1 mg/ml) |
| Antibody | pan KCC2 | Dr. C. Rivera (University of Helsinki) | ||
| Antibody | KCC2 Ser940 | Novus Biologicals | Cat# NBP2-29513 | WB (1 mg/ml) |
| Antibody | KCC2a phosphoT1007 | the Division of Signal Transduction Therapy Unit (DSTT) at the University of Dundee | dundee (S959C) | WB (1 mg/ml) |
| Antibody | KCC2a phosphoT906 | the Division of Signal Transduction Therapy Unit(DSTT) at the University of Dundee | dundee (S959C) | WB (1 mg/ml) |
| Oligonucleotides | Slc12a2 (NKCC1) | Qiagen | QT00197785 | |
| Oligonucleotides | Slc 12a5 (KCC2) | Qiagen | QT00145327 | |
| Oligonucleotides | GAPDH | Qiagen | QT001199633 | |
| Peptide, recombinant protein | Recombinant murine leptin | Tocris, | Cat# TO-2985/1 | |
| Commercial assay or kit | Mouse leptin ELISA kit | BioVendor R and DR | Cat# RD291001200 | |
| Chemical compound, drug | 1,2,3,4-Tetrahydro-6 -nitro-2,3-dioxo-benzo [f]quinoxaline-7- sulfonamide (NBQX) | NIMH Chemical Synthesis and Drug Supply Program, https://nimh-repository.rti.org/ | ||
| Chemical compound, drug | D-2-amino-5- phosphovaleric acid (D-APV) | NIMH Chemical Synthesis and Drug Supply Program, https://nimh-repository.rti.org/ | ||
| Chemical compound, drug | 1,2,3,4-Tetrahydro-6 -nitro-2,3-dioxo-benzo [f]quinoxaline-7- sulfonamide (NBQX) | NIMH Chemical Synthesis and Drug Supply Program, https://nimh-repository.rti.org/ | ||
| Chemical compound, drug | Isoguvacine | Tocris | Cat# 0235 | |
| Chemical compound, drug | VU0463271 | Tocris | Cat# 4719 | |
| Chemical compound, drug | Bumetanide | Sigma | Cat# B3023 | |
| Software and Algorithms | National Institutes of Health | RRID:SCR_003070 | ||
| Software and Algorithms | Synaptosoft, http://www.synaptosoft.com/MiniAnalysis/DownloadDemo.html |
Additional files
-
Supplementary file 1
Advanced onset of GABA inhibition in leptin deficient mice.
- https://doi.org/10.7554/eLife.36726.017
-
Transparent reporting form
- https://doi.org/10.7554/eLife.36726.018
Download links
A two-part list of links to download the article, or parts of the article, in various formats.
Downloads (link to download the article as PDF)
Open citations (links to open the citations from this article in various online reference manager services)
Cite this article (links to download the citations from this article in formats compatible with various reference manager tools)
The adipocyte hormone leptin sets the emergence of hippocampal inhibition in mice
eLife 7:e36726.
https://doi.org/10.7554/eLife.36726


