Cellular aspect ratio and cell division mechanics underlie the patterning of cell progeny in diverse mammalian epithelia
- University of California, San Francisco, United States
- Chan Zuckerberg Biohub, United States
Figures
Figure 1 with 3 supplements
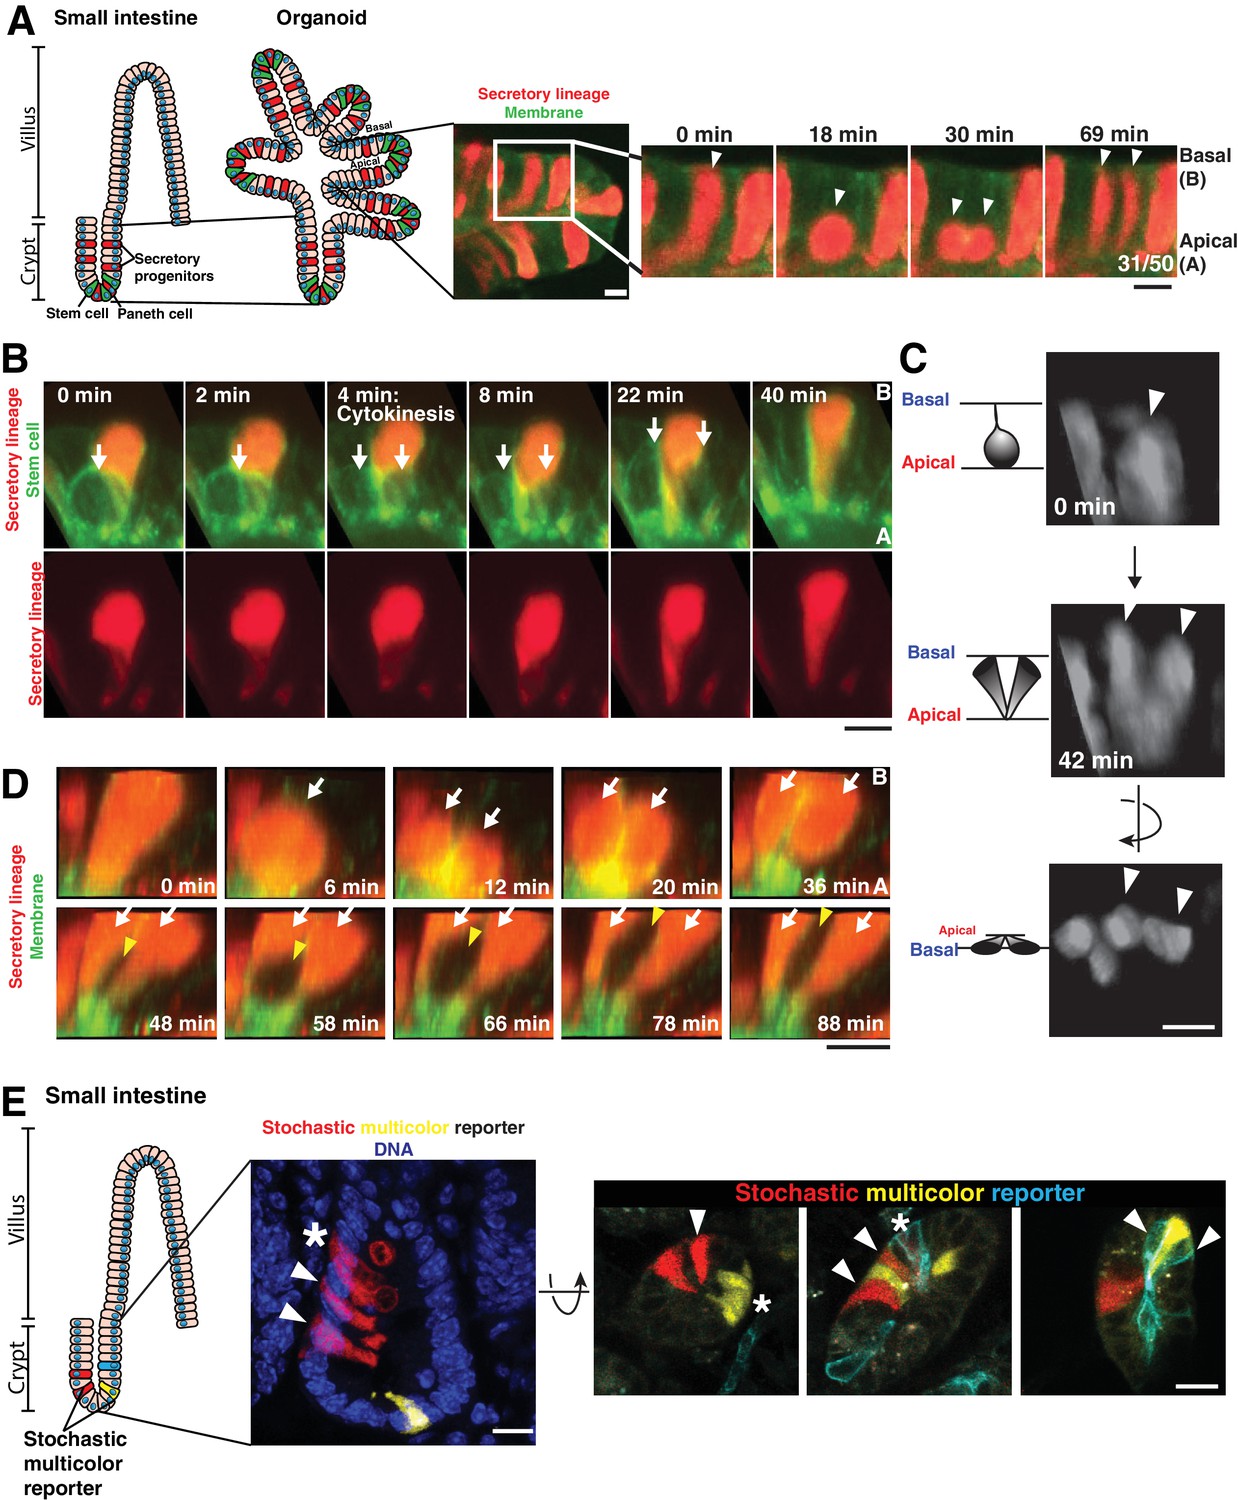
Separation of dividing daughter cells during apical cytokinesis underlies intermingling of cell lineages.
(A) Left: Cartoon depicting organoid derivation. Right: Frames from time-lapse imaging of a dividing cell of the secretory lineage (red, Atoh1CreER; R26RFP) interspersing with non-secretory cells (green membranes). Arrowheads: dividing cell. Fraction of divisions in which labeled daughters separated is shown on the right panel. (B) Frames from 3D reconstructed SPIM of a secretory cell (red, Atoh1CreER; R26RFP) inserting in the cytokinetic furrow of a dividing stem cell (green, Lgr5DTR-GFP). Arrows: dividing cell. (C) Frames from 3D reconstructed SPIM of a dividing cell of the secretory lineage (Atoh1CreER; R26RFP). Arrowheads: dividing cell. (D) Frames from 3D reconstructed SPIM of a secretory cell (red) undergoing a division in which daughter cells do not separate during cytokinesis (top, white arrows indicate daughter cells). Subsequently, these daughter cells become separated by a dividing cell pushing between them (bottom, white arrows indicate daughter cells and yellow arrowhead indicates newly dividing cell inserting between the adjacent daughters). (E) Confocal images of crypts in which cells have been labeled with a stochastic multicolor reporter in vivo (Vil1CreER; R26Brainbow2.1) and the positions of progeny analyzed three days after induction of the reporter. Left: sagittal view from 50 µm sections. Right: transverse views from 20 µm sections. Arrowheads indicate interspersed progeny. Progeny can also remain adjacent, as in the organoids, indicated by asterisks. Scale bars, 10 µm.
Figure 1—figure supplement 1
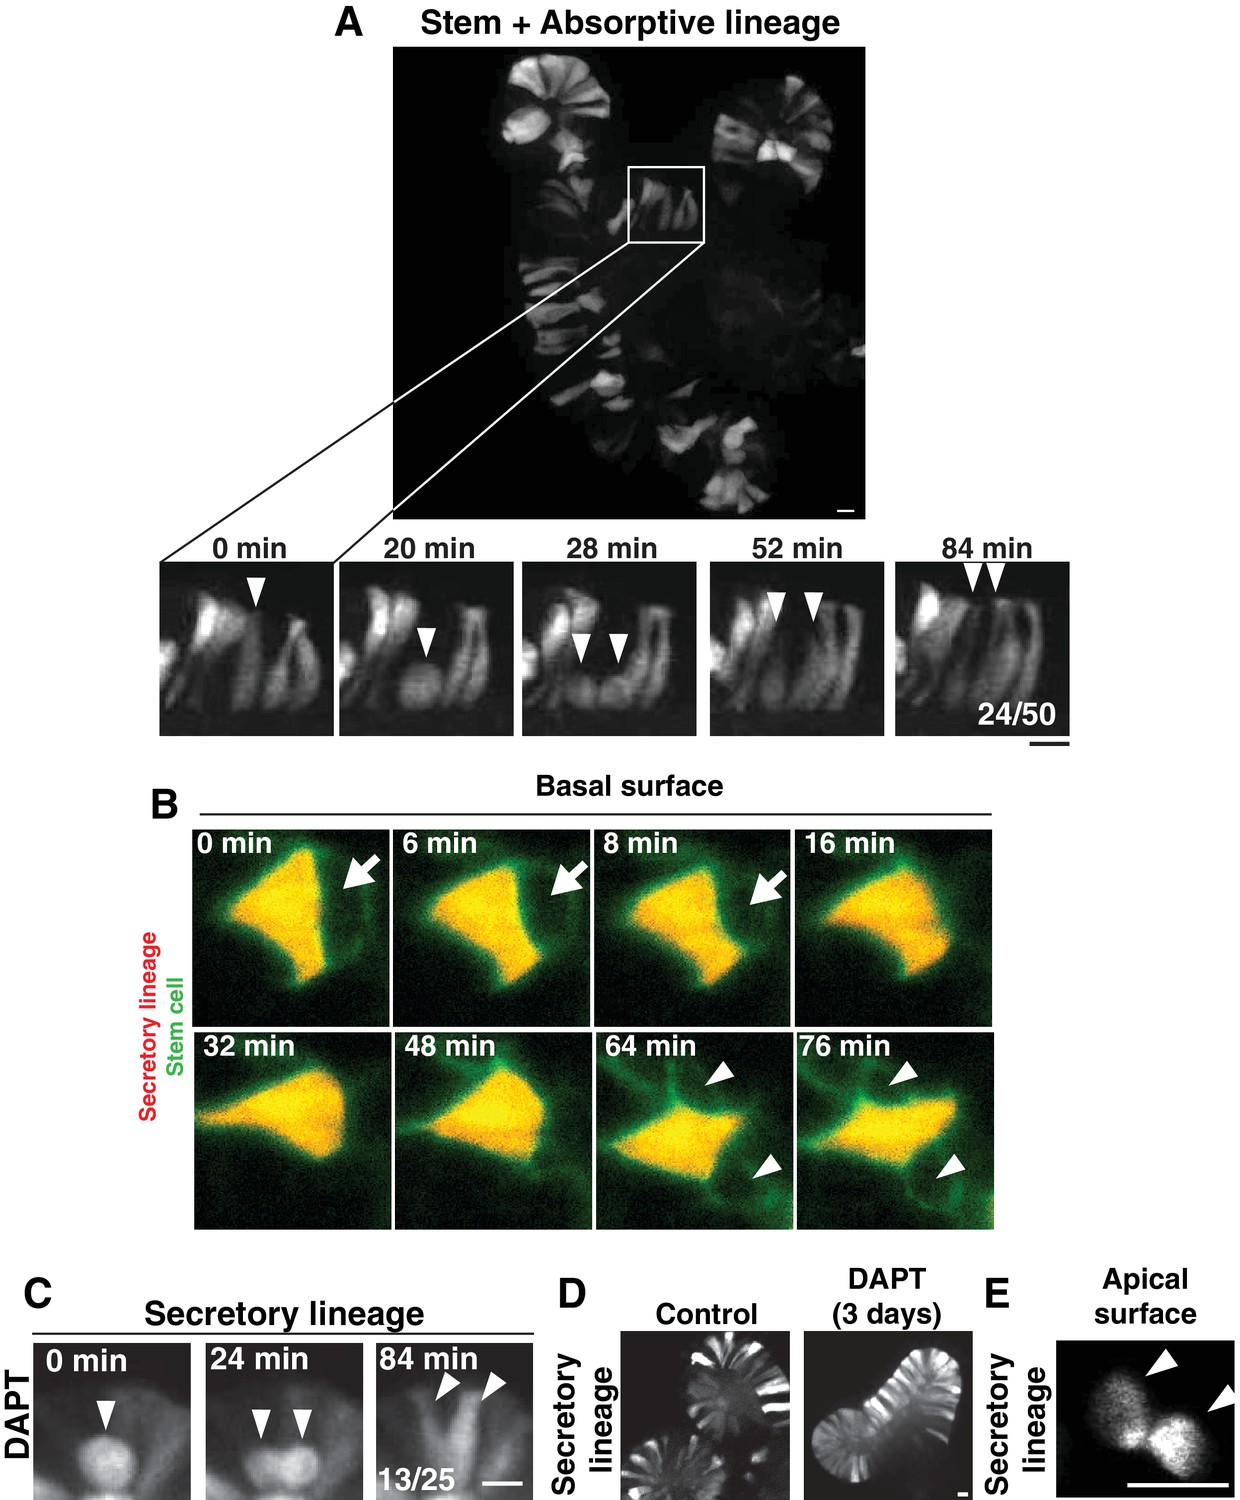
Cell interspersion in intestinal organoids.
(A) Top: Frame from time-lapse imaging of an intestinal organoid in which the stem cells and absorptive cells are labeled (Notch1CreERT2; R26RFP). Bottom: Frames from inset showing a dividing cell. Fraction of divisions in which labeled daughters separated is shown on the right panel. (B) Frames from time-lapse SPIM of an intestinal organoid, viewed from the basal surface of the epithelium. A stem cell (green, Lgr5DTR-GFP) divides and the daughters becoming separated by insertion of a neighboring secretory cell (red, AtohCreER; R26RFP). Arrow points to the stem cell, which displaces apically (out of the plane of view) before reappearing as two separated daughters (arrowheads). (C) Frames from time-lapse imaging of a dividing cell of the secretory lineage (AtohCreER; R26RFP) following >24 hr treatment with the Notch (gamma-secretase) inhibitor, DAPT. Fraction of divisions in which labeled daughters separated is shown on the right panel. (D) Stills of control (left) or DAPT-treated (right) organoids showing accumulation of secretory cells following DAPT treatment for 3 days. E) Frame from time-lapse SPIM of an intestinal organoid, showing apical surface of the secretory daughter cells (Atoh1CreER; R26RFP) from Figure 1C. Arrowheads indicate the daughter cells. Scale bars, 10 µm.
Figure 1—video 1
3D reconstruction of separated daughter cells.
Dividing cell of the secretory lineage imaged by SPIM with 40X objectives at 2 min time points. Separated daughters are then rotated toward the viewer.
Figure 1—video 2
Daughters that remain neighbors can become separated by subsequent nearby mitosis.
Cell of the secretory lineage (red, Atoh1CreER; R26RFP) divides and the daughter cells remain side-by-side. Subsequently, these daughters become separated by a non-secretory cell dividing between them. Imaged by SPIM with 40X objectives at 2 min time points.
Figure 2 with 14 supplements
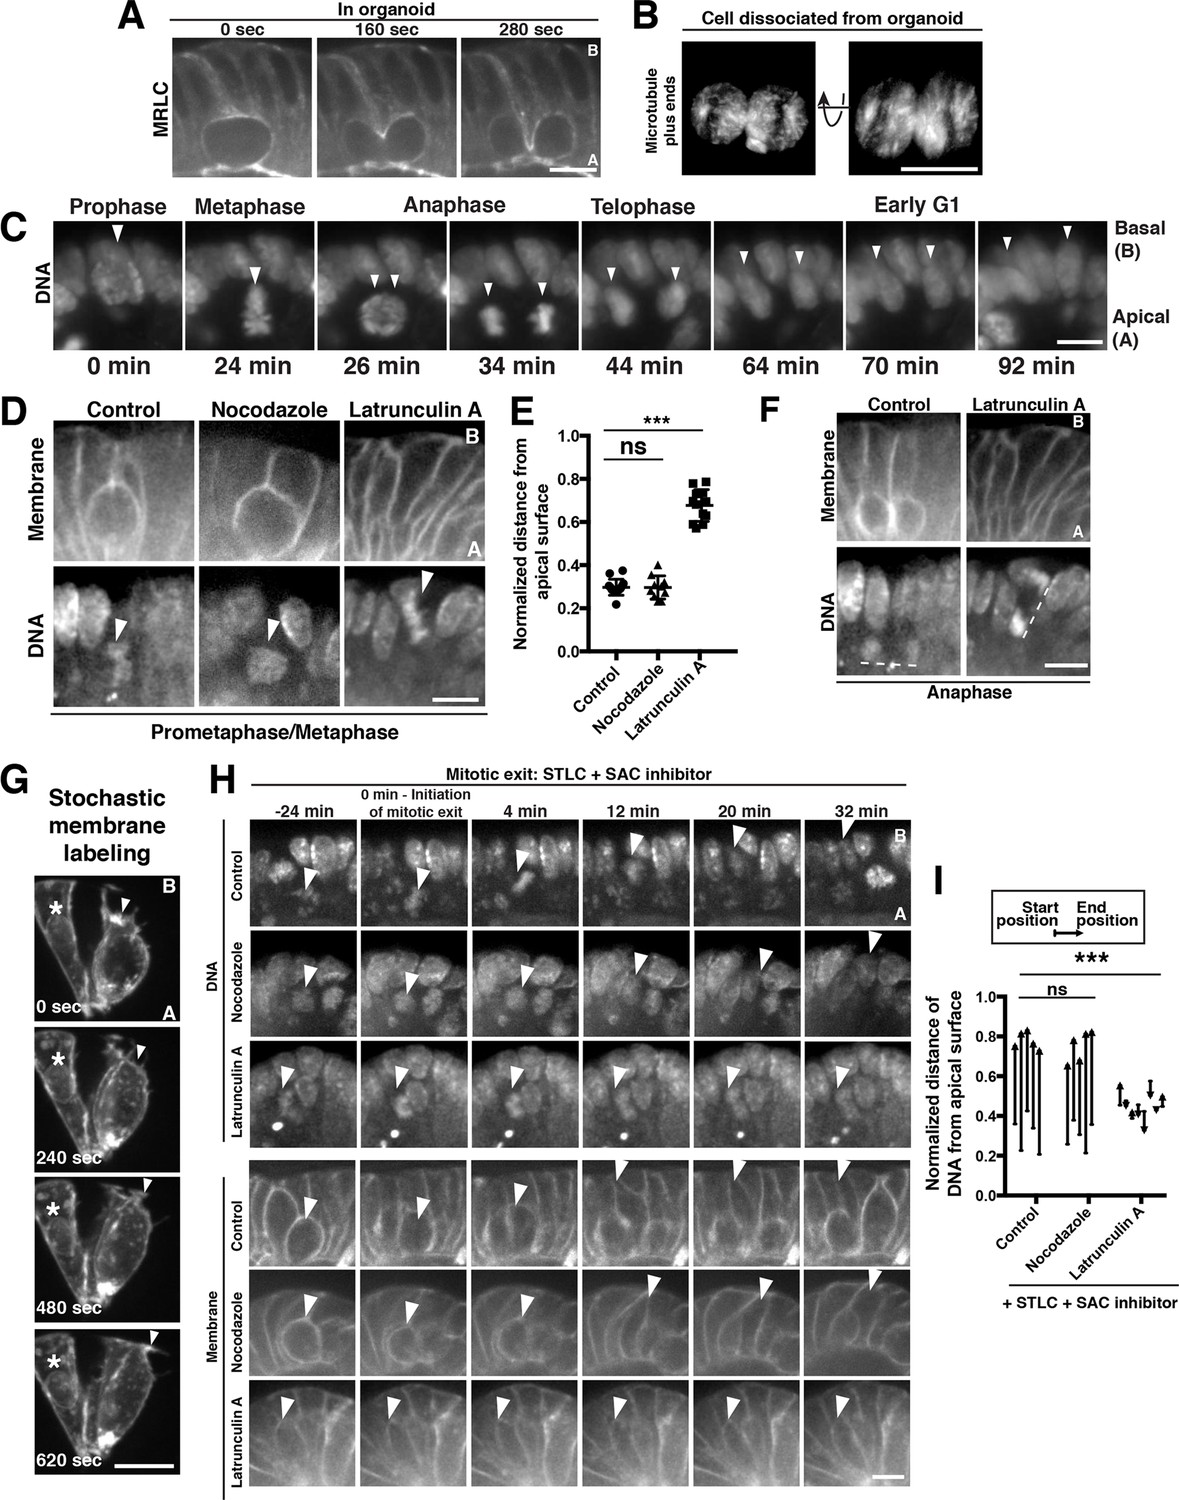
Polarized actin-dependent cell shape changes underlie division-coupled interspersion behaviors.
(A) Frames from time-lapse imaging of cytokinesis in an organoid expressing myosin regulatory light chain (MRLC)-mScarlet. (B) 3D reconstruction from live imaging of a cell dissociated from EB3-GFP organoids undergoing cytokinesis. EB3-GFP labeled organoids were used to facilitate identification of dissociated cells undergoing mitosis. Representative of 12/15 divisions. (C) Frames from SPIM of chromosome segregation in a live organoid. DNA: H2B-mScarlet. Arrowheads indicate mitotic chromosome masses. (D) Frames from confocal imaging of mitotic cells in live organoids treated with cytoskeletal inhibitors for 30 min before initiation of imaging. Membranes: R26mTmG; DNA: SiR-DNA. Arrowheads: mitotic chromosomes. (E) Quantification of the distance of mitotic chromosomes from the apical surface of the organoid epithelium following treatment with cytoskeletal inhibitors, normalized to the total apical-basal height of the epithelium, n ≥ 10. ns: not significant; ***p<0.001, Student’s t-test. (F) Anaphase of mitoses shown in (D). Dashed lines underline anaphase chromosome masses. (G) Frames from time-lapse imaging of Vil1CreERT2; R26mTmG organoids in which recombination has been induced at low levels to label a subset of cell membranes in the organoid. The protrusive front of one daughter cell is indicated by an arrowhead. Note that the division occurred along the imaging plane, such that the other daughter cell is ‘behind’ the imaged daughter cell. Asterisk: nearby interphase cell that did not participate in the division. (H) Frames from confocal imaging of live organoids testing the cytoskeletal requirements for the basal movement of nascent nuclei (top, arrowheads indicate chromosomes) and elongation of the basal cell edge (bottom, arrowhead indicates basal edge of reinserting cell). A schematic of this experiment is shown in Figure 2—figure supplement 1I. DNA: SiR-DNA; Membrane: R26mTmG; STLC: Eg5 inhibitor to induce mitotic arrest; SAC: spindle assembly checkpoint. (I) Quantification of DNA position before SAC inhibition (starting position), and at chromosome decondensation (end position), normalized to the total apical-basal distance of the epithelium. Arrowheads point towards the end position after mitotic exit. n ≥ 5, ns: not significant, ***: p<0.001, Student’s t-test of comparing end position and start position. Scale bars, 10 µm.
Figure 2—figure supplement 1
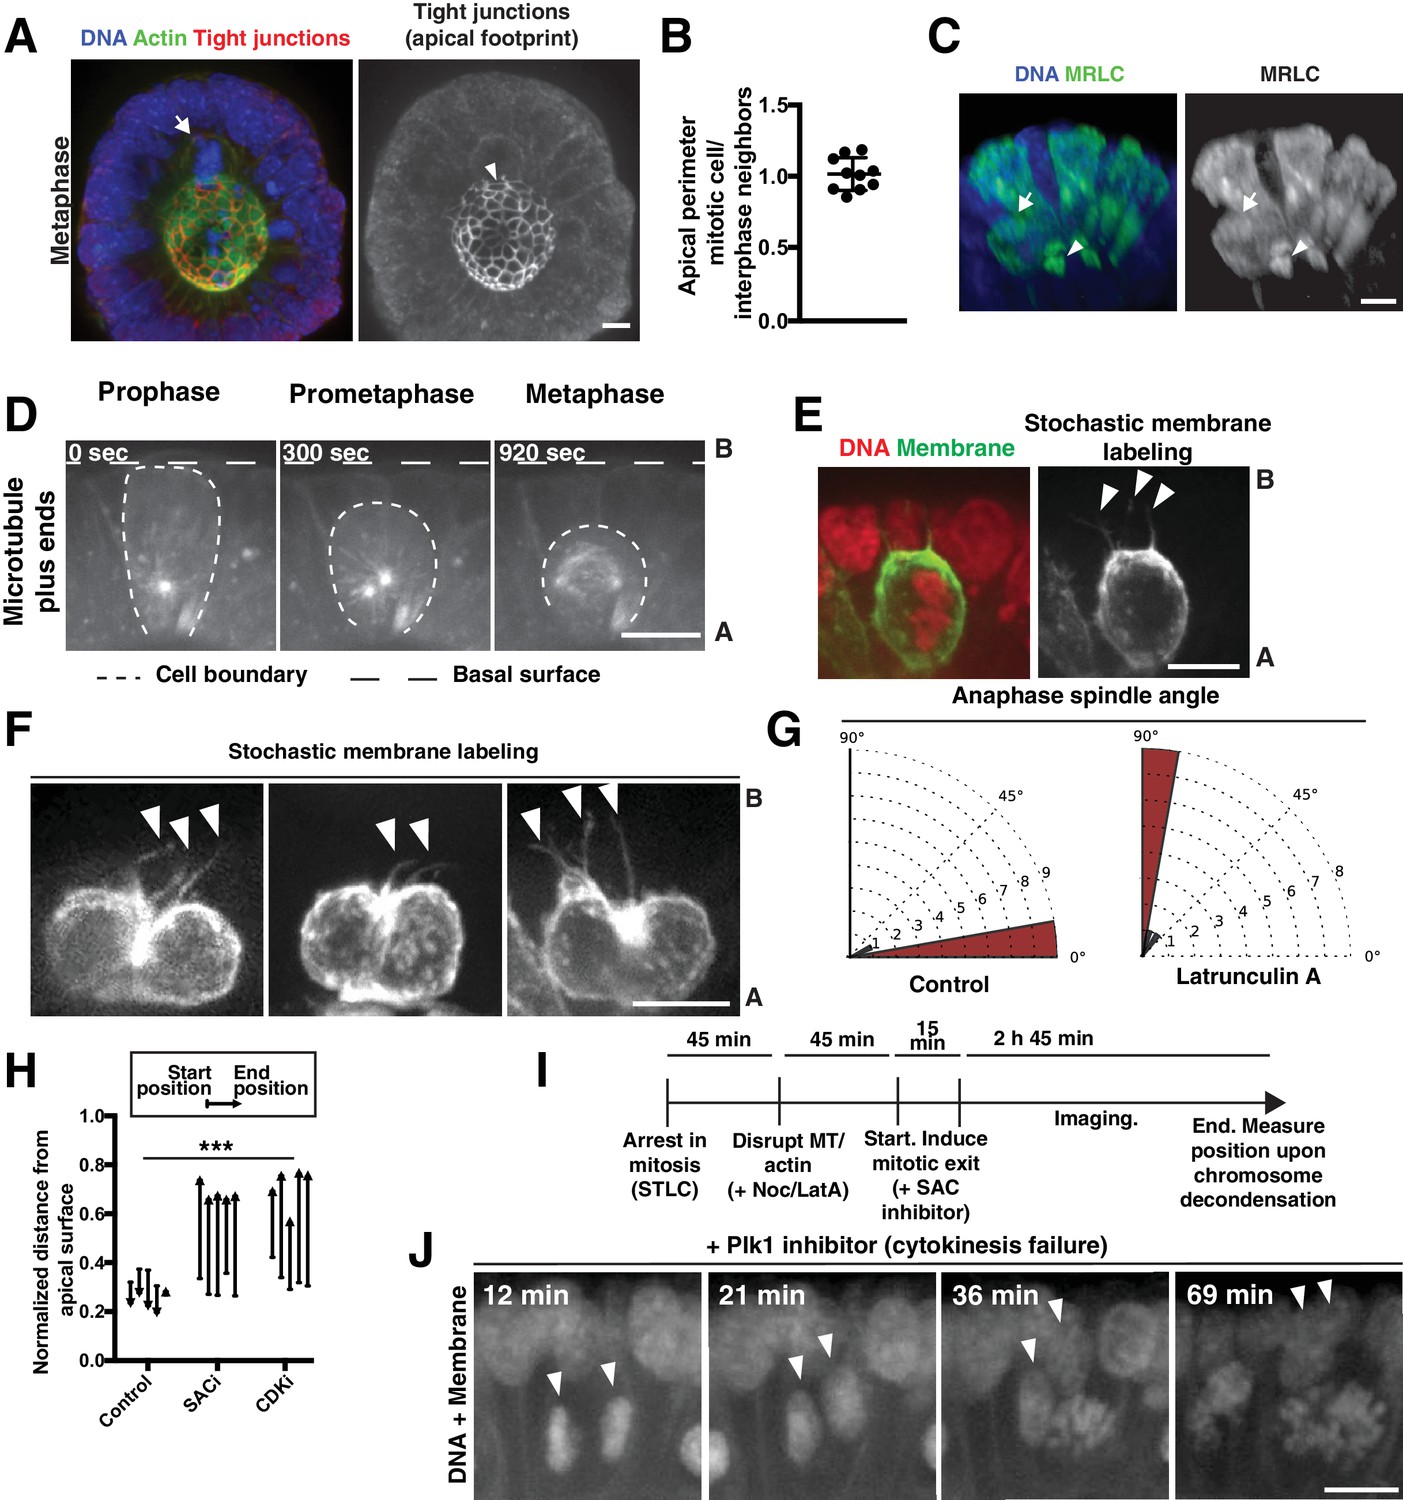
Polarized actin-dependent changes in cell shape during division in intestinal organoids.
(A) 3D reconstruction of immunofluorescence images. Arrow indicates mitotic cell. Arrowhead indicates the corresponding apical footprint. DNA: Hoechst 33342, actin: Alexa488-phalloidin, tight junctions: anti-ZO-1. (B) Quantification of the perimeter of the apical footprint of mitotic cells compared to interphase cells. The apical footprint was determined from anti-ZO1 immunofluorescence. Each data point represents the ratio between the apical perimeter of a mitotic cell and the average apical perimeter of 4 of its interphase neighbors. n = 10. (C) 3D reconstruction of immunofluorescence images. Arrow indicates mitotic cell. Arrowhead indicates the corresponding apical footprint. DNA was labeled with Hoechst 33342. Organoids transduced with MRLC2-mScarlet were used to report on myosin localization. This process can generate mosaic organoids, in which only a subset of cells expresses the transgene, allowing for assignment of the myosin localization to specific cells. (D) Frames from time-lapse imaging of a mitotic cell in a live organoid in which microtubule plus-ends are labeled with EB3-GFP. (E) Fluorescent image of a metaphase cell in a live organoid, in which DNA is fluorescently labeled with H2B-mScarlet. The membranes of a subset of cells within the organoid have been labeled with GFP by inducing low levels of recombination of the R26mTmG reporter (for example, see [Packard et al., 2013]) with an inducible, pan-intestinal epithelial Cre (Vil1CreER). Arrowheads indicate thin membranous processes that maintain the connection of the mitotic cell to the basal surface. (F) Fluorescent images of anaphase cells in live Vil1CreER; R26mTmG organoids, induced as in Figure 2—figure supplement 1E to stochastically label a subset of cell membranes in the organoid. Arrowheads indicate membranous processes. Far right panel represents a later time point of the cell shown in Figure 2—figure supplement 1E. Images scaled with ɣ adjustment. Although membranous processes are inherited by only one daughter during division in the developing kidney (Packard et al., 2013), in the intestine we found that both daughters inherited processes (23/25 anaphases have at least one process per daughter cell). Consistent with symmetric inheritance of these processes, we observed that daughters re-established full contact with the basal surface at highly similar rates after division: daughters reestablished full contact with the basal surface within 4 ± 4 min (SD) of one another. (G) Quantification of anaphase spindle orientation compared to the plane of the epithelium following vehicle and Latrunculin A treatment, on a 0–90° scale, n = 10. (H) Quantification of chromosome movements in organoids following mitotic arrest and induced mitotic exit. Mitotic arrest was induced by 45 min treatment with S-trityl-L-cysteine (STLC). Mitotic exit was subsequently induced by pharmacological disruption of the spindle assembly checkpoint (SAC, using the Mps1 inhibitor AZ3146) or cyclin-dependent kinase (CDK, using the CDK inhibitor RO-3306). Each arrow corresponds to the position of the DNA from one cell, before and after SAC/CDK inhibition, normalized to the total apical-basal distance of the epithelium. Arrowheads point towards the end position. The end point was defined as chromosome decondensation for the +SAC and +CDK inhibitors conditions. Since the control case does not undergo mitotic exit, the end point was defined as the end of the experiment, after 3 hr of imaging, which is substantially before the organoid begins to die from the treatment. n = 5, ***: p<0.001, ANOVA of distances moved (end position – start position). (I) Schematic of assay used to assess chromosome movements in organoids following mitotic arrest with STLC, pharmacological disruption of the cytoskeleton, and induction of mitotic exit with the SAC inhibitor AZ3146 (Figure 2H and I). (J) Frames from time-lapse imaging of cells in live organoids treated with the Plk1 inhibitor BI2536 to inhibit cytokinesis. DNA was labeled with H2B-mScarlet. Membrane (labeled with R26mTmG) shows absence of cytokinetic furrow ingression. Arrowheads indicate daughter nuclei. Time following BI2536 addition is indicated. We note a significant delay in the observation of pharmacological effects on the organoids compared to cultured cells, allowing for initial chromosome alignment and satisfaction of the SAC before the effects of the BI2536 were observed. Plk1 inhibition was used to inhibit cytokinesis since blebbistatin, a myosin II inhibitor, did not disrupt cytokinesis at the limits of its solubility in this system. Scale bars, 10 µm.
Figure 2—video 1
Cytokinesis in the intestinal organoids.
MRLC-mGFP organoids imaged by spinning disc confocal with 60 X objective at 20 s time points.
Figure 2—video 2
Cytokinesis in the intestinal organoids.
MRLC-mScarlet organoids imaged by spinning disc confocal with 60X objective at 20 s time points.
Figure 2—video 3
Cytokinesis in the intestinal organoids.
Rare membrane-GFP cells in organoids generated by stochastic recombination of the R26mTmG reporter as described in Figure 2—figure supplement 1E were imaged by spinning disc with 60X objective at 20 s time points. The division occurred along the imaging plane, such that the other daughter cell is ‘behind’ the imaged daughter cell. Note that cytokinesis is also accompanied by blebbing from the basal surface.
Figure 2—video 4
Furrow ingression in dissociated intestinal cells.
3D reconstruction of a single time point from live imaging of mitotic exit in cells dissociated from an EB3-GFP organoid. The reconstruction is rotated away from the viewer. Imaging was performed by spinning disc confocal with a 60X objective.
Figure 2—video 5
Spindle assembly and cell rounding during mitosis.
EB3-GFP organoids imaged from early prophase by spinning disc confocal with 60X objective at 20 s time points.
Figure 2—video 6
Cell rounding during mitosis in intestinal organoids.
Membrane-tomato labeled organoids (R26mTmG in the absence of recombination) imaged by spinning disc confocal with 20X objective at 7 min time points.
Figure 2—video 7
Chromosome movements at mitotic onset in Latrunculin A-treated organoids.
DNA labeled with SiR-DNA dye. Imaged by spinning disc confocal with 40X objective at 4 min time points.
Figure 2—video 8
Chromosome movements at mitotic onset in nocodazole-treated organoids.
DNA labeled with SiR-DNA dye. Imaged by spinning disc confocal with 40X objective at 4 min time points. The cell does not undergo chromosome segregation as it is unable to assemble a mitotic spindle.
Figure 2—video 9
Chromosome movements at mitotic onset in control organoids
DNA labeled with SiR-DNA dye. Imaged by spinning disc confocal with 40X objective at 4 min time points.
Figure 2—video 10
Cell reinsertion behavior.
A daughter cell within an organoid in which a subset of cells is labeled with membrane-GFP (R26mTmG; Vil1CreER induced at low levels) blebbing and extending protrusions to the basal surface following cytokinesis. Note that the division occurred along the imaging plane, such that the other daughter cell is ‘behind’ the imaged daughter cell. Imaged by spinning disc confocal with a 60X objective at 20 s time points.
Figure 2—video 11
Chromosome movements following induced mitotic exit in STLC-treated organoids.
DNA labeled with SiR-DNA dye. Imaged by spinning disc confocal with 40X objective at 4 min time points.
Figure 2—video 12
Chromosome movements following induced mitotic exit in STLC and Latrunculin A-treated organoids.
DNA labeled with SiR-DNA dye. Imaged by spinning disc confocal with 40X objective at 4 min time points.
Figure 2—video 13
Chromosome movements following induced mitotic exit in STLC and nocodazole treated organoids.
DNA labeled with SiR-DNA dye. Imaged by spinning disc confocal with 40X objective at 4 min time points.
Figure 3 with 4 supplements
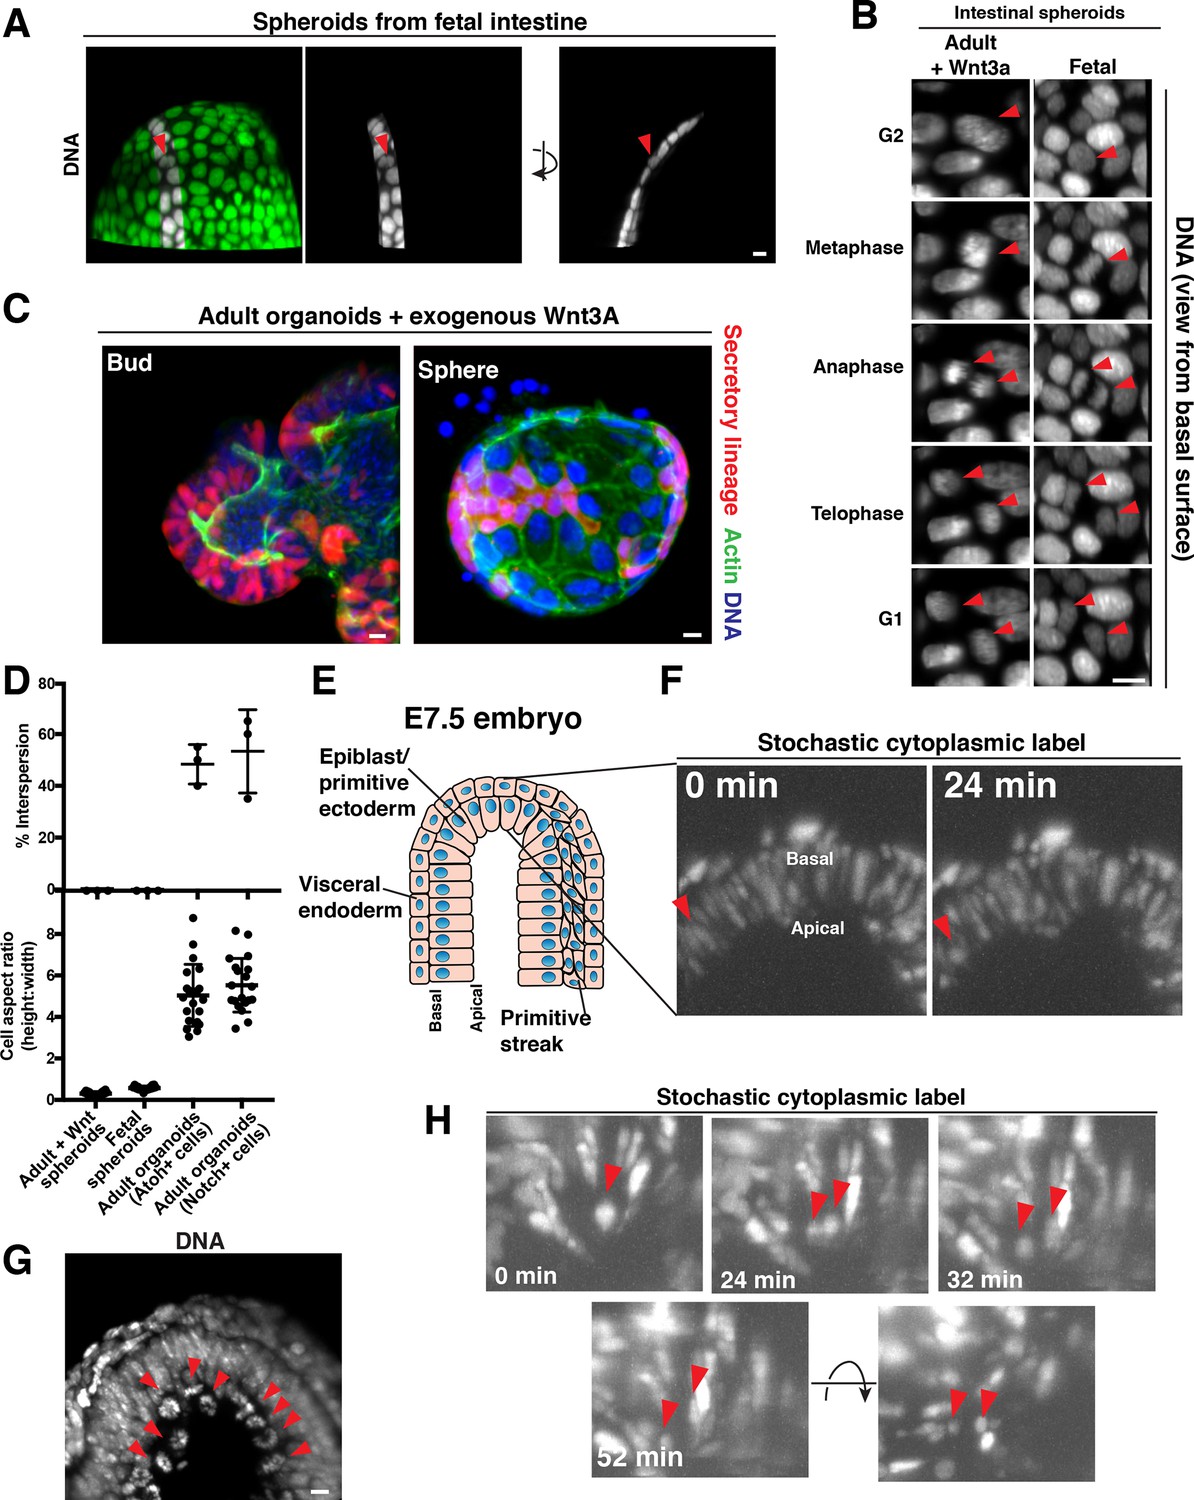
Cellular aspect ratio is a key parameter for division-coupled interspersion in the intestine and the embryo.
(A) 3D reconstruction of a spherical organoid derived from fetal (E13.5) mouse intestine. DNA: Syto 21 dye, arrowhead: mitotic cell. (B) Frames from 3D reconstructed time-lapse SPIM of chromosome segregation in spheroids cultured in exogenous Wnt3a (left, DNA: H2B-GFP) or derived from fetal intestine (right, DNA: H2B-mScarlet). Arrowheads: dividing cell. Views from the basal surface are shown. (C) Immunofluorescence images of secretory-lineage labeled organoids (Atoh1CreER; R26RFP) grown with buds (left) or as spheres (right) in exogenous Wnt3a. Actin: Alexa 488-phalloidin, DNA: Hoechst 33342. Image scaled with ɣ adjustment. (D) Quantification of the frequency of division-coupled interspersion in three replicates (top, n = 20 divisions per replicate) and cellular aspect ratio (bottom, n = 20). (E) Cartoon depicting the embryonic portion of an E7.5 (late streak) mouse egg cylinder, distal end up. (F) Frames from 3D reconstructed time-lapse SPIM of stochastically labeled cells (RFP + cells of CAGGSCreER; R26Brainbow2.1) in the epiblast/primitive ectoderm. Arrowhead: cell displacing to the apical surface as it enters mitosis. (G) 3D reconstruction of H2B-GFP embryos. Arrowheads: mitotic chromosomes. (H) Frames from 3D reconstructed time-lapse SPIM of stochastically labeled cells (RFP + cells of CAGGSCreER; R26Brainbow2.1) in the epiblast/primitive ectoderm. Arrowheads: dividing cell and nascent daughters, which become separated by an unlabeled cell. Scale bars, 10 µm.
Figure 3—figure supplement 1
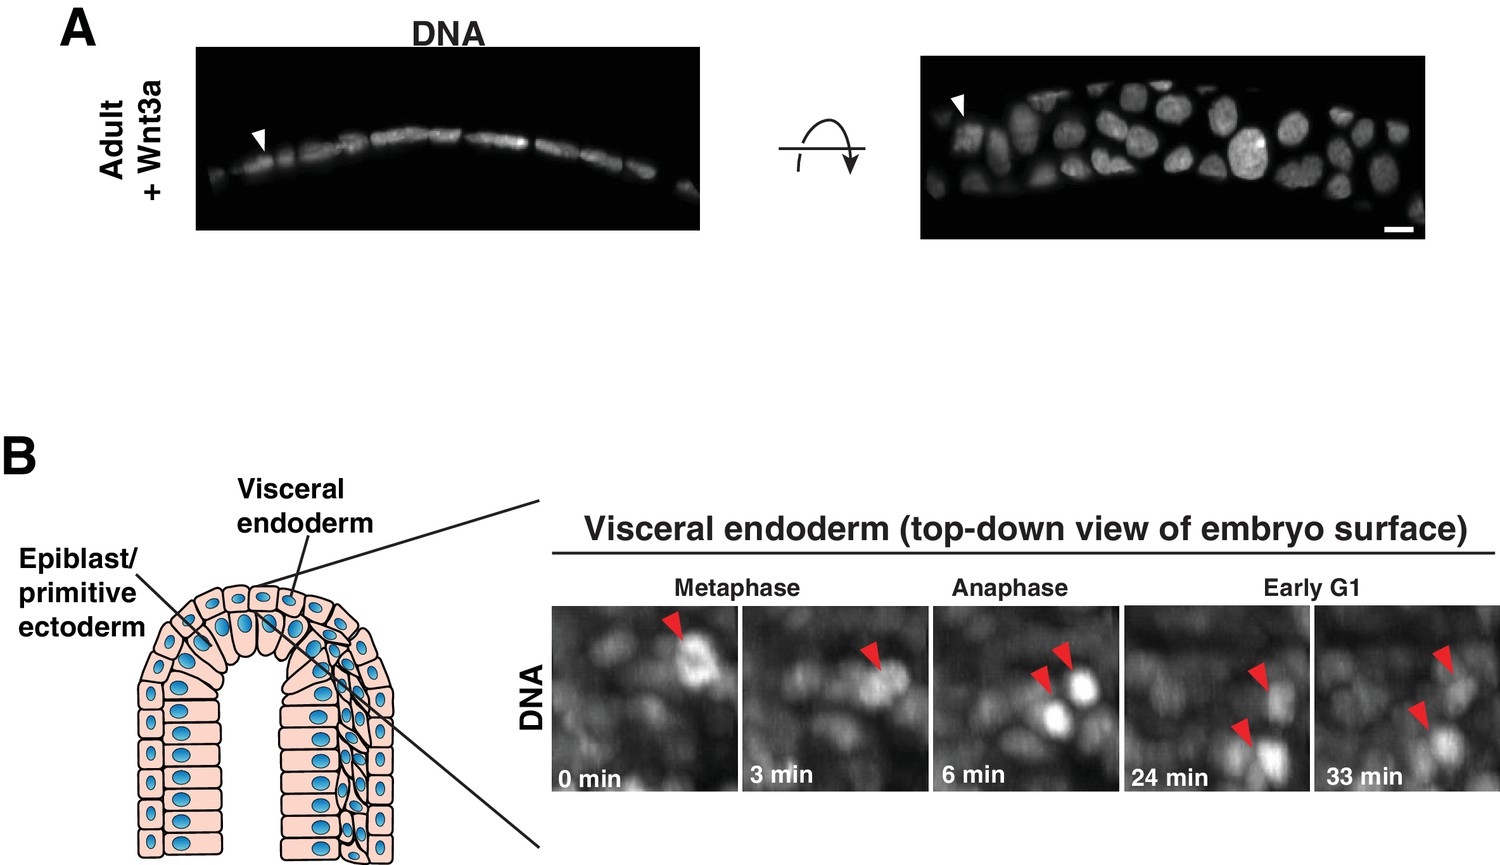
Epithelia with low aspect ratio.
(A) A slice from a 3D reconstruction of a spherical organoid generated by growth in culture with exogenous Wnt3a, shown in two orientations. DNA: H2B-GFP. Arrowhead indicates mitotic cell. Frames from time-lapse imaging of this division are shown in Figure 3B. (B) Frames from time-lapse imaging of division in the visceral endoderm of the E7.5 embryo. DNA: H2B-GFP. Arrowheads indicate mitotic chromosome masses. Scale bar, 10 µm.
Figure 3—video 1
Division in fetal spheroids with a short apical-basal axis.
3D reconstruction from live imaging of a mitotic cell in a fetal spheroid, imaged by SPIM with 40X objectives. DNA labeled with Syto21 dye. A section of the sphere is rotated.
Figure 3—video 2
Division in fetal spheroids.
H2B-mScarlet fetal organoids imaged by SPIM with 40X objectives at 2 min time points. The view from the basal surface is shown.
Figure 3—video 3
Division in the embryonic visceral endoderm.
H2B-GFP E7.5 embryo imaged by SPIM with 40X objectives at 3 min time points. The view from the external surface of the embryo is shown.
Figure 4 with 1 supplement
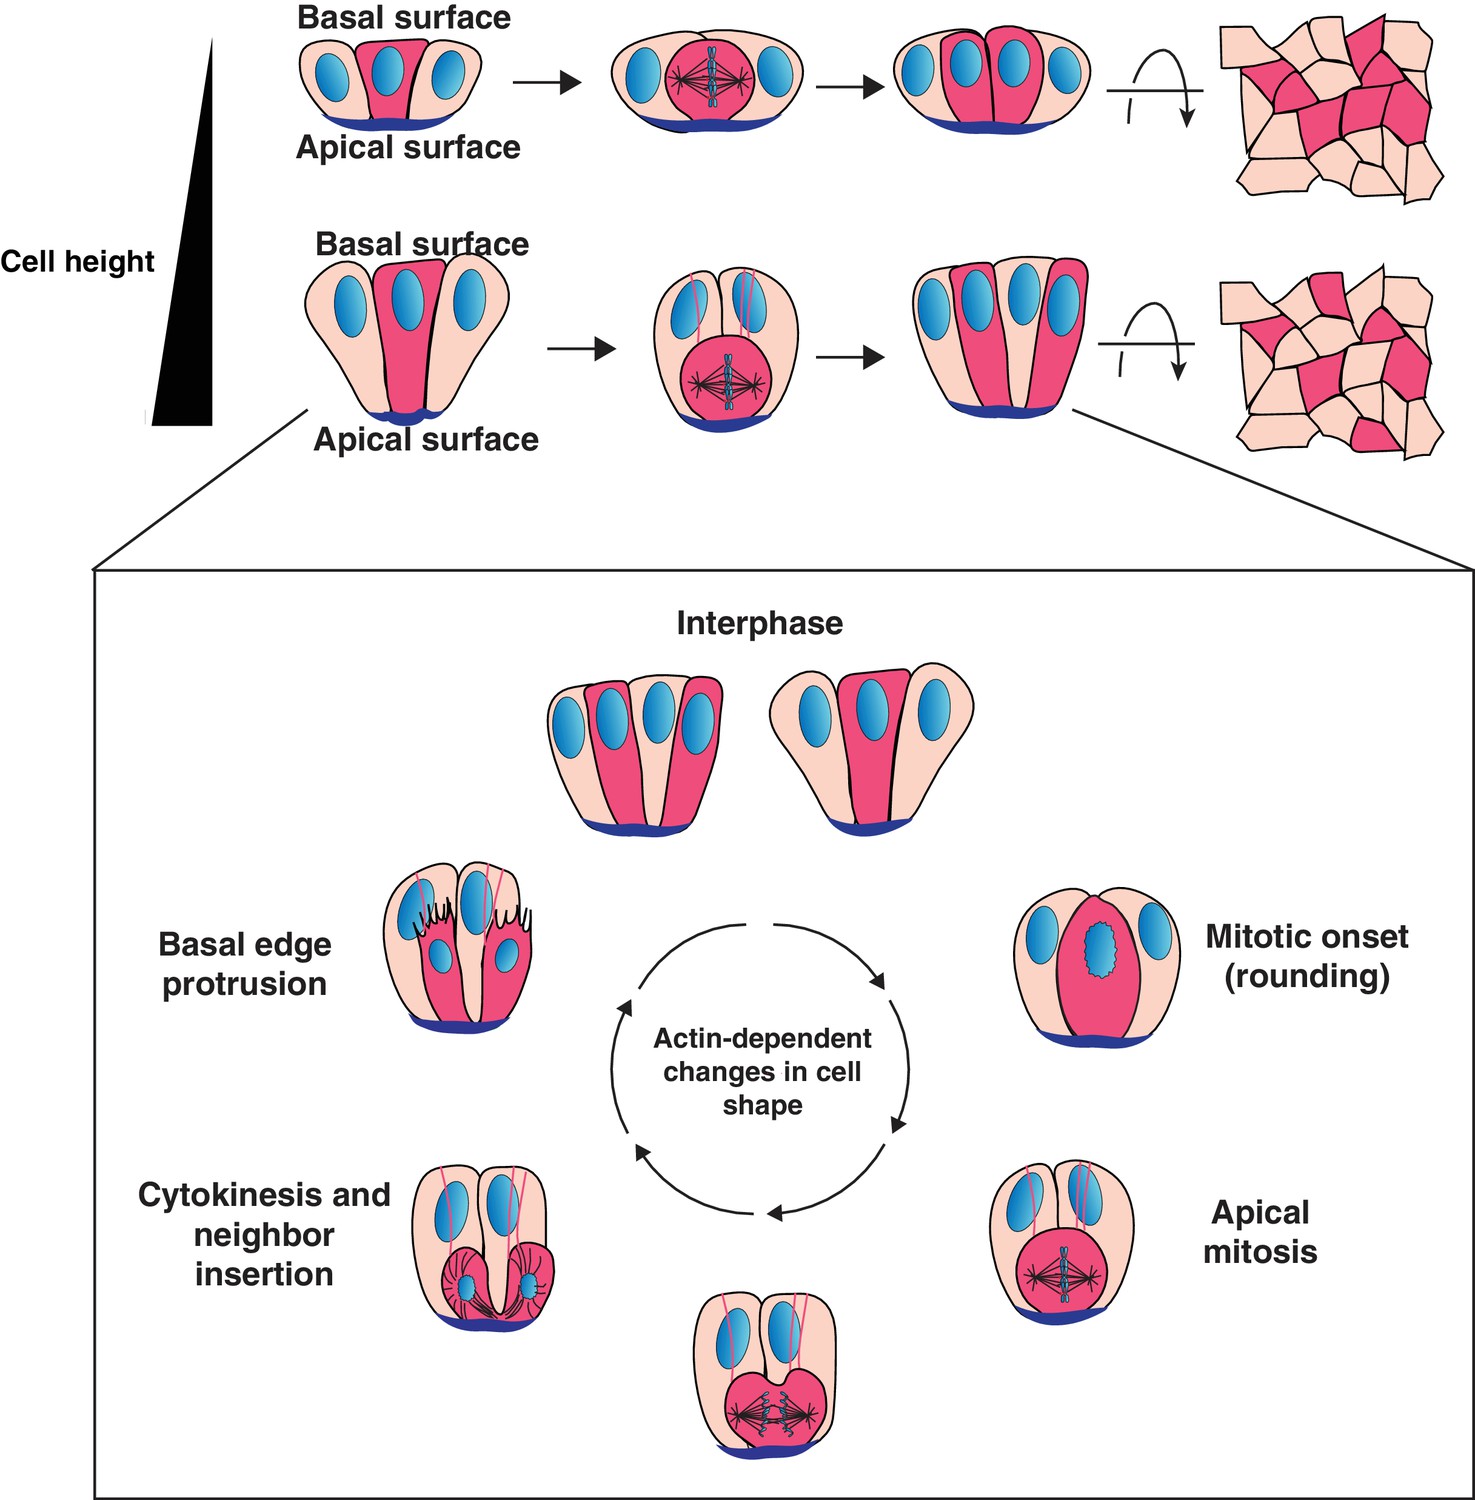
Model for cell progeny patterning in mammalian epithelia.
Top: Cartoon of the influence of cell height on the relative positioning of cells derived from a given progenitor (magenta cells). Bottom: Model for interspersion of cell progeny in elongated epithelia. The basolateral surface of a dividing cell undergoes dramatic actin-dependent changes in cell shape that displace the chromosomes and cell body along the apical-basal axis. Neighboring cells can position within the ingressing cytokinetic furrow, displacing daughter cells from one another as they reinsert onto the basal surface.
Figure 4—figure supplement 1
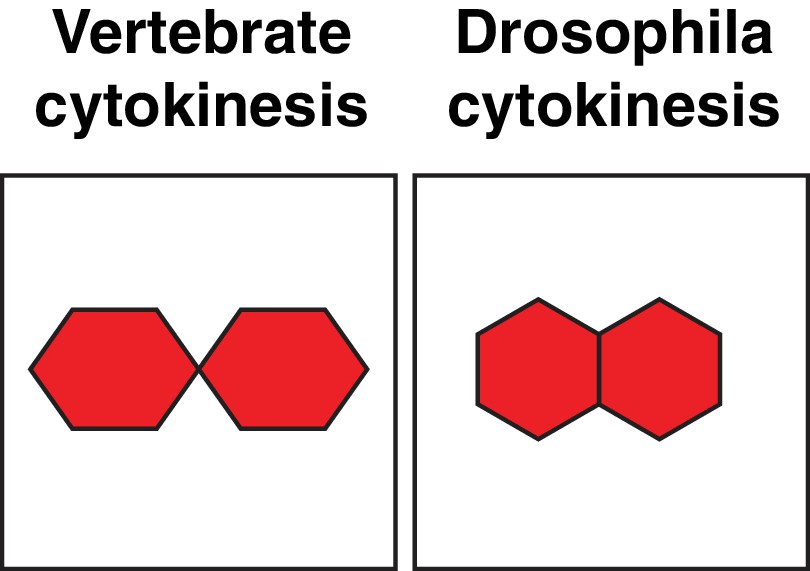
Daughter cell geometries.
Cartoon comparing daughter cell geometries generated by vertebrate and Drosophila cytokinesis, also see (Higashi et al., 2016).
Videos
Video 1
Secretory cell separation during division.
Cells of the secretory lineage (red, Atoh1CreER; R26RFP) interspersed with non-secretory cells (green membranes) imaged by spinning disc confocal with 20X objective at 3 min time points.
Video 2
Stem cell separation during division by insertion of a secretory cell into the cytokinetic furrow.
Cell of the secretory lineage (red, Atoh1CreER; R26RFP) inserts into the furrow of a dividing stem cell (green, Lgr5DTR-GFP). Imaged by SPIM with 40X objectives at 2 min time points. Second clip isolates only the cell of the secretory lineage.
Video 3
Chromosome movements in intestinal organoids.
H2B-mScarlet labeled organoids were imaged by SPIM using 40X objectives at 2 min time points.
Video 4
Cell separation during division in the embryonic epiblast/primitive ectoderm.
An E7.5 mouse embryo was imaged by SPIM with 40X objectives at 4 min time points. Cells expressing cytoplasmic RFP from a CAGGSCreER; R26Brainbow2.1/+ embryo are shown.
Tables
Key resources table
| Reagent type (species) or resource | Designation | Source or reference | Identifiers | Additional information |
|---|---|---|---|---|
| Strain, strain background (Mus musculus) | R26mTmG | Jackson Labs, PMID: 17868096 | MGI: 3716464 | |
| Strain, strain background (Mus musculus) | Vil1Cre-ERT2 | Averil Ma lab, PMID: 15282745 | MGI: 3053826 | |
| Strain, strain background (Mus musculus) | Atoh1CreERT | Jackson labs, PMID: 16958097 | MGI: 3686985 | |
| Strain, strain background (Mus musculus) | R26RFP | Jackson Labs, PMID: 20023653 | MGI: 3809524 | |
| Strain, strain background (Mus musculus) | Lgr5DTR-GFP | de Sauvage Lab (Genentech), PMID: 21927002 | MGI: 5294798 | |
| Strain, strain background (Mus musculus) | C57BL/6J | Jackson Labs | ||
| Strain, strain background (Mus musculus) | R26Brainbow2.1 | Jackson Labs, PMID: 20887898 | MGI: 164644 | |
| Strain, strain background (Mus musculus) | H2B-GFP | Jackson Labs, PMID:15619330 | MGI: 109836 | |
| Strain, strain background (Mus musculus) | Notch1CreERT2(SAT) | PMID: 21991352 | MGI: 5304912 | |
| Antibody | Rabbit anti-ZO-1 | Thermo Fisher | RRID:AB_2533456 | |
| Chemical compound, drug | Alexa 488-Phalloidin | Thermo Fisher | A12379 | |
| Chemical compound, drug | Hoechst 33342 | Molecular Probes | H3570 | |
| Chemical compound, drug | See Table 1 for pharmacological inhibitors | |||
| Software, algorithm | MicroManager | Open Imaging, PMID: 20890901 |
Table 1
Small molecules used in this study.
https://doi.org/10.7554/eLife.36739.033| Molecule | Function | Source | Cat # | Final concentration |
|---|---|---|---|---|
| Nocodazole | Microtubule inhibitor | Calbiochem | 487929 | 5 µM |
| Latrunculin A | F-actin inhibitor | Calbiochem | 428026 | 4 µM |
| SiR DNA | DNA dye | Cytoskeleton Inc | CY-SC007 | 1 µM |
| Verapamil | Efflux pump inhibitor | Cytoskeleton Inc | CY-SC007 | 10 µM |
| MG132 | Proteasome inhibitor | Sigma | ML449 | 10 µM |
| STLC | Eg5 inhibitor | Sigma | 164739 | 10 µM |
| RO-3306 | CDK inhibitor | Calbiochem | 217699 | 10 µM |
| AZ3146 | Mps1 inhibitor | Tocris | 3994 | 2 µM |
| BI2536 | Plk1 inhibitor | Selleck Biochem | S1109 | 10 µM |
| Tamoxifen | Cre-ER inducer (applied for 6–16 hr in culture) | Sigma | T5648 | 1 µM (Atoh1CreER and Notch1CreER) 0.1 µM (Vil1CreER) |
| S -- Blebbistatin | Myosin II inhibitor | Abcam | ab120491 | 200 µM |
| S -- Blebbistatin | Myosin II inhibitor | Cayman | 13013 | 200 µM |
| Y27632 | ROCK inhibitor | Selleck | S1049 | 10 µM |
| DAPT | Gamma-secretase (Notch) inhibitor | Abcam | ab120633 | 50 µM |
Additional files
-
Transparent reporting form
- https://doi.org/10.7554/eLife.36739.034
Download links
A two-part list of links to download the article, or parts of the article, in various formats.
Downloads (link to download the article as PDF)
Open citations (links to open the citations from this article in various online reference manager services)
Cite this article (links to download the citations from this article in formats compatible with various reference manager tools)
Cellular aspect ratio and cell division mechanics underlie the patterning of cell progeny in diverse mammalian epithelia
eLife 7:e36739.
https://doi.org/10.7554/eLife.36739


