Germ layer-specific regulation of cell polarity and adhesion gives insight into the evolution of mesoderm
- University of Florida, United States
Figures
Figure 1 with 1 supplement
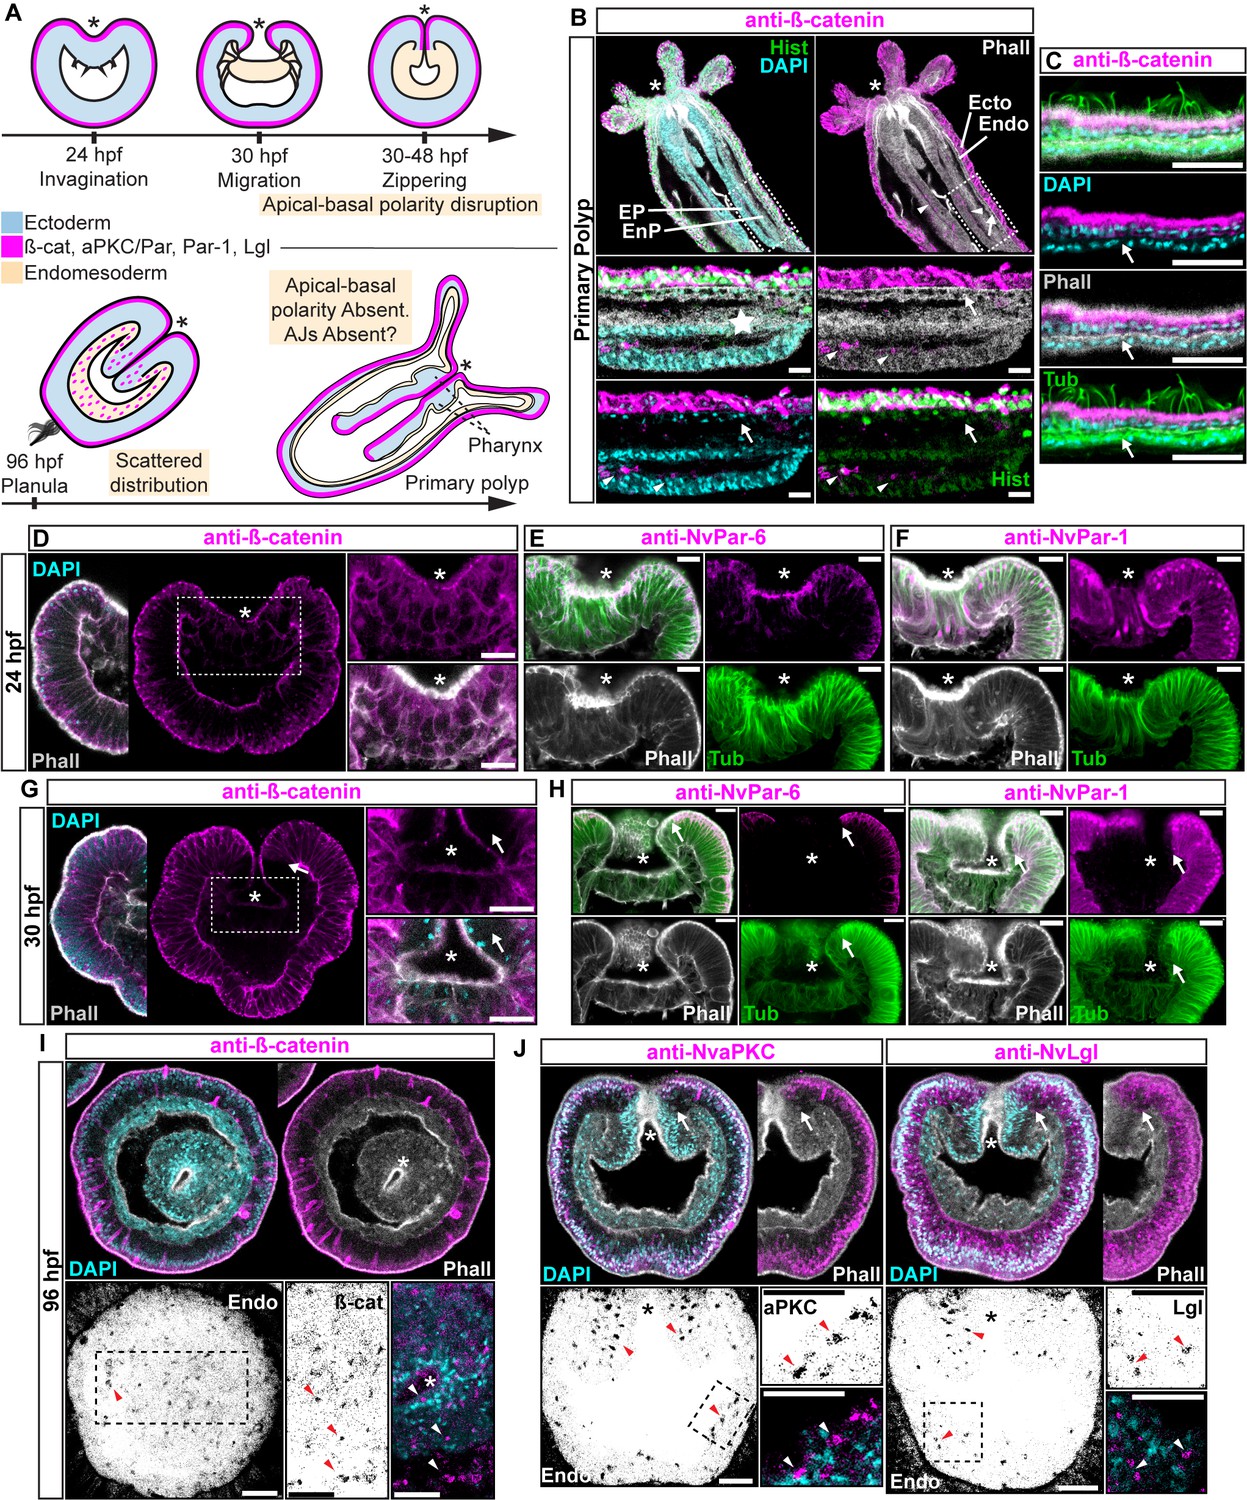
Components of the Par system and ß-catenin are downregulated from the N. vectensis endomesoderm during gastrulation.
(A–F) Confocal images of immunofluorescent staining (IFS) of lateral views of gastrulation embryos (animal pole up). The * marks the site of gastrulation in all cases. Samples are counterstained with Phalloidin (Phall) staining (white) to show cell boundaries, DAPI to visualize cell nuclei (blue), and Tubulin antibody (Tub) staining is shown as counterstain (green). All images are a single optical section from a z-stack confocal series. All scale bars, 20 µm. (A) Summary diagram depicting the localization of ß-catenin and Par proteins at the observed stages. Pale boxes denote changes observed in the endomesoderm. (B) IFS for ß-catenin (magenta) in primary polyps. High magnification images from boxed region (endomesoderm, Endo) are shown on the bottom. Arrows indicate the absence of ß-catenin expression in the endomesoderm. Arrowheads indicate the ß-catenin expression in the ectodermal pharynx (EP). Star indicates the endomesodermal pharynx (EnP). Histone antibody (Hist) staining is shown as counterstain to show the penetrability in the fixed tissue. See also Figure 1—figure supplement 1. (C) IFS for ß-catenin (magenta) in the ecto and endomesoderm (arrow) of primary polyps. (D) IFS for ß-catenin (magenta) at 24 hpf shows localization to the apical domain where adherens junctions reside in all cells of the blastula. High magnification images from boxed region (prospective endomesoderm) are shown on the right. (E) IFS for NvPar-6 (magenta) at 24 hpf showing the same sub-cellular localization as ß-catenin (A). High magnification images from boxed region in (A) (prospective endomesoderm) are shown on the right. Merged image shown on upper left. (F) IFS for NvPar-1 at 24 hpf shows a complementary basolateral expression. High magnification images from boxed region (prospective endomesoderm) are shown on the right. (G) IFS for ß-catenin at 30 hpf shows the loss of expression of ß-catenin (magenta) in invaginating endomesoderm (box). The arrow (D–F) marks the boundary between ectoderm and invaginating endomesoderm. High magnification images from boxed region (prospective endomesoderm) are shown on the right. (H) IFS for NvPar-6 and NvPar-1(magenta) at 30 hpf show that all Par proteins are down regulated at the site of gastrulation. IFS for NvPar-6 shows an even earlier down regulation than ß-catenin (D). High magnification images from boxed region (prospective endomesoderm) are shown on the right. Merged image shown on upper left. (I) Oral view of IFS for ß-catenin (magenta) at 96 hpf showing apical localization in overlying ectoderm, but absence in endomesodermal tissues. The two bottom panels show high magnifications of the endomesoderm region (image inverted). Arrowheads indicate the localization of ß-catenin expression (black) in some scattered endomesodermal cells. (J) Lateral view of IFS for NvaPKC and NvLgl (magenta) at 96 hpf showing loss of expression in invaginating epithelial cells. The four bottom panels show high magnifications of the endomesoderm region (image inverted). Arrowheads indicate the localization of NvaPKC and NvLgl proteins (black) in some scattered endomesodermal cells.
Figure 1—figure supplement 1
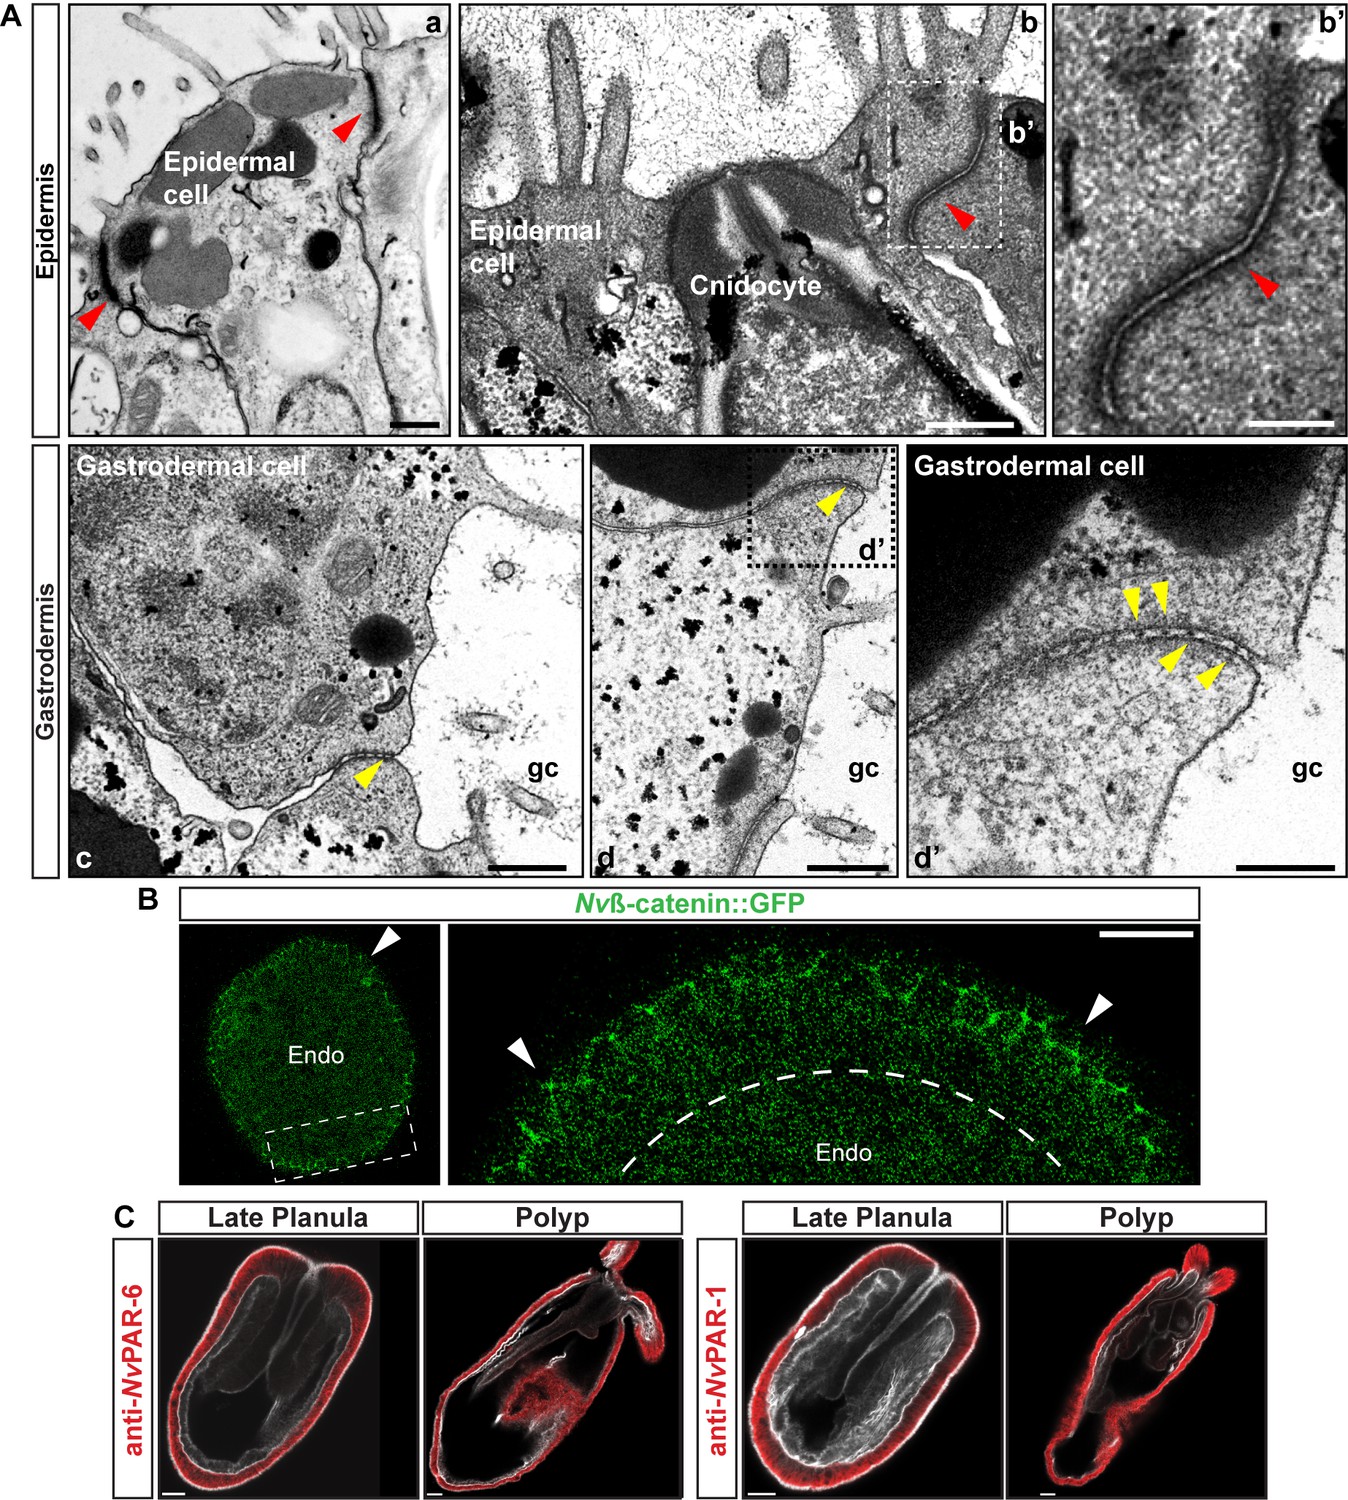
Epidermal and gastrodermal cells are joined by different set of junctional complexes.
(A) TEM micrographs of N. vectensis primary polyps. Epidermal cells (ectodermally derived) are joined most likely by AJs (Red arrowheads). Gastrodermal cells (endomesodermally derived) are interconnected by fewer and shorter contacts, most likely by septate junctions (yellow arrowheads). a and b: two different types of epidermal cells. Note the ectodermally-derived cnidocyte in b. c and d: two different types of gastrodermal cells. b’ and d’ are high magnification images from boxed region in b and d, respectively. gc: gastric cavity. Scale bars in a, b, c, and d: 500 nm. Scale bars in b’ and d’: 200 nm. (B) in vivo localization of Nvß-catenin::GFP after 36 hpf in N. vectensis embryos. Arrowheads indicate the cortical localization of Nvß-catenin::GFP (AJs) in the ectoderm that was not observed in the endomesoderm. High magnification image from boxed region is shown on the right. Scale bars: 20 µm. (C) Immunofluorescent staining for NvPar-6 and NvPar-1(red) at late planula and polyp stages show that both Par proteins are absented from the endomesoderm. Phalloidin is shown in gray. Histone and tubulin antibody staining are shown in Figure 1B and C as counterstain to show the penetrability in the fixed tissue. Scale bars: 20 µm.
Figure 2 with 1 supplement
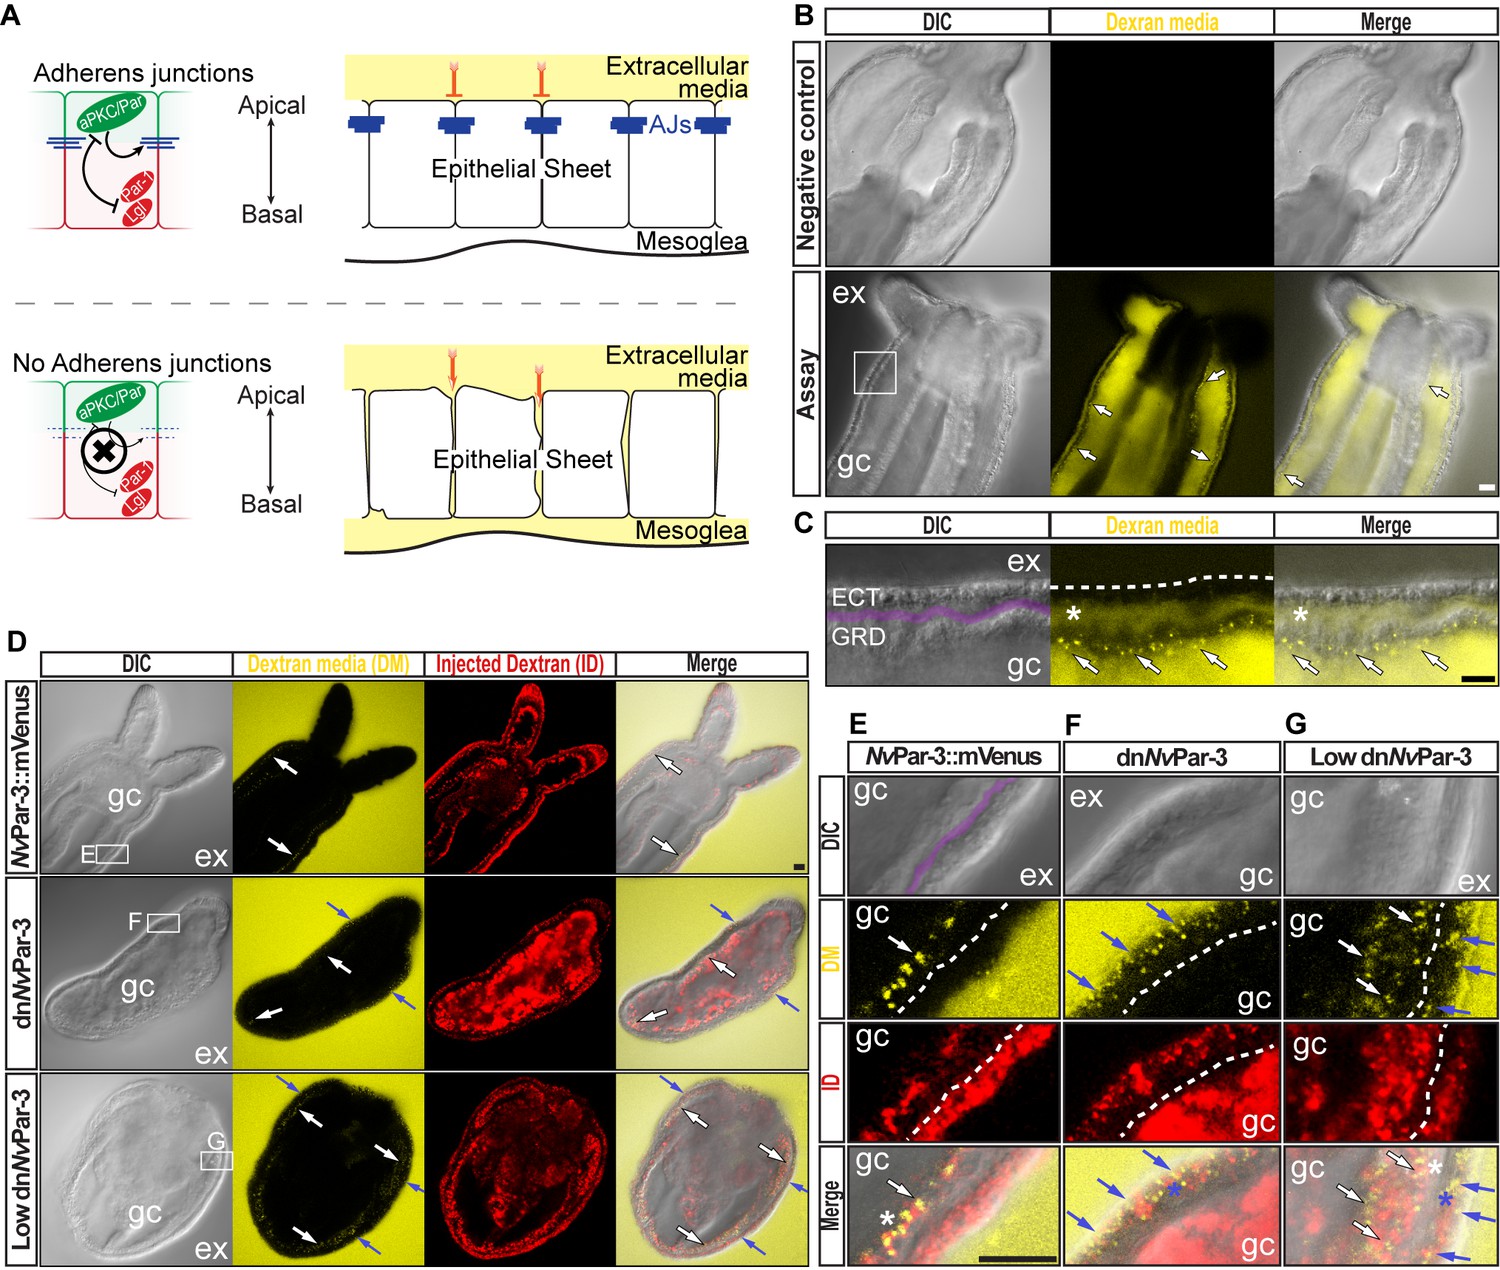
The aPKC/Par complex maintains Adherens Junctions (AJs) of ectodermal epithelial cells.
Arrows indicate the direction of the flow: from gastric cavity (gc) to mesoglea (white) and from external media (ex) to ectoderm (blue). Dashed lines indicate the base of the epidermis. All images are single optical section from the z-stack confocal series. Scale bars, 20 µm. (A) Diagram depicting the hypothesis that when the aPKC/Par complex is functional (top row), AJs are present (blue stripes) and a paracellular epithelial barrier is formed. When aPKC/Par complex is not functional (bottom row), AJs are disrupted, the epithelial barrier is perturbed, and the extracellular solution moves paracellularly into the mesoglea. (B) Penetration assay of wild type (uninjected) primary polyps at low magnification showing the movement of 10,000 MW fluorescent dextran. Top row, no dextran. Bottom row, dextran (yellow) in the gc moves in to the mesoglea through paracellular spaces between gastrodermal cells (arrows). (C) High magnification images from box shown in (B). *: mesoglea (purple band) that separates the ectoderm (ECT, dashed line) from gastrodermis (GDR). Note the dye moving between cells from the gc media (arrows). (D) Low magnification images comparing polyps expressing NvPar-3::mVenus and a dominant negative version of NvPar-3 (dnNvPar-3::mVenus) expressing-embryos. Dextran media (DM; extracellular) is pseudo-colored yellow. Dextran (red) was co-injected with mRNAs to label the cells and differentiate intracellular regions. mVenus channel was omitted for better visualization (shown in Figure 2—figure supplement 1). Lower concentrations of dnNvPar-3 were injected to preserve endomesodermal tissues. Note that the dextran media was found between the cells labeled in red. See also Figure 3—figure supplement 1 for dnNvPar-3 description. (E) High magnification images from (E) boxed region in (D). Purple band depicts Mesoglea. (F) High magnification images from (F) boxed region in (D). (G) High magnification images from (G) boxed region in (D). *: Paracellular spaces of both, the epidermis (blue) and gastrodermis (white).
Figure 2—figure supplement 1
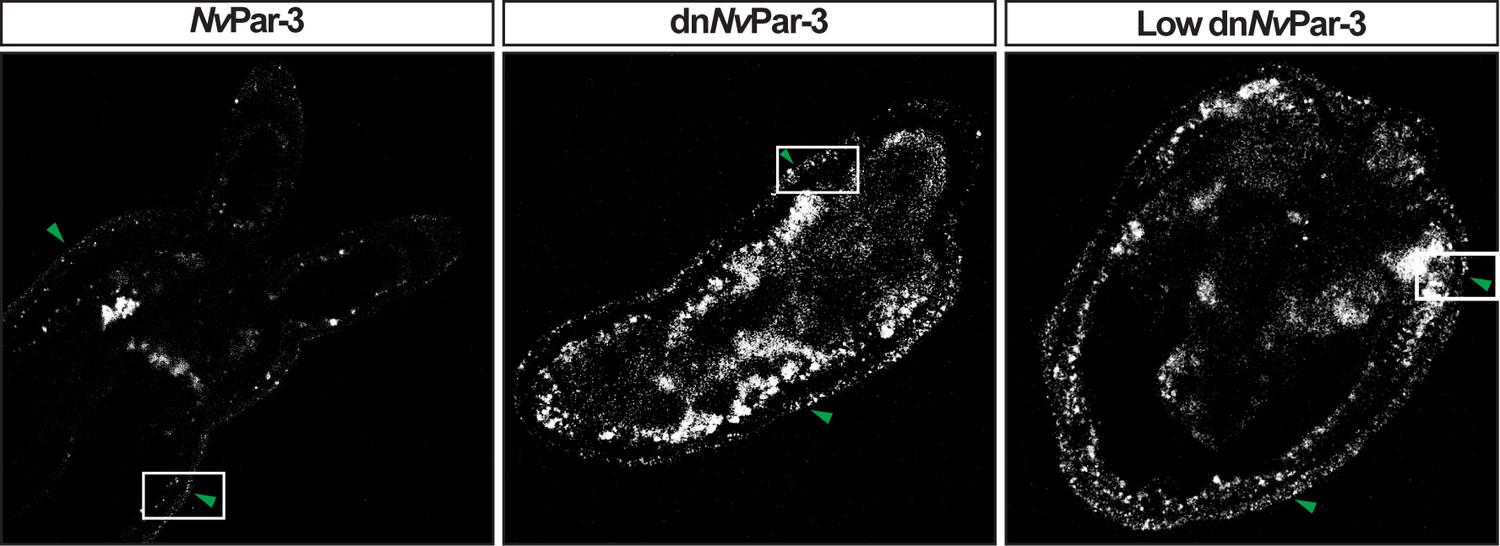
mVenus protein expression related to Figure 2.
mVenus channel for NvPar-3::mVenus (green arrow) and dnNvPar-3::mVenus (green arrow) expressing-embryos shown in Figure 2. Laser intensity and gain were increased to allow visualization; however, signal noise from other channels and animal autofluorescence were also increased.
Figure 3 with 9 supplements

Ectodermal NvaPKC/Par complex polarity regulates the epithelial integrity of both ecto- and endomesoderm.
(A) IFS for NvaPKC at 4 hpf showing that the aPKC inhibitor (Sigma P1614) blocks cytokinesis but not cell cycle. (B) in vivo expression of dnNvPar-1 shows precocious localization to zones of cell contact during cleavage stages, well before wild-type NvPar genes do. See also Figure 3—figure supplement 1A and Figure 3—figure supplement 2. (C) Diagram depicting the suggested the working hypothesis. (D) CRISPR/Cas9 knock-out for NvPar-6 and NvPar-3 at 48 hpf. Controls show no effect on gastrulation. Tubulin (Tub), Phalloidin (Phall), and DAPI are used as counterstains. (E) CRISPR/Cas9 mutants: tubulin stained low magnification of CRISPR phenotype. High magnification images from boxed region shows mesenchymal-like cells. Arrowheads indicate filopodia-like structures. Number of cases observed for each gene are shown. See also Figure 3—figure supplement 1, Figure 3—figure supplements 3–6, and Figure 3—video 1. Morphology is shown by DAPI, Tub, and Phall IFS. Except for 3B and 3D, all images are single optical sections from the z-stack confocal series. (B) and (D) are 3D reconstructions from a z-stack confocal series. All scale bars, 20 µm.
Figure 3—figure supplement 1
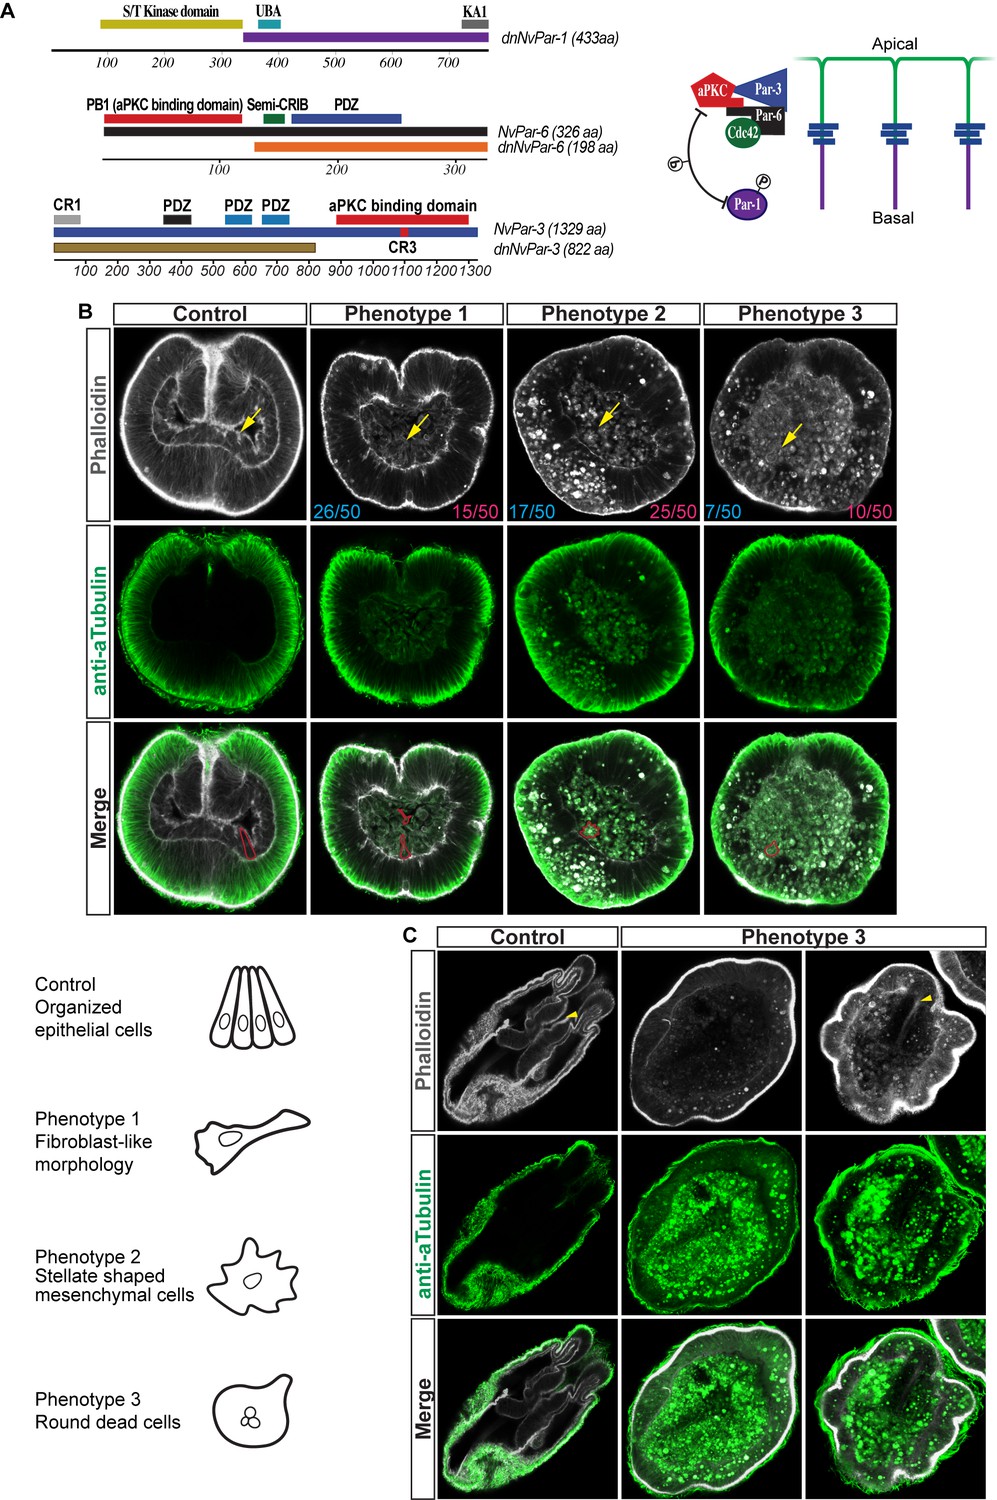
Disruption of the aPKC/Par complex in N. vectensis embryos.
(A) Diagram depicting the modifications made to NvPar-1, NvPar-6, and NvPar-3 sequence to generate the dominant negative version of each protein (dnNvPar-1, dnNvPar-6, and dnNvPar-3, respectively), which lack the putative interaction domain with NvaPKC. In the right, a diagram depicts the localization of NvPar-1, NvaPKC, NvPar-6, and NvPar-3 proteins in epithelial cells. The putative interaction with NvaPKC, restricts the localization of NvPar-6 and NvPar-3 strictly to the apical cortex of the cell, and NvPar-1 to the lateral cortex of the cell. See also Figure 3—figure supplements 5 and 6. (B) Immunofluorescent staining for Tubulin and Phalloidin at gastrula stage of embryos expressing dnNvPar-6, and dnNvPar-3. The overexpression of either dnNvPar-6::mVenus or dnNvPar-3::mVenus induced phenotypes where the endomesodermal cells (yellow arrows) are disorganized during gastrulation. We observed a disorganized endoderm formed by (1) cells with fibroblast-like morphologies, (2) stellate shaped mesenchymal-like cells, or (3) a mass of round dead cells. Cell morphotypes are outlined in red and their schematic representation is presented below them. The penetrance of the obtained phenotypes when either dnNvPar-6::mVenus (blue) or dnNvPar-3::mVenus (magenta) are overexpressed is indicated for each case. (C) Immunofluorescent staining for Tubulin and Phalloidin at polyp stage of embryos expressing dnNvPar-6, and dnNvPar-3. We observed ‘Endoderm-less’ polyps from phenotype 3: absence of an organized endoderm, tentacles or complete mesenteries in injected animals that survived to this stage (2 weeks post fertilization). A recognizable ectodermal pharynx (yellow arrowheads) was detected in some of these polyps.
Figure 3—figure supplement 2

Co-immunoprecipitation of NvPar proteins using a NvPar-1 specific antibody.
Co-IP experiments show that NvPar-1 interacts with NvaPKC and NvPar-6 during N. vectensis development. Three bands labeled with NvPar antibody were observed around 80 KD, suggesting different phosphorylation states of this protein that may be product −1 of NvaPKC activity. Negative (IgG line) and Positive controls (Input and Supernatant) are also shown. Numbers and arrowheads in the first column indicate the molecular weight in KD.
Figure 3—figure supplement 3
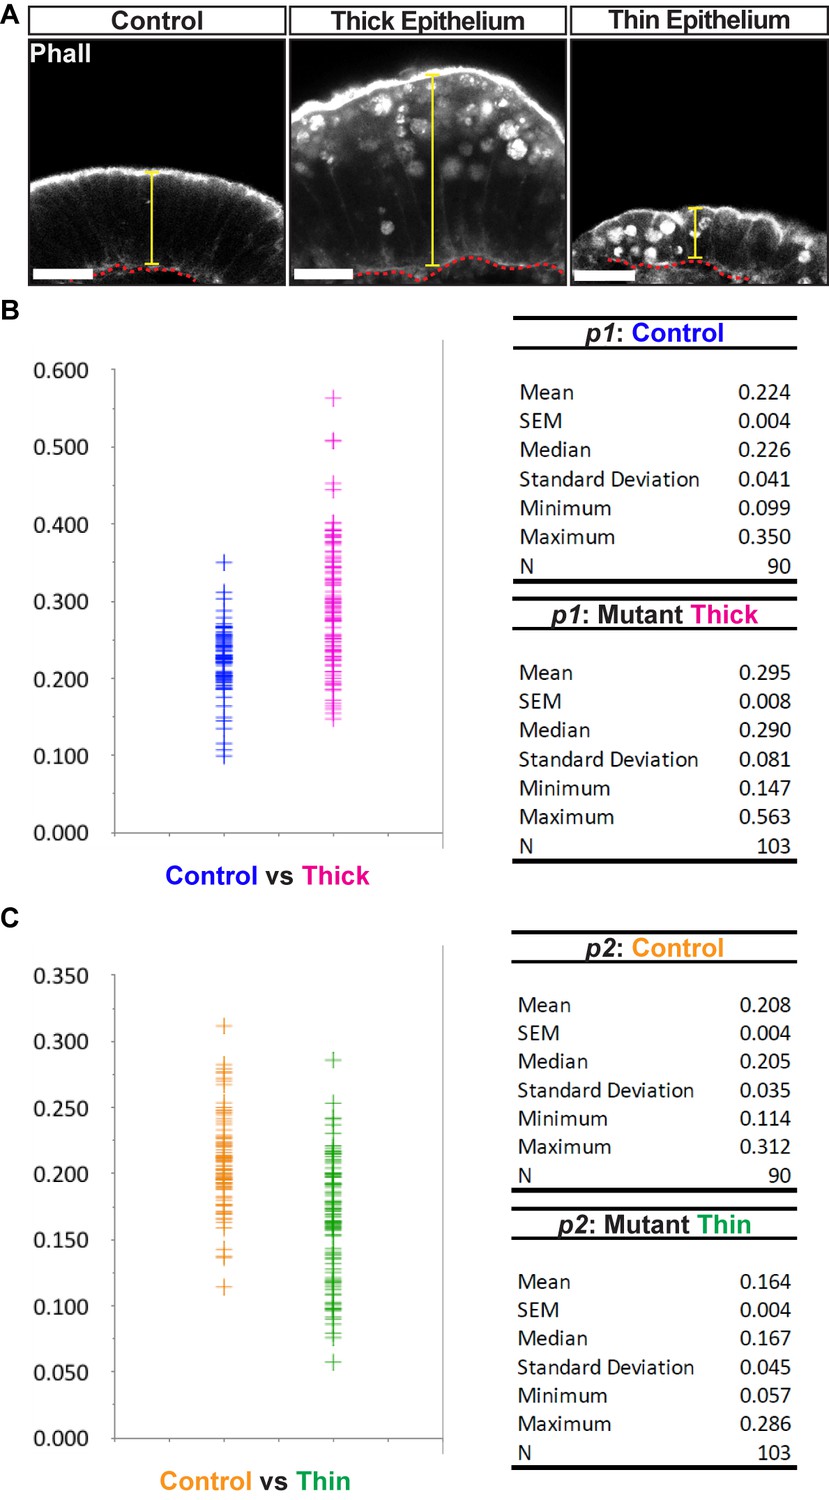
Different ectodermal thickness observed in CRISPR/Cas9 mutants.
(A) Control and affected (thick and thin) epithelia were aligned at the base of the ectoderm (red line) for better visualization. Morphology is shown by Phalloidin staining. Yellow line depicts different cell length (thickness). (B) Dot plot displaying the range of phenotypes observed in thickness (p1 = cell length/embryonic diameter) of the mutant thick epithelium compared to controls. Numerical data are displayed at the right. Mutant thick p1 was larger than control p1 (p-value=8.14E-11). (C) Dot plot displaying the range of phenotypes observed in thickness (p2 = cell length/embryonic diameter) of the mutant thin epithelium compared to controls. Numerical data are shown at the right. Mutant thin p2 was smaller than control p2 (p-value=3.00E-11). The observed changes may be an abnormality caused by the loss of epithelial homeostasis. For detail on the measurements, see also Figure 3—figure supplement 7. Values and statistics can be found in Figure 3—figure supplement 3—source data 1.
-
Figure 3—figure supplement 3—source data 1
Measures and statistical analyses related to Figure 3—figure supplement 3.
- https://doi.org/10.7554/eLife.36740.011
Figure 3—figure supplement 4
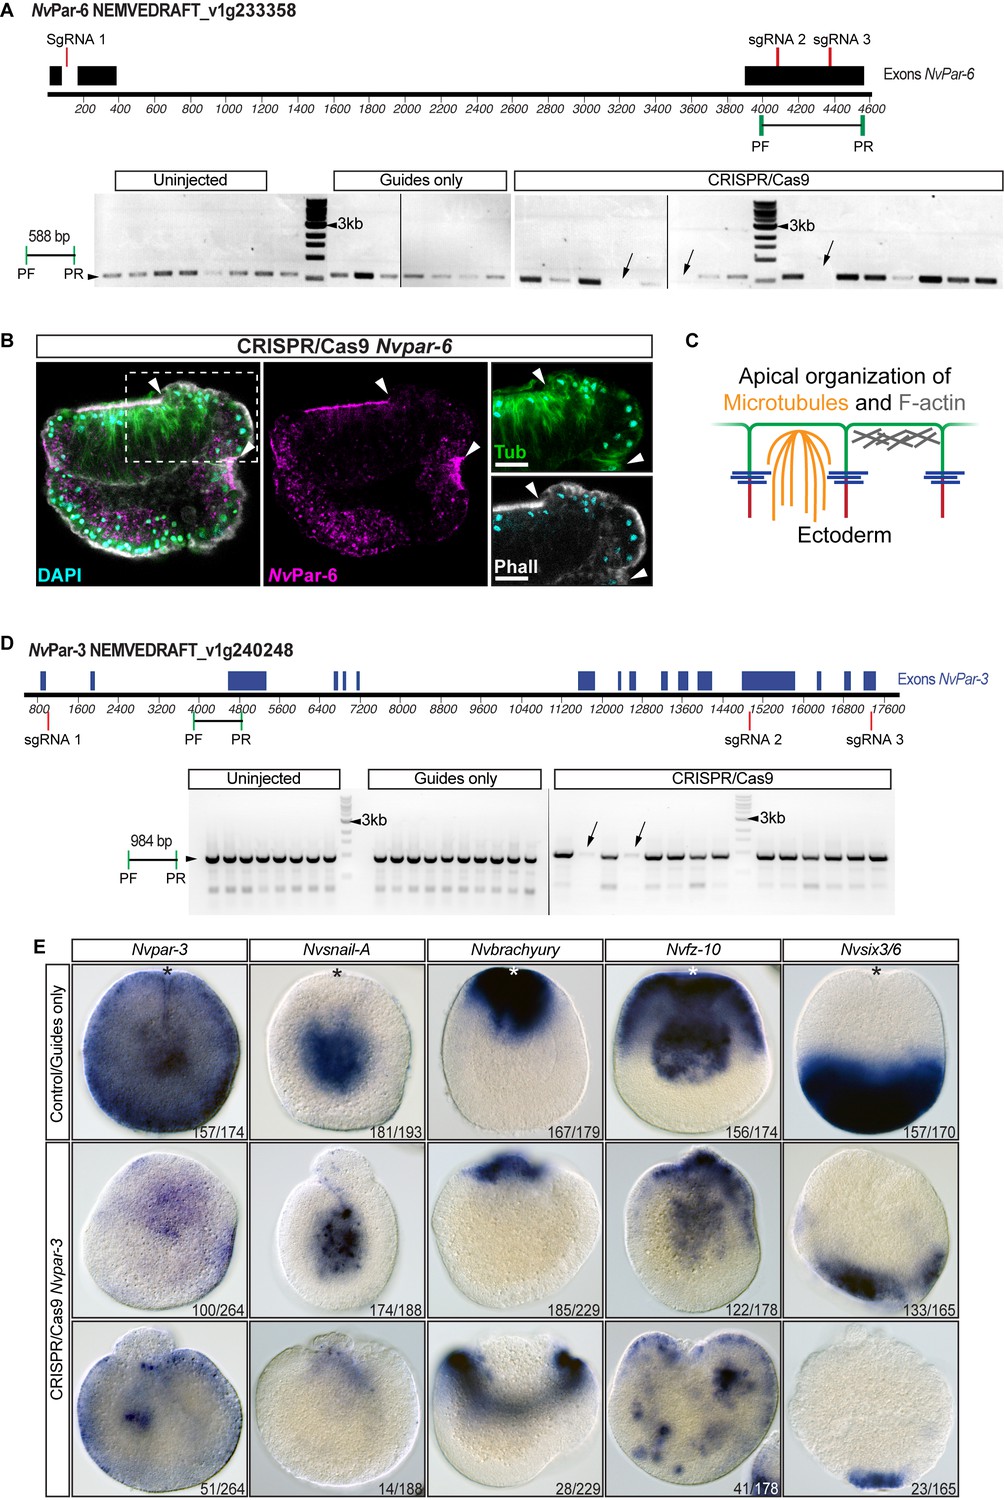
CRISPR/Cas9 mediated mutagenesis of Nvpar-6 and Nvpar-3.
(A) The position of the sgRNAs (red) and primers (green) used for the PCR assay are shown on the diagram depicting the genomic sequence of Nvpar-6. Note the absence of fragments of Nvpar-6 (arrow) resulting from CRISPR/Cas9 mediated mutagenesis. The presence of other bands suggests mosaicism. Black rectangles correspond to Nvpar-6 exon. PF: primer forward. PF: primer reverse. See also Figure 3—figure supplement 4—source data 1. (B) Immunofluorescent staining for cytoskeleton and NvPar-6 in CRISPR/Cas9 Nvpar-6 knock-out embryos (mosaic phenotype). Arrowheads indicate the absence of NvPar-6. High magnification images are shown on the right. The cytoskeleton is apically organized only where NvPar-6 is apically localized. (C) Diagram depicts the role of aPKC/Par complex (green) on cytoskeleton. (D) The position of the sgRNAs (red) and primers (green) used for the PCR assay are shown on the diagram depicting the genomic sequence of Nvpar-3. Note the absence/truncation of fragments of Nvpar-3 (arrow) resulting from CRISPR/Cas9 mediated mutagenesis. The presence of other bands suggests mosaicism as shown in Figure 3—figure supplement 1E. Blue rectangles correspond to Nvpar-3 exon. PF: primer forward. PF: primer reverse. See also Figure 3—figure supplement 4—source data 1. (E) In situ hybridization of Nvpar-3 knockout embryos (Cas9 and gRNAs) compared with control embryos at 40 hpf. The disruption of the N. vectensis Par/aPKC complex modified the morphology but did not modify the cell-fate specification of endomesodermal cells. Lower panel for Nvfz-10 may represent an extreme case of mesenchymal-like endomesoderm.
-
Figure 3—figure supplement 4—source data 2
Full height of the blots shown in Figure 3—figure supplement 4.
White boxes correspond to the sections reported in Figure 3—figure supplement 4.
- https://doi.org/10.7554/eLife.36740.013
Figure 3—figure supplement 5

In vivo localization of dnNvPar-6 protein at different embryonic stages.
Images of the whole embryo correspond to a 3D reconstruction from a z-stack series. Side panels are a single optical section from the z-stack series. An aboral view is shown for all gastrula stages. Yellow arrows indicate the apico-lateral cortex labeled with Lifeact::mTq2. Scale bars: 10 µm. (A) In vivo localization of NvPar-6::mVenus and dnNvPar-6::mVenus at cleavage, blastula, and gastrula stages. NvPar-6::mVenus distributes uniformly at the apical region of the cell but displays a scattered pattern. However, dnNvPar-6::mVenus displays stronger cortical localization due to its interaction with NvCdc42 at the apical and apico-lateral cortex of the cells. This was confirmed by their co-expression with NvCdc42::mCherry. White arrowheads indicate the scattered localization of NvPar-6::mVenus. White arrows indicate the cortical and stronger localization of dnNvPar-6::mVenus. (B) In vivo localization of Lifeact::mTq2 in NvPar-6::mVenus and dnNvPar-6::mVenus expressing embryos shown in (A) at cleavage, blastula, and gastrula stages. The actin cytoskeleton was also affected by the overexpression of dnNvPar-6::mVenus. (C) In vivo co-distribution of NvCdc42::mCherry with NvPar-6::mVenus at blastula and gastrula stages. (D) In vivo co-distribution of NvCdc42::mCherry with dnNvPar-6::mVenus at blastula and gastrula stages. NvCdc42::mCherry localization is also affected when dnNvPar-6::mVenus is overexpressed. (E) Graphical summary of the observed results for NvPar-6::mVenus and dnNvPar-6::mVenus.
Figure 3—figure supplement 6

In vivo localization of dnNvPar-3 protein at different embryonic stages.
Images of the whole embryo correspond to a 3D reconstruction from a z-stack series. Side panels are a single optical section from the z-stack series. An aboral view is shown for all gastrula stages. Yellow arrows indicate the apico-lateral cortex labeled with Lifeact::mTq2. Scale bars: 10 µm. (A) In vivo localization of NvPar-3::mVenus and dnNvPar-3::mVenus at cleavage, blastula, and gastrula stages. dnNvPar-3 displays broader localization, resembling the localization of NvPar-6 and indicating its release from AJs (compare with NvPar-3). White arrowheads indicate the punctate localization of NvPar-3::mVenus. White arrows indicate the broader localization of dnNvPar-3::mVenus. (B) In vivo localization of Lifeact::mTq2 in NvPar-3::mVenus and dnNvPar-3::mVenus expressing embryos shown in (F) at cleavage, blastula, and gastrula stages. The actin cytoskeleton was also affected by the overexpression of dnNvPar-3::mVenus. (C) In vivo co-distribution of NvCdc42::mCherry with NvPar-3::mVenus at blastula and gastrula stages. (D) In vivo co-distribution of NvCdc42::mCherry with dnNvPar-3::mVenus at blastula and gastrula stages. NvCdc42::mCherry localization is not affected when dnNvPar-3::mVenus is overexpressed. (E) Graphical summary of the observed results for NvPar-3::mVenus and dnNvPar-3::mVenus.
Figure 3—figure supplement 7

Morphometric measurements methodology.
Schematic representation of the morphometric measurements used to compare the epithelial thickness between different treatments. In control embryos, two perpendicular axes were determined: Axis 1 corresponds to the axis in parallel with the Oral-Aboral axis of the embryo. Axis 2 was established as the axis perpendicular to the Axis 1. For experimental embryos, cells of the ‘mesenchymal endoderm’ were asymmetrically distributed inside the lumen of the embryo and the ectoderm presented thickened and thinned epithelium. Axis 1 was defined as the axis parallel to the thickened epithelium and the Axis 2 as the axis parallel to the thinned epithelium. ‘daxis1’ and ‘daxis2’ correspond to the diameter (d; µm) of the embryo parallel to the Axis 1 and Axis 2, respectively. ‘xcell1’ and ‘xcell2’ represent the average values for the apicobasal (A–B) length (µm) of the cells (epithelial thickness) in parallel to the Axis 1 and Axis 2, respectively. Mathematical calculation of epithelial thickness: In order to compare differences in the thickness of ectodermal epithelium between different treatments, ‘xcell1’ and ‘xcell2’ were normalized by the diameter’ daxis1’ and ‘daxis2’, respectively, giving a proportion (p). In mutant embryos, A1 and A2 were not necessarily related to the O/A axis. Thus, first, we assessed if there were differences in the epithelial thickness between the ectodermal epithelium of both axes. In control embryos, the aboral ectodermal epithelium is parallel with A1 and was significantly thicker than the lateral ectodermal epithelium parallel with A2 (p1control> p2control; p-value=0.00036).
Figure 3—video 1
Related to Figure 3E.
3-D rendering of CRISPR phenotype. Tubulin and DAPI are shown in green and magenta, respectively. See also Figure 3—animation 1.
Figure 3—animation 1
Figure 3E z-stack for each separate channel.
https://doi.org/10.7554/eLife.36740.018
Figure 4 with 5 supplements
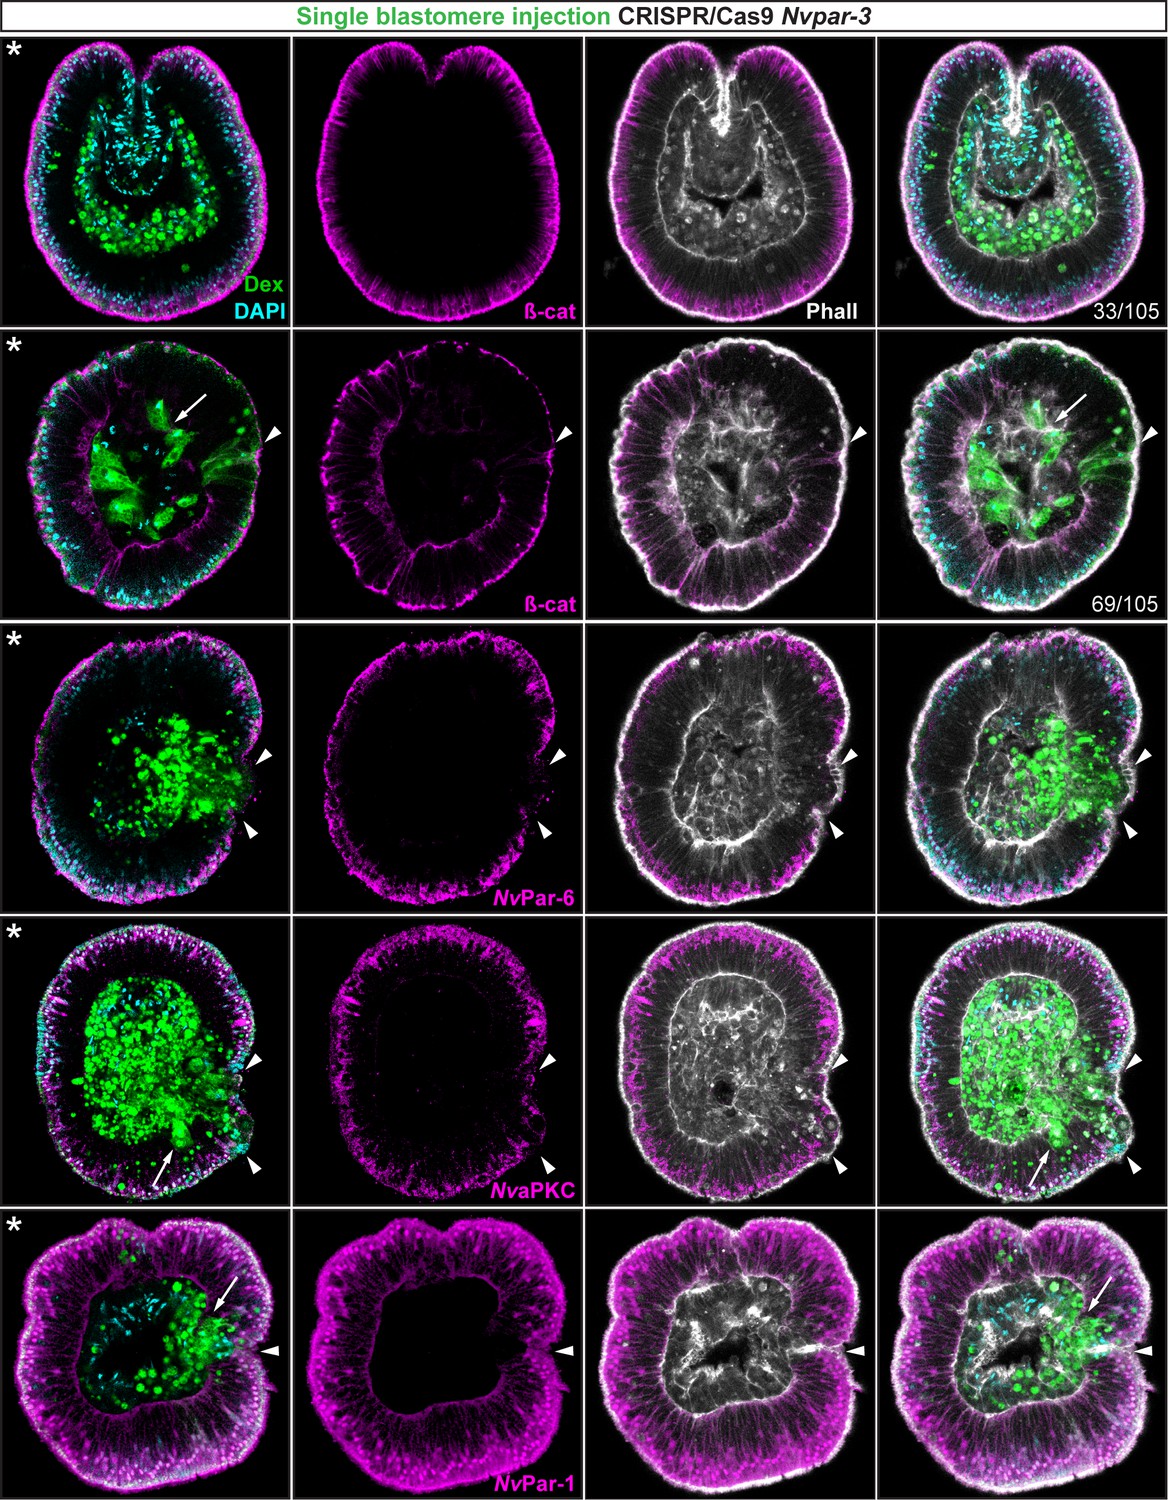
Ectodermal- but not endomesodermal-lineages are affected by single injected-blastomere CRISPR/Cas9 Nvpar-3 knock-outs.
IFS for ß-catenin (ß-cat), NvPar-6, NvaPKC, and NvPar-1 in single injected-blastomere CRISPR/Cas9 NvPar-3 knock-outs at 40 hpf. Streptavidin-Biotin TxRed Dextran (Dex) is shown in green. Arrowheads indicate the absence of the protein and disrupted epithelium. Arrows indicate bottle-like shape cells. * indicate the orientation of the site of gastrulation. See also Figure 4—figure supplements 1 and 2, and Figure 4—video 1. Morphology is shown by DAPI and Phalloidin. All images are single optical sections from the z-stack confocal series.
Figure 4—figure supplement 1
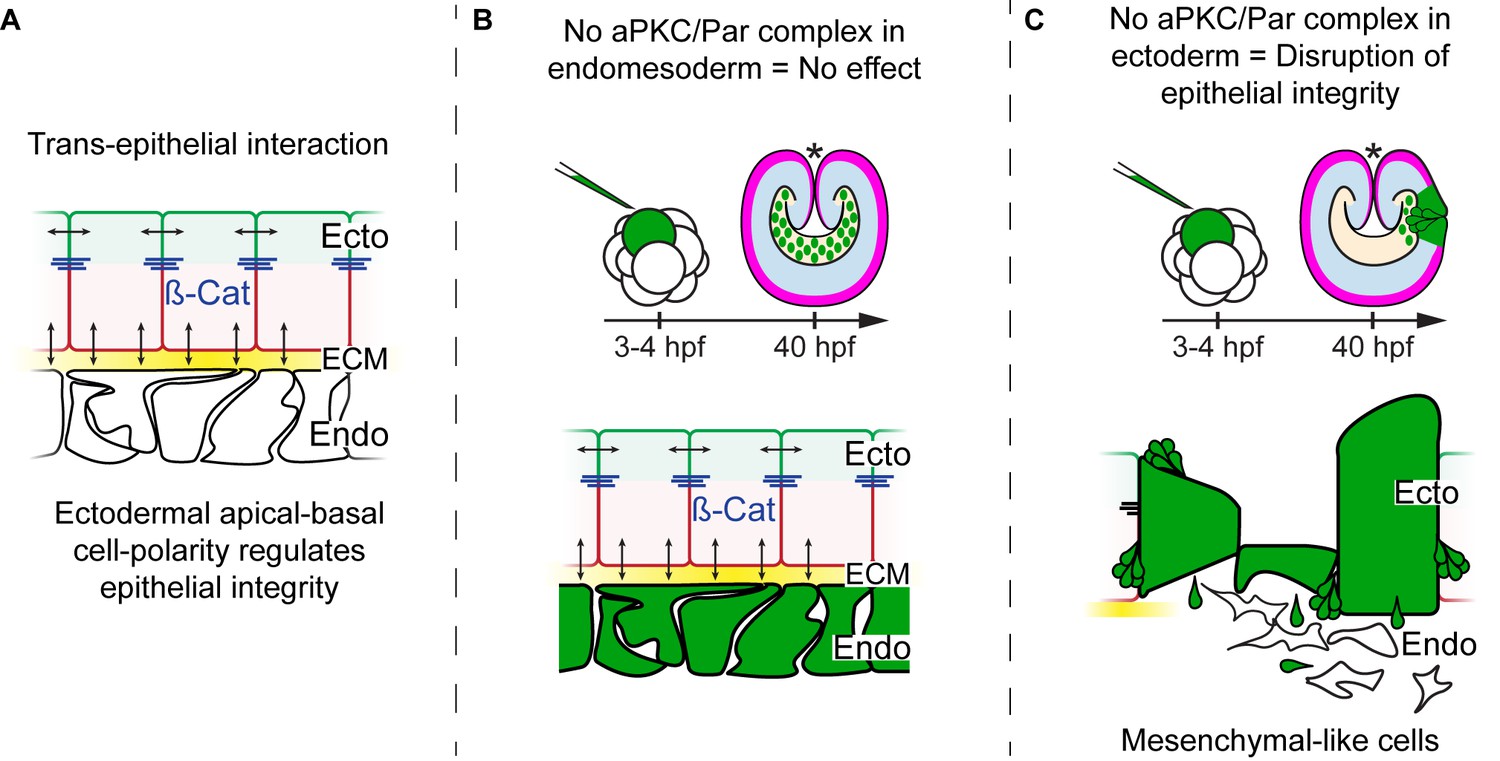
Diagram depicting the hypothesis addressed in Figure 4.
CRISPR/Cas9 NvPar-3 knock-outs in single blastomere injections suggest that the apicobasal polarity of ectodermal cells regulates trans-epithelially the integrity of endomesodermal epithelium. However, no effects are observed when endodermal cells were treated. The cell lineage derived from a single injected-blastomere is in green.
Figure 4—figure supplement 2
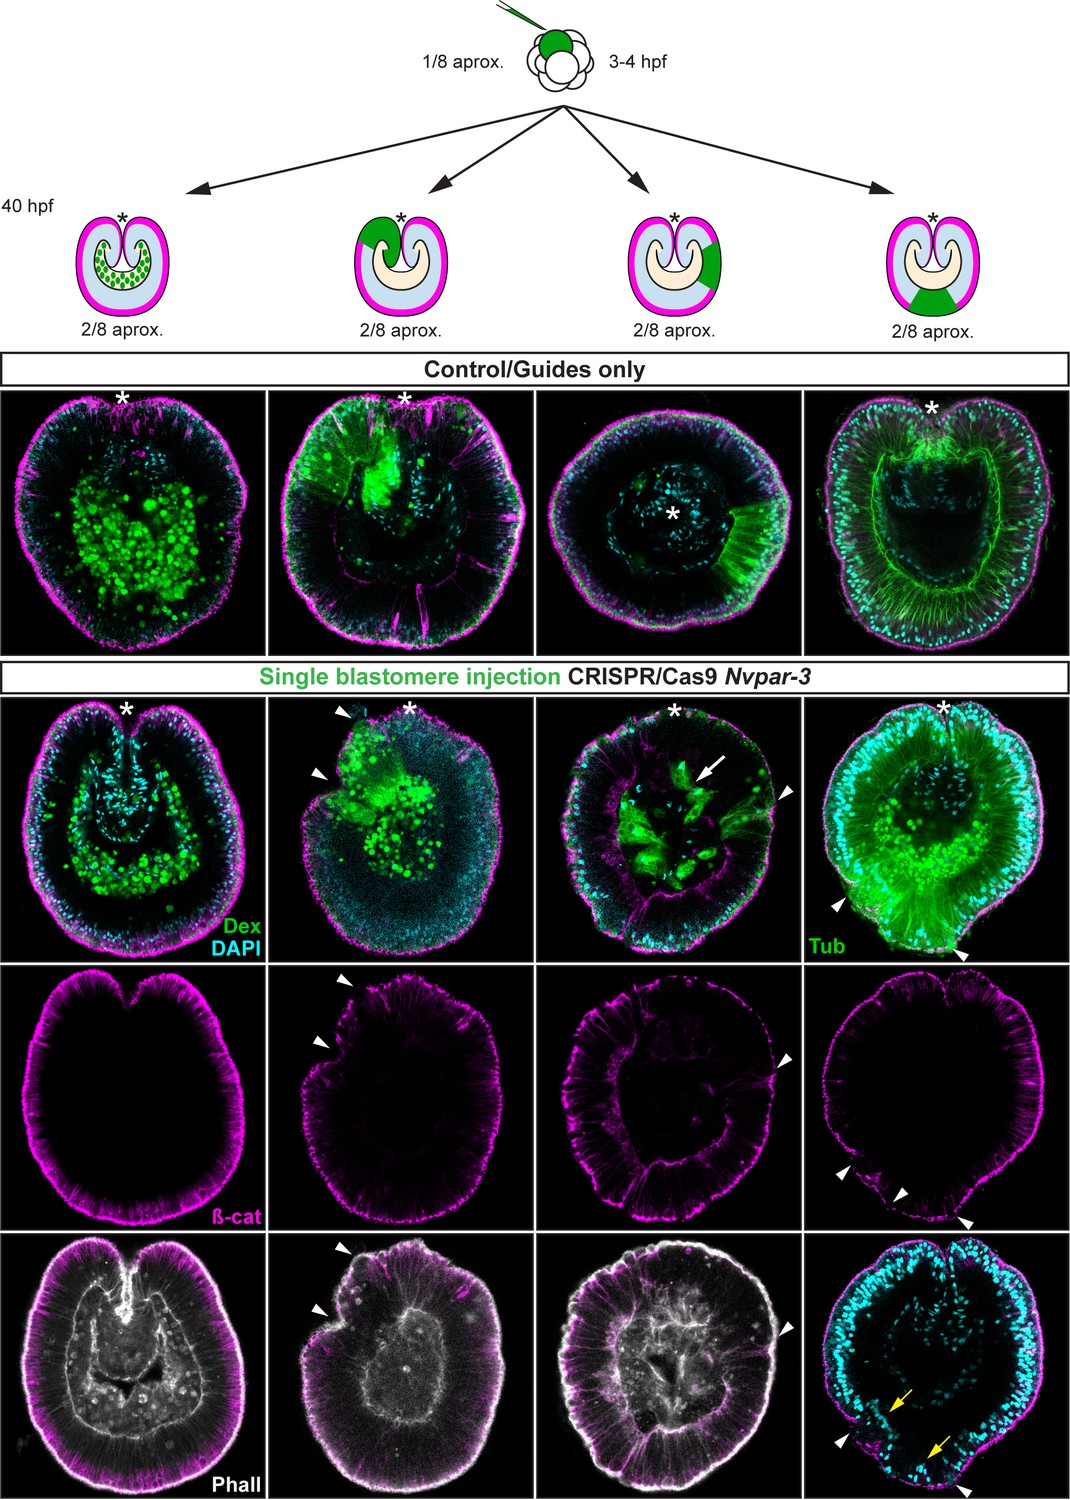
Immunofluorescent staining for ß-catenin (ß-cat) in single injected-blastomere control and CRISPR/Cas9 Nvpar-3 knock-outs at 40 hpf.
Morphology is shown by DAPI and Phalloidin staining. Streptavidin-Biotin TxRed Dextran (Dex) is shown in green. Arrowheads indicate the absence of the protein and disrupted epithelium. Arrows indicate bottle-like shape cells. Note the displacement of nuclei (yellow arrow) and changes in tubulin (Tub) staining. *: site of gastrulation is up.
Figure 4—video 1
z-stack series of CRISPR phenotype (ß-catenin panel).
Streptavidin-Biotin TxRed Dextran (Dextran) and Phalloidin are shown in green and gray, respectively. Arrow (magenta) indicates an extruding cell. See also Figure 4—animation 1 and Figure 4—animation 2.
Figure 4—animation 1
Figure 4 z-stack for ß-catenin panel.
https://doi.org/10.7554/eLife.36740.023
Figure 4—animation 2
Figure 4 z-stack for NvPar-6 panel.
https://doi.org/10.7554/eLife.36740.024
Figure 5 with 2 supplements
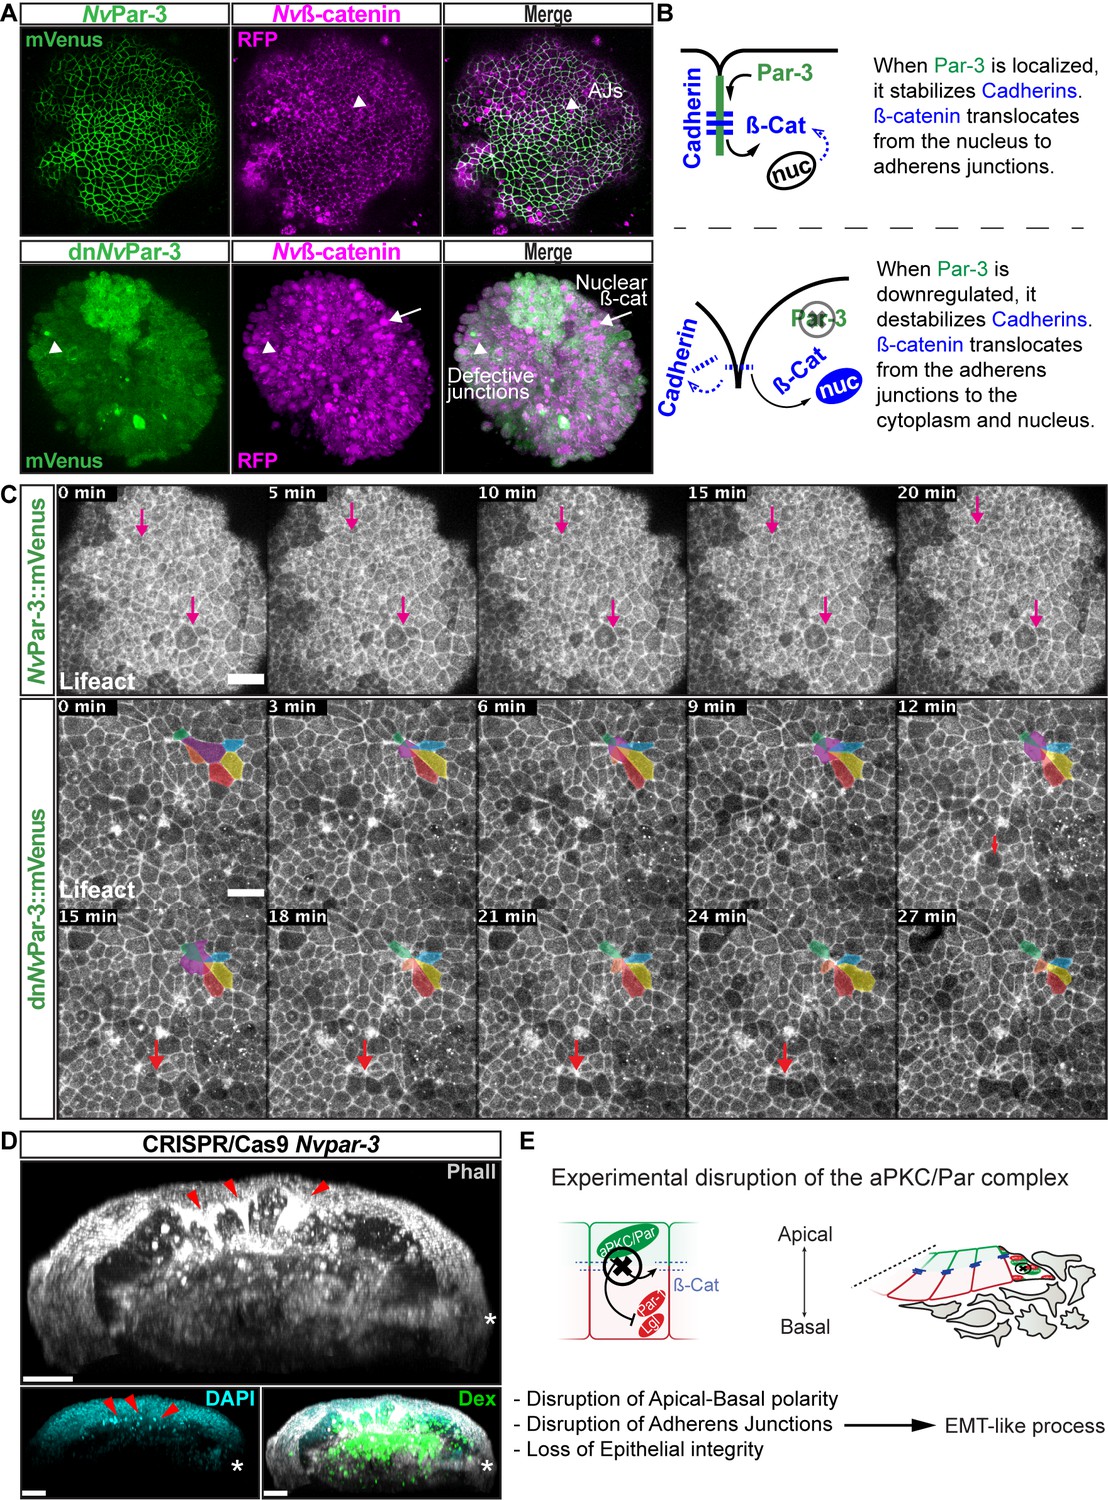
NvaPKC/Par complex regulates ß-catenin localization and cell attachment.
(A) In vivo co-localization of NvPar-3venus co-injected with Nvß-cateninRFP, and dnNvPar-3venus co-injected with Nvß-cateninRFP. Arrowheads indicate junctions (AJs). Arrows indicate nuclear ß-catenin. (B) Diagram of the suggested interpretation for A. (C) In vivo time series of ectodermal epithelial layers of embryos injected with NvPar-3venus and dnNvPar-3venus mRNA demonstrating epithelial delamination in the absence of functional NvPar3. Lifeact::mTq2 mRNA was co-injected to visualize cell boundaries. Pink arrows indicate the absence cell detachments. A subset of cells was artificially colored. The purple cell detaches from the epithelium and the red arrow indicates a second celldetachment. See also Figure 5—video 1. (D) IFS of an embryo in which a single blastomere was injected with NvPar-3 guide RNAs and Cas9 and green dextran. Red arrowheads indicate the apical constriction and delamination of ectodermal cells in the mutated clone of cells. Note the different layers of nuclei stained with DAPI. Asterisks indicate the site of gastrulation. (E) Diagram of the suggested interpretation for D. All images are 3D reconstructions from a z-stack confocal series. All scale bars, 20 µm.
Figure 5—figure supplement 1
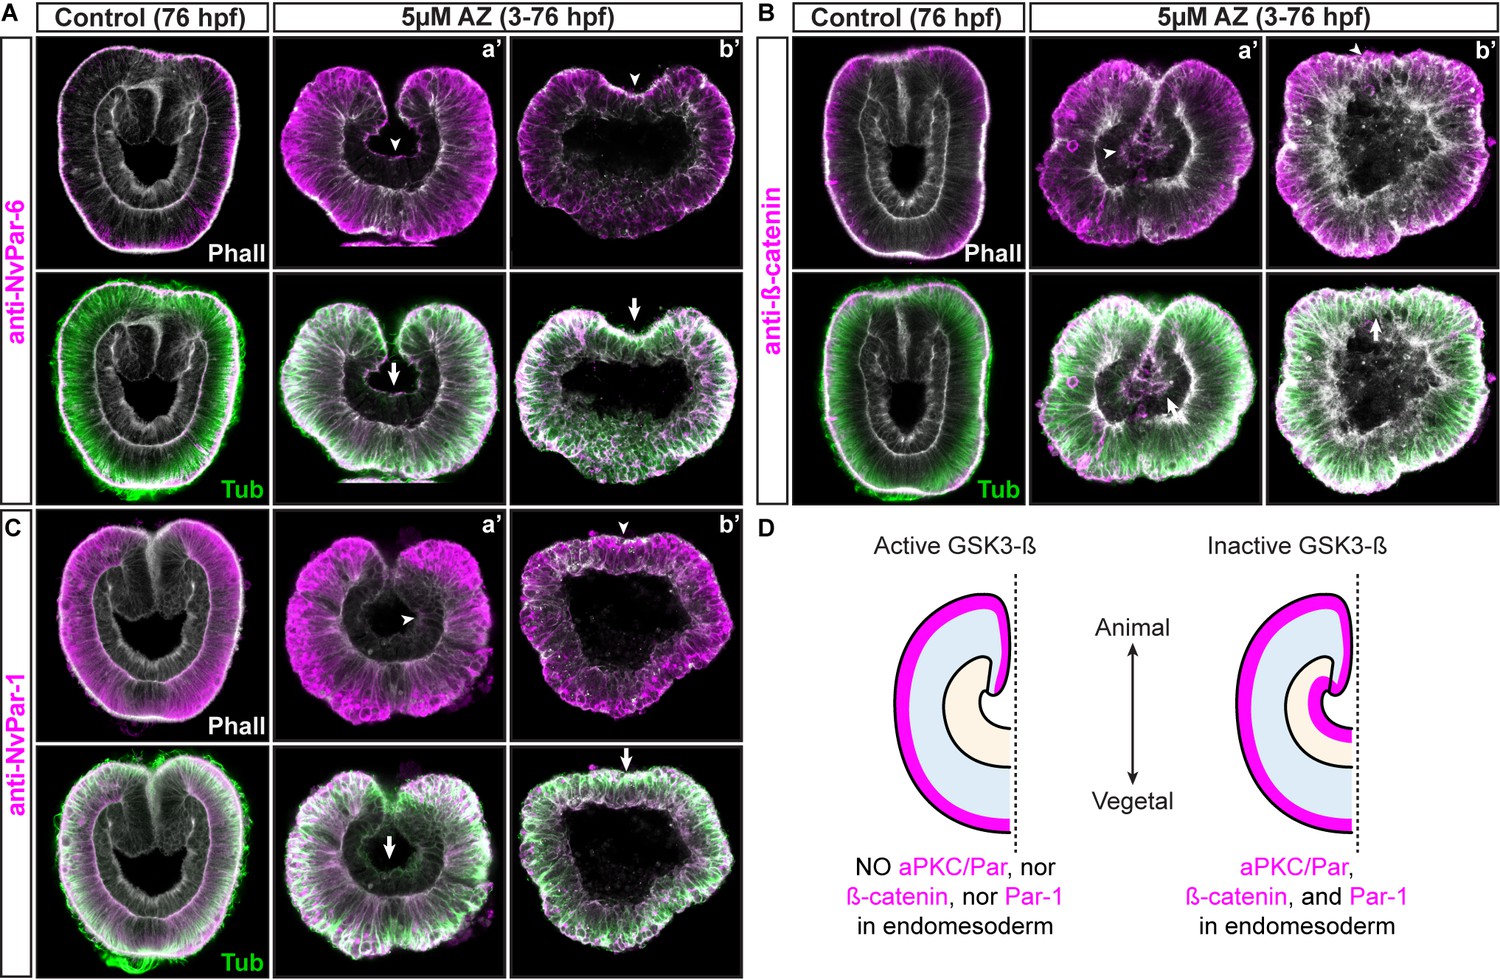
Apical junctions are regulated by GSK-3ß in epithelial cells during gastrulation in N. vectensis embryos.
(A) IFS for NvPar-6 in AZ-treated embryos. (B) IFS for ß-catenin in AZ-treated embryos. (C) IFS for NvPar-1 in AZ-treated embryos. (D) Graphical summary of the observed results. Par-6, ß-catenin, and Par-1 were detected at the apical cortex (arrowheads) of the endomesodermal epithelium of AZ-treated embryos, but not in control embryos. Arrows indicated the stabilization of microtubules at the apical cortex of endomesodermal cells. Two distinct phenotypes were observed after AZ treatment: (a’) gastrulation without elongation 27% (27/100), (b’) no invagination of the endomesoderm 13% (13/100).
Figure 5—video 1
Related to Figure 5C.
EMT-like process occurs in dnNvPar-3::mVenus expressing cells. Lifeact::mTq2 is shown in grey. Arrows indicate the apical constriction of detaching cells. Scale bars:10 µm
Figure 6 with 5 supplements
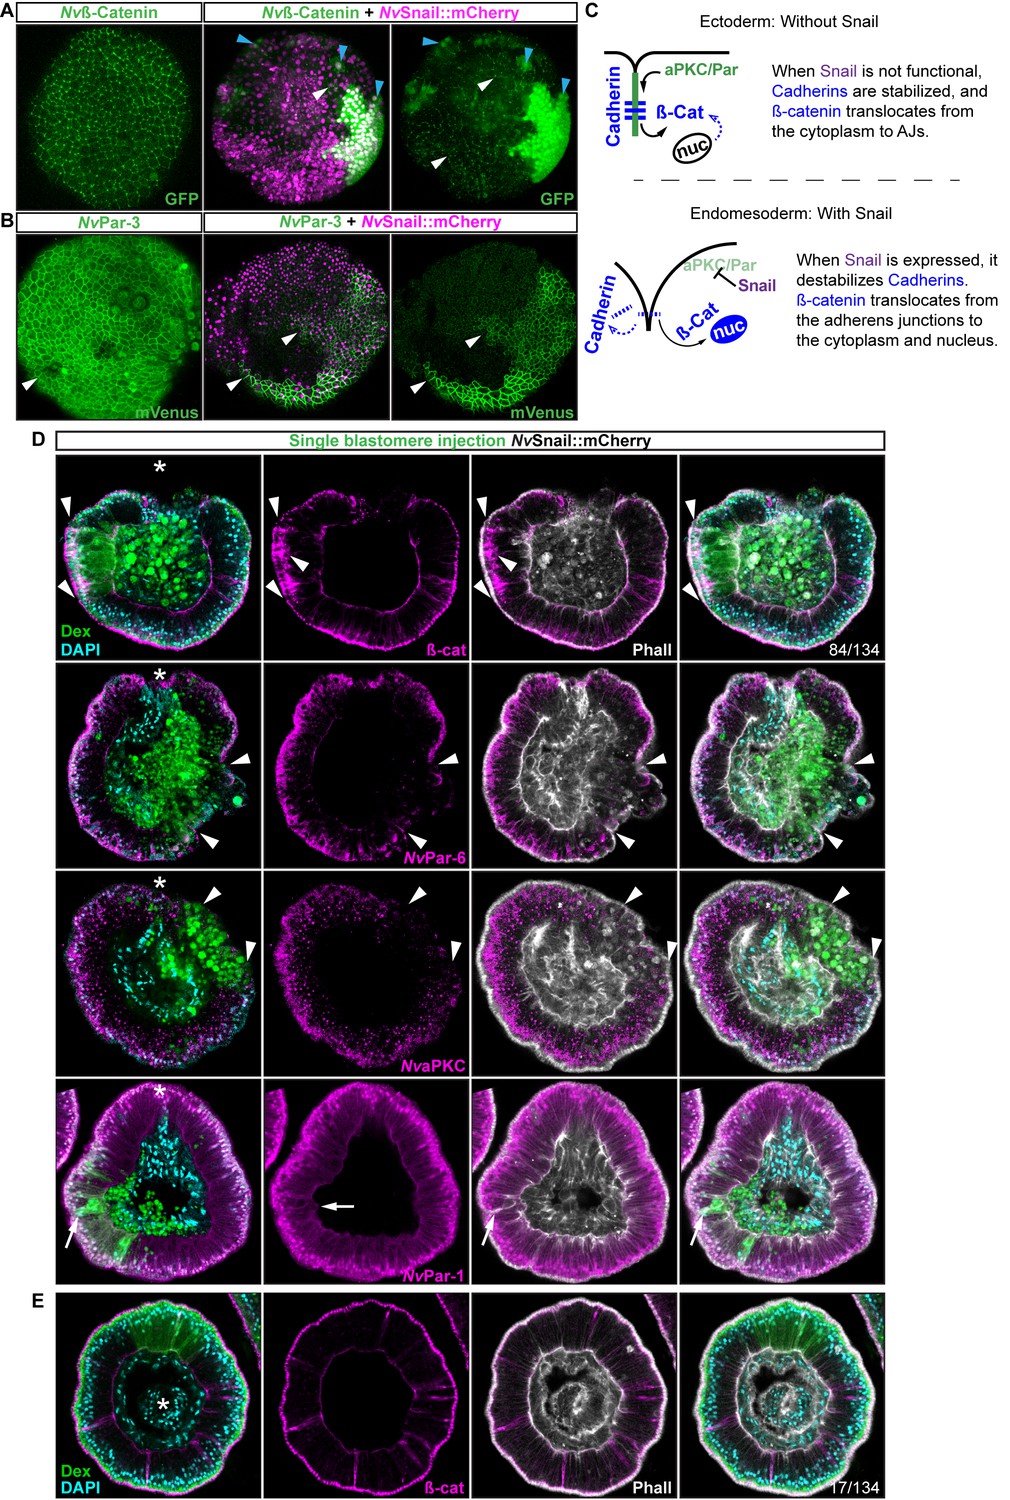
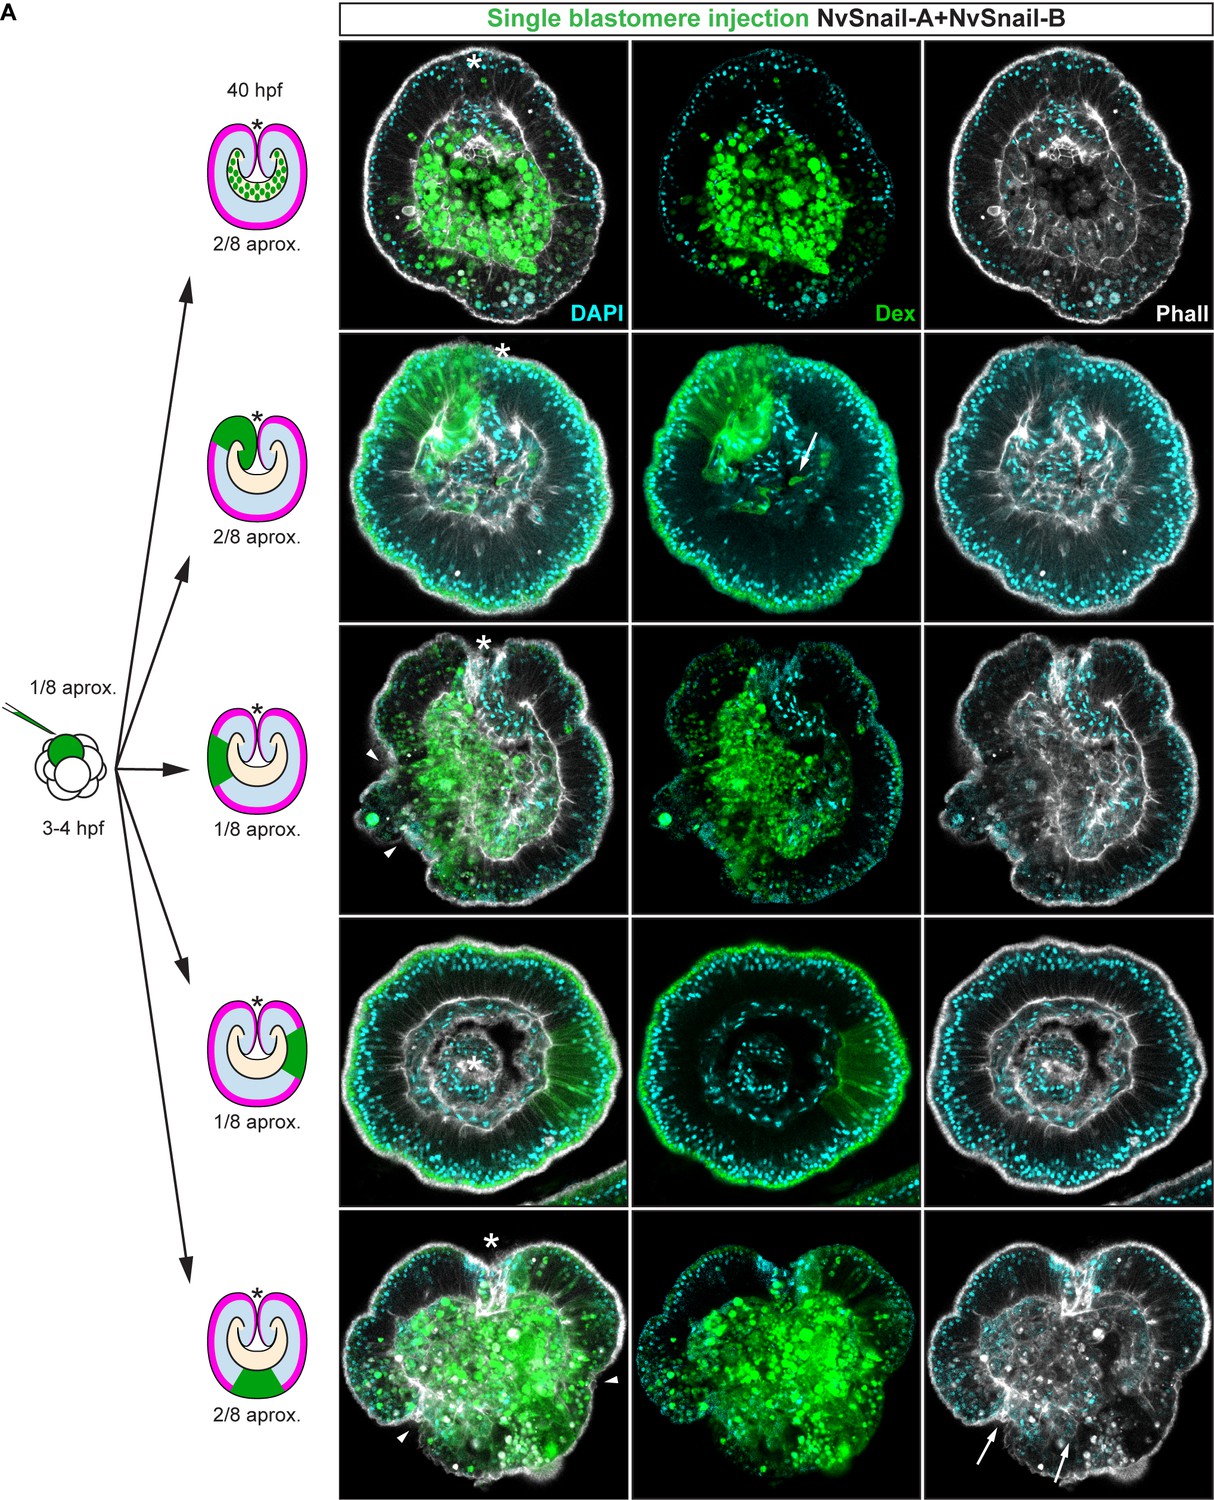
Nvsnail genes induce the translocation of Nvß-catenin and the disruption of epithelial integrity.
(A) in vivo localization of Nvß-cateninGFP co-injected with both NvSnail-A::mCherry and NvSnail-B::mCherry mRNA together in zygotes at 40 hpf. White arrowheads indicate AJs. Patched patterns of cytosolic and nuclear ß-catenin (Blue arrowheads) were observed. (B) in vivo localization of NvPar-3::mVenus co-injected with both NvSnail-A::mCherry and NvSnail-B::mCherry mRNA together at 40 hpf. Patched patterns of AJs (White arrowheads) were observed. (C) Diagram depicts the suggested interpretation for A and B. (D) IFS for ß-catenin (ß-cat), NvPar-6, NvaPKC, and NvPar-1 in embryos at 40 hpf where NvSnail-A::mCherry and NvSnail-B::mCherry mRNA were overexpressed together into a single ectodermal blastomere lineage (followed by green Streptavidin-TxRed Dextran (Dex). Arrowheads indicate the absence of the protein, cytosolic ß-cat, and disrupted epithelium. Arrows indicate bottle-like shape cells. (E) IFS for ß-cat in embryos at 40 hpf where NvSnail-A::mCherry and NvSnail-B::mCherry mRNA were overexpressed together into a single blastomere lineage and no affects were observed. See also Figure 6—figure supplement 1, Figure 6—video 1, and Figure 6—video 2. *site of gastrulation. Morphology is shown by DAPI and Phall IFS. Except from 6A and 6B, all images are single optical sections from the z-stack confocal series. (A) and (B) are 3D reconstructions from a z-stack confocal series.
Figure 6—figure supplement 1
Nvsnail-A and Nvsnail-B together regulate epithelial integrity.
Immunofluorescent staining of embryos at 40 hpf where NvSnail-A::mCherry and NvSnail-B::mCherry mRNA were overexpressed together into a single blastomere lineage (followed by green Streptavidin-TxRed Dextran (Dex). No affects were observed in approximately 1/8 of the injected embryos. Arrowheads indicate the disrupted epithelium. Arrows indicate bottle-like shape cells. *site of gastrulation. Morphology is shown by DAPI and Phall IFS. All images are single optical sections from the z-stack confocal series.
Figure 6—video 1
Related to Figure 6E.
z-stack series of mRNA overexpression phenotype (NvPar-6 panel). Streptavidin-Biotin TxRed Dextran (Dextran) and Phalloidin are shown in green and gray, respectively. Arrow (magenta) indicates an extruding cell. See also Figure 6—animation 1.
Figure 6—video 2
Related to Figure 6E.
z-stack series of mRNA overexpression phenotype (NvPar-1 panel). Streptavidin-Biotin TxRed Dextran (Dextran) and Phalloidin are shown in green and gray, respectively. Arrow (magenta) indicates an extruding cell. See also Figure 6—animation 2.
Figure 6—animation 1
Figure 6D z-stack for NvPar-6 panel.
https://doi.org/10.7554/eLife.36740.032
Figure 6—animation 2
Figure 6D z-stack for NvPar-1 panel.
https://doi.org/10.7554/eLife.36740.033
Figure 7 with 2 supplements
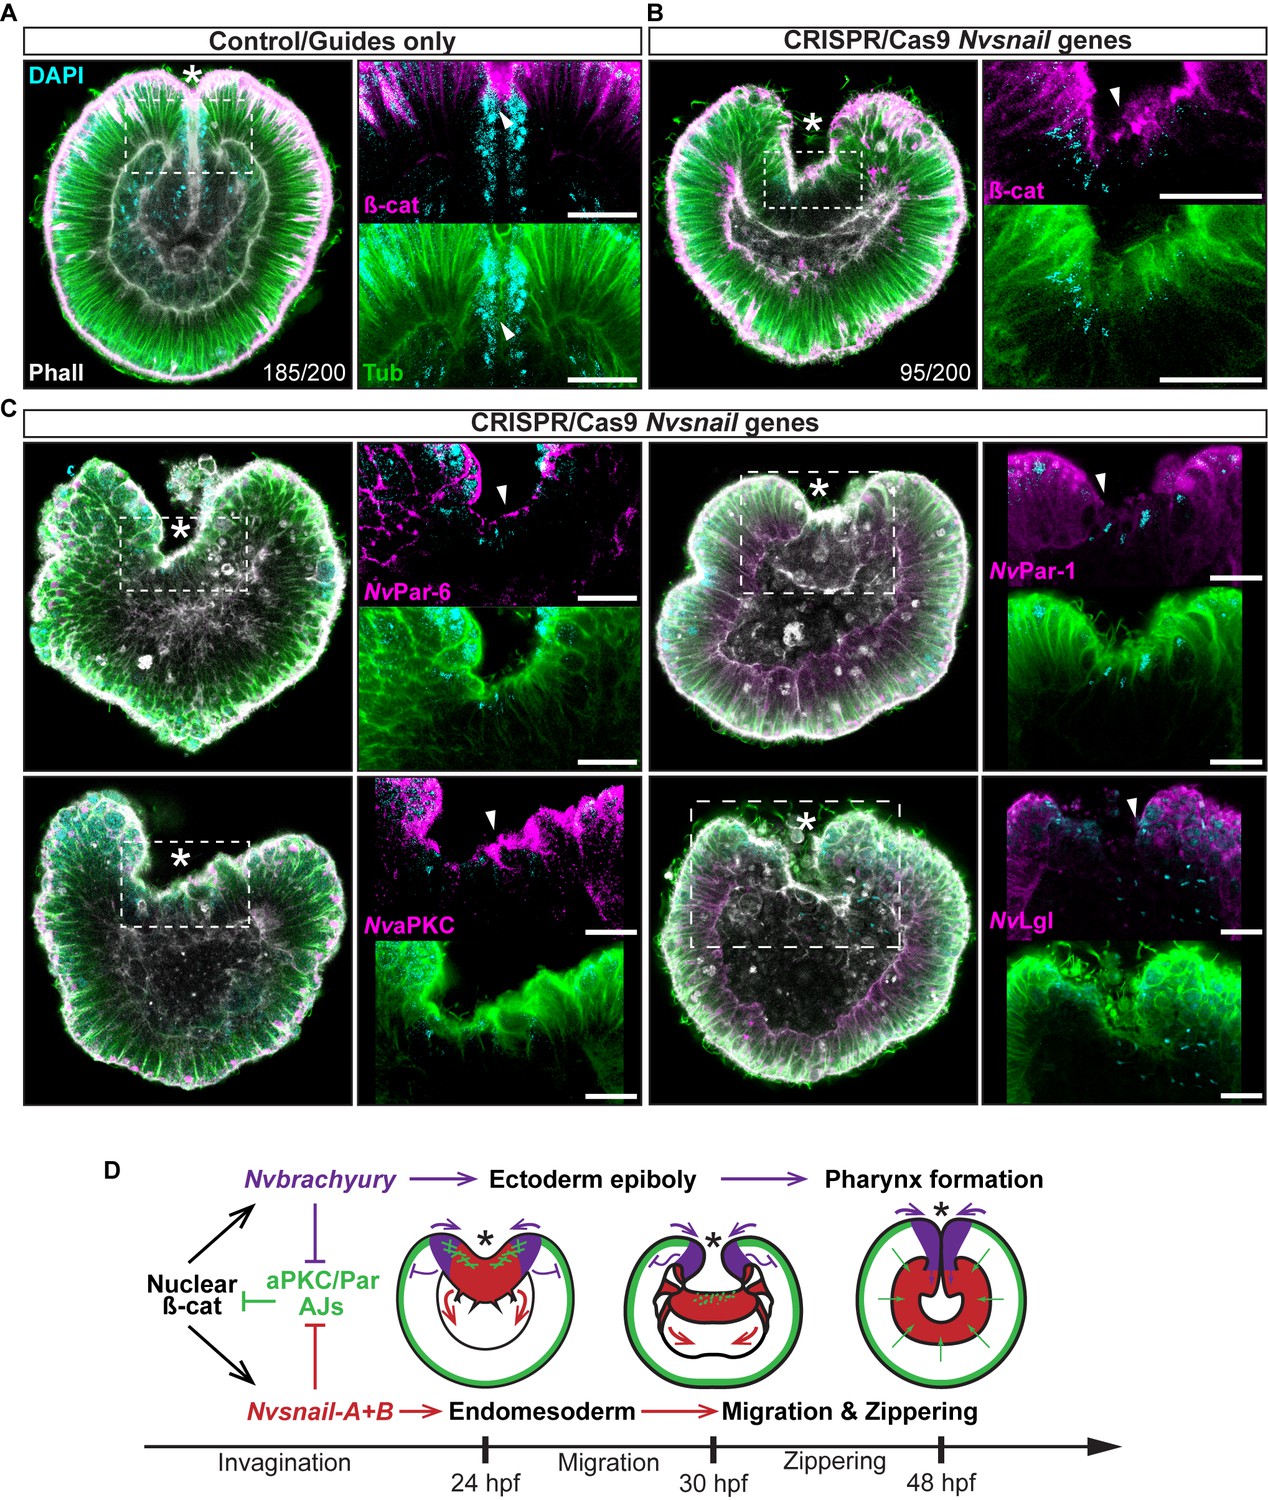
Nvsnail genes prevents the reassembly AJs and NvaPKC/Par polarity allowing endomesodermal migration.
(A) Embryo wide CRISPR/Cas9 knock-out guides controls show no effect neither on gastrulation nor AJs (ß-catenin) localization. (B) Embryo wide CRISPR/Cas9 knock-out for both Nvsnail-A and Nvsnail-B at 40 hpf showing that AJs are retained in presumptive endomesodermal region similar to ectodermal cells. High magnification images from boxed region (endomesodermal plate) are shown on the right. (C) Embryo wide CRISPR/Cas9 knock-out for both Nvsnail-A and Nvsnail-B at 40 hpf showing that NvPar-6 and NvaPKC proteins are retained in in presumptive endomesodermal region similar to ectodermal cells. NvPar-1 and NvLgl were not detected in endomesodermal cells. High magnification images from boxed region (endomesodermal plate) are shown on the right. (D) Graphical summary of the observed results with previous published data (Servetnick et al., 2017). See also Figure 7—figure supplements 1 and 2. Morphology is shown by DAPI, Tubulin, and Phalloidin. All images are single optical sections from the z-stack confocal series. Arrowheads indicate protein localization. *site of gastrulation. All scale bars, 20 µm.
Figure 7—figure supplement 1
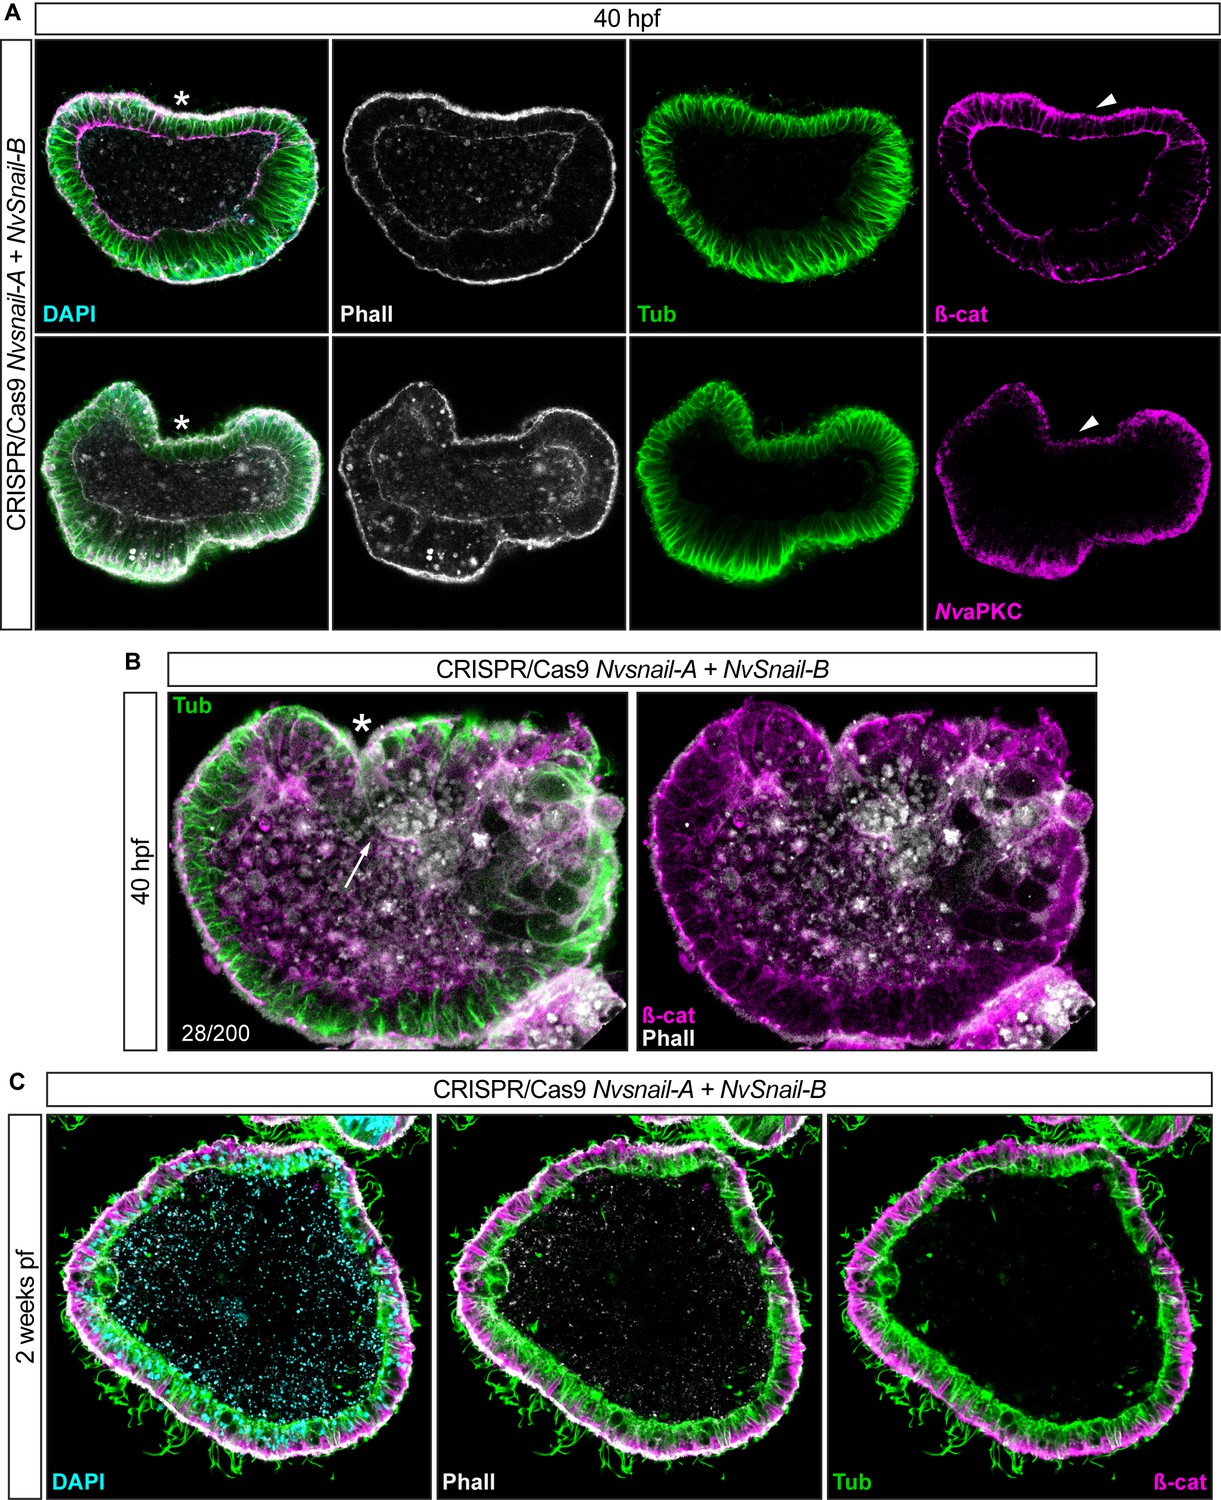
Nvsnail-A and Nvsnail-B together regulate AJs.
*site of gastrulation. (A) Embryo wide CRISPR/Cas9 knock-out for both Nvsnail-A and Nvsnail-B at 40 hpf showing embryos that did not gastrulate and retain ß-catenin (ß-cat) and NvaPKC at the apical cell-cortex of the endomesodermal plate (arrowheads). (B) Embryo wide CRISPR/Cas9 knock-out for both Nvsnail-A and Nvsnail-B at 40 hpf showing embryos that developed a pharynx (arrow) but not an organized endomesoderm. (C) Embryo wide CRISPR/Cas9 knock-out for both Nvsnail-A and Nvsnail-B at 2 weeks post fertilization (pf) showing embryos that did not develop a gastrodermal epithelium.
Figure 7—figure supplement 2
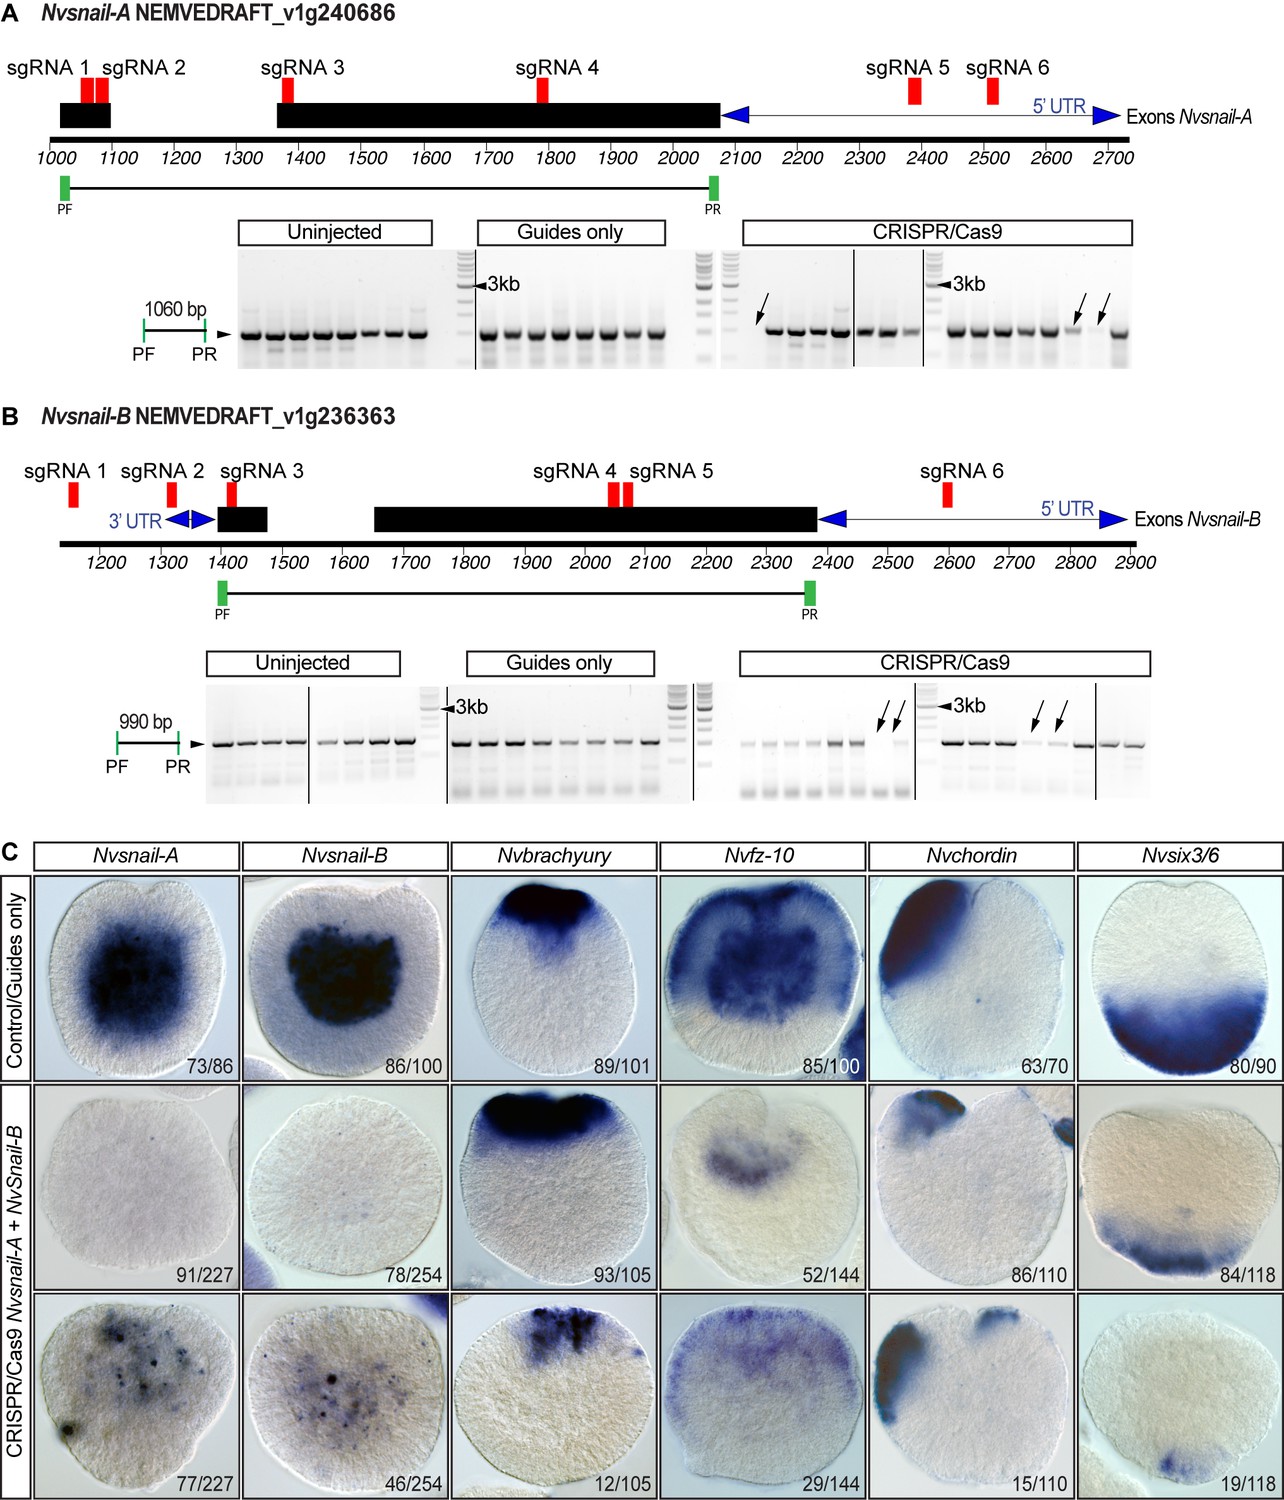
CRISPR/Cas9 mediated mutagenesis of Nvsnail-A and Nvsnail-B.
(A) The position of the sgRNAs (red) and primers (green) used for the PCR assay are shown on the diagram depicting the genomic sequence of Nvsnail-A. Note the absence of fragments of Nvsnail-A (arrow) resulting from CRISPR/Cas9-mediated mutagenesis. The presence of other bands suggests mosaicism. Black rectangles correspond to Nvsnail-A exon. Blue double arrow depicts UTR regions. PF: primer forward. PF: primer reverse. See also Figure 7—figure supplement 2—source data 1. (B) The position of the sgRNAs (red) and primers (green) used for the PCR assay are shown on the diagram depicting the genomic sequence of Nvsnail-B. Note the absence of fragments of Nvsnail-B (arrow) resulting from CRISPR/Cas9 mediated mutagenesis. The presence of other bands suggests mosaicism as shown in (C). Black rectangles correspond to Nvsnail-B exon. Blue double arrow depicts UTR regions. PF: primer forward. PF: primer reverse. See also Figure 7—figure supplement 2—source data 1. (C) In situ hybridization of Nvsnail-A+Nvsnail B knockout embryos (Cas9 and gRNAs) compared with control embryos at 40 hpf. Nvsnail-A+Nvsnail B knockout embryos display no expression and mosaic expression of Nvsnail-A and Nvsnail-B but did not modify ectodermal specification (determined by the expression of Nvbrachyury, Nvchordin, and Nvsix3/6 genes). KO embryos not shown displayed an expression pattern undistinguishable from controls.
-
Figure 7—figure supplement 2—source data 1
Full height of the blots shown in Figure 7—figure supplement 2.
White boxes correspond to the sections reported in Figure 7—figure supplement 2.
- https://doi.org/10.7554/eLife.36740.037
Figure 8 with 1 supplement
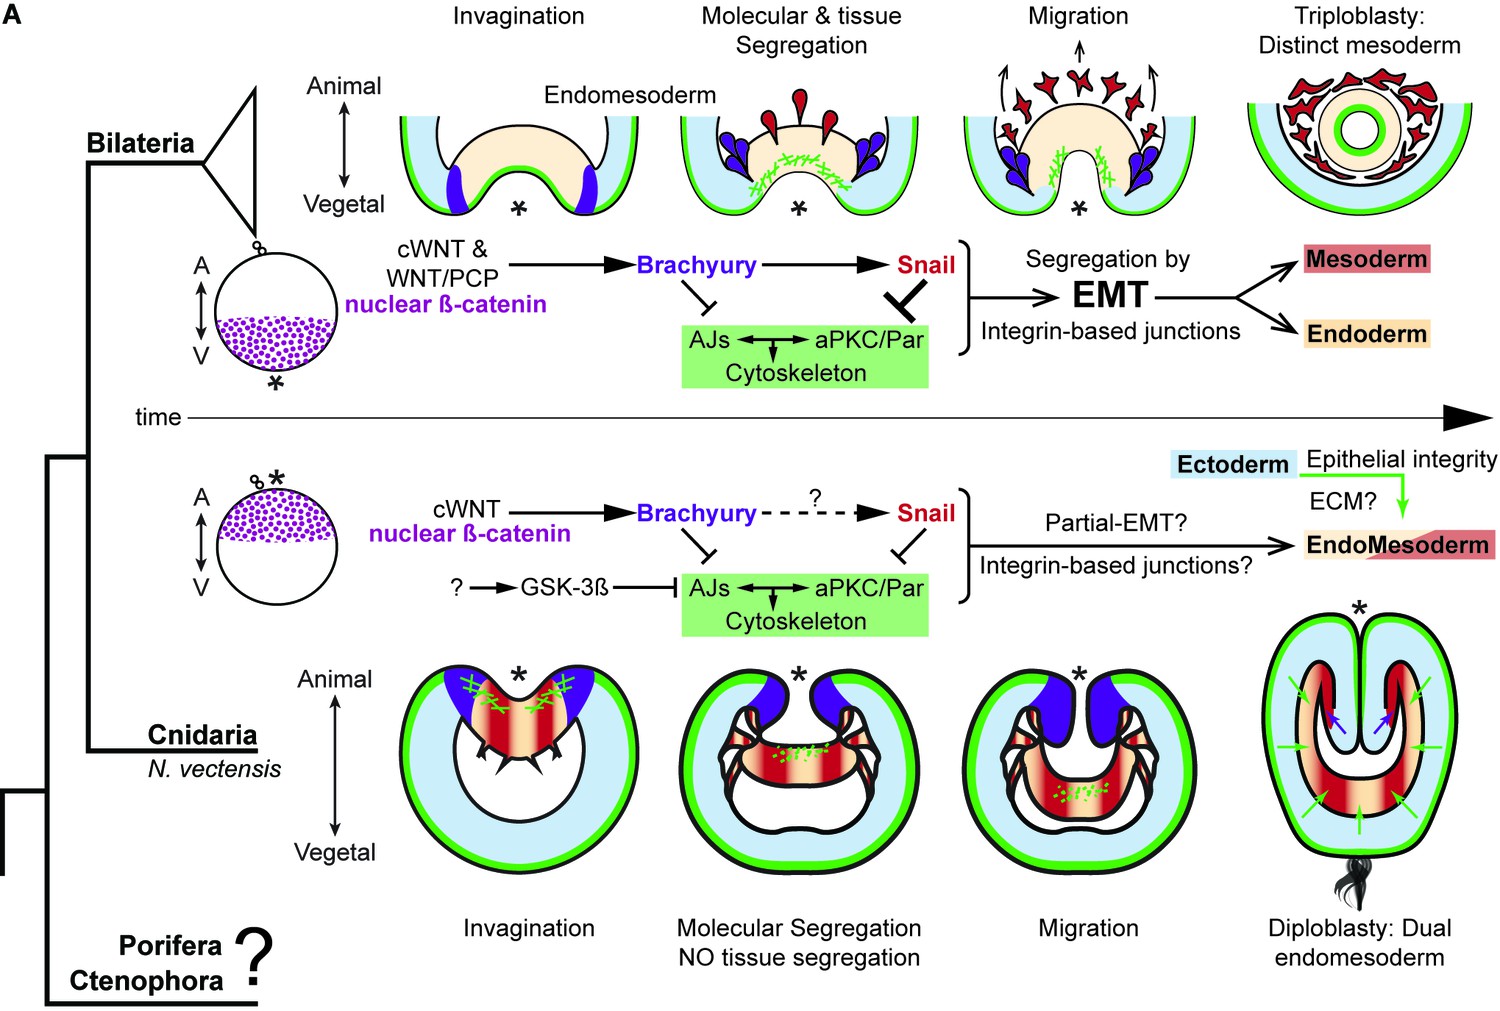
The differences between epithelial structure in ectoderm and endomesoderm in N. vectensis embryos are due to the lack of mechanisms to segregate a distinct mesoderm.
Diagram depicting key cellular and molecular mechanisms involved during gastrulation of bilaterian and N. vectensis (a cnidarian) embryos. See also Figure 8—figure supplement 1.
Figure 8—figure supplement 1

Suggested model for mesoderm specification in Metazoa.
(A) Differential regulation of cell adhesion by the endomesoderm GRN is mediated by changes in cell polarity that regulate ß-catenin localization. These mechanisms emerged at the Bilateria + Cnidaria node. (B) Ctenophores do not possess a full complement of cell adhesion, cell-polarity, and endomesodermal GRN components present in the most common ancestor between Cnidaria and Bilateria. However, ctenophores possess a distinct mesoderm, suggesting the emergence of different mechanisms to segregate mesoderm in Metazoa.
Tables
Key resources table
| Reagent type (species) or resource | Designation | Source or reference | Identifiers | Additional information |
|---|---|---|---|---|
| Antibody | Mouse Anti-alpha-Tubulin Monoclonal Antibody, Unconjugated, Clone DM1A | Sigma-Aldrich | T9026; RRID:AB_477593 | (1:500) |
| Antibody | Anti-beta-Catenin antibody produced in rabbit | Sigma-Aldrich | C2206; RRID:AB_476831 | (1:300) |
| Antibody | Anti-Histone, H1 + core proteins, clone F152.C25.WJJ antibody | Millipore | MABE71; RRID:AB_10845941 | (1:300) |
| Antibody | anti-NvaPKC custom peptide antibody produced in rabbit | Bethyl labs; Salinas-Saavedra et al. (2015) | Stored at MQ Martindale's lab; (1:100) | |
| Antibody | anti-NvLgl custom peptide antibody produced in rabbit | Bethyl labs; Salinas-Saavedra et al. (2015) | Stored at MQ Martindale's lab; (1:100) | |
| Antibody | anti-NvPar-1 custom peptide antibody produced in rabbit | Bethyl labs; Salinas-Saavedra et al. (2015) | Stored at MQ Martindale's lab; (1:100) | |
| Antibody | anti-NvPar-6 custom peptide antibody produced in rabbit | Bethyl labs; Salinas-Saavedra et al. (2015) | Stored at MQ Martindale's lab; (1:100) | |
| Antibody | Goat anti-Mouse IgG Secondary Antibody, Alexa Fluor 568 | Thermo Fisher Scientific | A-11004; RRID:AB_2534072 | (1:250) |
| Antibody | Goat anti-Rabbit IgG Secondary Antibody, Alexa Fluor 647 | Thermo Fisher Scientific | A-21245; RRID:AB_2535813 | (1:250) |
| Antibody | Sheep Anti-Digoxigenin Fab fragments Antibody, AP Conjugated, Roche | Roche | 11093274910; RRID:AB_514497 | |
| Other | Alexa Fluor 488 Phalloidin | Thermo Fisher Scientific | A12379; RRID:AB_2315147 | (1:200) |
| Other | Texas Red Streptavidin | Vector Laboratories | SA-5006, RRID:AB_2336754 | (1:200) |
| Other | DAPI (4',6-Diamidino- 2-Phenylindole, Dihydrochloride) | Thermo Fisher Scientific | D1306; RRID:AB_2629482 | (0.1 µg/µl) |
| Chemical compound, drug | Protein kinase Cζ pseudosubstrate, myristoyl trifluoroacetate salt | Sigma-Aldrich | P1614 | |
| Chemical compound, drug | 1-Azakenpaullone | Sigma-Aldrich | A3734 | |
| Chemical compound, drug | Biotinylated Dextran Amine-Texas Red | Vector Laboratories | SP-1140; RRID:AB_2336249 | |
| Chemical compound, drug | Dextran, Alexa Fluor 488; 10,000 MW, Anionic, Fixable | Thermo Fisher Scientific | D22910 | |
| Chemical compound, drug | Dextran, Alexa Fluor 555; 10,000 MW, Anionic, Fixable | Thermo Fisher Scientific | D34679 | |
| Chemical compound, drug | Dextran, Alexa Fluor 647; 10,000 MW, Anionic, Fixable | Thermo Fisher Scientific | D22914 | |
| Chemical compound, drug | Dextran, Cascade Blue, 10,000 MW, Anionic, Lysine Fixable | Thermo Fisher Scientific | D1976 | |
| Deposited Data | Nematostella vectensis genome assembly 1.0 | JGI | https://genome.jgi.doe.gov/Nemve1/Nemve1.home.html | |
| Biological sample | Nematostella vectensis | Whitney Laboratory for Marine Bioscience, FL, USA. | RRID:SCR_005153 | |
| Sequence-based reagent | Genomic PCR Nvpar-6 and dnNvpar-6: F-AAAACCAC CATCAGCCGAGTCA; R-TATTGATAGAATACCAGTCTCA | NEMVEDRAFT _v1g233358 | ||
| Sequence-based reagent | sgRNAs Nvpar-6: 1-GGATGTTGCCGACTCGCAGT; 2-GGAGAAGGCGAACTCGTCTG; 3-GGATAACCCTGTGCCAGTCA | CRISPRevolution sgRNA; Synthego | NEMVEDRAFT _v1g233358 | |
| Sequence-based reagent | dnNvpar-3: F-ATGATGAAGGTTGTAGT; R-TGCGCCCGATTCGAATCCATCT | NEMVEDRAFT _v1g240248 | ||
| Sequence-based reagent | sgRNAs Nvpar-3: 1-GGGTGTTCGAGGGACGCGAT; 2- GGGCAGGTTTATCCCGAAGG; 3- ACCAACGAUCUAGAUCCAGU | CRISPRevolution sgRNA; Synthego | NEMVEDRAFT _v1g240248 | |
| Sequence-based reagent | Genomic PCR Nvpar-3: F-GTAGACGGGACTGGTTTGGA; R-AGGGACAGGTTGCTCCTTTT | NEMVEDRAFT _v1g240248 | ||
| Sequence-based reagent | dnNvpar-1: F-AATATAAACTATGAACTTAACG; R-TTAAAGTTTTAATTCATTTGCA | NEMVEDRAFT _v1g 139527 | ||
| Sequence-based reagent | sgRNAs Nvsnail-A: 2-GGGGCCGGTAATGACGCGCG; 3-GGCGTAGAGTCACACCGCAA; 4-GGCGATGATATCGAGCTCGG; 5-GGGCATCTTGAGTGCACCCA | CRISPRevolution sgRNA; Synthego | NEMVEDRAFT _v1g240686 | |
| Sequence-based reagent | sgRNAs Nvsnail-A: 1-GGGCTCTCTTGCTCCGTAAC; 6-GGGTTTCCTGGCGCTGGGAT | CRISPRevolution Modified sgRNA; Synthego | NEMVEDRAFT _v1g240686 | |
| Sequence-based reagent | Genomic PCR Nvsnail-A (full length): F-ATGCCCCGCTCGTTTCTAG; R-TCCTTGTGACGGGCAGCC | NEMVEDRAFT _v1g240686 | ||
| Sequence-based reagent | sgRNAs Nvsnail-B: 1-GGAAGAGGATGTGAGGTTTT; 2-GAGATGATATTAGGCTGGTG; 4-GAAAAGCTGTACGACTCCTT; 5-GGGCATCTTGAGAGCGCCCA | CRISPRevolution sgRNA; Synthego | NEMVEDRAFT _v1g236363 | |
| Sequence-based reagent | sgRNAs Nvsnail-B: 3-GGGTGAAGACTAAGACAGAG; 6-GGGCGATGAATCGTGTTTAA | CRISPRevolution Modified sgRNA; Synthego | NEMVEDRAFT _v1g236363 | |
| Sequence-based reagent | Genomic PCR Nvsnail-B (full length): F-ATGCCGAGGTCCTTCCTGG; R-GCAGAGATTTTGCCGACACAT | NEMVEDRAFT _v1g236363 | ||
| Recombinant DNA reagent | pSPE3-mVenus | Roure et al. (2007) | Gateway vector | |
| Recombinant DNA reagent | pSPE3-mCherry | Roure et al. (2007) | Gateway vector | |
| Recombinant DNA reagent | pSPE3-Nvpar-6-mVenus | Salinas-Saavedra et al. (2015) | ||
| Recombinant DNA reagent | pSPE3-Nvpar-3-mVenus | Salinas-Saavedra et al. (2015) | ||
| Recombinant DNA reagent | Nvß-catenin expression constructs | Wikramanayake et al. (2003); Röttinger et al., 2012 | ||
| Recombinant DNA reagent | Nvsnail-A backbone to generate expression constructs | Magie et al. (2007) | ||
| Software, algorithm | Fiji (ImageJ) | NIH | http://fiji.sc | |
| Software, algorithm | Imaris 7.6.4 | Bitplane Inc. | ||
| Software, algorithm | CRISPRscan | Moreno-Mateos et al. (2015) | http://www.crisprscan.org/ | |
| Software, algorithm | SPSS | IBM |
Additional files
-
Transparent reporting form
- https://doi.org/10.7554/eLife.36740.040
Download links
A two-part list of links to download the article, or parts of the article, in various formats.
Downloads (link to download the article as PDF)
Open citations (links to open the citations from this article in various online reference manager services)
Cite this article (links to download the citations from this article in formats compatible with various reference manager tools)
Germ layer-specific regulation of cell polarity and adhesion gives insight into the evolution of mesoderm
eLife 7:e36740.
https://doi.org/10.7554/eLife.36740


