Convergence between the microcosms of Southeast Asian and North American pitcher plants
- Harvard University, United States
- Universiti Malaysia Sabah, Malaysia
- University of Malaya, Malaysia
- Jiangsu University, China
- University of Wisconsin-Madison, United States
Figures
Figure 1 with 1 supplement
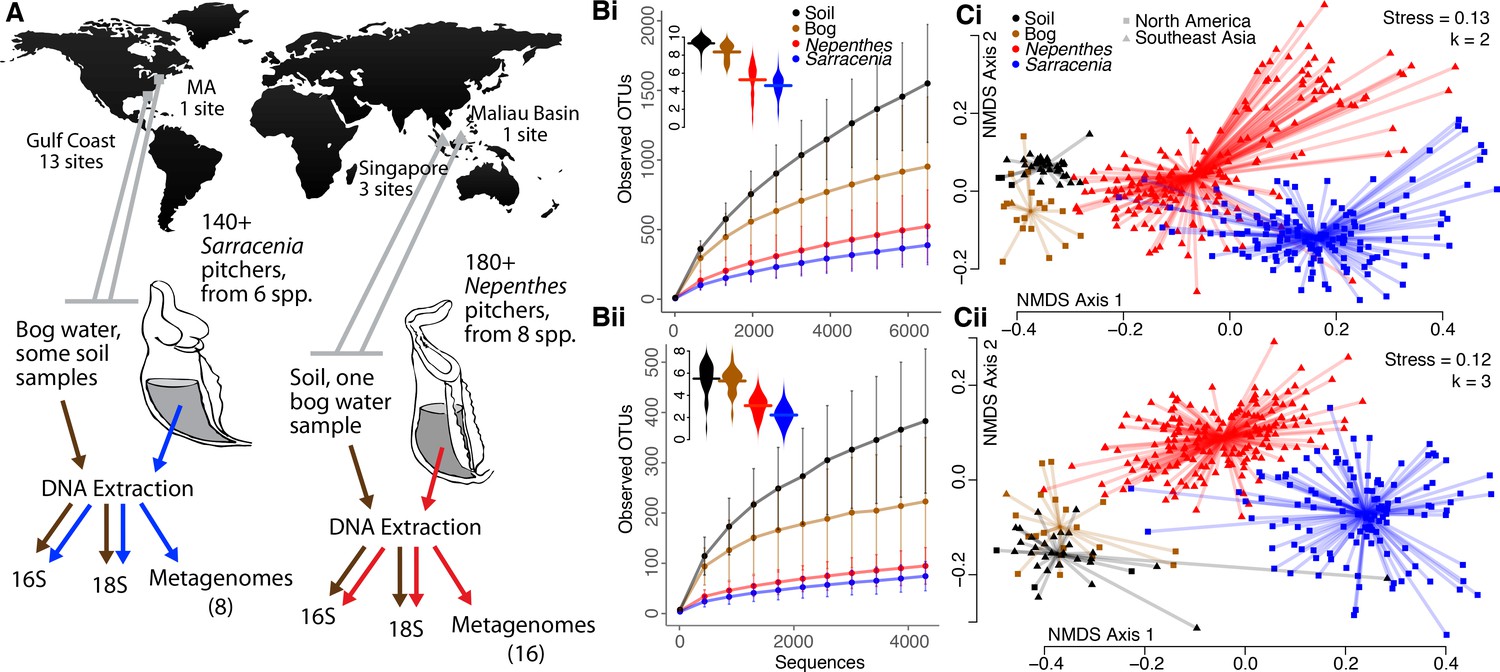
Pitcher microcosms are more similar to each other than they are to communities of surrounding habitats.
(A) Geography of sampled Sarracenia and Nepenthes and experimental approach. (B) The species richness (displayed as rarefaction plots) and Shannon diversity (inset beanplots) of both bacterial (i, top) and eukaryotic (ii, bottom) communities was lower in pitchers than in surrounding soil and bog water. Error bars are standard deviations. (C) Community composition using the unweighted UniFrac metric for bacteria (i, top) and eukaryotes (ii, bottom). NMDS stress and dimensions (k) are listed, and the center of each cluster is the category’s median value.
Figure 1—figure supplement 1
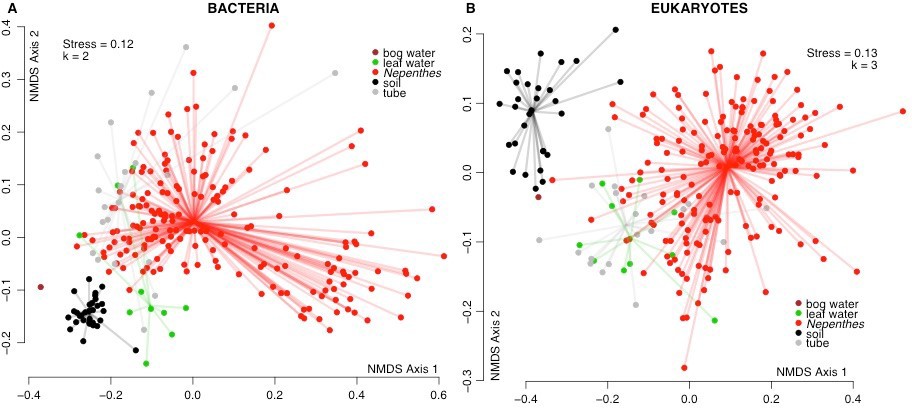
Southeast Asian pitcher communities are more similar to the communities living in water captured in fallen leaves or experimental tubes than those of soil or bog water.
NMDS plots of bacterial (A) and eukaryotic (B) communities in different habitats in Southeast Asia.
Figure 2 with 1 supplement
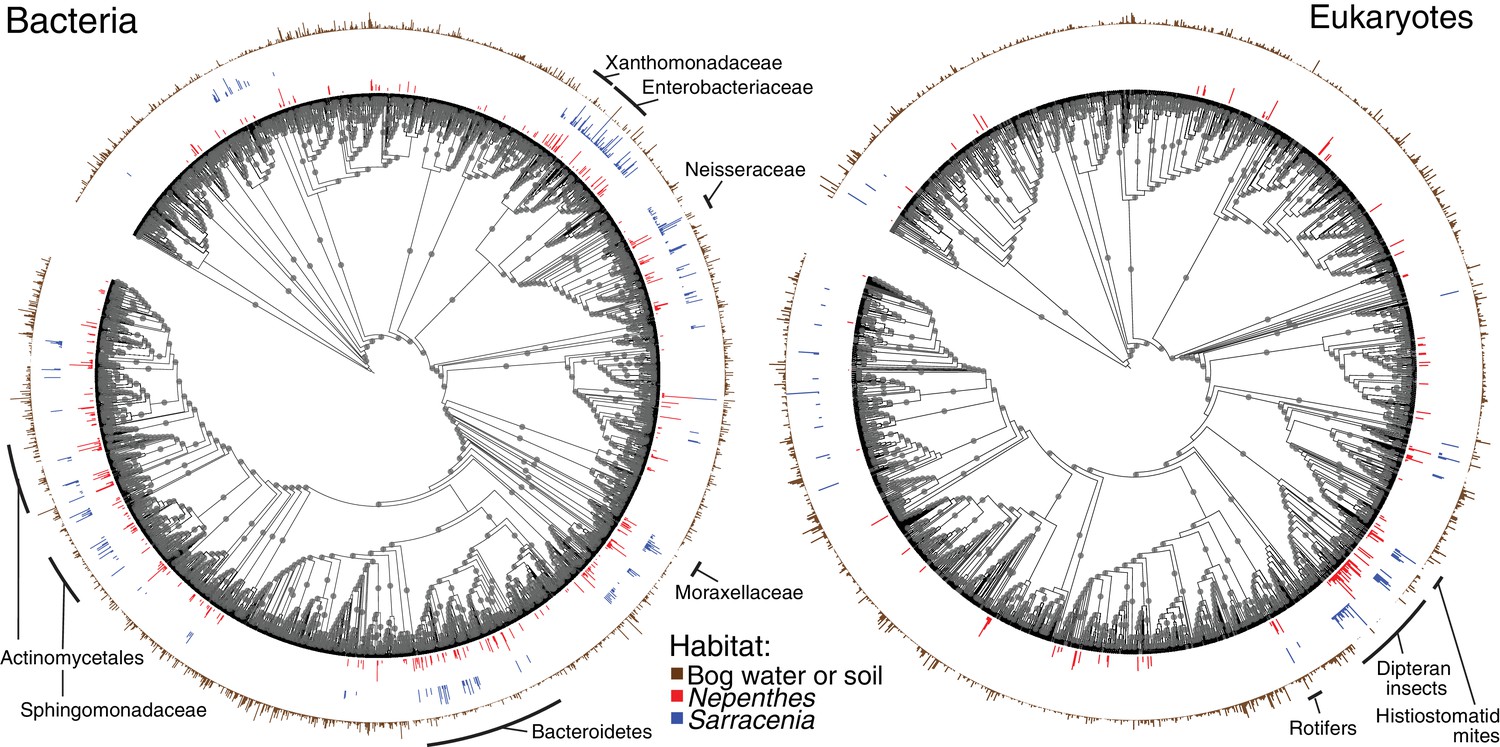
Nepenthes and Sarracenia pitchers are colonized by related organisms.
Phylogeny of bacterial and eukaryotic OTUs found in soil and bog samples (brown); and OTUs present in at least 10% of field collected Nepenthes (red) or Sarracenia (blue) samples. The height of the colored bars surrounding each tree corresponds to the natural log of the relative abundance of reads from each OTU, normalized across the samples in each category. Labels designate monophyletic clades where high proportions of OTUs are shared between Nepenthes and Sarracenia samples. Gray dots mark branches leading to nodes with bootstrap support of 0.7 or higher. The bacterial tree is rooted in Archaea and the eukaryotic tree is rooted in Streptophyta.
Figure 2—figure supplement 1
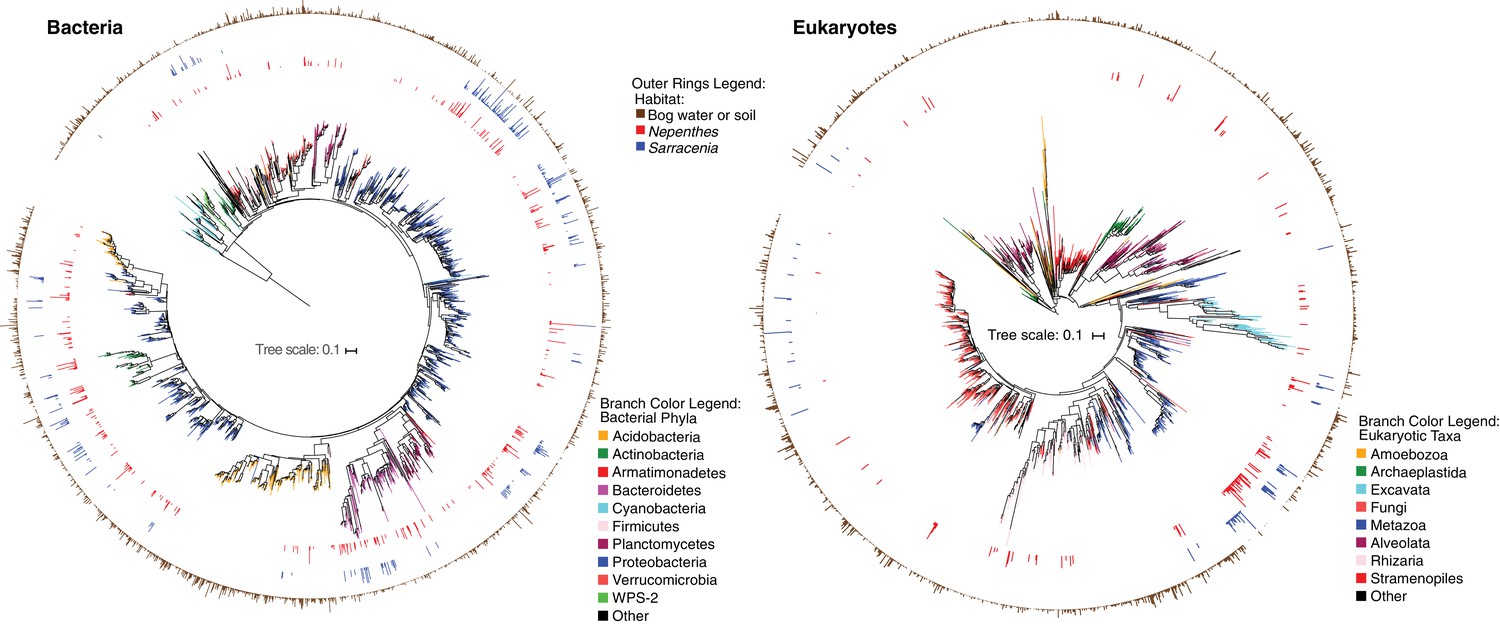
The same phylogenies as in Figure 2, with branch lengths included and branches colored by taxonomic assignment.
https://doi.org/10.7554/eLife.36741.006
Figure 3 with 2 supplements
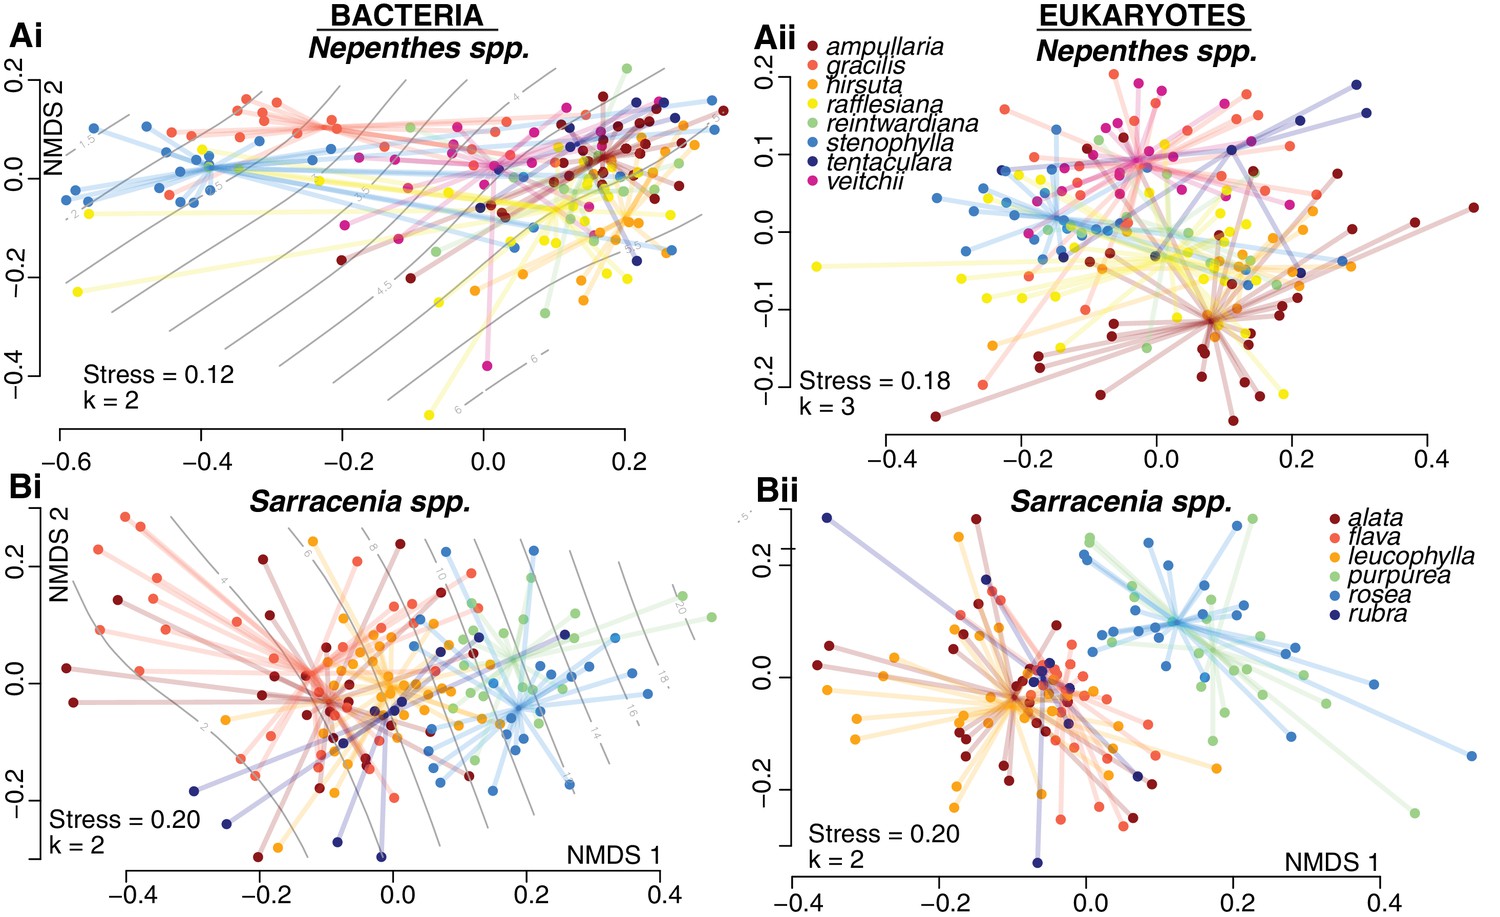
Community compositions differ by host species within both Nepenthes and Sarracenia pitchers.
NMDS ordinations of pitcher samples, colored by host species. Ordisurf vectors with correlations greater than 0.3 are mapped onto the ordinations: pH in (Ai) and volume in (Bi).
Figure 3—figure supplement 1
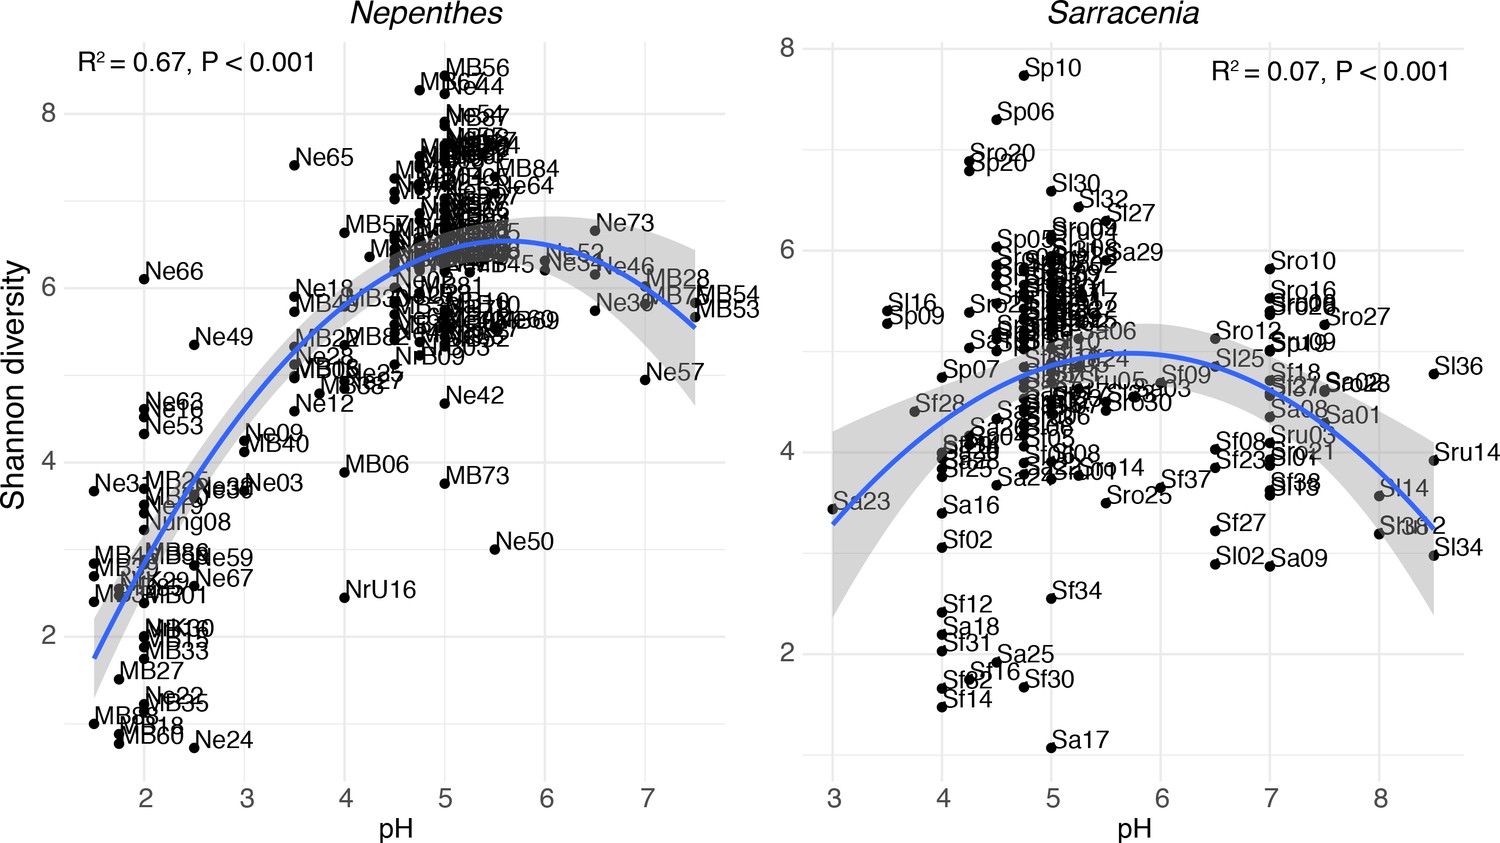
Shannon diversities of bacterial communities from Nepenthes and Sarracenia pitchers have non-linear relationships with pH.
Diversity peaks around pH 5.5 for samples from both genera.
Figure 3—figure supplement 2
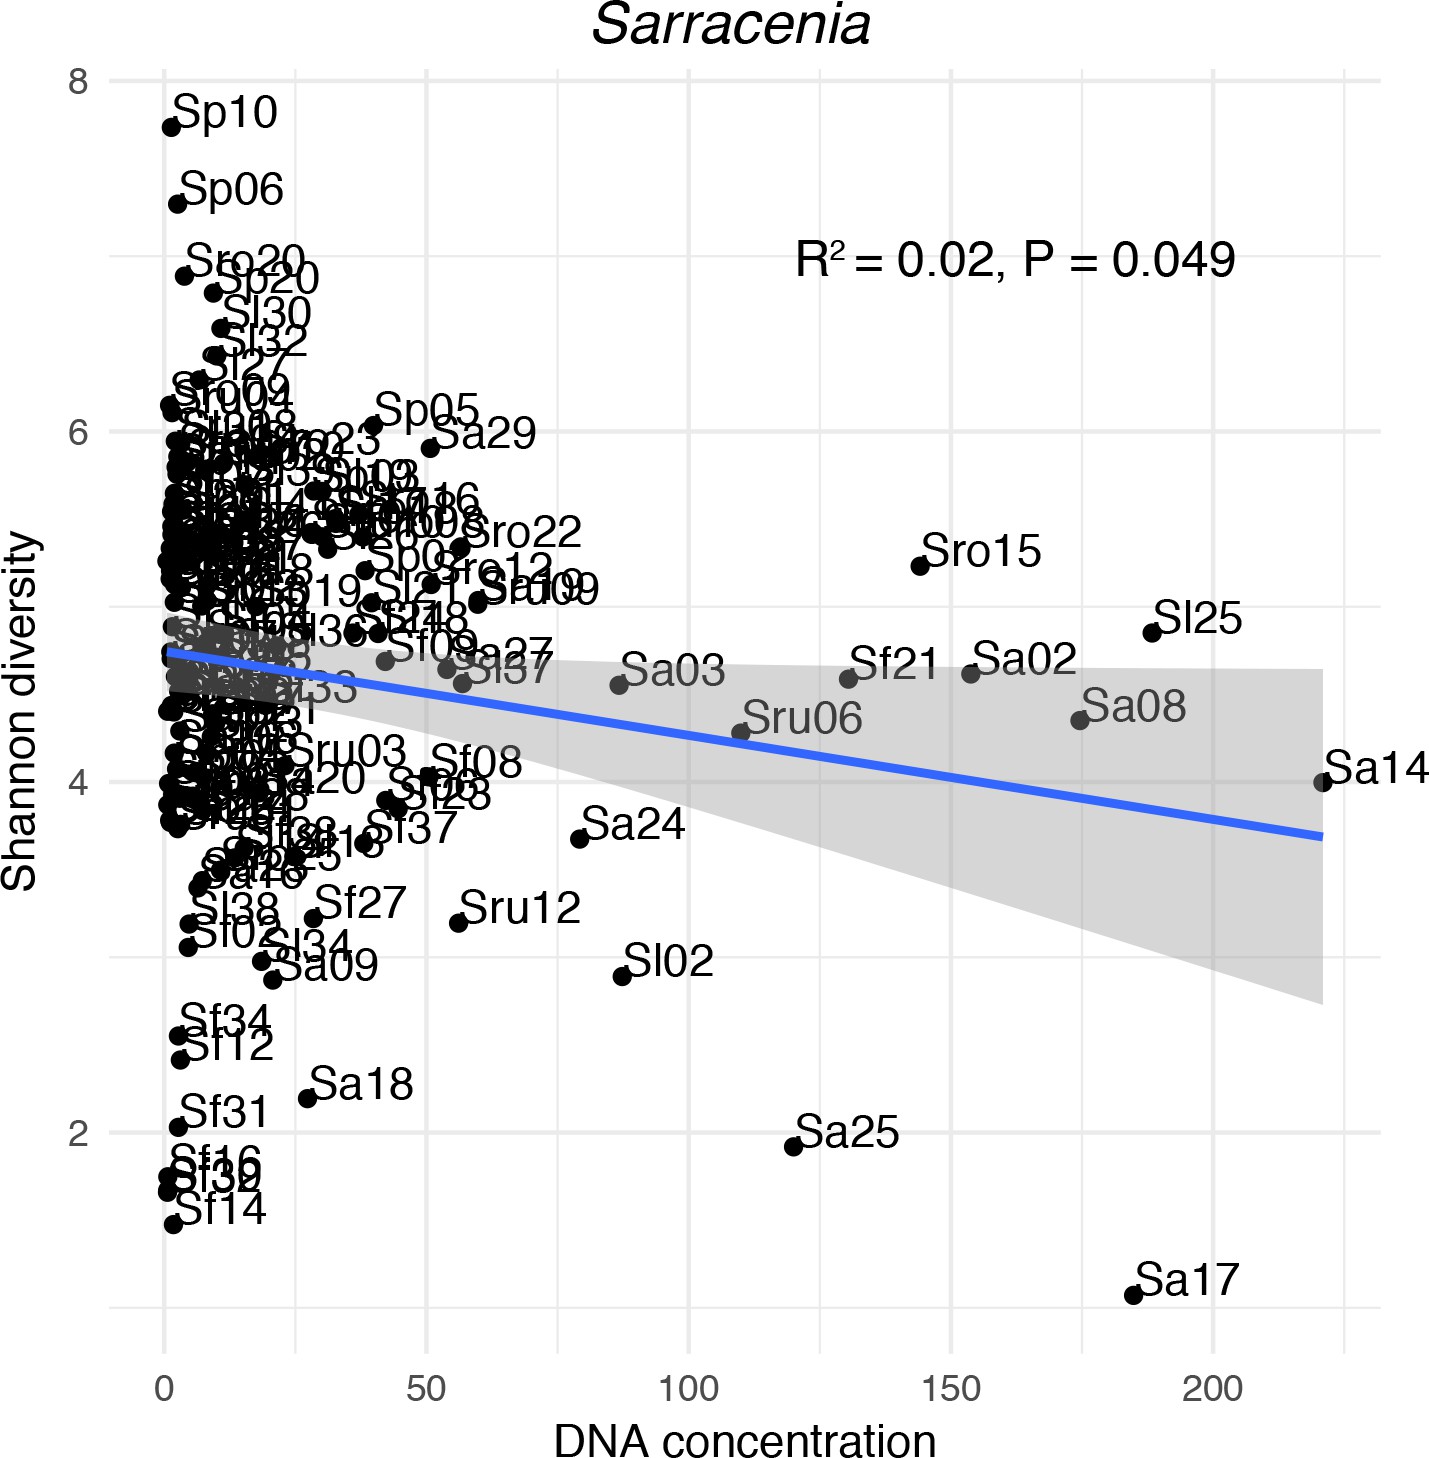
A few samples drive a weak correlation between the DNA concentration and Shannon diversity of Sarracenia pitcher bacterial communities.
https://doi.org/10.7554/eLife.36741.009
Figure 4
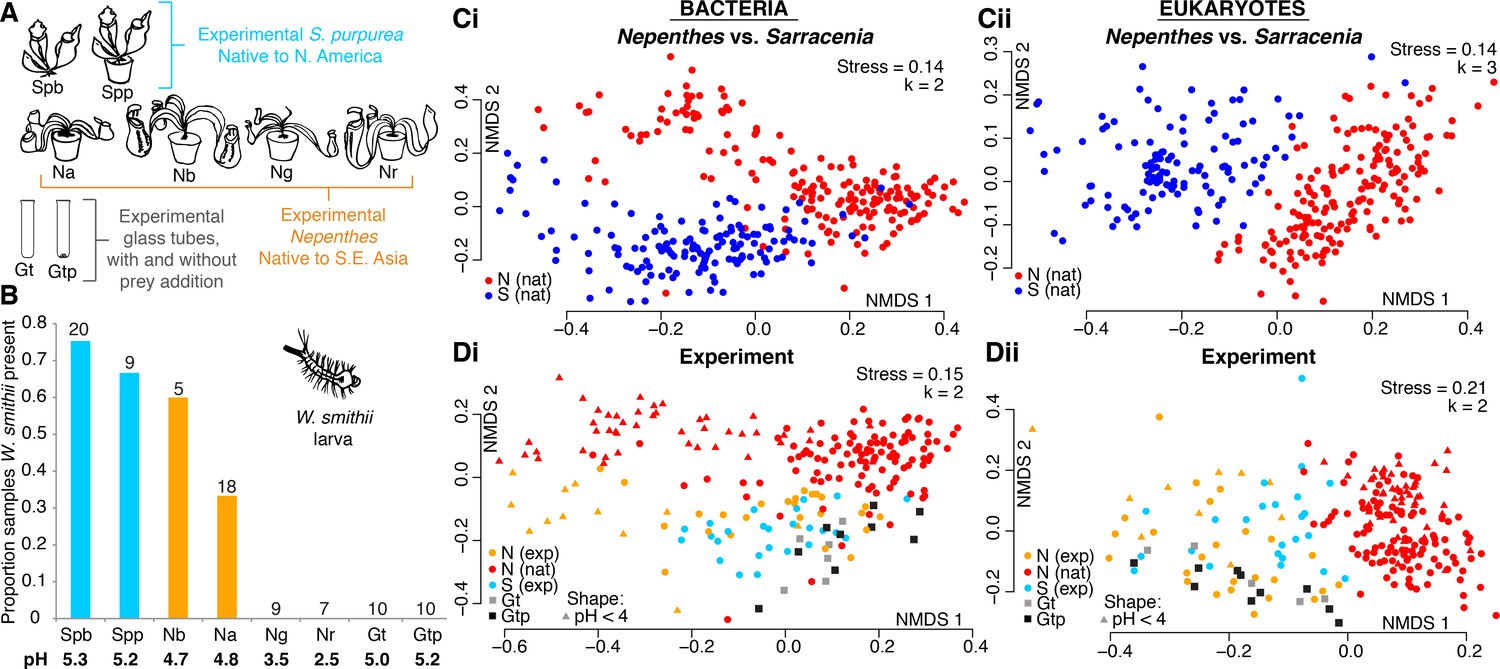
A manipulative field experiment demonstrates that Nepenthes pitchers in a Sarracenia habitat assemble Sarracenia-like microcosms.
(A) Experimental treatments: Spb = Sarracenia purpurea bog; Spp = S. purpurea pot; Na = Nepenthes ampullaria; Nb = N. bicalcarata; Ng = N. gracilis; Nr = N. rafflesiana; Gt = glass tube; Gtp = glass tube with sterilized prey. (B) Wyeomyia smithii (pitcher plant mosquito) larvae colonized their native S. purpurea hosts, as well as foreign Nepenthes species with average pH > 4, but not pitcher-shaped glass tubes. Numbers of samples are listed above each category, and average pH values are listed below. (C) Natural microcosms of Nepenthes and Sarracenia pitchers sampled in SE Asia or North America house different organisms (Ci and Cii). (D) However, experimentally-relocated Nepenthes converge on Sarracenia-like communities and differ from those of natural Nepenthes (Di and Dii), except for bacterial communities sampled from Nepenthes in which pH < 4 (Di). Glass tubes (with or without added prey) of a pitcher-like form assemble communities that are similar to those of experimental pitchers (Di and Dii).
Figure 5
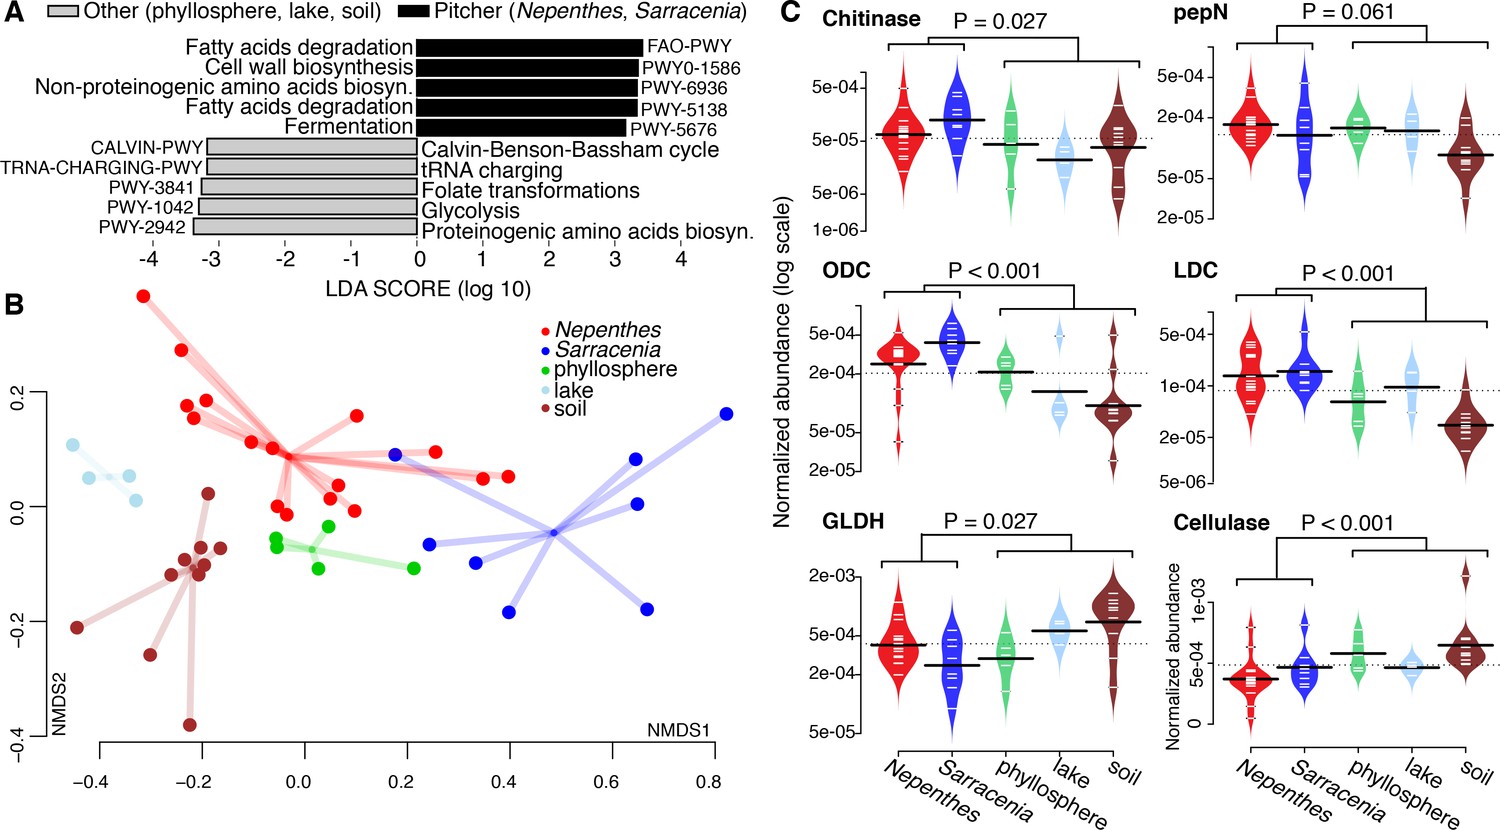
Pitcher plant microbiomes are enriched in degradation genes.
(A) Gene pathways enriched in pitcher plant versus other environmental metagenomes. (B) NMDS plot of functional gene families comparing pitcher plant and environmental metagenomes. (C) Relative abundance of gene families in metagenomes. Abbreviations: pepN = aminopeptidase N; ODC = ornithine decarboxylase; LDC = lysine decarboxylase; and GLDH = glutamate dehydrogenase.
Tables
Key resources table
| Reagent type (species) or resource | Designation | Source or reference | Identifiers | Additional information |
|---|---|---|---|---|
| Commercial assay or kit | MoBio PowerClean kit | Qiagen/MoBio | ||
| Commercial assay or kit | Quant-iT High-Sensitivity dsDNA Assay Kit | Invitrogen/ThermoFisher | ||
| Commercial assay or kit | TruSeq DNA PCR Free HT Kit | Illumina | ||
| Commercial assay or kit | KAPA LTP Library Prep Kit | Roche | ||
| Commercial assay or kit | KAPA Library Quantification Kit | Roche | ||
| Commercial assay or kit | PerfeCta NGS Library Quantification Kit | Quanta Biosciences/VWR |
Additional files
-
Supplementary file 1
Tables S1-S5
- https://doi.org/10.7554/eLife.36741.012
-
Supplementary file 2
Sample Metadata
- https://doi.org/10.7554/eLife.36741.013
-
Transparent reporting form
- https://doi.org/10.7554/eLife.36741.014
Download links
A two-part list of links to download the article, or parts of the article, in various formats.
Downloads (link to download the article as PDF)
Open citations (links to open the citations from this article in various online reference manager services)
Cite this article (links to download the citations from this article in formats compatible with various reference manager tools)
Convergence between the microcosms of Southeast Asian and North American pitcher plants
eLife 7:e36741.
https://doi.org/10.7554/eLife.36741


