Cerebellar involvement in an evidence-accumulation decision-making task
- Princeton University, United States
- Rutgers Robert Wood Johnson Medical School, United States
Figures
Figure 1 with 3 supplements
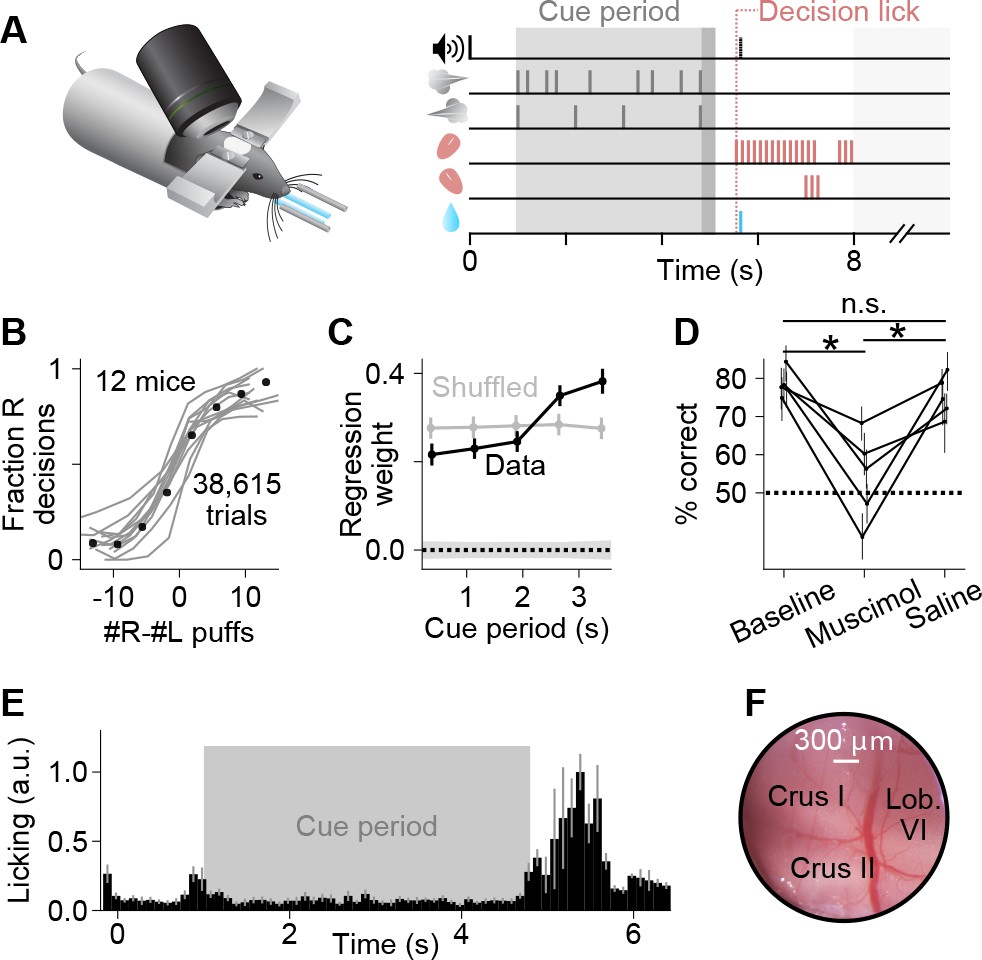
A somatosensory decision-making task that depends on the cerebellum.
(A) In each trial, two streams of random, temporally Poisson-distributed air puffs were delivered to the left and right whiskers. After a delay, mice licked one of two lick ports indicating the side with more cumulative puffs to receive a water reward. Gray-shaded regions from left to right: cue period, delay, intertrial interval. Decision lick: first detected lick after the delay. (B) Psychometric performance data on the evidence accumulation task. Gray lines, individual mice; black points, average across all trials from all animals (n = 38,615 trials, 12 mice). (C) Logistic regression analysis correlating animal choice with cues delivered at different time bins of evidence presentation, demonstrating that the entire cue period was used to guide decisions. Each point indicates the magnitude of that time bin’s influence on decisions (all points significantly greater than zero, Wald test, p<0.0001). For comparison, bins (gray points) or choices (shaded 1 s.d. gray zone) were shuffled. Error bars: 95% confidence interval. (D) Behavioral effect of bilateral injections of muscimol or saline into crus I, compared to baseline performance with no injections. Each set of joined points represents one mouse. Error bars: 95% confidence interval. *p<0.05, n.s.: not significant (two-tailed paired t-test). (E) Movie-based licking measurements from mice over the duration of trials. Bar heights show mean ±s.e.m. across animals of trial-averaged licking signals. (F) Example cranial window over the left posterior hemispheric cerebellum, indicating the site of imaging and inactivation.
Figure 1—figure supplement 1

Behavioral performance in the decision-making task.
(A) Psychometric data for individual subjects in individual behavioral sessions. For each subject, data from the session at the 75th percentile of performance is displayed. (B) Histogram of percent correct performance over all mice and sessions in the accumulation stages of the task.
Figure 1—figure supplement 2

Behavior in inactivation experiments.
(A) Left: Psychometric curves for all trials from the baseline, saline, and muscimol conditions. Only L/R: trials from earlier in the shaping procedure were delivered, in which puffs were presented exclusively on the correct side, guide puffs were delivered following the cue period, and free rewards were delivered on the correct side. Performance was measured according to the side that the mice licked first, just as they do to indicate their decision in the main task. Right: Regression analysis as in Figure 1C for all trials in the indicated conditions. Error bars: 95% confidence interval. (B) Quantification of lick rate and decision latency (time from port arrival to decision lick) for all mice in all conditions. Boxes: lower and upper quartiles, line: median, whiskers: 5th to 95th percentile. Within-subject differences of rate and latency across control (baseline/saline) and muscimol conditions, and across left (L) and right (R) choices, were not significant (p>0.05, two-tailed paired t-test). As in all analyses, trials with no decision lick were excluded; this accounted for 2.0 ± 2.7% of trials in the baseline condition, and 2.6 ± 5.1% of trials in the muscimol condition (mean ±std over sessions), and was not significantly different across the baseline and muscimol conditions (p=0.54, two-tailed t-test). (C) Best-fit coefficients from the behavioral regression model. Each data point corresponds to one pair of sessions (colored by animal identity), corresponding to a muscimol inactivation session and the control session directly preceding it. Error bars indicate standard error of the fit coefficients. The evidence sensitivity parameter was significantly reduced in the muscimol condition relative to control, and the success history and failure history fit parameters were significantly increased relative to control (p<0.05, bootstrap). For the latter three parameters, one data point is omitted from display because the best-fit standard error was uninterpretably large (>8 standard deviations from others). (D) Psychometric curves for all trials from the five individual subjects in the control and muscimol conditions (one panel per subject). Curves show fits to a four-parameter logistic function (see Methods). In top-left panel, L and R indicate additional sessions in which muscimol was delivered only to the left (L) or right (R) cerebellum, to determine whether vertical shifts in the psychometric curve can be explained by left-right asymmetry of injections. Error bars: 95% confidence interval.
Figure 1—figure supplement 3
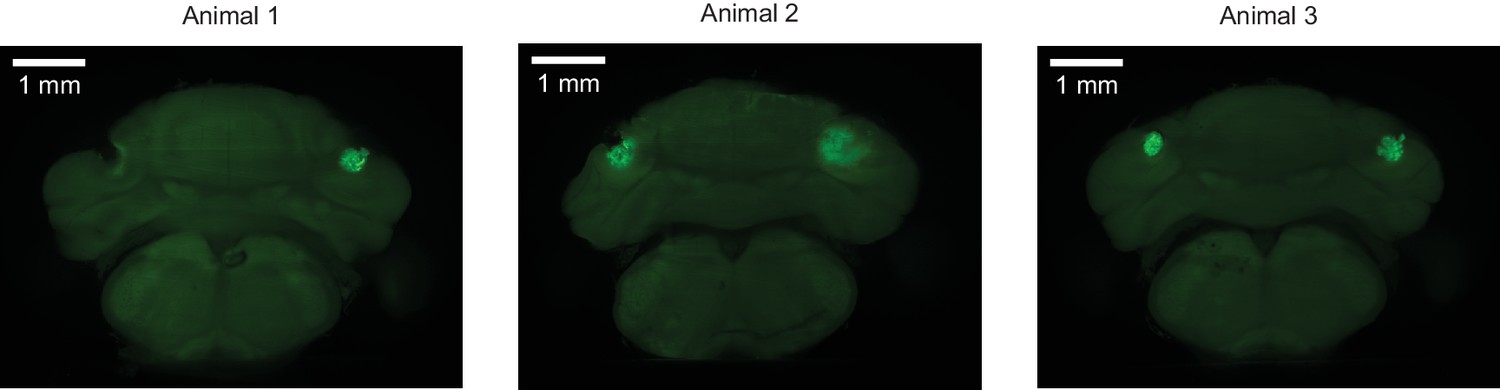
Muscimol injection sites.
For three mice in the muscimol inactivation experiment, coronal view demonstrating the sites of injection of muscimol, as marked by fluorescein delivered by injection of identical protocol after completion of the experiments. Lesions near or encompassing injections sites may be due to bone growth or damage from implant removal.
Figure 2 with 4 supplements
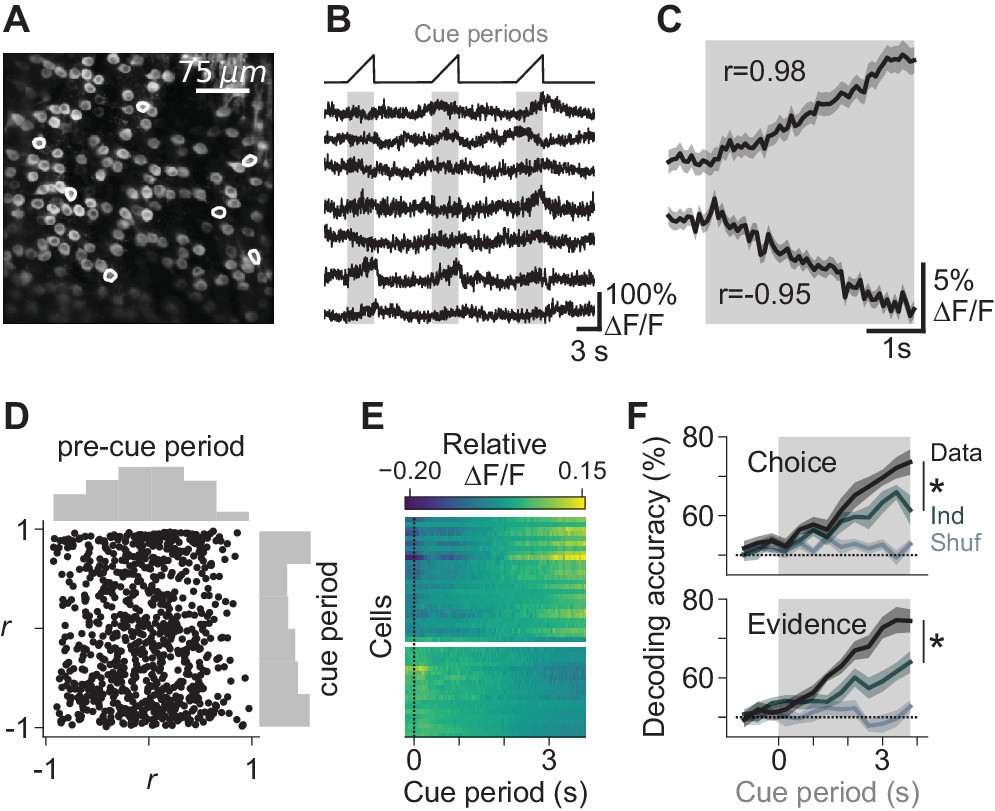
Task-dependent modulation of Purkinje cell somatic calcium signals.
(A) Example two-photon field of view of Purkinje cell somata. (B) Traces of extracted calcium signals from somata indicated in (A). Shaded regions and ramps at top indicate cue periods. (C) Trial-averaged activity during evidence presentation from two example cells. Modulation index r was defined as the Pearson correlation between the averaged signal and time in the cue period. Confidence interval on traces indicates s.e.m. (D) Cue-period fluorescence modulation in all imaged somata (n = 4 mice, 843 cells). Modulation index r was computed preceding the cue period (‘pre-cue’) and during the cue period. (E) Trial-averaged activity during the cue period of neurons with the highest absolute modulation index (top 5%) in each session. ∆F/F signals are mean-subtracted. (F) Output of a linear decoder predicting the animal’s upcoming choice and the side with more evidence on a trial-by-trial basis using somatic data from the cue period of each trial. Each trace represents the mean ±s.e.m. (n = 6 sessions in four mice). Choice: side of the animal’s decision. Evidence: side with more evidence. Gray-shaded regions: cue period. Shuffle: relevant variable (choice or evidence, respectively) was shuffled across trials. Ind: relevant variable (choice or evidence, respectively) was shuffled while holding the other variable constant, to compute the independence of encoding of the relevant feature. *: p<0.01 (paired t-test using cue-period-only data).
Figure 2—figure supplement 1
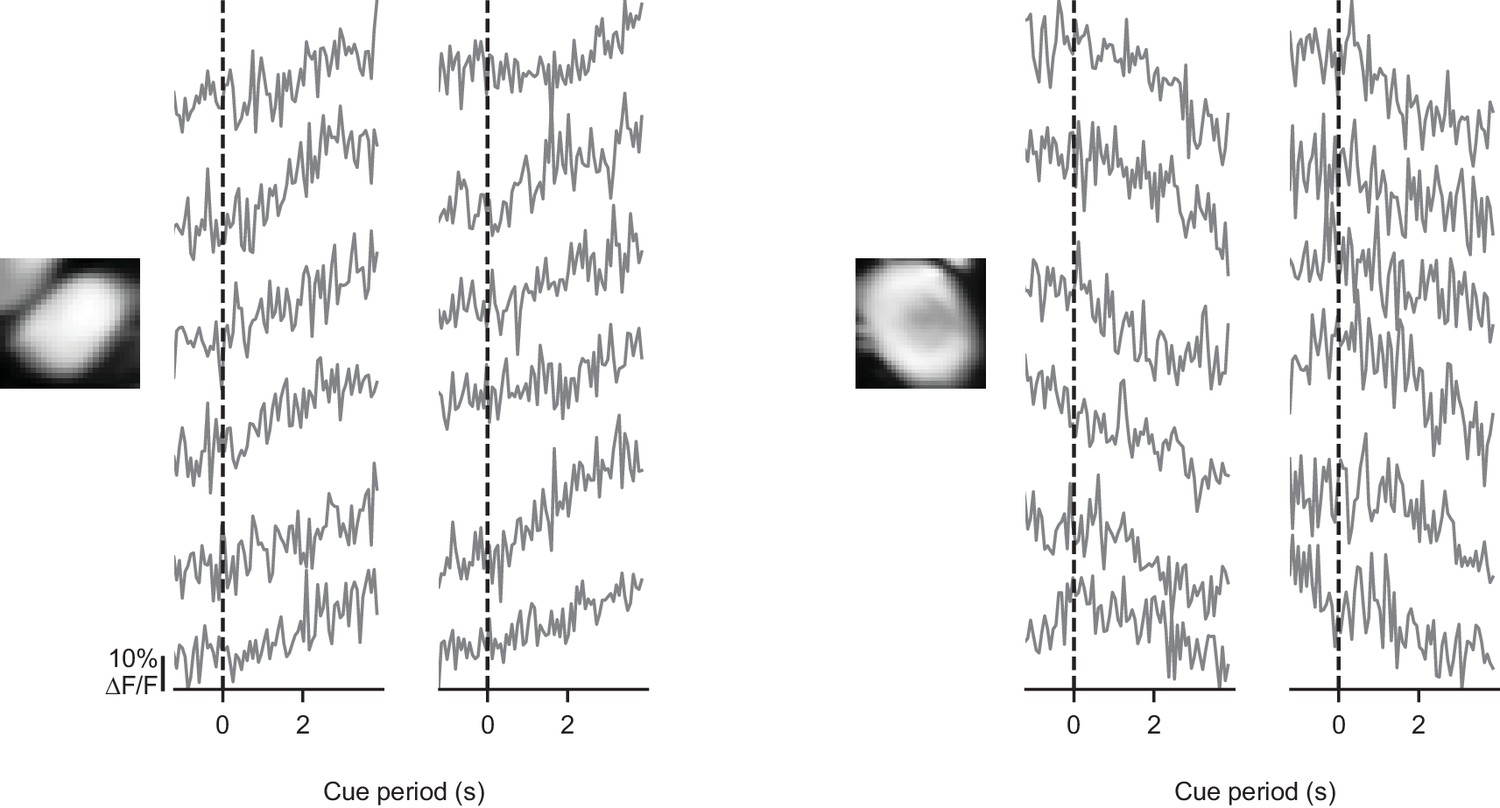
Somatic signals are modulated on individual trials.
For two example somata, activity is shown in the cue period of 12 individual trials with modulated activity. Each trace derives from one trial. Evidence presentation begins at the dashed line.
Figure 2—figure supplement 2
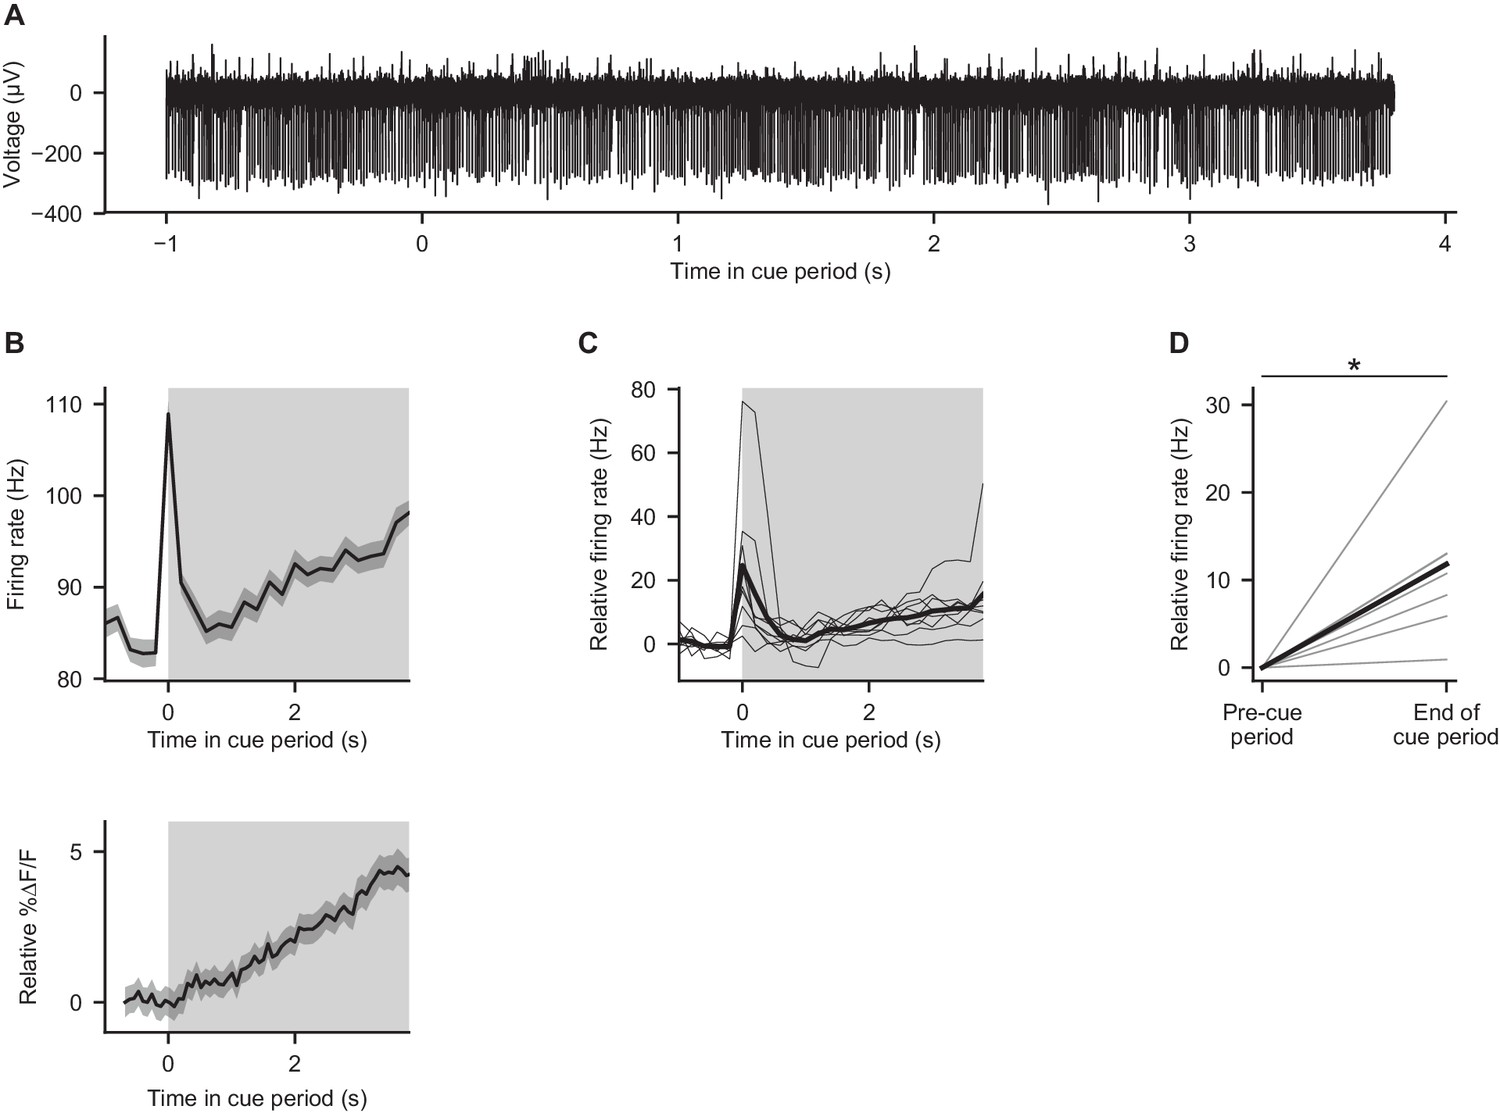
Electrical recordings from Purkinje cells during behavior.
(A) Example electrophysiological recording from a crus I Purkinje cell during the cue period of one trial in a mouse performing the evidence accumulation task. (B) Top: trial-averaged activity of the cell shown in (A). Gray shading: cue period. Error shading: s.e.m. Bottom: trial-averaged calcium signal from the cell shown in Figure 2C, for comparison to electrical trace. (C) Trial-averaged activity of nine Purkinje cells from three mice. Thin lines: individual cells. Thick line: mean across cells. Gray shading: cue period. (D) Comparison of mean firing rates in the final 1 s of the cue period (‘end of cue period’) relative to the 1 s preceding the cue period (‘pre-cue period’). Thin lines: individual cells. Thick line: mean across cells. *p<0.001, two-tailed paired t-test.
Figure 2—figure supplement 3
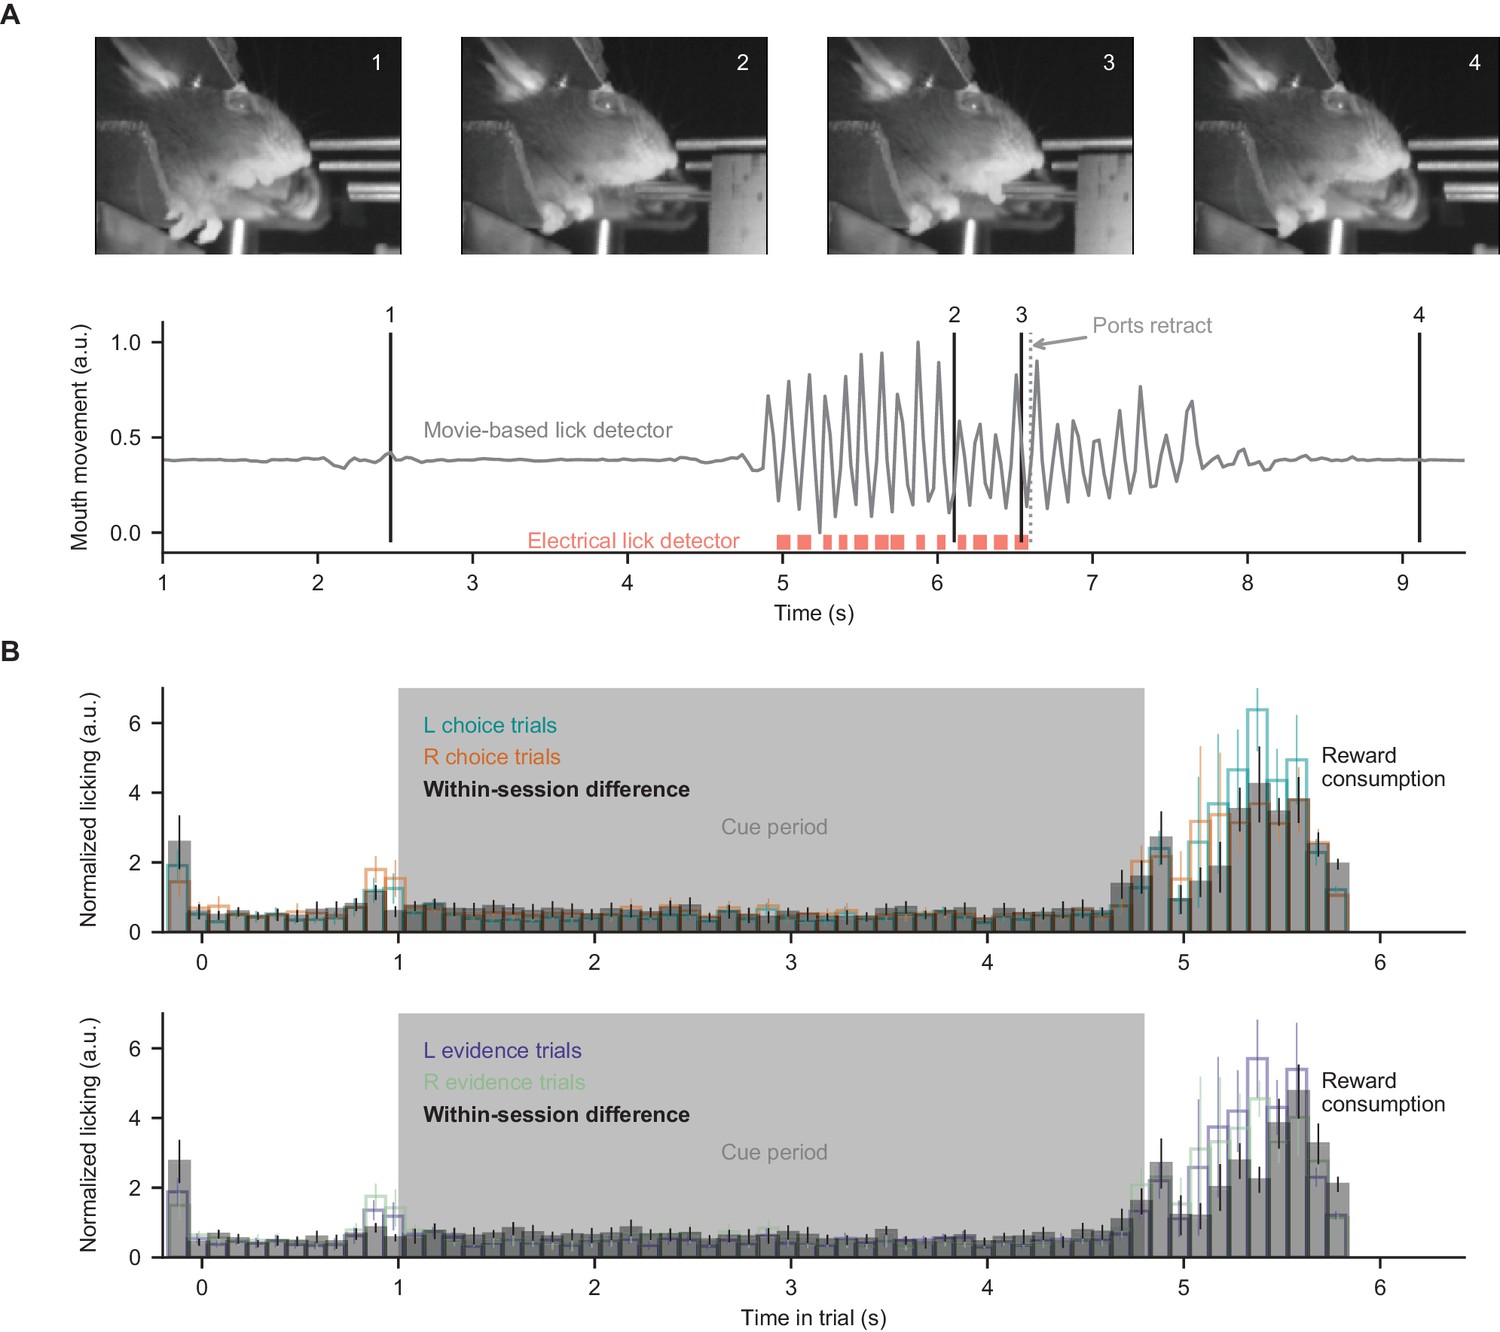
Movie-based licking measurements.
For the closed-loop experimental apparatus, licks during decisions and reward consumption were measured by an electrical detector which retracted during evidence presentation. Therefore, here we measured licking during evidence presentation (when ports were retracted) using behavioral movies. (A) Mouth movement was measured using a region-of-interest analysis, and aligns with electrical measures of licking. (B) Licking measurements from all mice in all somatic imaging sessions, split according to the choice or correct side of the trials. Within-session difference: absolute difference between mean licking signals of the two displayed conditions, computed on a session-by-session basis. Bar heights indicate mean ±s.e.m. across sessions.
Figure 2—figure supplement 4
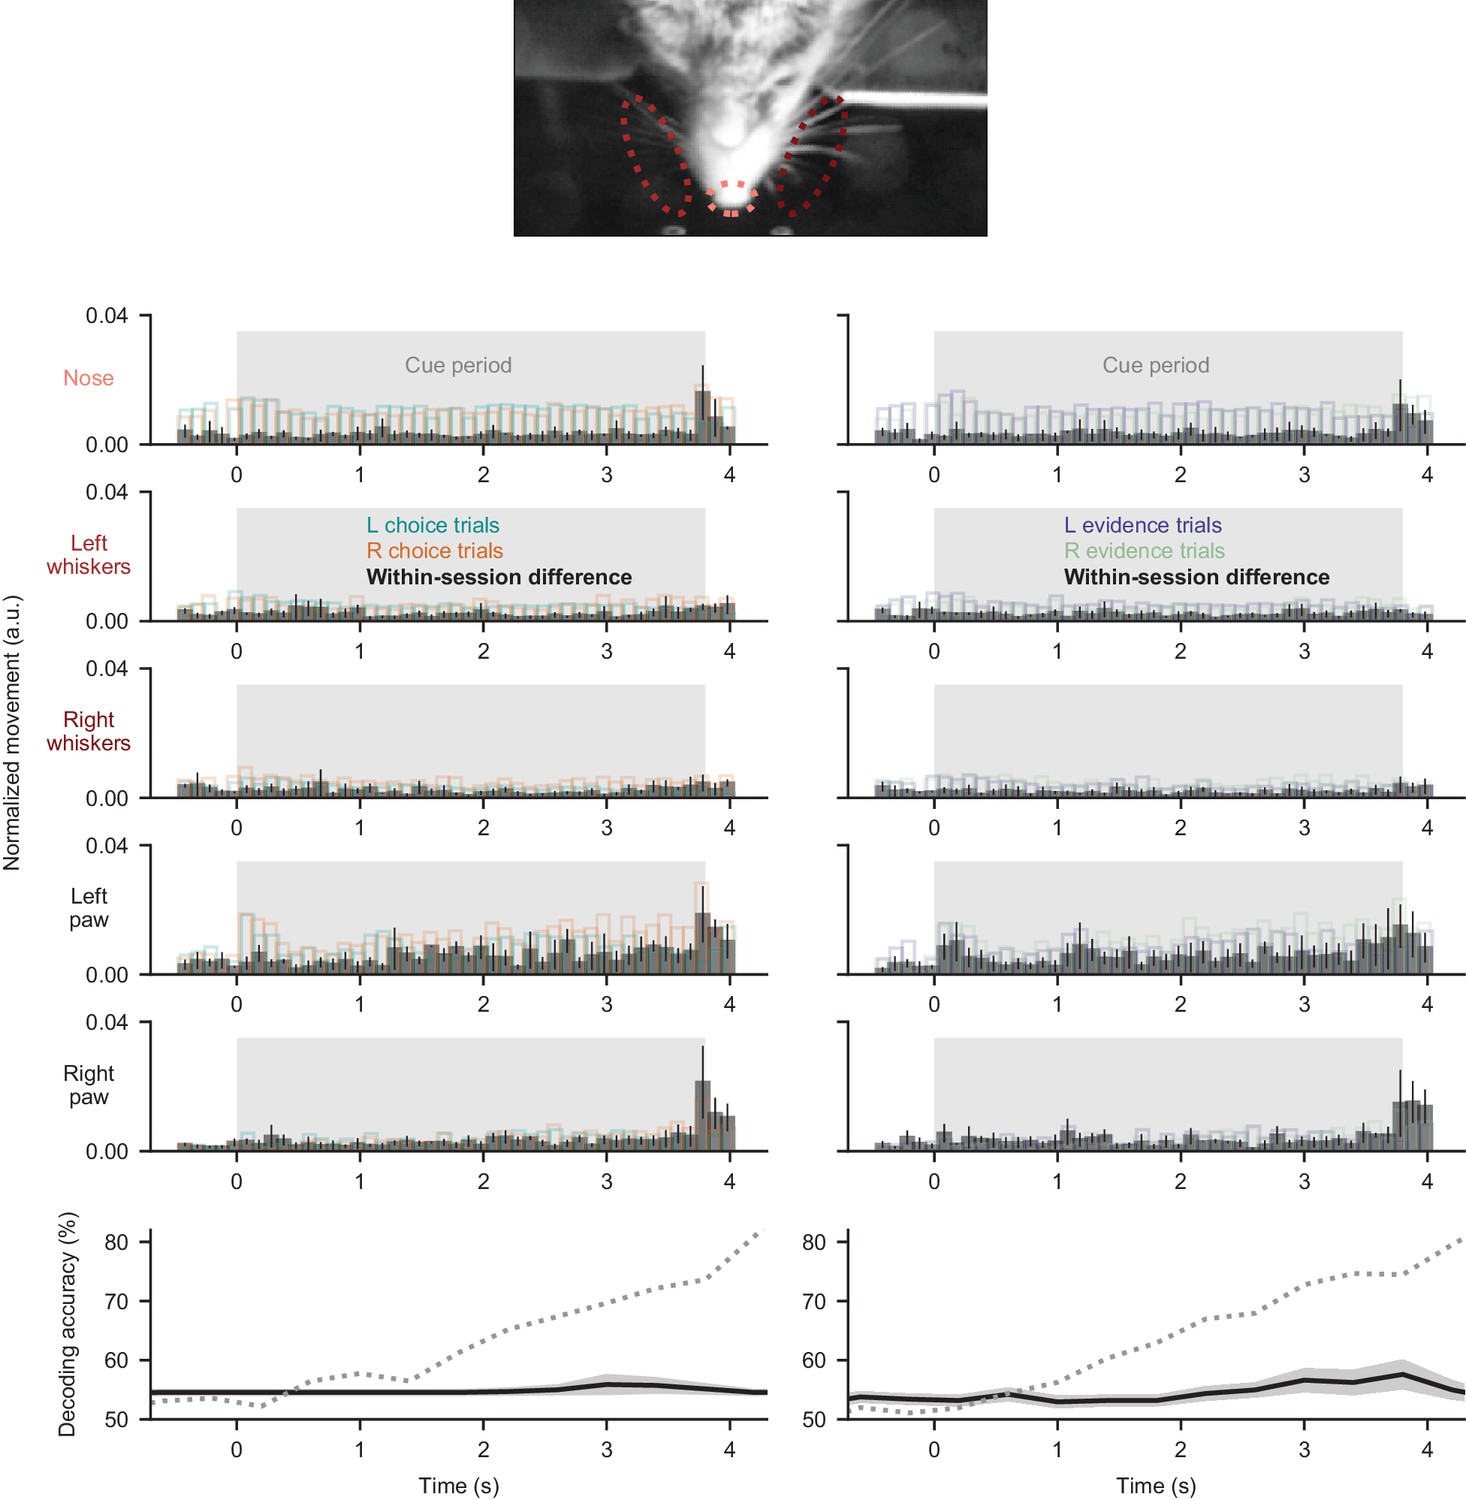
Movements do not explain somatic signals.
Movements of the nose, whiskers, and paws were measured from behavioral movies (see Materials and methods, Video 2, Video 3). Top five rows: each row represents one movement parameter. Left column: movement quantified during the cue period and split according to the subsequent choice made at the end of the trial. Black bars were computed as the difference between left and right trials on a session-by-session basis. Right column: same as left, but trials were split according to the correct side of the trial (side with more evidence). Bar heights indicate mean ±s.e.m. across all somatic imaging sessions in all subjects. Mean movement rates did not differ across left- and right-choice trials (p=0.17 for nose, p=0.16 for left whiskers, p=0.61 for right whiskers, p=0.47 for left forepaw, p=0.33 for right forepaw; two-tailed paired t-test), or across left- and right-evidence trials (p=0.16 for nose, p=0.96 for left whiskers, p=0.47 for right whiskers, p=0.15 for left forepaw, p=0.72 for right forepaw; two-tailed paired t-test). Bottom row: decoding was performed as in Figure 2F, except using the above movement measurements as regressors. Solid line: decoding accuracy, error shading: mean ±sem over sessions. Dotted line: somatic decoding accuracy from Figure 2F for comparison.
Figure 3 with 1 supplement
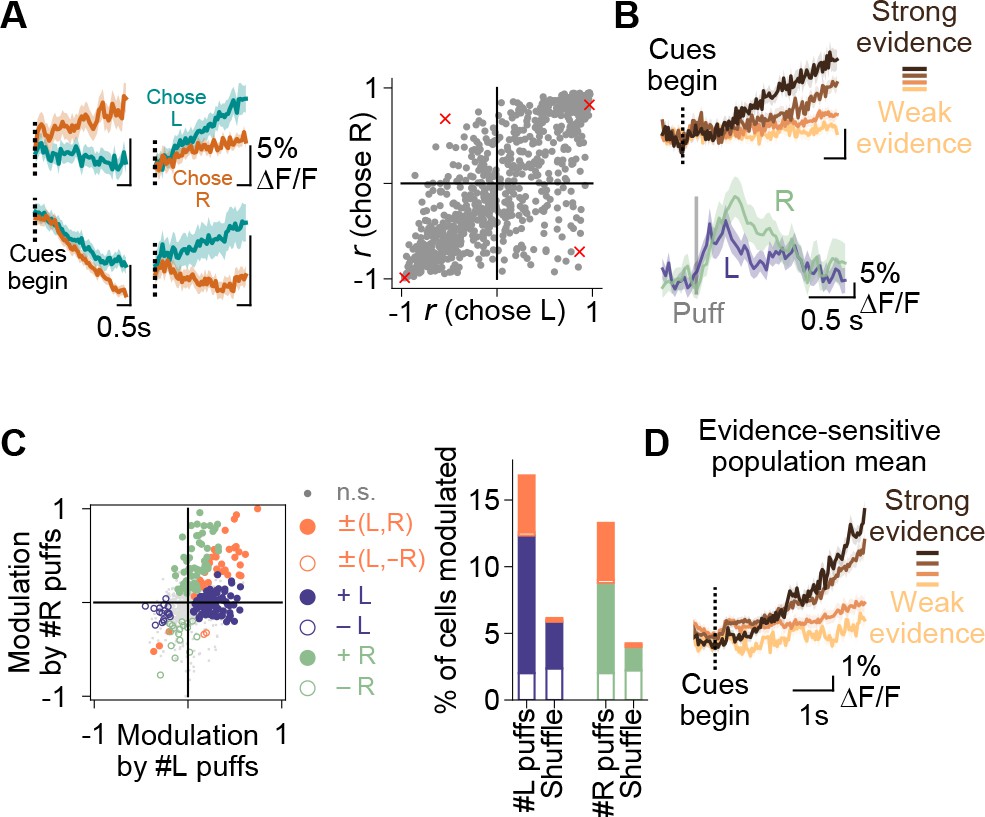
Purkinje cell representations of choice and evidence.
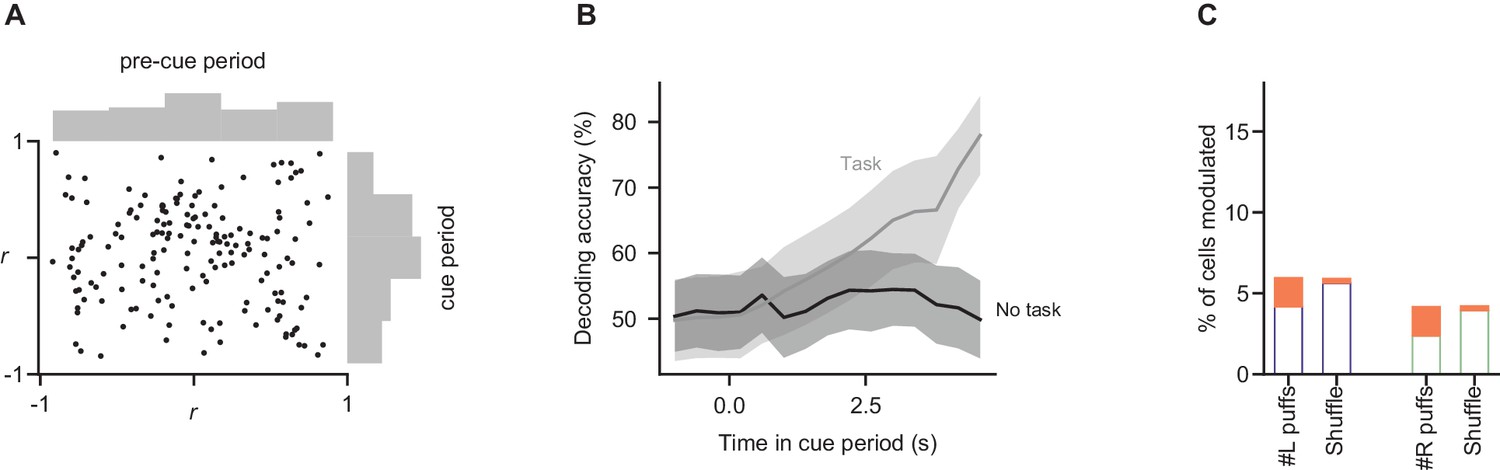
(A) Left: mean activity of four example somata during the cue period, split according to the choice made in each trial. Traces represent mean ±s.e.m. over all trials of a particular choice. Right: summary of the relationship between modulation index r and animal choice for all imaged cells. Red x’s: cells shown on left. (B) Top: mean cue-period activity in correct trials from one example cell, split according to the strength of evidence presented (strong: #L puffs > 9; weak: #L puffs < 2). Bottom: mean puff-triggered response of one example cell to left (L)- and right (R)-sided puffs. Mean t1/2 decay: 406 ms. Shading: s.e.m. (C) A linear model was used to determine the influence of left- and right-sided puffs on pre-decision fluorescence activity for each cell over all trials. Left: each dot represents one cell. Modulation: normalized coefficient of the linear fit between puff number and fluorescence. Colored data points indicate cells with significant coefficients. Right: Proportion of cells in each category on left. Shuffle: puff counts were shuffled across trials of the same choice before regression. Percent of modulated cells is significantly above the shuffle for the +L, +R and ±(L,R) conditions (p<0.0001, two-tailed z-test). (D) Mean cue-period activity in correct trials across all evidence-modulated cells, split according the level of evidence presented in the trial (strong: #pref side puffs-#nonpref side puffs > 8; weak: #pref side puffs-#nonpref side puffs<-8).
Figure 3—figure supplement 1
Somatic modulations are absent in a task-free context.
Mice not trained to perform the decision-making task were imaged during behavioral sessions in which stimuli were delivered in the same manner as in the task (n = 2 mice, 449 trials, 168 cells). Analyses of fluorescence modulation, decoding, and evidence representations were performed as in Figures 2D,F and 3C, respectively. (A) Comparison of fluorescence modulation index in the pre-cue and cue periods, as in Figure 2D. The percentage of cells in which cue-period fluorescence was better correlated with time than pre-cue-period fluorescence was 46% (95% CI: 40–53%, bootstrap), statistically indistinguishable from the percentage when cue and pre-cue period identity was shuffled (46% of cells; 95% CI: 39–52%). (B) Decoding analysis was run as in Figure 2F (bottom panel), predicting the side with more evidence using fluorescence measurements. To facilitate comparison of data from mice performing the task (grey line) and those not performing the task (black line), subsets of the data matched in trial and cell count were subsampled 1000 times from each condition, and the lines show mean ±std of decoding accuracy for each. Peak decoding accuracy was significantly higher in the task context than in the no-task context (p=0.03; fraction of subsamples in which peak decoding accuracy in no-task-context sample exceeded that in task-context sample). (C) As in Figure 3C, linear modeling was used to relate fluorescence to puff count on a trial-by-trial basis. Procedure and conventions follow Figure 3C, demonstrating the fraction of cells with significant modulation by evidence. Percent of modulated cells is statistically indistinguishable from the shuffle condition for all modulations (p>0.05, two-tailed z-test).
Figure 4 with 1 supplement
Purkinje cell dendrites encode decision errors.
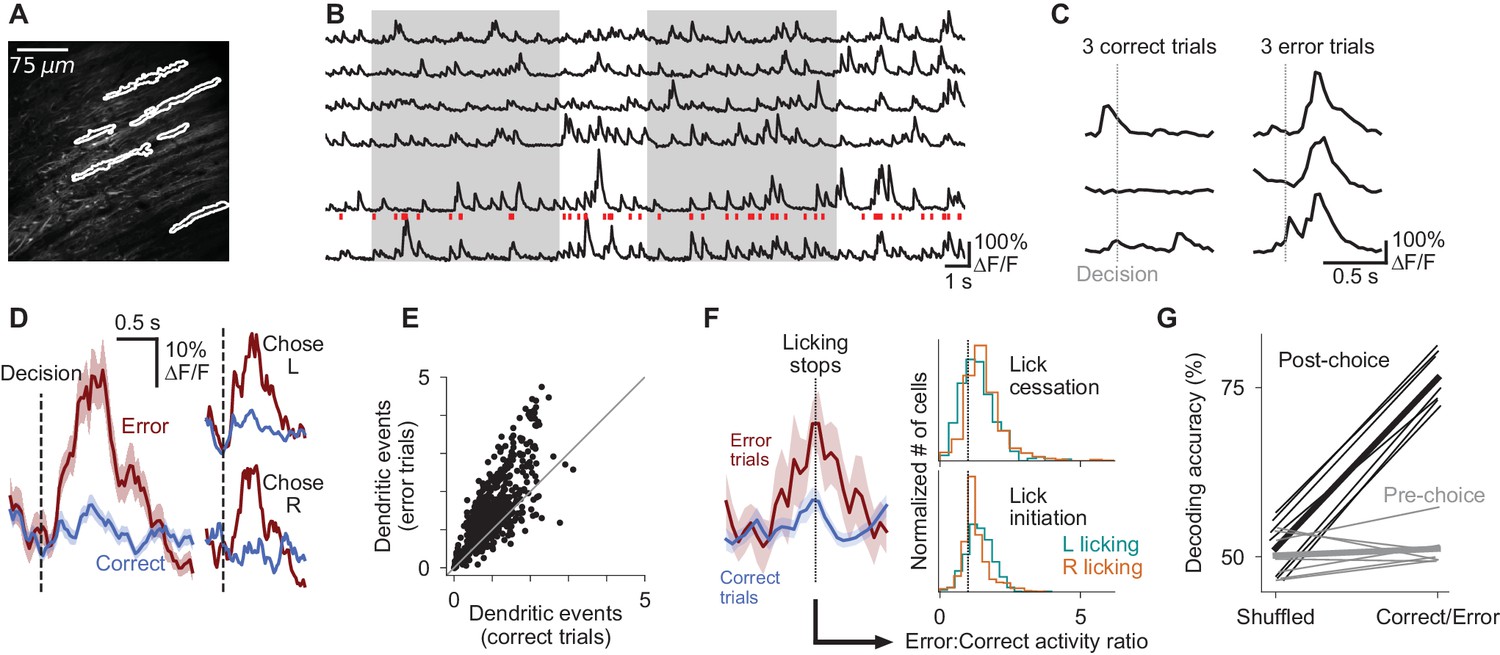
(A) Example two-photon field of view of Purkinje cell dendrites. (B) Signals extracted from cells indicated in (A). Red ticks: dendritic calcium transients extracted from the bottom trace. (C) Activity of one cell in six trials, aligned to the moment of the decision lick. (D) Mean activity of one example cell aligned to the moment of the decision lick. Left: activity is divided into correct and error trials. Right: activity is further divided into left-choice and right-choice trials. Error shading indicates s.e.m. (E) Summary of mean activity in the 800 ms following reward delivery (correct trials) or lack thereof (error trials) (n = 6 mice, 599 cells). (F) Left: mean response of an example dendritic signal aligned to moments when licking ceased, split according the outcome of the trial in which the lick cessation occurred. Right: histograms indicating the magnitude of dendritic activity measured at moments when animals ceased (top) or initiated (bottom) licking, presented as a ratio of activity in error vs correct trials; cells with values greater than one exhibited increased activity when lick-cessation/initiation events occurred with errors, in comparison to the same motor event in correct trials. Error activity is elevated in a significant fraction of cells for all four histograms shown (p<0.0001, Wilcoxon signed-rank test). (G) Outcome (correct/error) decoding on a trial-by-trial basis using neuronal population activity in the period following reward delivery or lack thereof (post-choice), or the period preceding the decision (pre-choice). One line per behavioral session (n = 7 sessions, six mice). Thick lines: mean across sessions.
Figure 4—figure supplement 1
Error-associated behaviors do not explain the error-associated dendritic response.
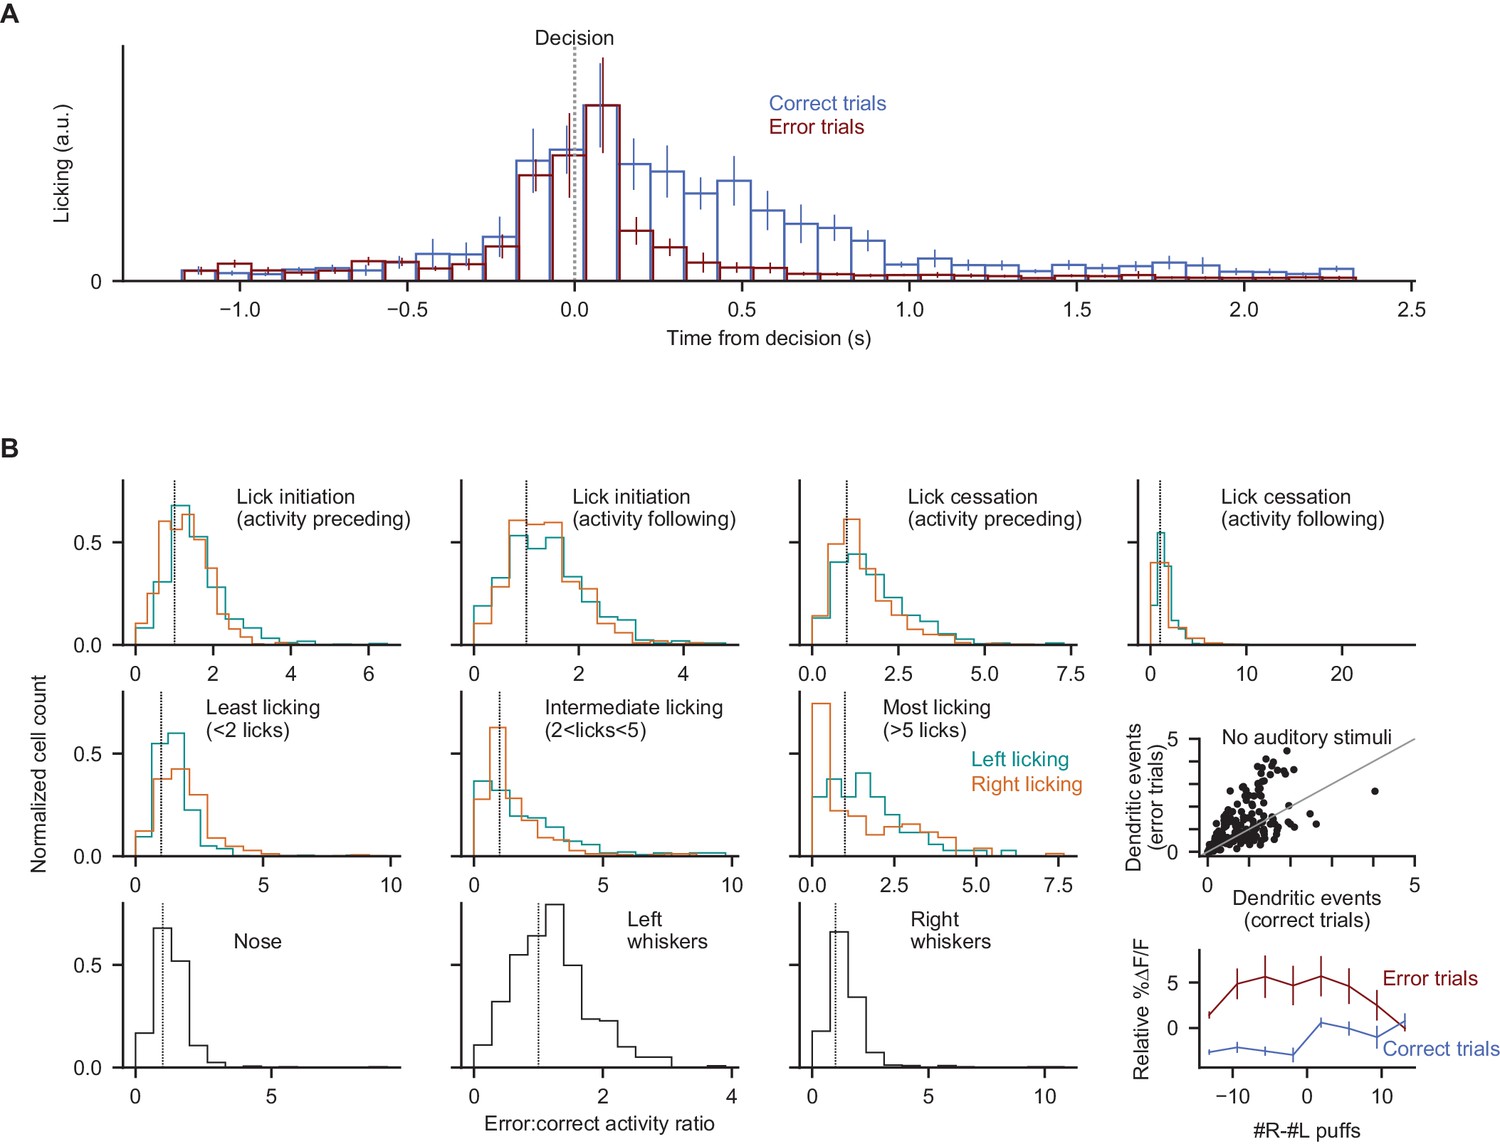
(A) Demonstration of differences in licking behavior following decisions in correct and error trials. Bar heights indicate mean ±s.e.m. across all dendritic imaging sessions in all subjects. (B) For 10 motor measurements, comparison of dendritic signalling aligned to the motor behavior in error vs. correct contexts. For each of the 10 measurements, all instances of that behavioral event were identified, then split according to whether they occurred at errors or in other contexts (see Methods). All histograms show the normalized fraction of cells with a given error:correct activity ratio (cells with a ratio of 1 exhibit the same activity level in error and correct trials at the moment of the motor event). Top four panels: lick initiation and cessation events as in Figure 4, measuring dendritic activity preceding or following the lick initiation/cessation event (to allow for the possibility that movement-related neural activity may precede or follow the measured motor event); middle three panels: post-decision licking bouts binned by quantity of licks; bottom three panels: nose and whisker movements measured from behavioral movies. For data in every histogram, a statistically significant fraction of cells exhibits elevated activity in error contexts (p<0.001, Wilcoxon signed-rank test). Middle rightmost panel: dendritic activity data as shown in Figure 4E, from two additional behavioral sessions in two individual mice, during which all auditory stimuli were absent. Bottom rightmost panel: trial-averaged ∆F/F response in the post-decision period split according to the level of evidence presented in the trial. The response of each cell is subtracted from its total average response. Dendritic responses in error trials were not significantly different across trial difficulties (p=0.59, two-tailed paired t-test). Error bars: s.e.m. across behavioral sessions.
Author response image 1
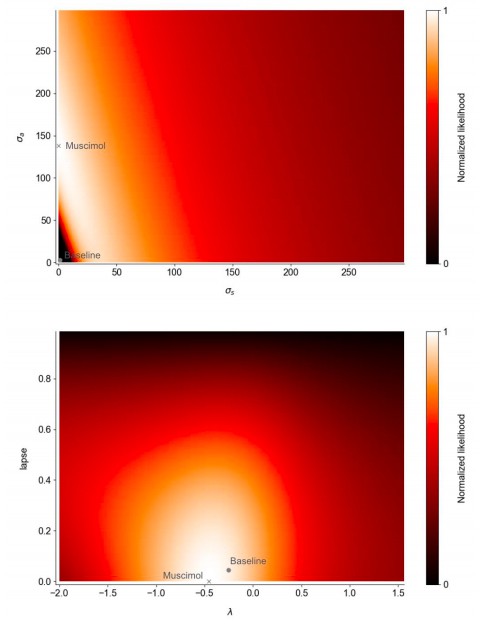
Fits to a 5-parameter drift diffusion model (excluding the adaptation, initial noise, and sticky bounds found in the (Brunton, Botvinick and Brody, 2013) model).
Best-fit parameters in the muscimol and baseline conditions are plotted on the likelihood landscape of the muscimol fit. The top panel indicates a tradeoff between sensory and accumulation noise in the fit to muscimol inactivation trials. However, the statistical confidence intervals for the muscimol fits span the displayed range for the lapse and accumulation noise parameters.
Videos
Video 1
Example trials of a mouse performing somatosensory evidence accumulation.
Flashes along the sides indicate air puffs delivered to the whiskers. Flashes along the bottom indicate detected licks.
Video 2
Measurement of orofacial movements from behavioral movies.
Traces represent the extracted movement metric (see Methods) from the corresponding regions outlined in the movie.
Video 3
Measurement of forepaw movements from behavioral movies.
Traces represent the extracted movement metric (see Materials and methods) from the denoted paws.
Additional files
-
Transparent reporting form
- https://doi.org/10.7554/eLife.36781.018
Download links
A two-part list of links to download the article, or parts of the article, in various formats.
Downloads (link to download the article as PDF)
Open citations (links to open the citations from this article in various online reference manager services)
Cite this article (links to download the citations from this article in formats compatible with various reference manager tools)
Cerebellar involvement in an evidence-accumulation decision-making task
eLife 7:e36781.
https://doi.org/10.7554/eLife.36781


