Insights into centriole geometry revealed by cryotomography of doublet and triplet centrioles
- University of California, United States
- Howard Hughes Medical Institute, United States
Figures
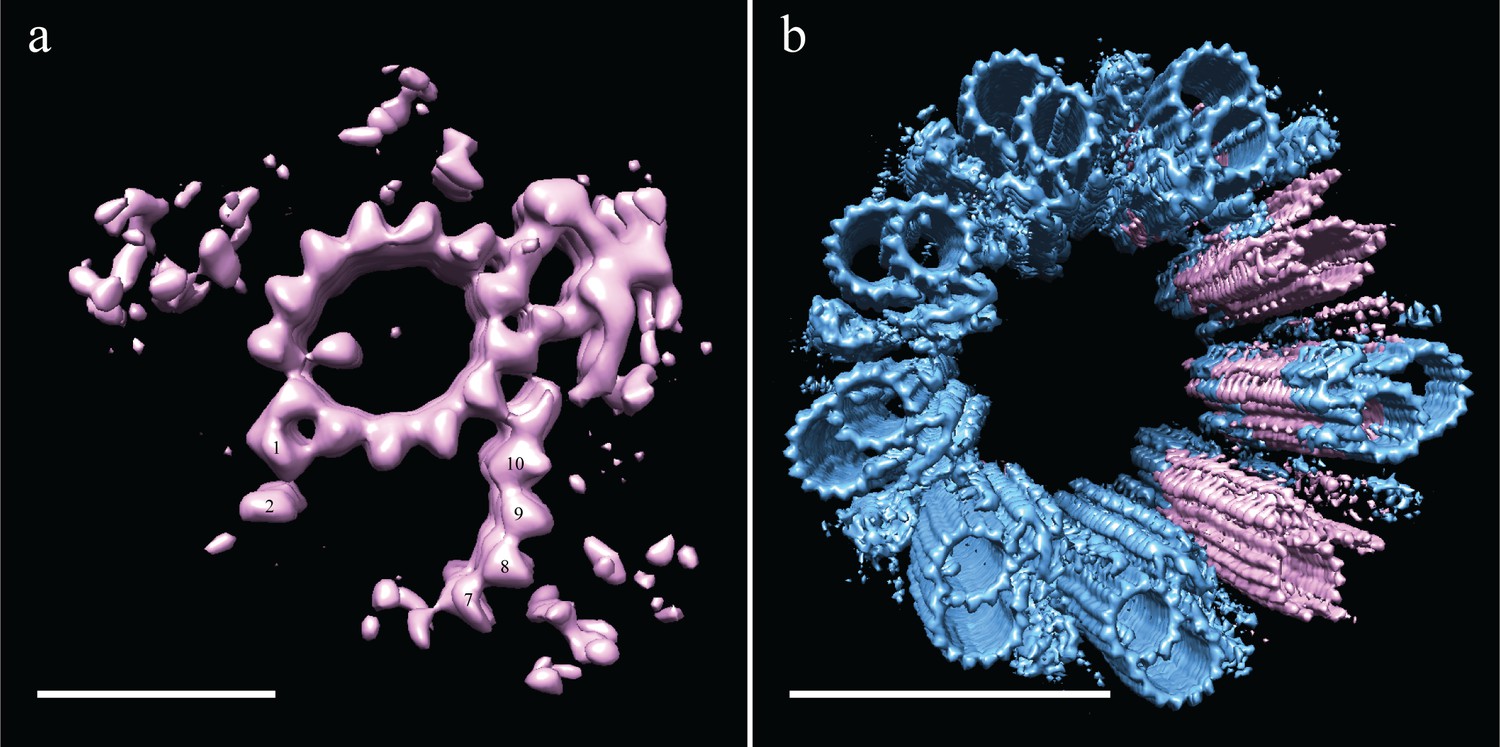
Figure 1 with 4 supplements

Electron cryo-tomography of mammalian centrioles.
(a) Chinese hamster ovary (CHO) centrioles were imaged using electron cryo-tomography. The mother centriole [M] was decorated with peri-centriolar material along its entire length, while the daughter centriole [D] appeared less well decorated, especially at the distal end. Proximal and distal ends of the centriole are denoted ‘p’ and ‘d’, respectively. (b) Sub-volume averaging of CHO centrioles generated a map with triplet microtubules, consisting of a complete 13-protofilament A-tubule, and 10-protofilament B- and C-tubules. Both parts of the A-C linker (green double arrowheads) that connects adjacent triplets were obvious in the map, as was the pinhead (gold arrow) attached to protofilament A03. Densities binding to the lumenal surface of the microtubules were seen binding protofilaments A09/A10, B01/B02, and C01/C02. (c) High contouring of the triplet map showed the core structures that were present in the majority of all sub volumes. The absence of the A-C linker and pinhead indicated that they were at less than 100% occupancy in the map. The asterisk (*) denotes the likely site of the microtubule seam between protofilaments A09 and A10. This gap between protofilaments A09 and A10 was straddled by an A-tubule MIP (blue double arrowhead), a MIP that was present at high occupancy in the map. Scale bars are 100 nm in (a), and 25 nm in (b) and (c).
Figure 1—figure supplement 1
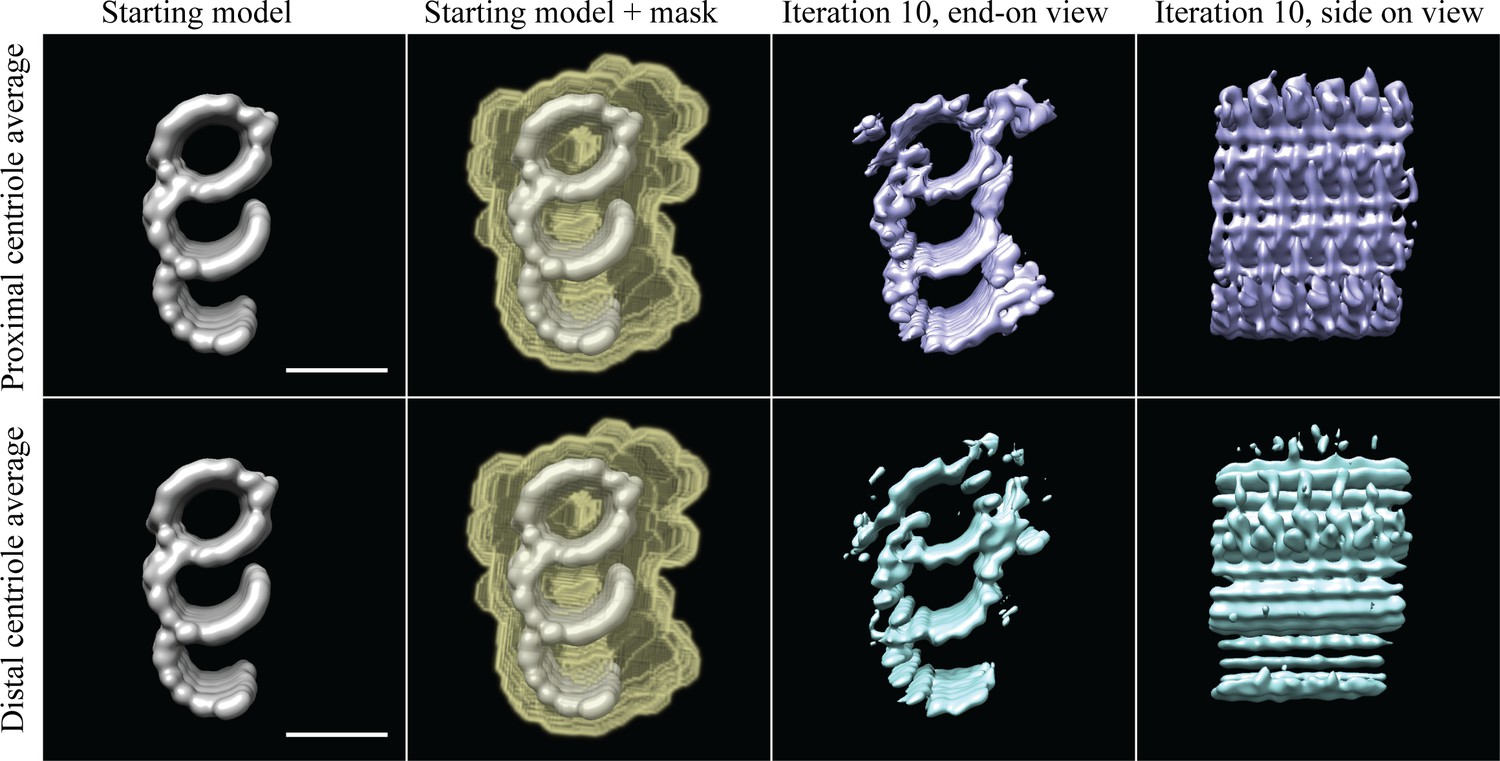
Checking for centriole periodicities.
Column 1 contains the filtered model to which the subvolumes were aligned, column 2 indicates how the data were masked, column 3 shows an end-on view after a coarse alignment, and column 4 shows a side-on view of the average in column 3. The top four panels are the proximal CHO centriole data, while the bottom four panels are the distal CHO centriole data. Using the filtered model, the proximal and distal subvolumes align independently to give averages where all the densities at this resolution are represented within a 24 nm segment of the TMT. Scale bar is 25 nm.
Figure 1—figure supplement 2
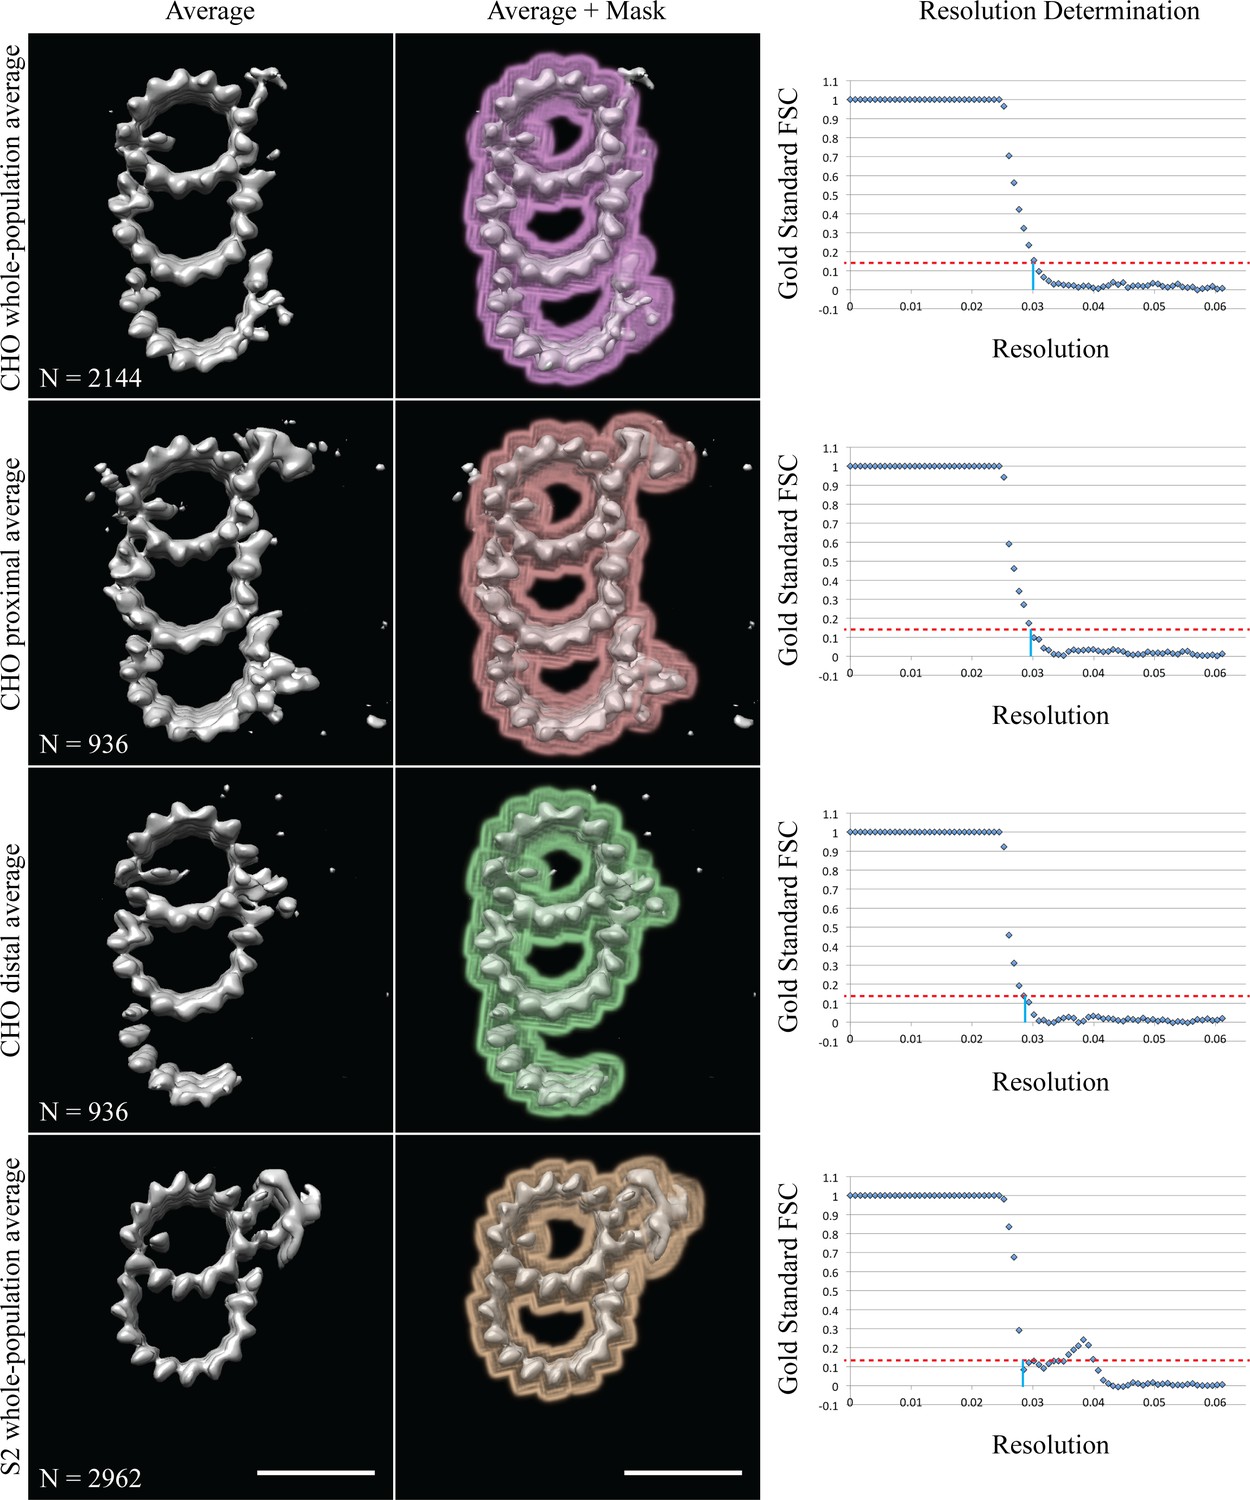
Gold standard FSC resolution determination.
Column 1 contains the average maps, column 2 how the data were masked, and column 3 shows the gold standard FSC plots. The 0.14 cutoff is indicated by the dashed-red line, the intercept with the X-axis is marked by a solid-blue line. Each row is labeled on the left. The inset shows the number of subvolumes contributing to each average. Scale bars are 25 nm.
Figure 1—figure supplement 3
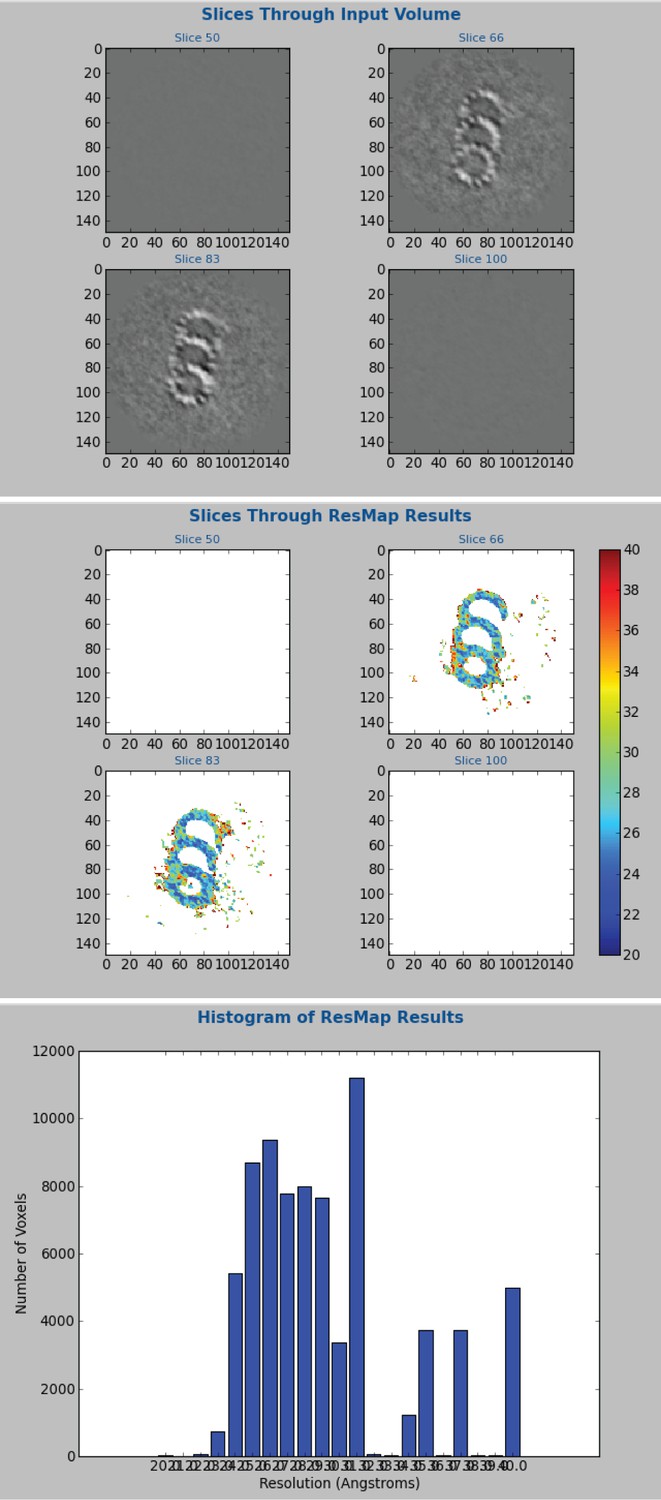
ResMap calculation of resolution for the whole-population CHO average.
The CHO, whole-population average was generated using Relion. These data were broken into two independent groups for the gold-standard FSC in Figure 1—figure supplement 2. At the last iteration, two unfiltered and unmasked maps were generated. These unmasked and unfiltered maps were subsequently used for the ResMap resolution calculation. A difference map was generated from the two maps, instead of a soft mask. Searching between 2 and 4 nm with a 0.1 nm step, the mean resolution was 2.9 nm, but much of the triplet was at 2.4–2.8 nm.
Figure 1—figure supplement 4
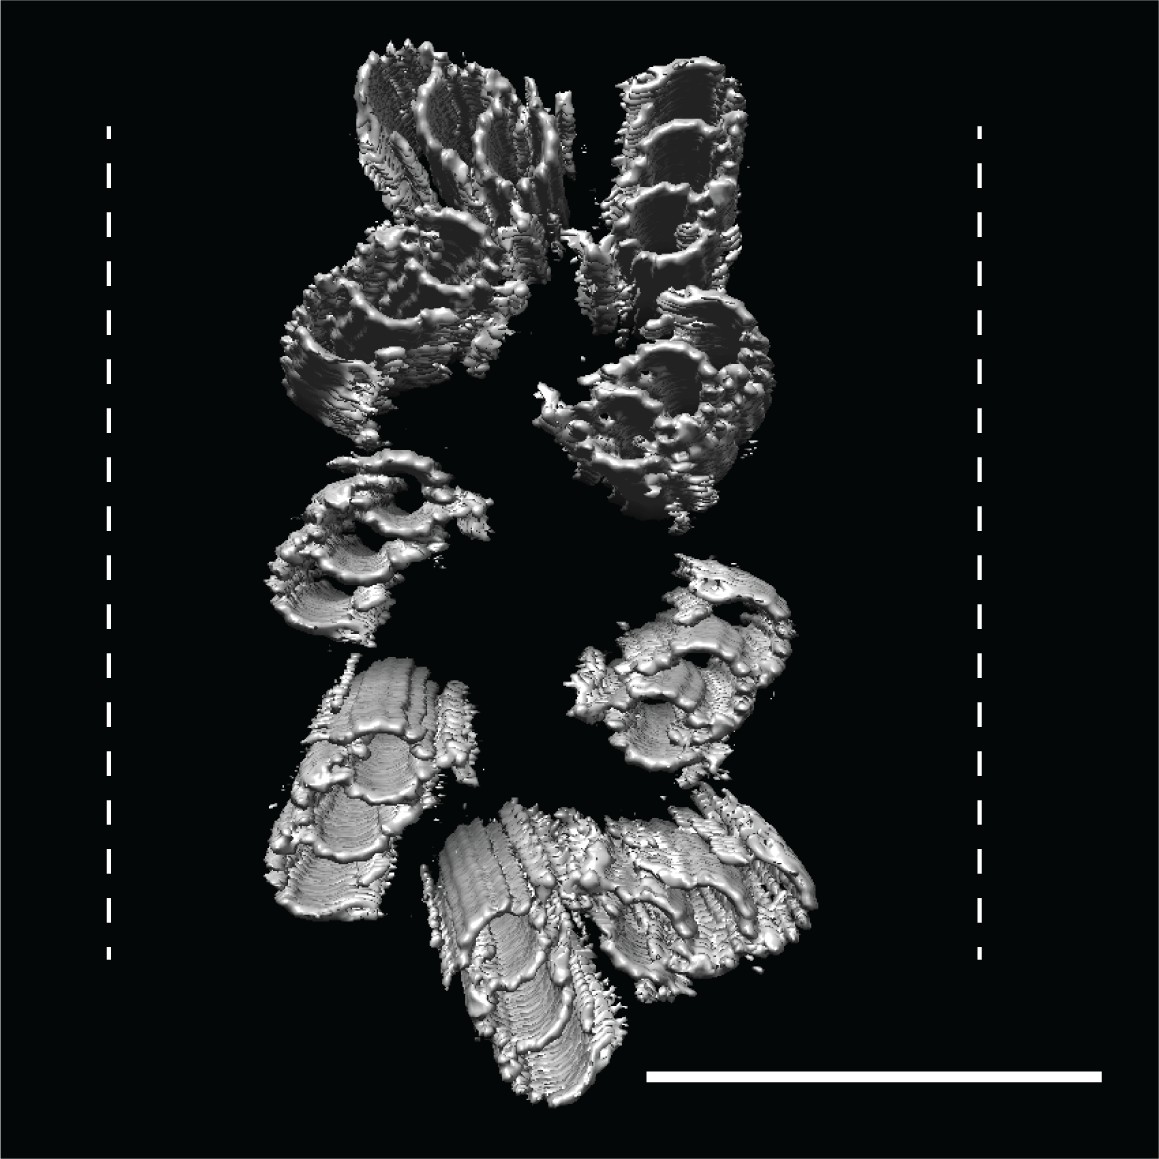
CHO centrioles were flattened within the ice sheet.
A refit of the triplet average back into the raw data showed that all CHO centrioles that we imaged showed flattening orthogonal to the proximal-distal axis, with some centrioles resembling two parallel arrays of triplet microtubules. These refits suggested that while the A-C linkers are strong enough to hold the nine triplets together as a unit, they are also quite flexible. Dashed lines indicate ice-sheet thickness, typically 300 nm. Scale bar is 150 nm.
Figure 2 with 2 supplements
The microtubule triplet undergoes significant changes along its proximal-distal axis.
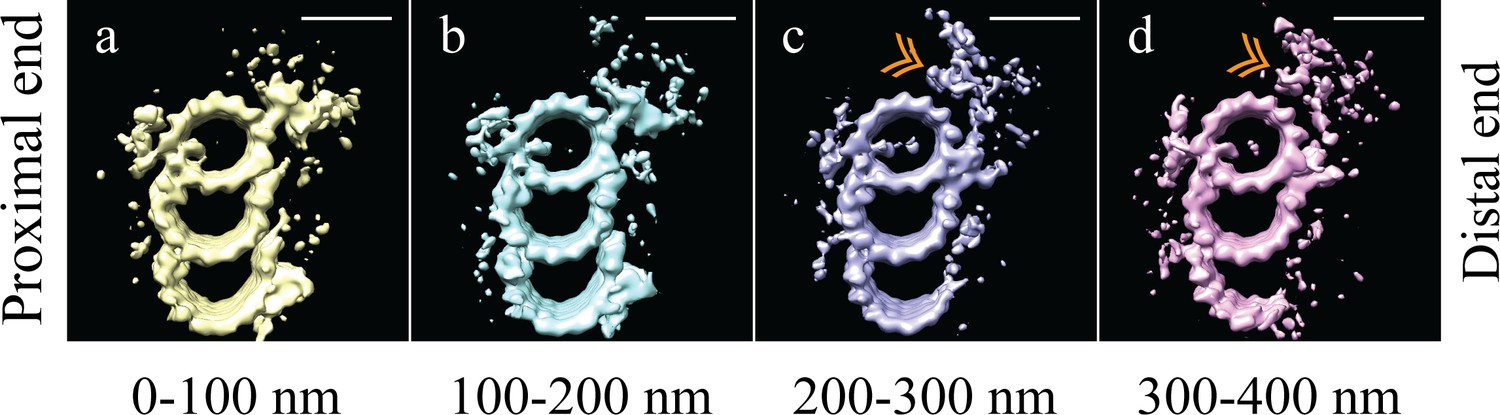
The microtubule triplet sub volumes were grouped based on position along the proximal-distal axis of the centriole, and then averaged together to generate maps that represented 100 nm blocks of the centriole. (a) and (b) There were no major structural differences between the first two groups (0–100 nm and 100–200 nm); complete triplet microtubules were bound by an A-C linker and the pinhead. (c) In the third group (200–300 nm) the A-C linker, part of the C-tubule and the pinhead were no longer obvious in the map, but a new density (gold double arrowhead) occupied the space previously occupied by the pinhead. (d) In the distal centriole (300–400 nm) a partial, though less complete C-tubule persisted as did the novel density (gold double arrowhead). Scale bars are 25 nm.
Figure 2—figure supplement 1
Unbiased classification of the subvolume population suggested centriole domains.
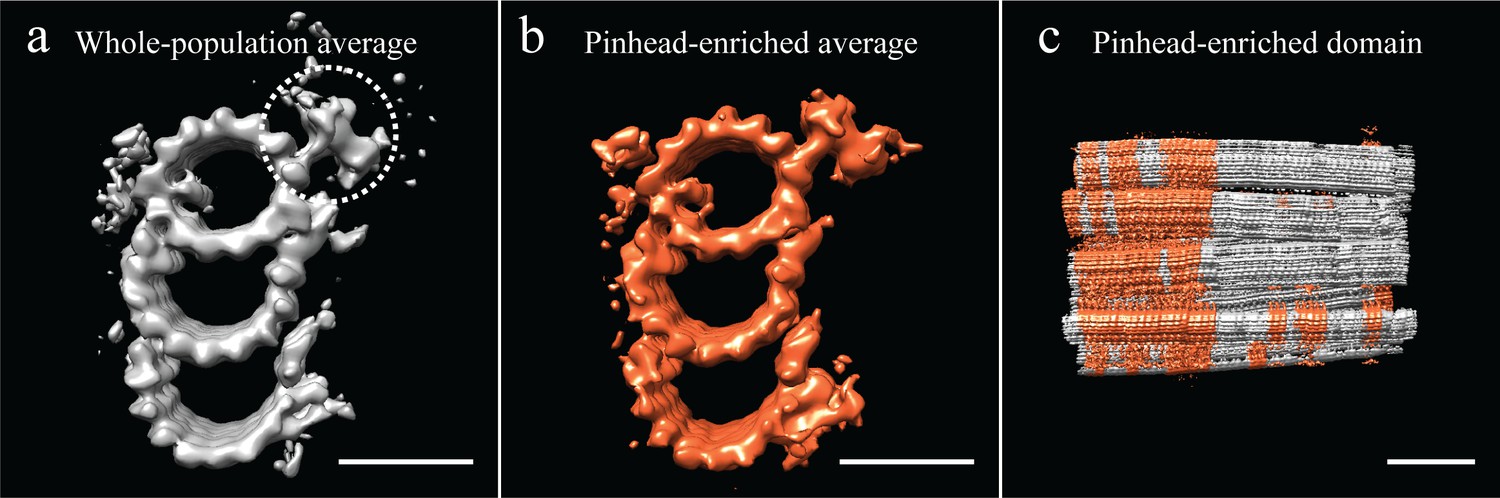
(a) Our analysis of the CHO average suggested that several features, including the pinhead, were at less than 100% occupancy in the average. All subvolumes contributing to the whole-population average were classified based on the presence or absence of the pinhead, using a mask specific to the pinhead (dashed circle). (b) This classification yielded several classes, but the most populous class yielded an average that was enriched for pinhead-containing subvolumes. (c) A representative centriole refit showed that pinhead-containing subvolumes clustered together, suggesting that the centriole had distinct domains along its proximal-distal axis. Scale bar is 25 nm in (a) and (b), and 100 nm in (c).
Figure 2—figure supplement 2
Fine-grain averages along the entire length of the CHO centriole.
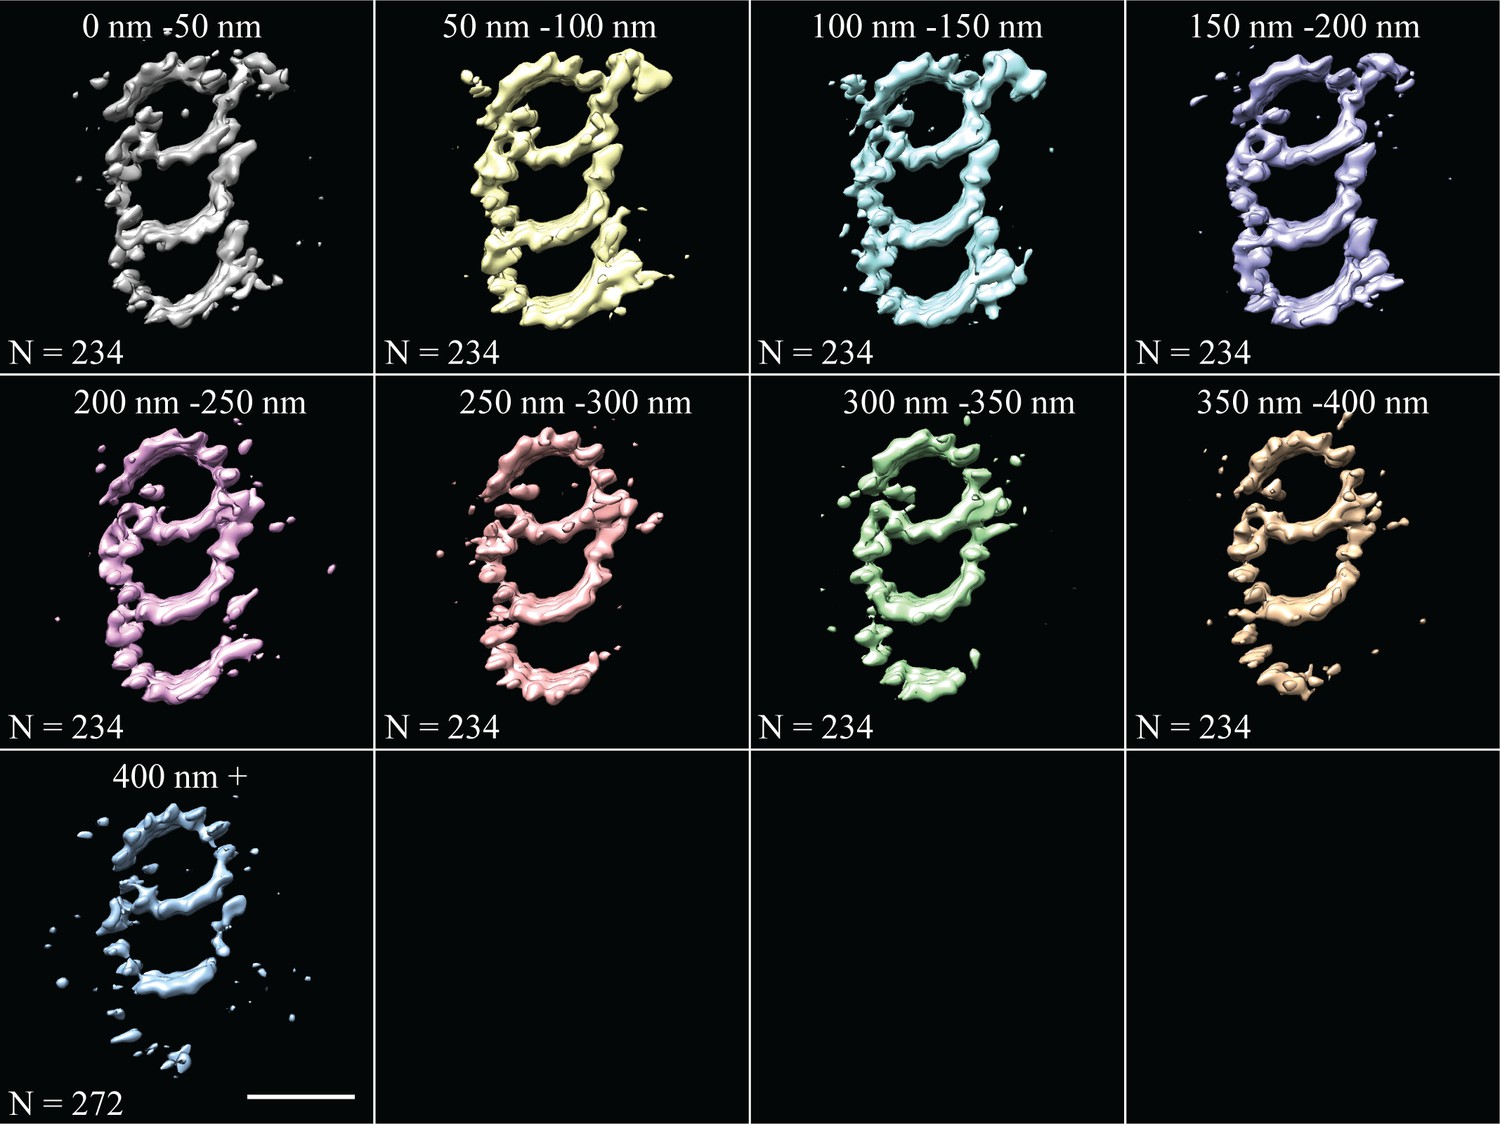
Subvolumes were averaged in 50 nm bins along the length from 0 to 400 nm. Any additional subvolumes from centrioles that were longer than 400 nm in length were grouped together in one class, and represent the distal-most part of the CHO centriole. Scale bar is 25 nm.
Figure 3
The proximal and distal centriole show several major structural differences.
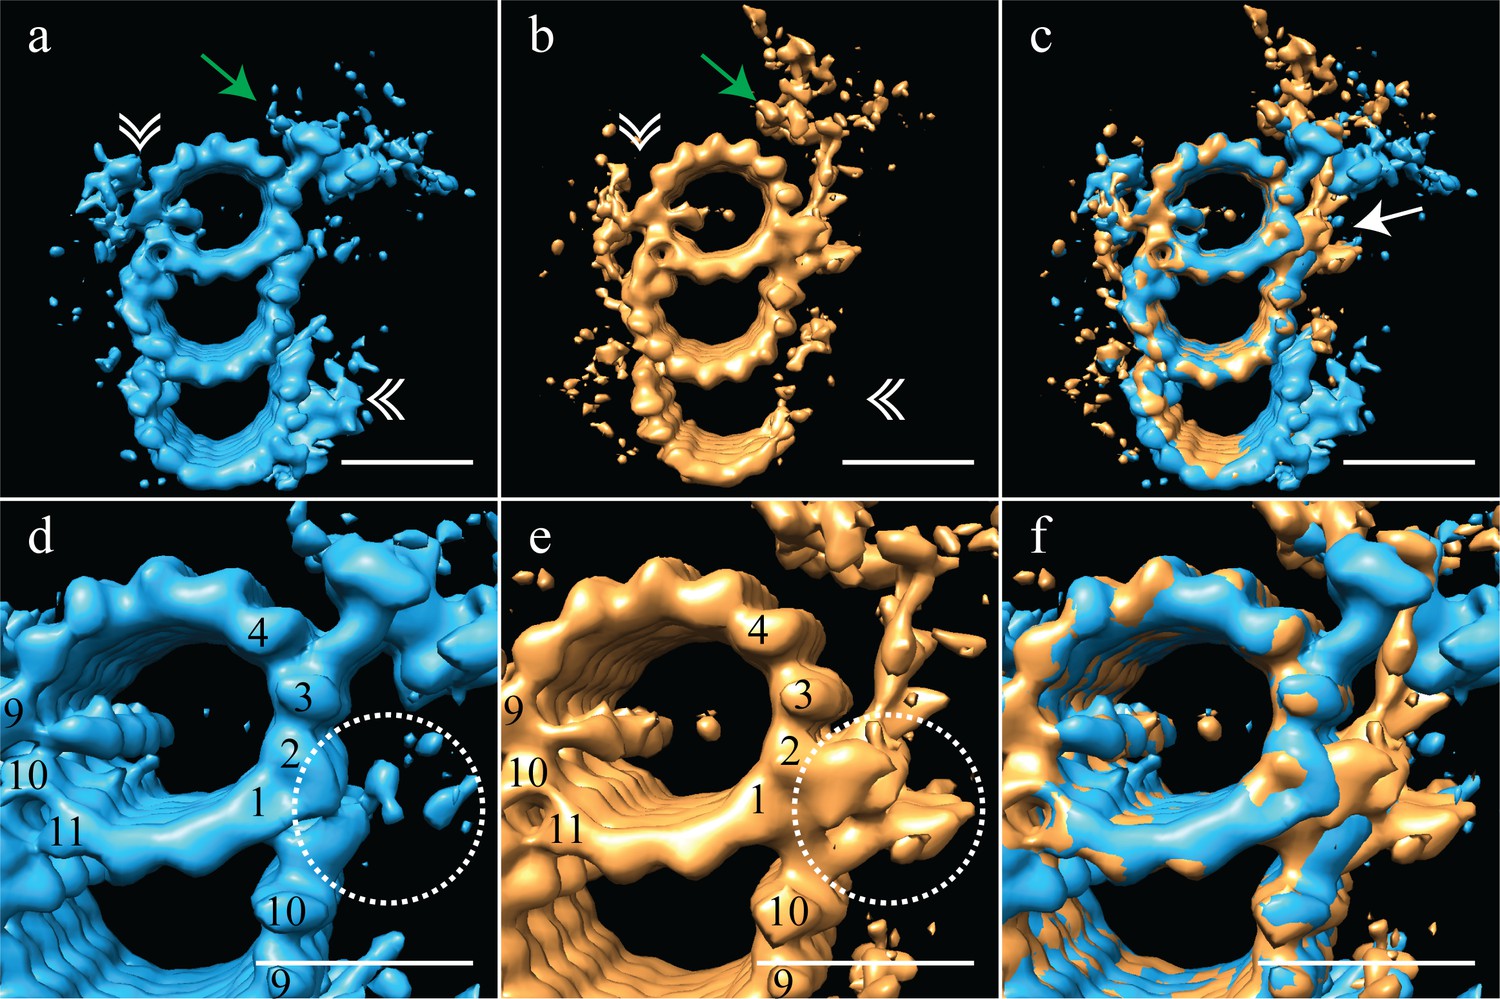
(a) The proximal centriole was characterized by complete triplet microtubules that showed strong density for both parts of the A-C linker (white double arrowheads) and the pinhead (green arrow). (b) In contrast, the distal centriole lacked the A-C linker (white double arrowheads) and instead of a pinhead, the distal map had a density (green arrow) that extended out from the A-tubule. (c) A merge of the distal and proximal maps highlighted the differences between them, with differences at the inner AB-junction (white arrow) being the most obvious. (d) A zoomed in view of the A-tubule in the proximal centriole showed two MIPs, one straddling protofilaments A09 and A10, the other binding to A11. Note that the inner AB-junction is compact (dashed white circle). (e) A zoomed in view of the A-tubule in the distal centriole also showed a MIP straddling protofilaments A09-A10, but the proximal centriole lacked the A11-bound MIP. Here the inner AB-junction was more elaborate and formed the platform from which densities extended (dashed white circle). (f) A merged view of both A-tubules allows the differences at the inner AB-junction to be fully appreciated. Scale bars are 25 nm.
Figure 4
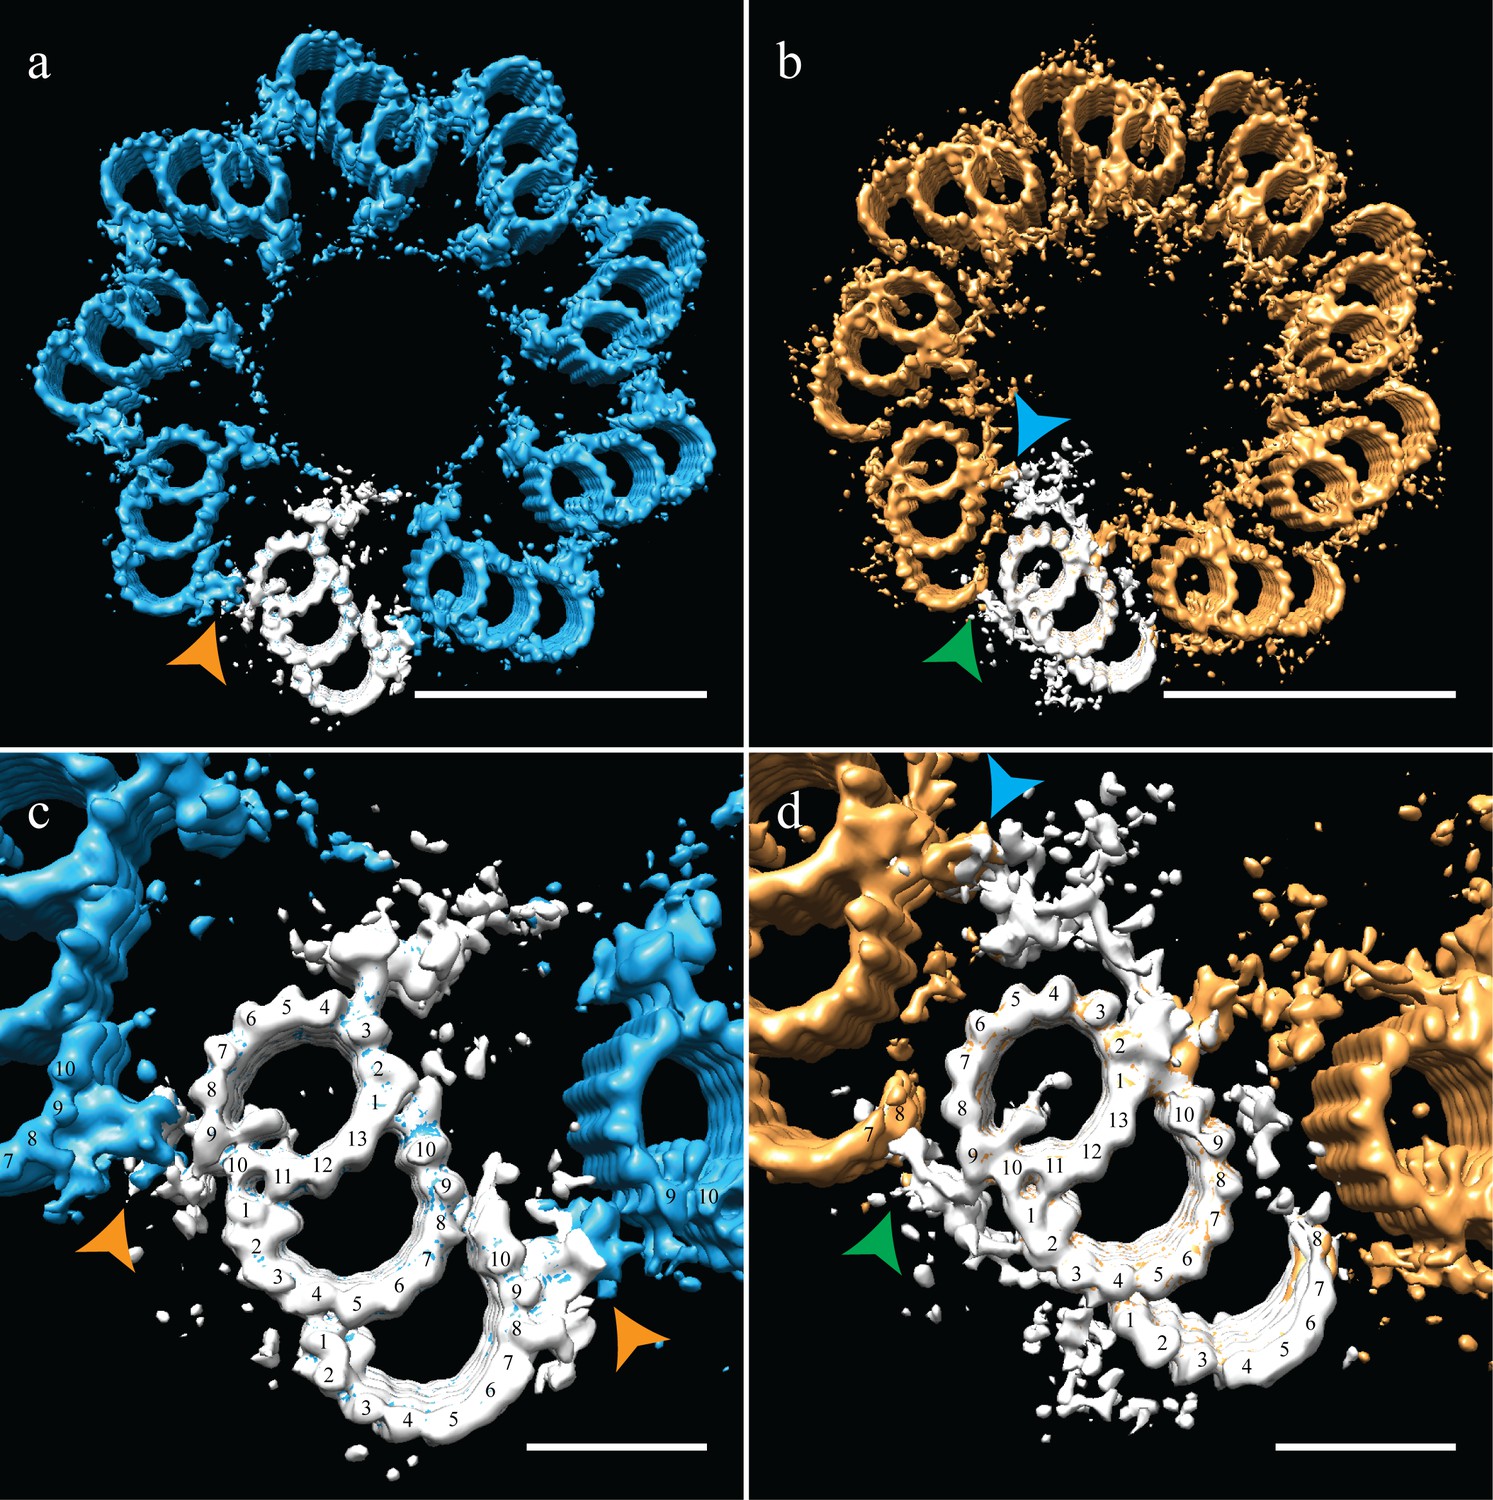
Correcting the symmetry revealed novel connections in the distal centriole.
Using the symmetry from published studies on mammalian centrioles, the symmetry for the proximal and distal centriole was determined and used to correct for the ice-sheet induced flattening. (a and c) This gave a proximal-centriole geometry where the A-C linkers (orange arrowheads) of adjacent triplet microtubules fit together and recapitulated the geometry as previously published. (b and d) Using the published distal-centriole, geometry showed that adjacent microtubules are connected in two ways, a linker that connected adjacent inner AB-junctions (blue arrowhead), and arm-like densities that connected protofilaments A09 and the persistent C-tubule of the adjacent triplet (green arrowhead). Scale bar is 100 nm in (a) and (b) and 25 nm in (c) and (d).
Figure 5
Electron cryo-tomography of Drosophila melanogaster S2 cells.
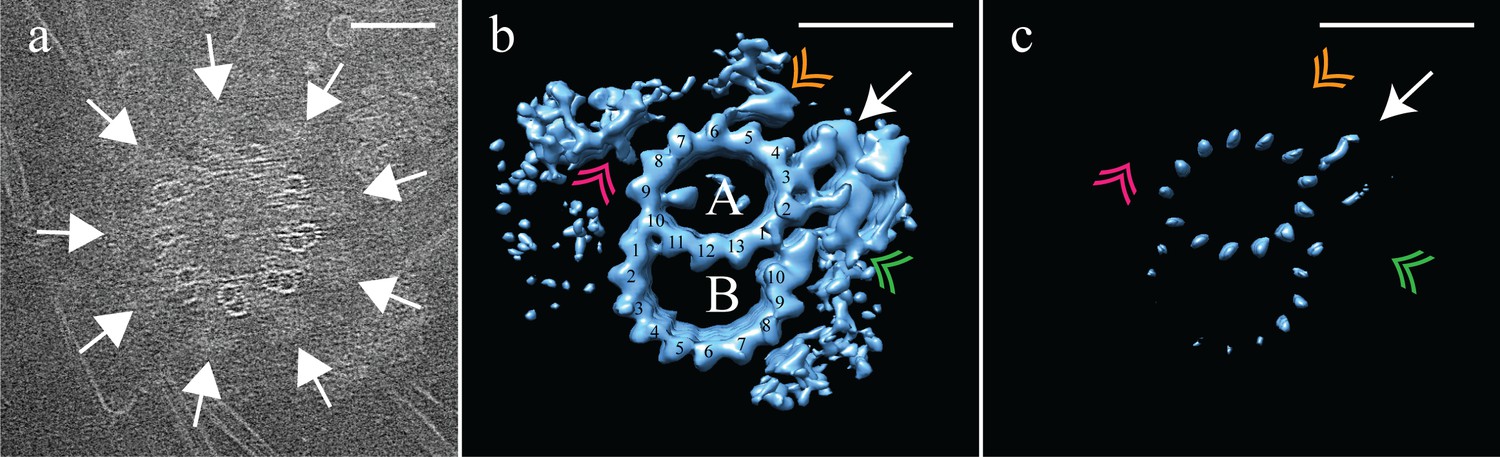
(a) CryoET showed that fly centrioles were almost exclusively found as single centrioles, and composed of a mixture of singlet and doublet microtubules, symmetrically arranged around a central hub. Amorphous brush-like structures (white arrows) emanated from between adjacent microtubules, possibly representing core PCM. (b) Sub-volume averaging of centriole microtubules generated a microtubule doublet map, with a 13 protofilament A-tubule and a 10 protofilament B-tubule. The pinhead (white arrow) extended from protofilament A03, but was more elaborate than the CHO pinhead, making additional contacts with protofilament A02, and the inner AB-junction (green double arrowhead). The map also showed a novel hinge-shaped density (gold double arrowhead) of unknown function bound to protofilament A06, and a repetitive wishbone-shaped structure (pink double arrowhead) also of unknown function that made weak connections to the A-tubule. (c) Changing the contour level of the map in (b), showed that the A-tubule, the pinhead and a partial B-tubule constituted the core structure, with all other structural elements at less than 100% occupancy. Scale bars are 100 nm in (a), and 25 nm in (b) and (c).
Figure 6 with 1 supplement
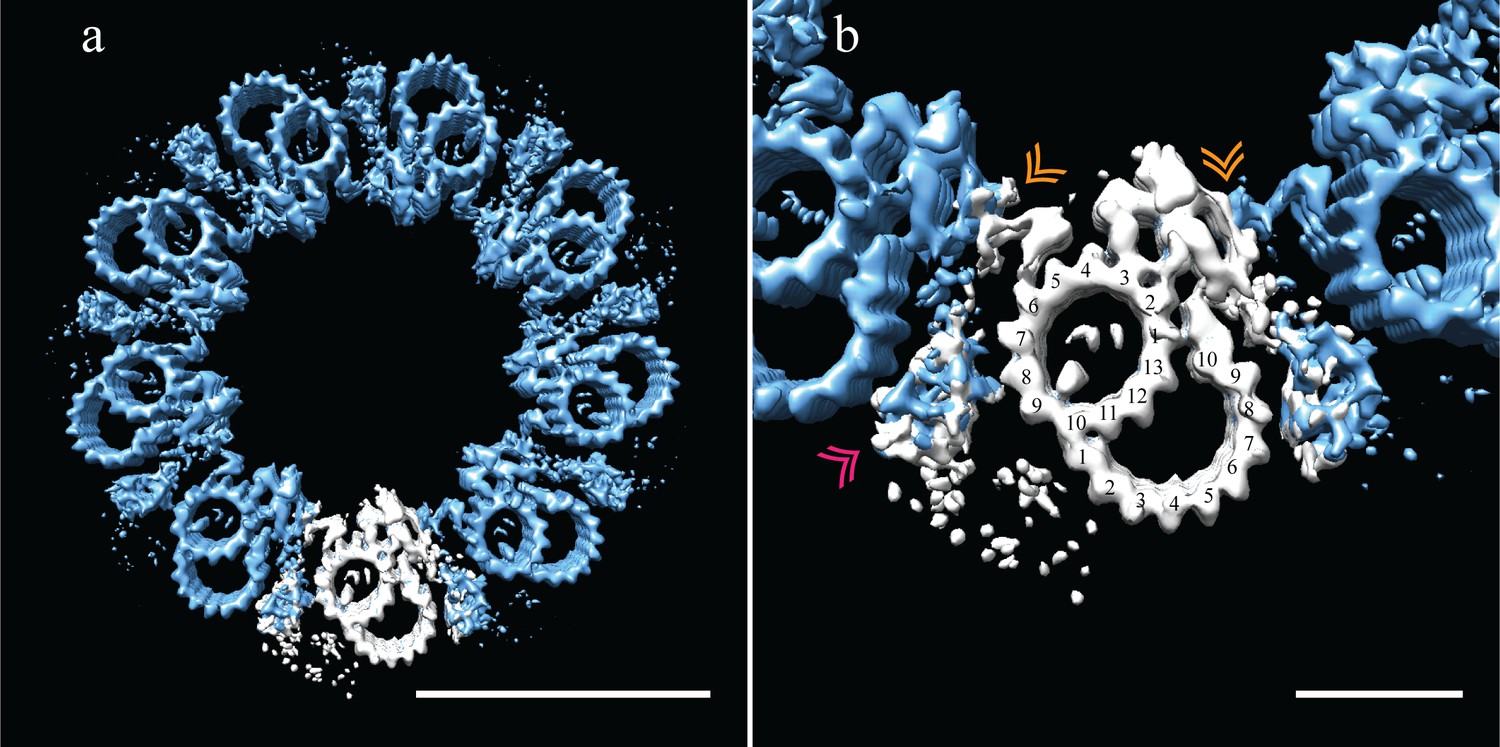
Adjacent Drosophila melanogaster S2 doublets are connected via a novel A-A linker.
(a) The doublet average was fit back into a centriole, which showed no signs of ice-induced flattening, allowing the exact geometry of the S2 centriole to be determined. From this refit it was clear that connections between adjacent doublets were through A-tubule to A-tubule links, hereafter referred to as the A-A linker. (b) A zoomed in view of one doublet in context, showed that the hinge-like structure from one doublet extended and attached to the elaborated pinhead of the adjacent doublet (orange double arrowheads). The second density between adjacent doublets (pink double arrowheads) makes weak connections to both the A-A linker and the A-tubule, and likely represents the brush-like structures that were observed emanating from between doublets in the tomograms. Scale bars are 100 nm in (a), and 25 nm in (b).
Figure 6—figure supplement 1
The proximal CHO and Drosophila centrioles have the same geometry, but different linkages.
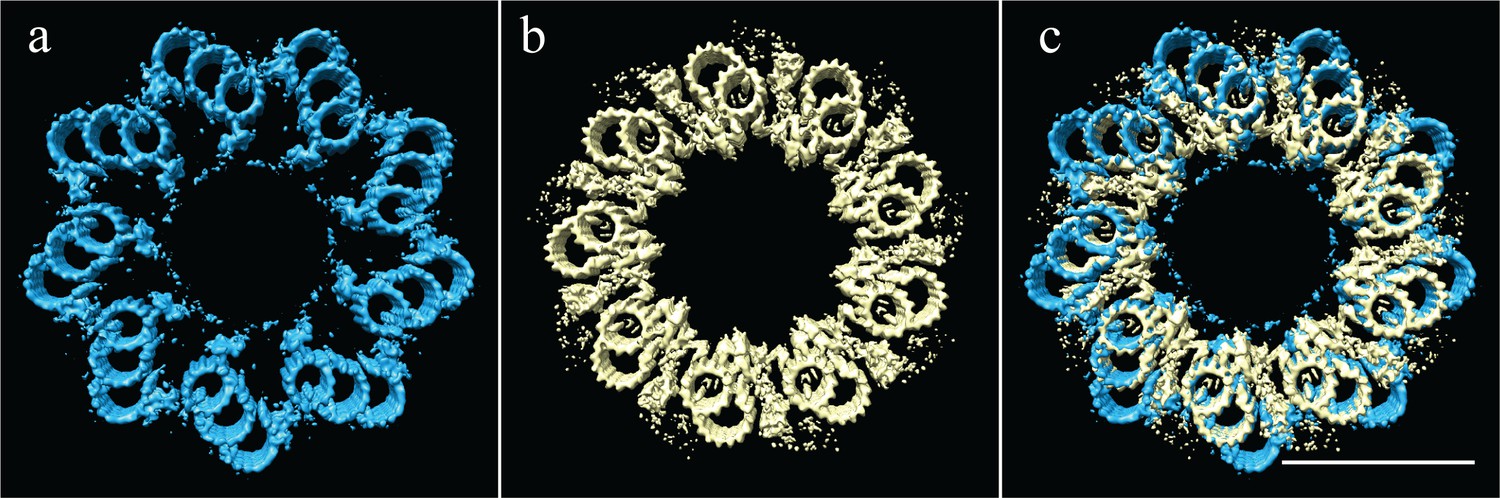
(a) The symmetry of the proximal CHO centriole (Paintrand et al., 1992), as shown in Figure 5a. (b) The experimentally determined symmetry of the Drosophila centriole, as shown in Figure 7a. (c) An overlay of the two symmetries shows that while the geometry is identical, the positions and structures of the microtubules linkages are completely different. Scale bar is 100 nm.
Figure 7
Incomplete B-tubules shed light on how B-tubules are constructed in Drosophila S2 cells.
(a) Starting with the entire dataset (N = 2962), subvolumes with incomplete B-tubules were segregated into one class using classification (see materials and methods) and an average was generated from this subset (N = 226). This average showed strong density for the A-tubule, the pinhead, and parts of the B-tubule. The lack of protofilaments B03-B06 suggested that the B-tubule grows from both sides which then meet to complete B-tubule construction. (b) A centriole was refit to show the positions of the complete and incomplete doublets within the context of the whole centriole, and this suggested that incomplete doublets tend to cluster, both along the proximal-distal axis and around the radial axis of the centriole. Scale bars are 25 nm in (a), and 100 nm in (b).
Tables
Key resources table
| Reagent type | Designation | Source/Reference | Identifiers |
|---|---|---|---|
| Cell Line (Cricetulus griseus) | Chinese Hamster Ovary/CHO | UCSF Cell Culture Facility | RRID:CVCL_0214 |
| Cell line (Drosophila melanogaster) | Drosophila S2U/S2 | Vale laboratory | Flybase ID: FBtc9000006 |
| Chemical compound/drug | Demecolcine | Sigma Aldrich | SKU: D7385 |
| Chemical compound/drug | Nocodazole | Sigma Aldrich | SKU: M1404 |
| Software | Relion | Bharat and Scheres, 2016 | PMC5215819 |
| Commercial assay or kit | Mycoplasma testing kit | Lonza | LT07-318 |
Additional files
-
Transparent reporting form
- https://doi.org/10.7554/eLife.36851.016
Download links
A two-part list of links to download the article, or parts of the article, in various formats.
Downloads (link to download the article as PDF)
Open citations (links to open the citations from this article in various online reference manager services)
Cite this article (links to download the citations from this article in formats compatible with various reference manager tools)
Insights into centriole geometry revealed by cryotomography of doublet and triplet centrioles
eLife 7:e36851.
https://doi.org/10.7554/eLife.36851


