Pdgfra marks a cellular lineage with distinct contributions to myofibroblasts in lung maturation and injury response
- University of California, San Diego, United States
- University of Wisconsin-Madison, United States
Figures
Figure 1 with 1 supplement
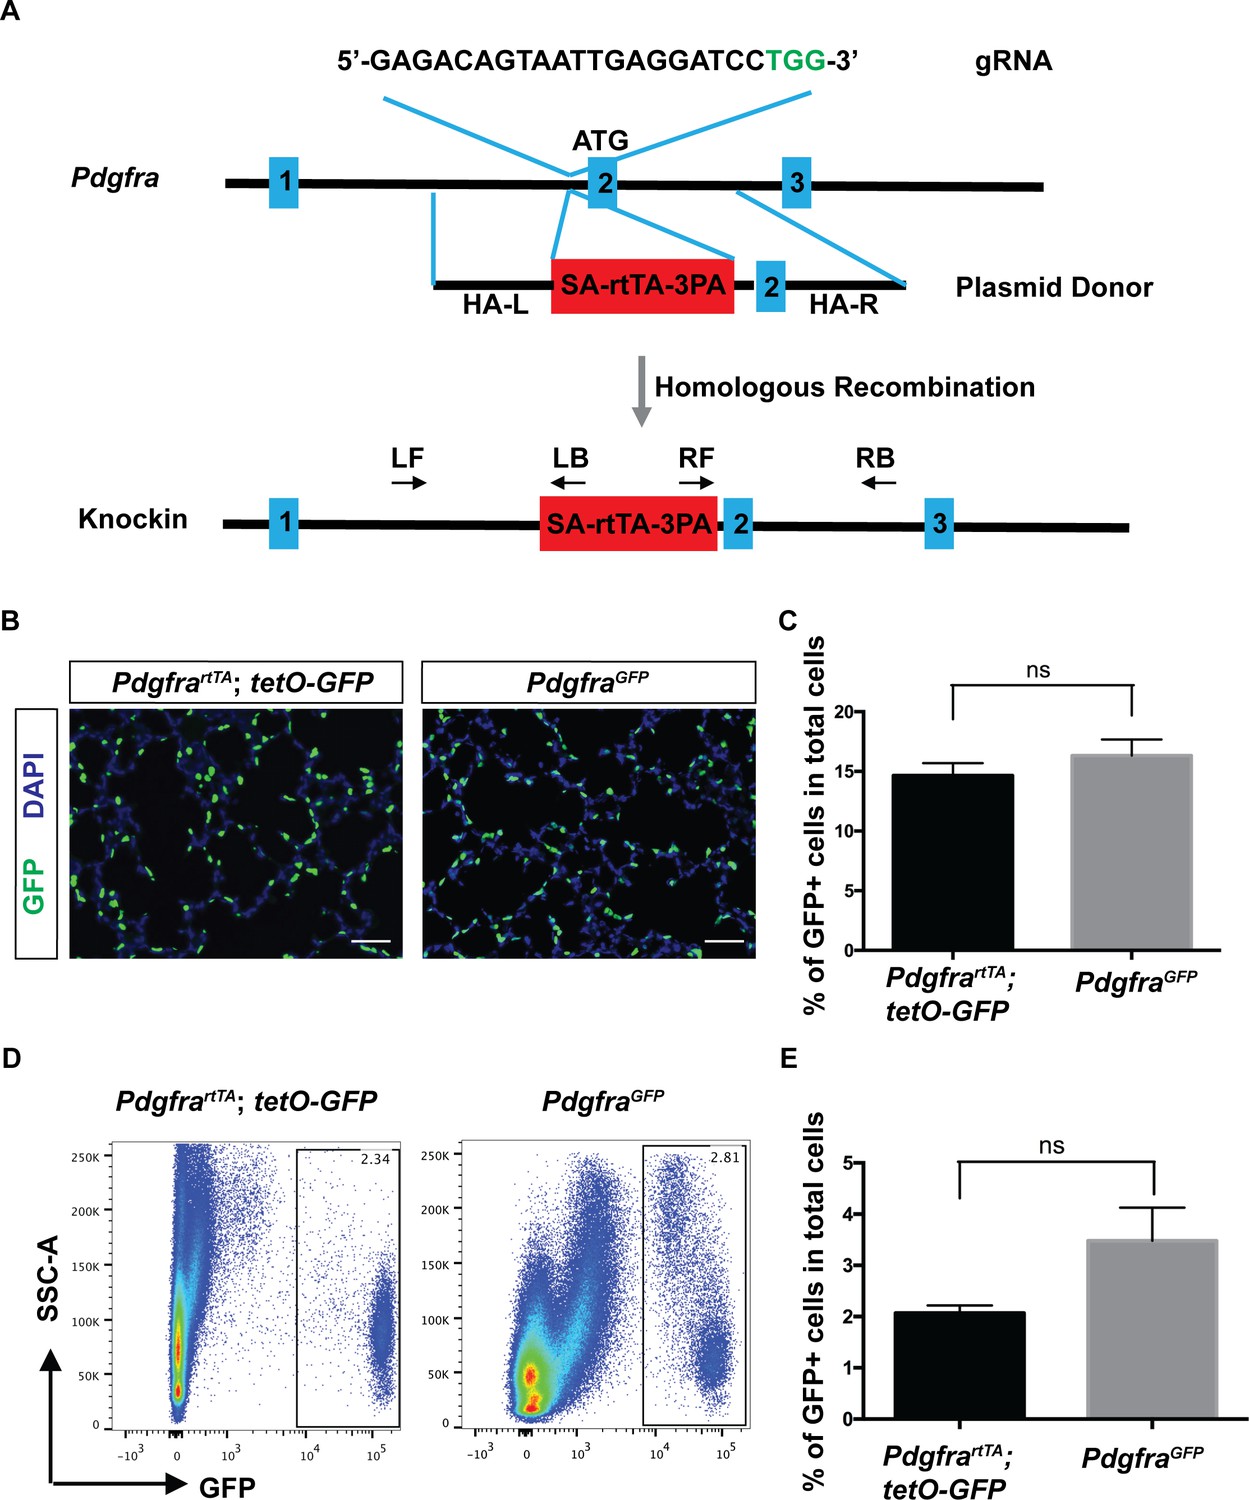
Generation and characterization of PdgfrartTA knock-in mouse line using CRISPR/Cas9.
(A) A schematic overview of the strategy for generating the PdgfrartTA knock-in allele. The gRNA coding sequence is as shown, and the protospacer-adjacent motif (PAM) sequence is indicated in green. The first three of Pdgfra exons are diagramed in blue. The SA-rtTA-3PA fragment is diagramed in red. The homologous arms of the donor vector are indicated as HA-L (~1.5 kb) and HA-R (~1.5 kb). The approximate positions of primers used for PCR analysis are shown (LF-left forward, LB-left back, RF-right forward, RB-right back). (B) Representative immunofluorescent staining showing GFP+ cells in PdgfrartTA;tetO-GFP mice and PdgfraGFP mice at P7, scale bars: 50 µm. (C) Quantification of the percentage of GFP+ cells as compared to total cell number in the lungs of the two different strains as shown in B (14.66 ± 1.04 for PdgfrartTA;tetO-GFP mice and 16.33 ± 1.34 for PdgfraGFP mice, ns for not significant, p=0.379, n = 3 each). (D) FACS analysis of GFP+ cells in PdgfrartTA;tetO-GFP mice and PdgfraGFP mice as indicated at P7. (E) Quantification of the percentage of GFP+ cells as compared to total cell number in the lungs of the two different strains as shown in D (2.07 ± 0.15 for PdgfrartTA;tetO-GFP mice and 3.48 ± 0.64 for PdgfraGFP mice, ns for not significant, p=0.0759, n = 4 each).
-
Figure 1—source data 1
Raw data for Figure 1.
- https://doi.org/10.7554/eLife.36865.005
Figure 1—figure supplement 1
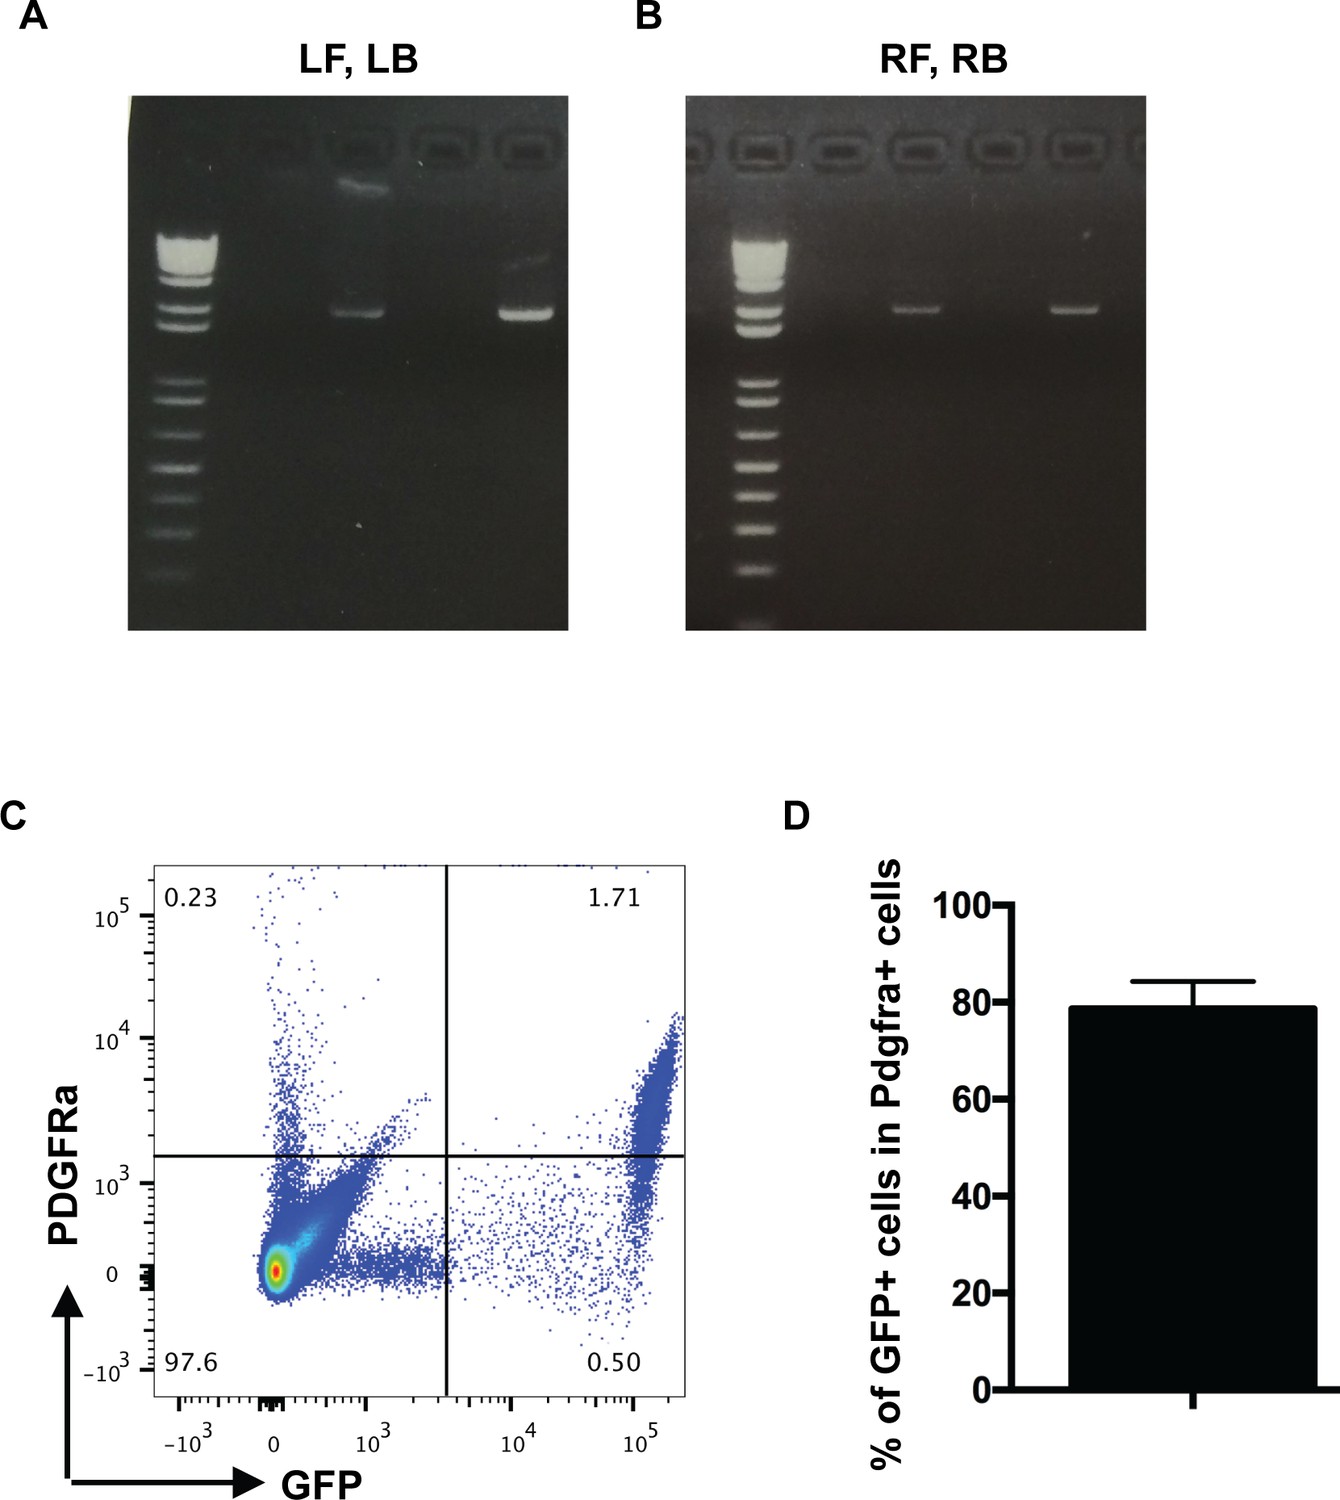
PCR confirmation of the correct homologous recombination following CRISPR/Cas9 injection and the labeling efficiency of PdgfrartTA mice.
(A–B) Primer sets LF, LB and RF, RB as indicated in Figure 1A were used in genomic PCR on tail DNA of CRISPR/Cas9 injected founder animals. Two samples showed positive homologous recombination-mediated insertion of rtTA cDNA. (C) Representative FACS plot showing GFP+ and PDGFRa+ cells as labeled by CD140a (PDGFRa)-PE antibody in PdgfrartTA;tetO-GFP mice at P7. (D) Quantification of the percentage of GFP+ cells as compared to total PDGFRa+ cells in the lungs as shown in C (78.62 ± 5.71, n = 4).
-
Figure 1—figure supplement 1—source data 1
Raw data for Figure 1—figure supplement 1.
- https://doi.org/10.7554/eLife.36865.004
Figure 2 with 3 supplements
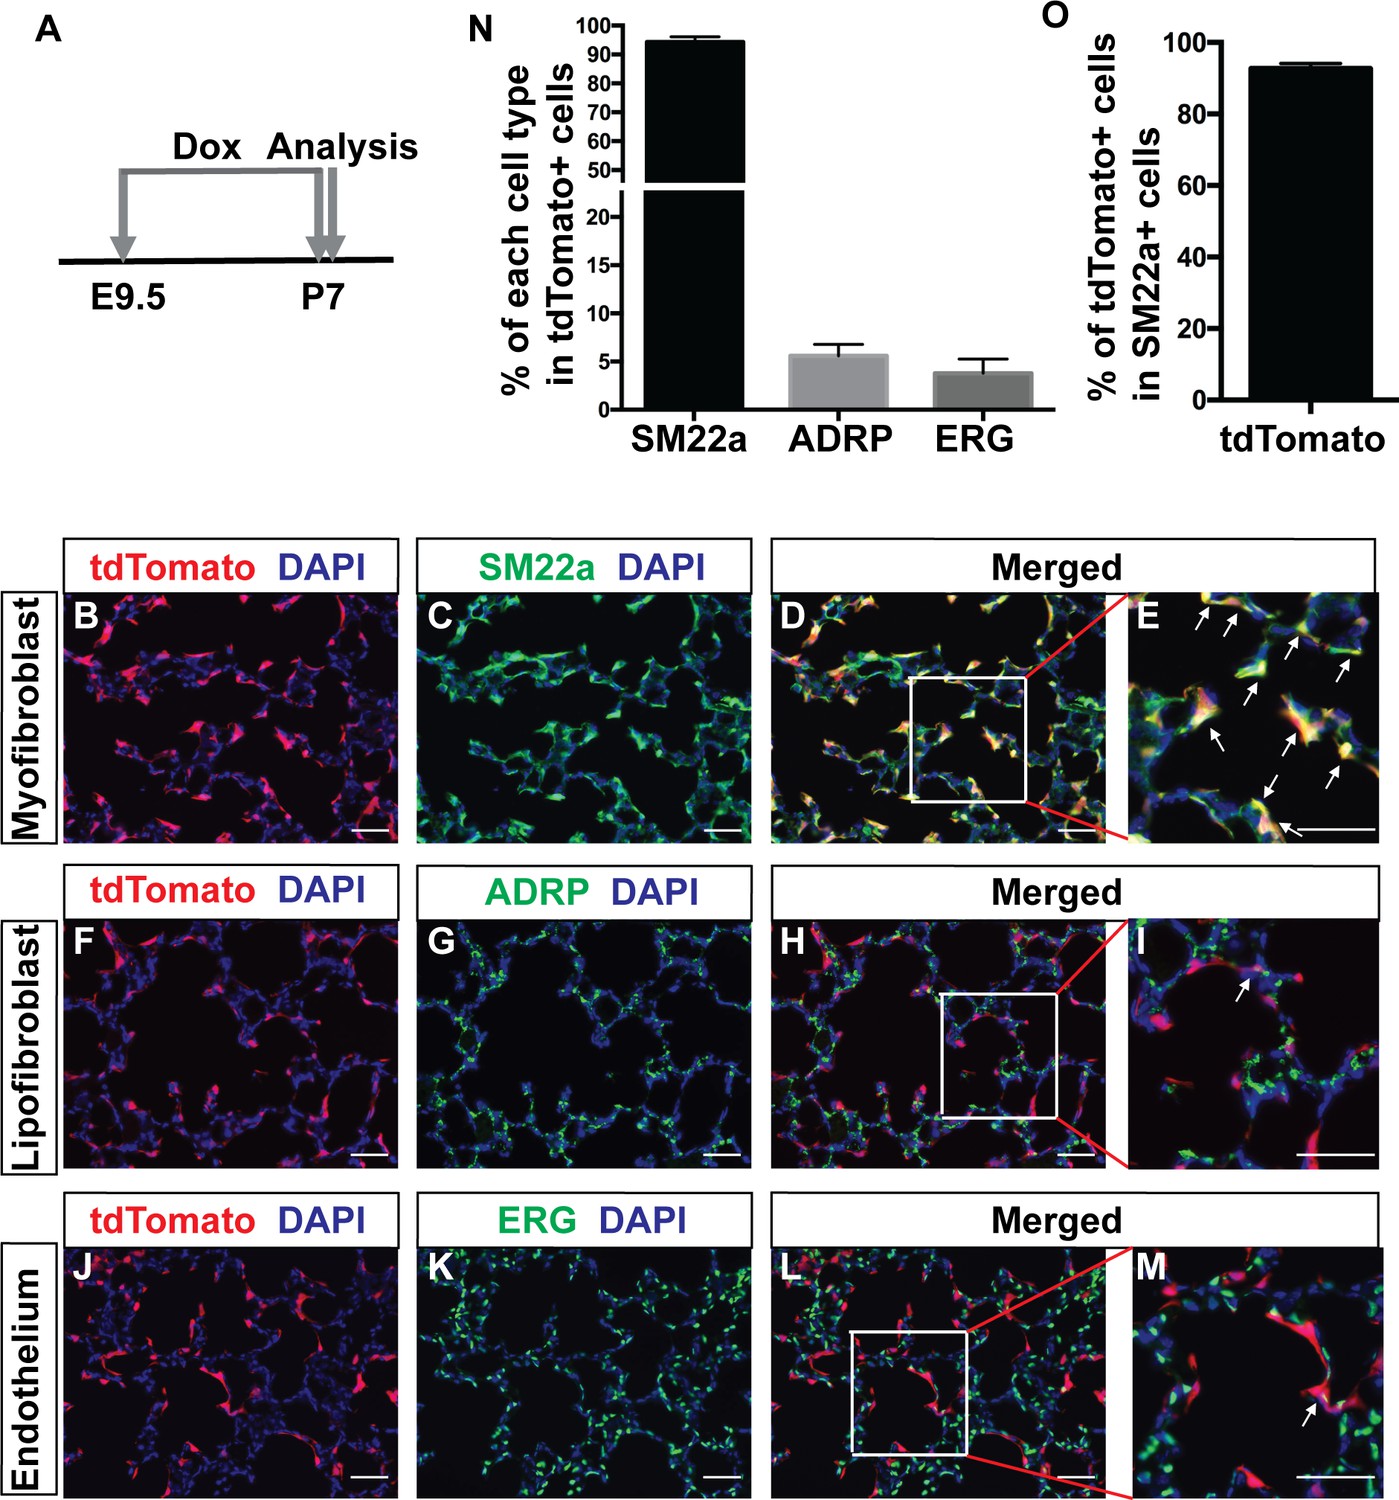
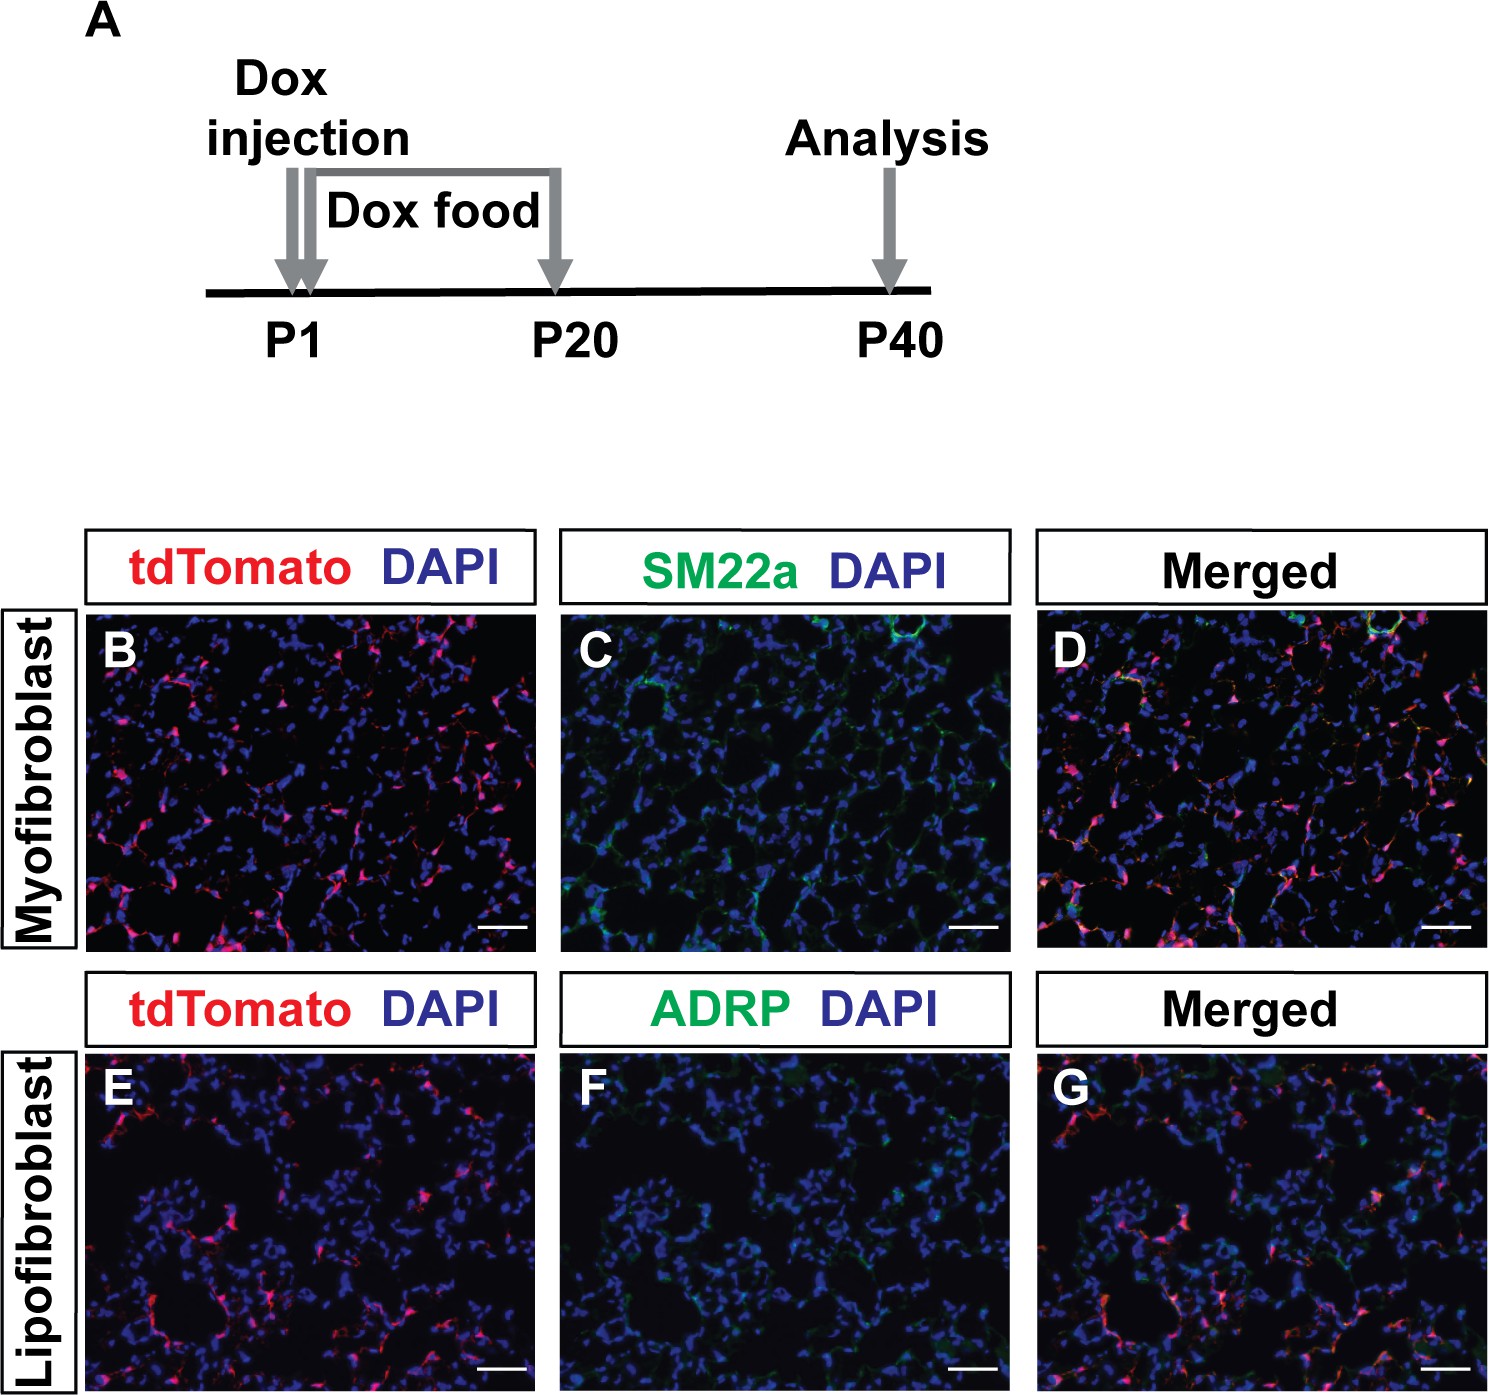
Lineage tracing of Pdgfra cells starting prenatally.
(A) Timeline of the start of dox treatment and analysis. (B–M) Representative immunofluorescent staining of P7 PdgfrartTA;tetO-cre;Rosa-tdTomato lungs. Markers are as indicated: tdTomato (red), the myofibroblast marker SM22a (green) and DAPI (blue) (B–E); the lipofibroblast marker ADRP (green) (F–I); the endothelium cells marker ERG (green) (J–M). Arrows in panels E, I and M indicate cells with co-localization of signals. Scale bars: 50 µm. (N) Quantification of the percentages within tdTomato+ cells that are also SM22a+ for myofibroblasts, ADRP+ for lipofibroblasts, and ERG+ for endothelial cells, respectively (94.3 ± 1.83 for SM22a, 5.6 ± 1.19 for ADRP and 3.78 ± 1.48 for ERG, n = 3 each). (O) Quantification of the percentage within SM22a+ cells that are also tdTomato+ for lineaged cells (92.71 ± 0.84, n = 3).
-
Figure 2—source data 1
Raw data for Figure 2.
- https://doi.org/10.7554/eLife.36865.011
Figure 2—figure supplement 1
Tracing of Pdgfra-lineaged cells in prenatal stage.
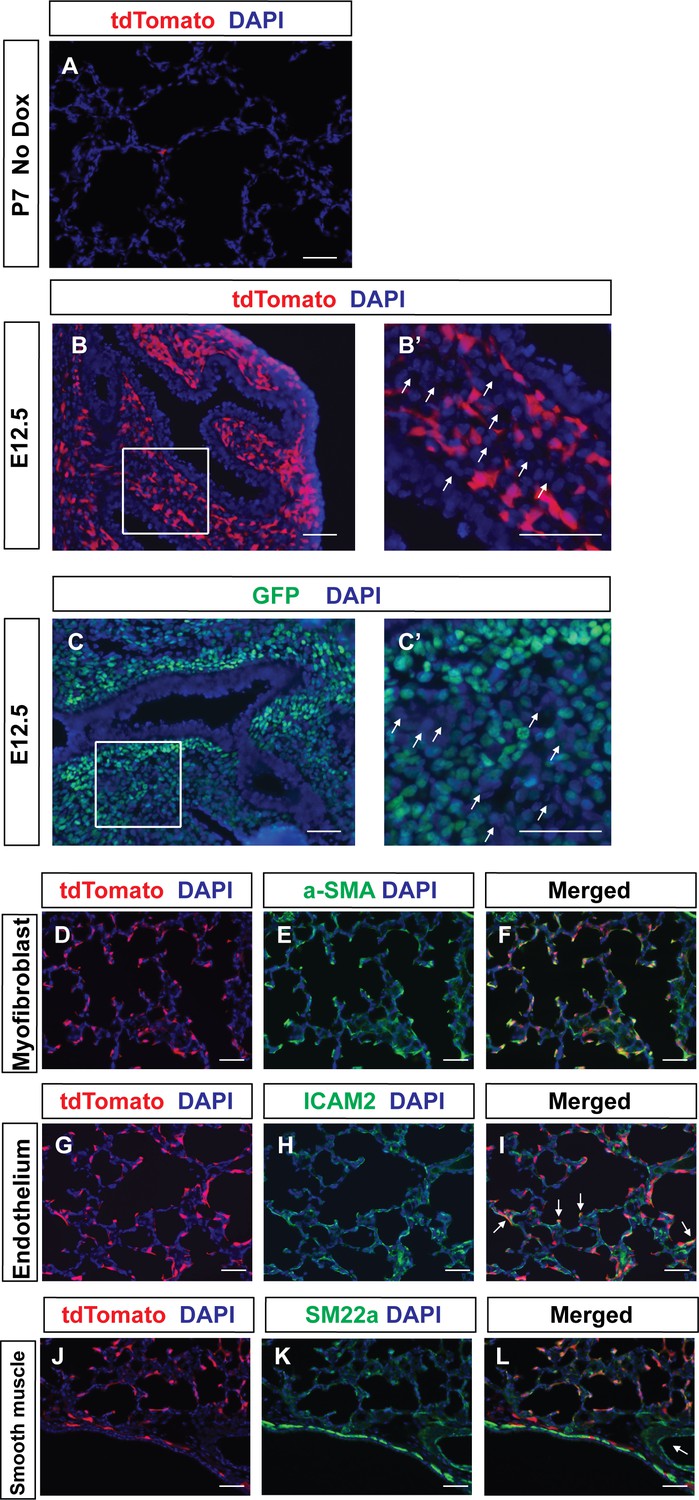
(A) Representative immunofluorescent staining for tdTomato (red) and DAPI (blue) in lungs of PDGFRartTA;tetO-cre;Rosa-tdTomato mice at P7 without dox feeding. (B,B’) Representative immunofluorescent staining for tdTomato (red) and DAPI (blue) in lungs of PDGFRartTA;tetO-cre;Rosa-tdTomato mice at E12.5. Boxed area in B is magnified in B’. Arrows in panel (B’) indicate unlabeled cells. (C–C’) Representative immunofluorescent staining for GFP (green) and DAPI (blue) in lungs of PdgfraGFP mice at E12.5. Boxed areas in C is magnified in C’. Arrows in panels (C’) indicate unlabeled cells. (D–F) Representative immunofluorescent staining for tdTomato (red), a-SMA (green) and DAPI (blue) in lungs of PDGFRartTA;tetO-cre;Rosa-tdTomato mice at P7. (G–I) Representative immunofluorescent staining for tdTomato (red), ICAM2 (green) and DAPI (blue) in lungs of PDGFRartTA;tetO-cre;Rosa-tdTomato mice at P7. Arrows in panels (I) indicate co-localization of tdTomato and ICAM2 (J–L) Representative immunofluorescent staining for tdTomato (red), SM22a (green) and DAPI (blue) in lungs of PDGFRartTA;tetO-cre;Rosa-tdTomato mice at P7. Arrow in panels (L) indicates vascular smooth muscle cells which are not lineage-labeled. Scale bars: 50 µm.
Figure 2—figure supplement 2

Tracing of Pdgfra-lineaged cells in the early postnatal stage.
(A) Timeline of dox treatment and analysis. PdgfrartTA;tetO-cre;Rosa-tdTomato mice were given one dose of dox injection at P0 followed by dox food until analysis at P7. (B–M): Representative immunofluorescent staining in P7 PdgfrartTA;tetO-cre;Rosa-tdTomato lungs. Markers are as indicated: tdTomato (red), the myofibroblast marker SM22a (green) and DAPI (blue) (B–E); the lipofibroblasts marker ADRP (green) (F–I); the endothelium cells marker ERG (green) (J–M). Arrows in panels E and I indicate co-localization. (N) Quantification of the percentages within tdTomato+ cells that are also SM22a+ for myofibroblasts, ADRP+ for lipofibroblasts, and ERG+ for endothelial cells, respectively (95.57 ± 1.65 for SM22a and 5.25 ± 0.75 for ADRP, n = 3 each). Scale bars: 50 µm.
-
Figure 2—figure supplement 2—source data 1
Raw data for Figure 2—figure supplement 2
- https://doi.org/10.7554/eLife.36865.009
Figure 2—figure supplement 3
Lineage tracing of PDGFRa cells to adult.
(A) Timeline of dox treatments and analysis. (B–G) Representative immunofluorescent staining of PdgfrartTA;tetO-cre;Rosa-tdTomato mice at P40. Markers include: tdTomato (red), SM22a (green) and DAPI (blue) (B–D); and tdTomato (red), ADRP (green) and DAPI (blue) (E–G). Scale bars: 50 µm.
Figure 3 with 1 supplement
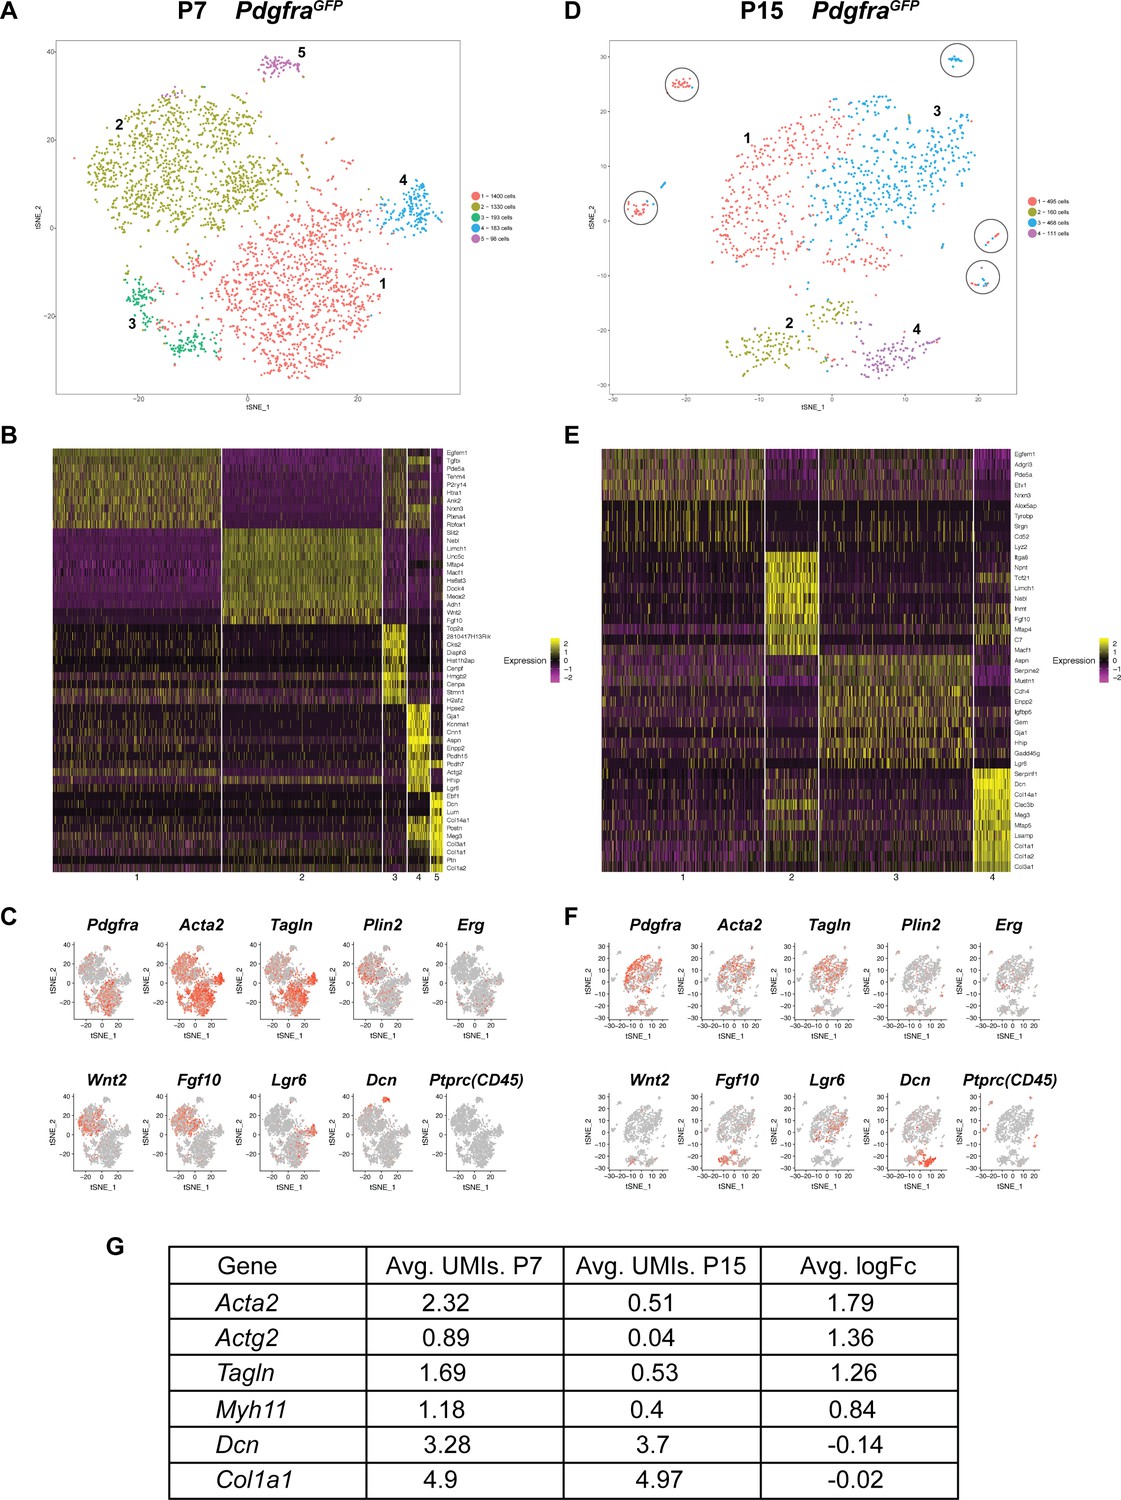
Single cell transcriptome analysis of Pdgfra+ cells during alveologenesis.
(A, D) tSNE plots of scRNAseq data from cells isolated from P7 (A) and P15 (D) PdgfraGFP lungs. Cells can be clustered into five and four main distinct populations at P7 and P15, respectively. Circles in D highlight satellite clusters. (B, E) Heatmap showing top expressed genes across clusters from P7 (B) and P15 (E) PdgfraGFP lungs. (C, F) Distribution of cells expressing the indicated marker genes on tSNE plots from P7 (C) and P15 (F) PdgfraGFP lungs. (G) A list of representative genes showed altered expression in P7 versus P15 PdgfraGFP lungs, as indicated by the average unique molecular identifier (UMI) of the gene per cell in the Pdgfra-high clusters (for Acta2, Actg2, Tagln and Myh11), or in the matrix clusters (for Dcn, Col1a1).
Figure 3—figure supplement 1
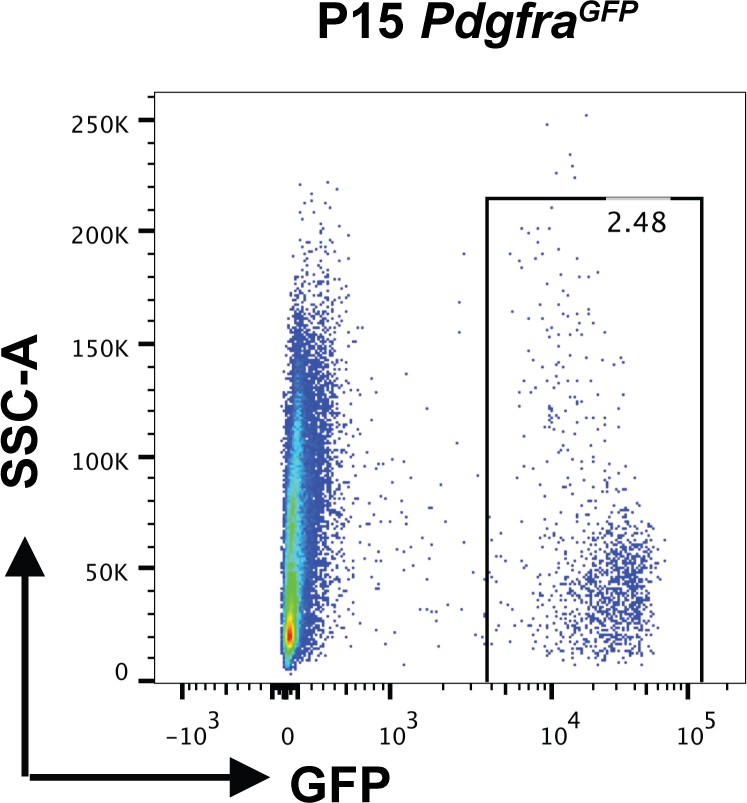
FACS sorting of GFP+ cells from P15 PdgfraGFP mice.
Representative FACS plot showing GFP+ cells in P15 PdgfraGFP mice.
Figure 4
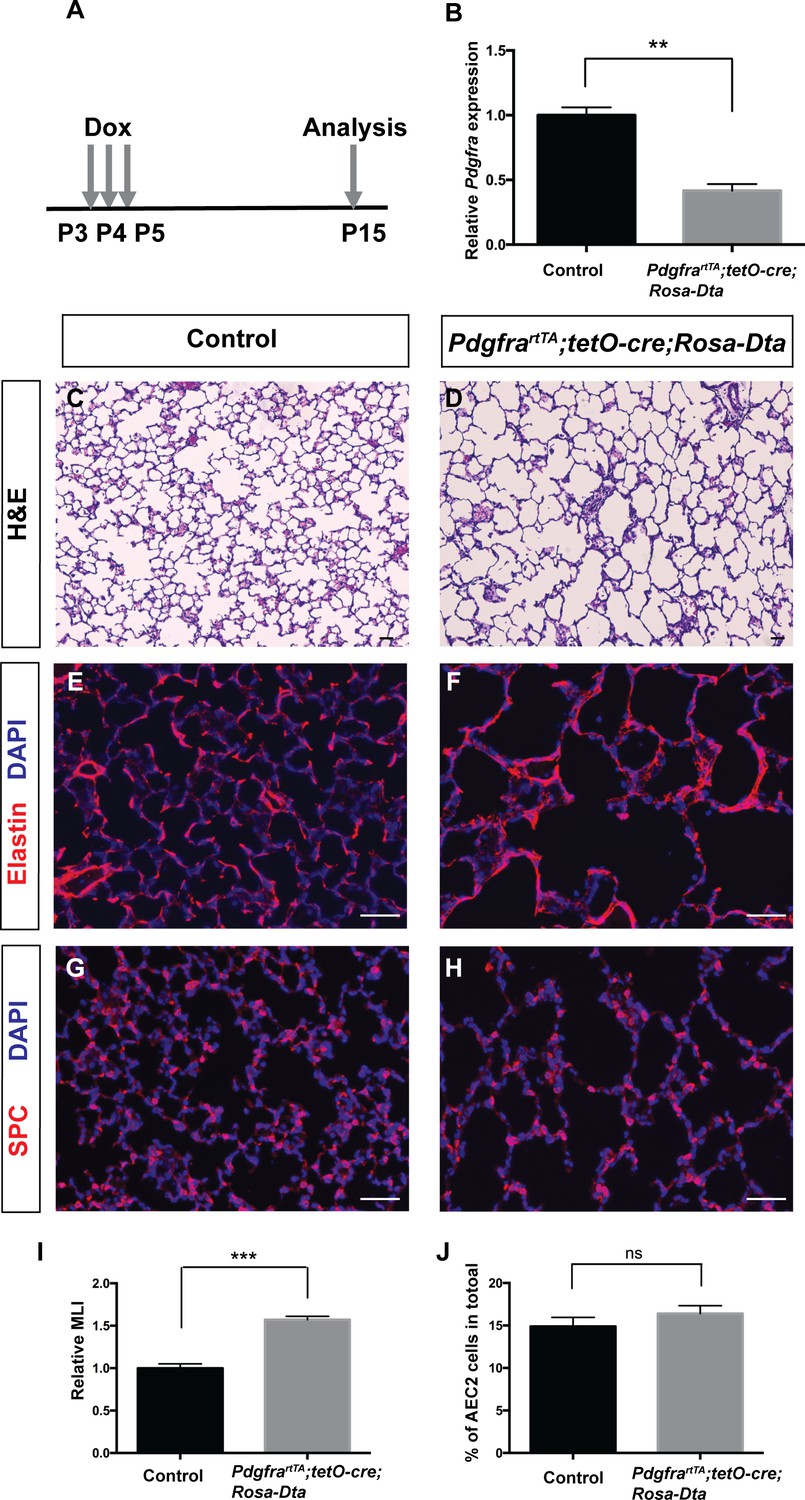
Genetic ablation of Pdgfrα+ cells led to simplified alveoli.
(A) Timeline of dox treatments and analysis. (B) qRT-PCR analysis indicated decreased Pdgfra expression in PdgfrartTA;tetO-cre;Rosa-Dta lungs compared to controls (1 ± 0.06 for control and 0.42 ± 0.05 for PdgfrartTA;tetO-cre;Rosa-Dta mice, **p=0.0019, n = 3 each). (C–D) Representative H and E stained sections showing that PdgfrartTA;tetO-cre;Rosa-Dta mice have simplified alveoli compared to control. (E–F) Representative immunofluorescent stained sections for Elastin (red) and DAPI (blue) showing that PdgfrartTA;tetO-cre;Rosa-Dta lungs have disorganized Elastin. (G–H) Representative Immunofluorescent staining for AEC2 cells marker SPC (red) and DAPI (blue) showing that PdgfrartTA;tetO-cre;Rosa-Dta lungs have reduced AEC2 cells in proportion with alveoli simplification. Scale bars: 50 µm. (I) Quantification of alveolar simplification by MLI (1 ± 0.05 for control and 1.57 ± 0.04 for PdgfrartTA;tetO-cre;Rosa-Dta mice, ***p=0.0009, n = 3 each). (J) Quantification of the percentage of total cells that are SPC+. There is no change in the proportion with or without ablation (14.9 ± 1.06 for control and 16.4 ± 0.93 for PdgfrartTA;tetO-cre;Rosa-Dta mice, ns for not significant, p=0.3414, n = 3 each).
-
Figure 4—source data 1
Raw data for Figure 4.
- https://doi.org/10.7554/eLife.36865.015
Figure 5 with 1 supplement
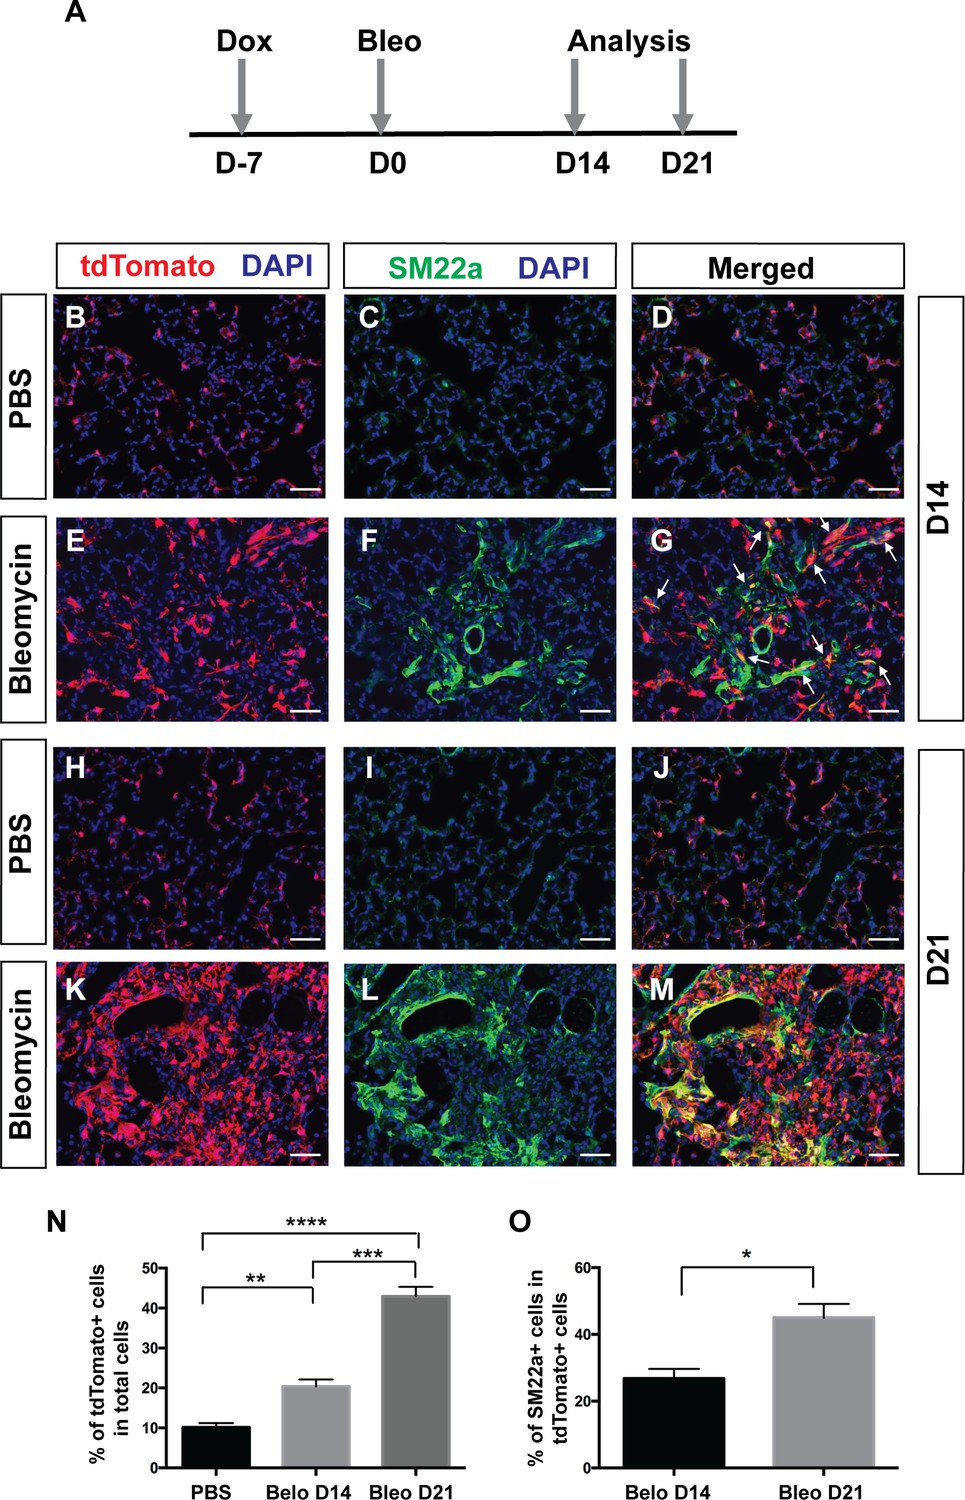
Pdgfra-lineage cells increased and contributed to myofibroblasts following bleomycin-induced injury.
(A) Timeline of dox treatment, bleomycin administration and analysis. PdgfrartTA;tetO-cre;Rosa-tdTomato mice were given one dose of dox injection 7 days (D) before bleomycin injury. Lungs were analyzed at either D14 or D21 after bleomycin administration. (B–M) Representative immunofluorescent staining for tdTomato (red), SM22a (green) and DAPI (blue) in lungs of PBS-treated controls at D14 (B–D), bleomycin-treated mice at D14 (E–G), PBS-treated controls at D21 (H–J), and bleomycin-treated mice at D21 (K–M). (N) Quantification of the mean percentage of tdTomato+ cells in total (10.14 ± 1.08 for PBS, 20.4 ± 1.75 for bleomycin D14 and 42.93 ± 2.39 for bleomycin D21. PBS versus bleomycin D14, **p=0.0025; PBS versus bleomycin D21, ****p=0.000016; bleomycin D14 versus bleomycin D21, ***p=0.0003; n = 4 each). (O) Quantification of the mean percentage of SM22a + cells in tdTomato+ cells (26.85 ± 2.85 for bleomycin D14 and 45.01 ± 4.1 for bleomycin D21, *p=0.0109, n = 4 each). Scale bars: 50 µm.
-
Figure 5—source data 1
Raw data for Figure 5.
- https://doi.org/10.7554/eLife.36865.018
Figure 5—figure supplement 1
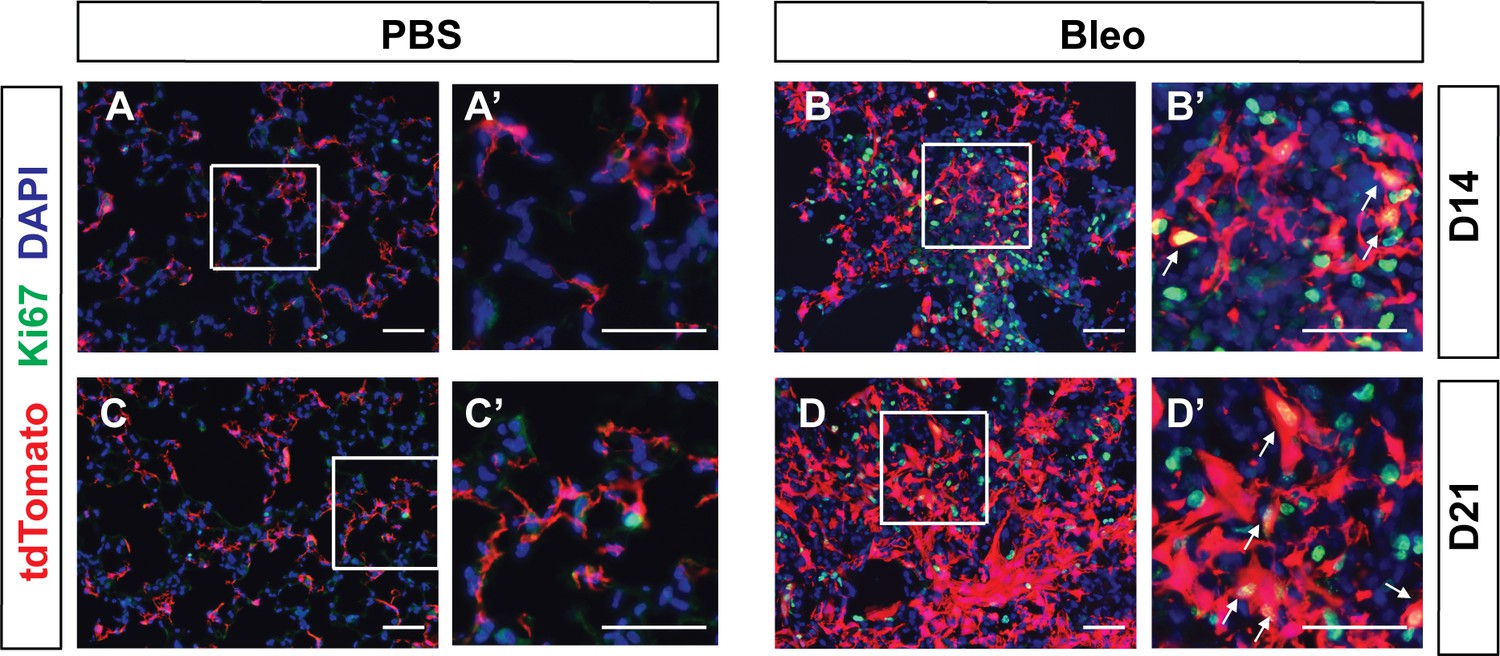
Pdgfra-lineaged cells proliferate following bleomycin treatment.
(A–D, A’–D’) Representative immunofluorescent staining for tdTomato (red), Ki67 (green) and DAPI (blue) in lungs of PBS-treated controls and bleomycin-treated mice (B, B’) on D14 or D21 post treatment. Boxed areas in (A-D) are magnified in (A’-D’), respectively. Arrows in panels (B’) and (D’) indicate co-localization. Scale bars: 50 µm.
Figure 6

Pdgfra-lineaged cells decrease following neonatal hyperoxia-induced injury.
(A) Timeline of dox and hyperoxia treatment. Pregnant females were fed dox food between E9.5 and P0. Pups and mother were then fed food without dox, raised in 75% O2 or room air from P0 to P12 and the lungs were harvested at P12. (B, C) Representative immunofluorescent staining for tdTomato (red) and DAPI (blue) showing that the hyperoxia group have decreased tdTomato-lineaged cells compared to room air controls. (D) Quantification showing the percentage of tdTomato+ cells in room air and hyperoxia (17.6 ± 1.37 for room air and 7.25 ± 0.65 for hyperoxia, **p=0.0024, n = 3 each). (E, F) Representative immunofluorescent staining for tdTomato (red), SM22a (green) and DAPI (blue) showing that the hyperoxia group have increased SM22a+ myofibroblasts. (G) Quantification showing relative SM22a staining intensity as quantified in relationship to DAPI intensity (1 ± 0.11 for room air and 1.62 ± 0.17 for hyperoxia, *p=0.0342, n = 3 each). (H, I) Representative immunofluorescent staining for tdTomato (red), ADRP (green) and DAPI (blue) showing that the hyperoxia group have decreased ADRP+ lipofibroblasts. (J) Quantification showing relative ADRP staining intensity as quantified in relationship to DAPI intensity (1 ± 0.04 for room air and 0.74 ± 0.06 for hyperoxia, *p=0.0257, n = 3 each). Scale bars: 50 µm.
-
Figure 6—source data 1
Raw data for Figure 6.
- https://doi.org/10.7554/eLife.36865.020
Figure 7
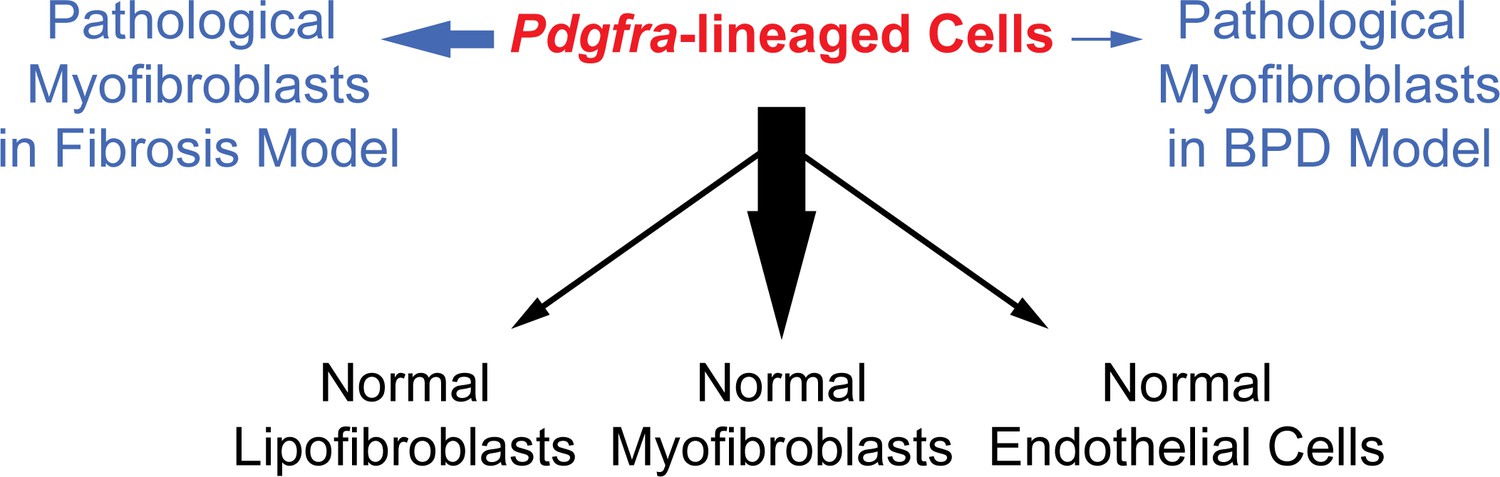
A model illustrating the lineage potential of Pdgfra-lineaged cells in development and pathogenesis.
In normal development (black notes), Pdgfra-lineaged cells give rise primarily to myofibroblasts, and minimally to lipofibroblasts and endothelial cells. In pathogenesis (blue notes), Pdgfra-lineaged cells contribute substantially to myofibroblasts in the bleomycin model of fibrosis, but contribute minimally to myofibroblasts in the neonatal hyperoxia model of BPD. Black and blue arrows are weighted to indicate distinct extent of contribution.
Tables
Key resources table
| REAGENT or RESOURCE | Designation | Source | Identifier | Additional information |
|---|---|---|---|---|
| strain, strain background (mouse) | tetO-GFP, mix background | Jackson Laboratories | 016836 | |
| strain, strain background (mouse) | PdgfraGFP , mix background | Jackson Laboratories | 007669 | |
| strain, strain background (mouse) | tetO-Cre, B6 background | Jackson Laboratories | 006234 | |
| strain, strain background (mouse) | Rosa-tdTomato, B6 background | Jackson Laboratories | 007914 | |
| strain, strain background (mouse) | Rosa-Dta, mix background | Jackson Laboratories | 006331 | |
| Antibody | Elastin | Abcam | ab21600, 1:500 | |
| Antibody | SM22a | Abcam | ab14106, 1:200 | |
| Antibody | ADRP | Abcam | ab52356, 1:200 | |
| Antibody | ERG | Abcam | ab92513, 1:200 | |
| Antibody | ICAM2 | BD | 553325, 1:200 | |
| Antibody | Ki67 | Abcam | ab15580, 1:200 | |
| Antibody | a-SMA | Sigma | F3777, 1:200 | |
| Antibody | goat anti rabbit FITC | Jackson Immuno Research Laboratories | 111-095-144, 1:200 | |
| Antibody | goat anti rabbit Cy3 | Jackson Immuno Research Laboratories | 111-165-144, 1:200 | |
| Antibody | goat anti rat FITC | Jackson Immuno Research Laboratories | 112-095-003 1:200 |
Additional files
-
Transparent reporting form
- https://doi.org/10.7554/eLife.36865.022
Download links
A two-part list of links to download the article, or parts of the article, in various formats.
Downloads (link to download the article as PDF)
Open citations (links to open the citations from this article in various online reference manager services)
Cite this article (links to download the citations from this article in formats compatible with various reference manager tools)
Pdgfra marks a cellular lineage with distinct contributions to myofibroblasts in lung maturation and injury response
eLife 7:e36865.
https://doi.org/10.7554/eLife.36865


