Mitotic progression, arrest, exit or death relies on centromere structural integrity, rather than de novo transcription
- Universidade do Porto, Portugal
- University of Edinburgh, United Kingdom
- Erasmus Medical Center, Netherlands
Figures
Figure 1
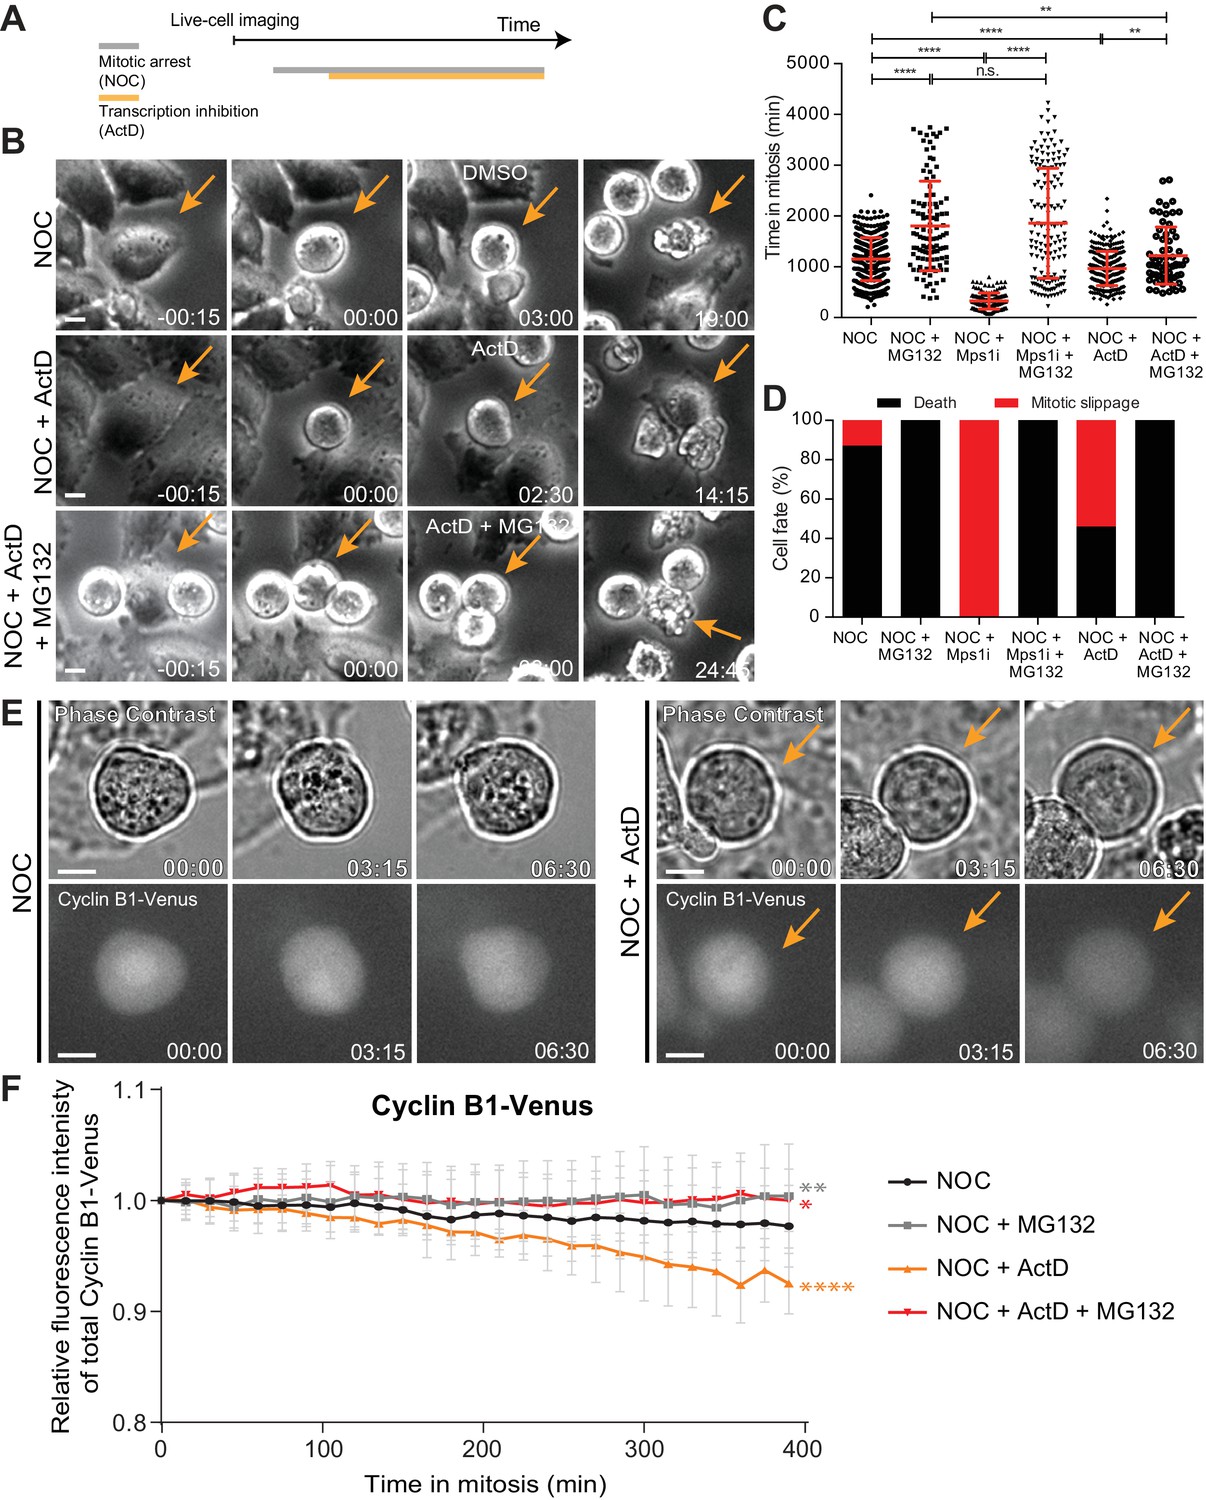
Actinomycin D compromises SAC response.
(A) Schematic representation of the experimental protocol used to study the effect of actinomycin D (ActD) on mitotic cells by live cell imaging. (B) Selected time frames from phase contrast microscopy of HeLa cells treated with nocodazole and either DMSO (NOC), ActD (NOC + ActD) or ActD with MG132 (NOC + ActD + MG132). Images were acquired every 15 min. Arrows highlight examples of control (NOC) and ActD with MG132 (NOC + ActD + MG132) cells entering and dying in mitosis after a prolonged arrest. In cells treated with ActD (NOC + ActD), arrow highlights an example of a cell entering mitosis and then exiting mitosis through mitotic slippage. Scale bar = 10 µm. Time = hr:min. (C) Scattered plot showing the duration of the mitotic arrest of HeLa cells treated with nocodazole and either Mps1 inhibitor (NOC + Mps1 i) or ActD (NOC + ActD) with or without MG132. The red line represents the mean and the error bars represent the standard deviation from a pool of at least three independent experiments (NOC, 19.2 ± 7.0 hr, n = 386; NOC + MG132, 30.1 ± 14.7 hr, n = 108; NOC + Mps1 i, 5.4 ± 2.6 hr, n = 154; NOC + Mps1 i+MG132, 30.9 ± 18.1 hr, n = 150; NOC + ActD, 16.1 ± 5.6 hr, n = 301; NOC + ActD + MG132, 20.3 ± 9.4 hr, n = 65; median ±SD; **p≤0.01, ****p≤0.0001, Mann-Whitney Rank Sum Test). (D) Cell fate of mitotic HeLa cells treated with the same drugs as in 1C. (E) Selected time frames from phase contrast and fluorescence microscopy of Cyclin B1-Venus HeLa cells treated with DMSO or ActD in the presence of nocodazole. Images were acquired every 15 min. For ActD-treated cells (NOC + ActD) arrows highlight a mitotic cell showing reduction of Cyclin B1 over time. Scale bar = 10 µm. Time = hr:min. (F) Cyclin B1 degradation curves for control and ActD-treated Cyclin B1-Venus HeLa cells after nocodazole treatment with or without MG132. Fluorescence intensities were normalized to the level at time = 0. The curves depict mean Cyclin B1-Venus fluorescent intensity from all analyzed cells per condition (NOC n = 12; NOC + MG132 n = 10; NOC + ActD n = 9; NOC + ActD + MG132 n = 10; from time = 0 to 26 time frames), and error bars represent the standard deviation (*p≤0.05, **p≤0.01, ****p≤0.0001 relative to control, Analysis of covariance).
Figure 2 with 4 supplements
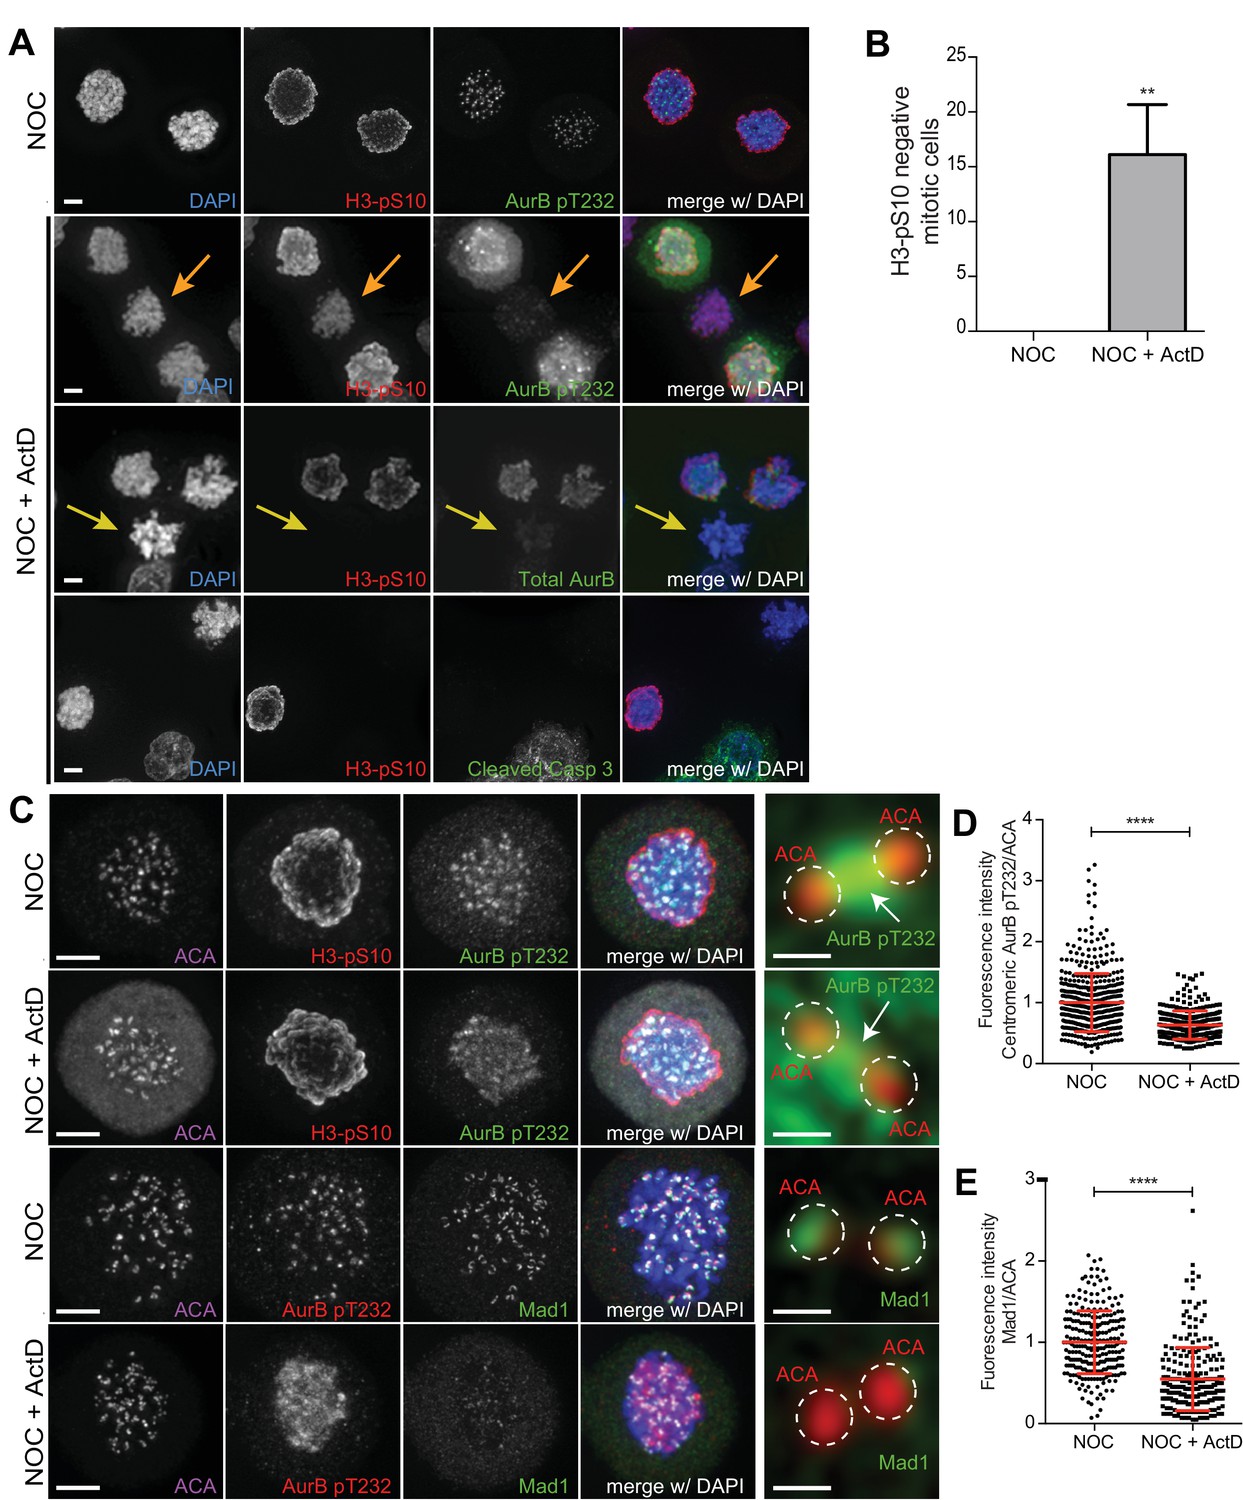
Actinomycin D compromises the localization of Aurora B and Mad1 at centromeres/kinetochores.
(A) Representative immunofluorescence images of HeLa cells treated with DMSO (NOC) or ActD for 8 hr (NOC + ActD) after nocodazole treatment with the indicated antibodies. In the NOC + ActD condition orange arrows highlight a mitotic cell with reduced levels of phosphorylated Histone H3 (H3–pS10) and devoid of the active form of Aurora B (AurB pT232). Yellow arrows highlight a mitotic cell with abolished levels of phospho H3 (H3–pS10) and devoid of total Aurora B. Scale bar = 5 µm. (B) Percentage of mitotic phospho H3-negative cells in control (NOC) and 8 hr actinomycin D (NOC + ActD)-treated HeLa cells. The bar graph represents the mean and the standard deviation from three independent experiments (NOC 0.0 ± 0.0, n = 600; NOC + ActD, 16.1 ± 4.5, n = 600; **p≤0.01 relative to control, t test) (C) Representative immunofluorescence images of Hela cells treated with DMSO (NOC) or ActD for 4 hr (NOC + ActD) after nocodazole treatment with the indicated antibodies. Scale bar = 5 µm. 10x magnification of a pair of kinetochores are shown in the right. Dashed circle encompasses a single kinetochore and the arrow indicates the position of centromeric Aurora B. Scale bar = 0.5 µm. (D) Normalized ratio of pAurora B/ACA fluorescence signal at inner centromere of NOC and NOC + ActD. Each dot represents an individual kinetochore. The red line represents the mean of all quantified kinetochores and the error bars represent the standard deviation from a pool of at least two independent experiments. (NOC, 1.00 ± 0.48, n = 474; NOC + ActD, 0.63 ± 0.23, n = 309; ****p≤0.0001 relative to control, Mann-Whitney Rank Sum Test). (E) Normalized ratio of Mad1/ACA fluorescence signal at outer kinetochores of NOC and NOC + ActD cells. Each dot represents an individual kinetochore. The red line represents the mean of all quantified kinetochores and the error bars represent the standard deviation from a pool of at least two independent experiments. (NOC, 1.00 ± 0.39, n = 261; NOC + ActD, 0.55 ± 0.39, n = 258; ****p≤0.0001 relative to control, Mann-Whitney Rank Sum Test).
Figure 2—figure supplement 1

Actinomycin D compromise Aurora B localization in RPE1 cells.
(A) Representative immunofluorescence images of RPE1 cells treated with DMSO (NOC) or ActD for 4 hr (NOC + ActD) after nocodazole treatment with the indicated antibodies. Scale bar = 5 µm. (D) Normalized ratio of pAurora B/ACA fluorescence signal at inner centromere of NOC and NOC + ActD. Each dot represents an individual kinetochore. The red line represents the mean of all quantified kinetochores and the error bars represent the standard deviation from a pool of two technical replicates (NOC, 1.00 ± 0.42, n = 92; NOC + ActD, 0.83 ± 0.47, n = 92; *p≤0.05 relative to control, Mann-Whitney Rank Sum Test).
Figure 2—figure supplement 2
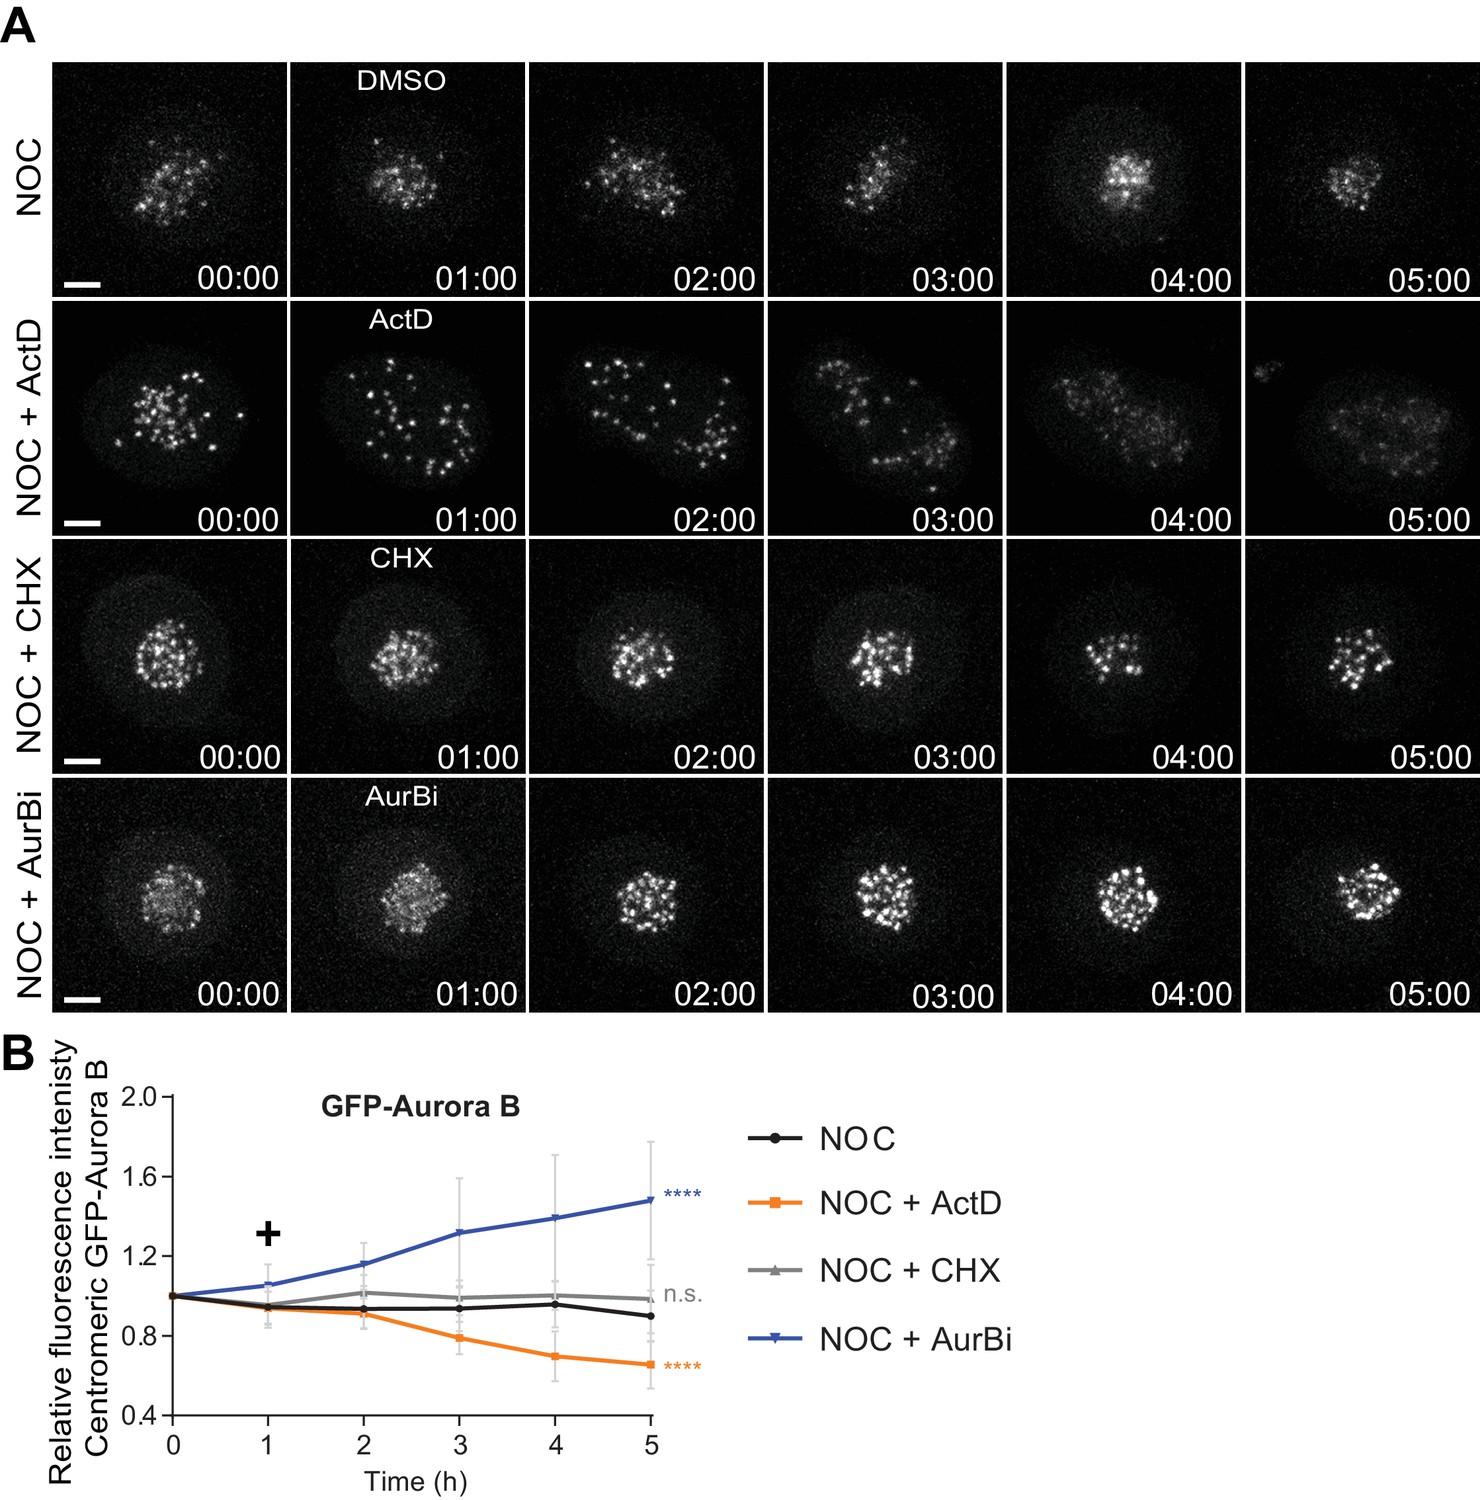
Actinomycin D causes Aurora B displacement from centromeres onto chromosome arms.
(A) Selected time frames from fluorescence microscopy of HeLa LAP-Aurora B cells treated with DMSO, ActD, CHX or AurBi after nocodazole treatment. Images were acquired every 10 min. Scale bar = 5 µm. Time = h:min. (B) Relative fluorescence intensity curves of centromeric GFP-Aurora B for control, ActD, CHX and AurBi treated HeLa cells after nocodazole treatment. Fluorescence intensities were normalized to the level at time = 0. The curves depict mean GFP-Aurora B fluorescent intensity from analyzed cells (NOC n = 9; NOC + ActD n = 8; NOC + CHX n = 7; NOC + AurBi n = 8; from time = 0 to 30 time frames), and error bars represent the standard deviation (n.s. p>0.05, ****p≤0.0001 relative to control, Analysis of covariance). Plus symbol on the graph indicates the time when the drugs were added.
Figure 2—figure supplement 3

Inhibition of mitotic translation or Aurora B kinase activity during prometaphase does not affect Aurora B localization.
(A) Representative immunofluorescence images of HeLa cells treated with DMSO (NOC) or CHX for 4 hr (NOC +CHX) after NOC treatment with the indicated antibodies. Scale bar = 5 µm. 10x magnification of a pair of kinetochores are shown in the right. Dashed circles encompass single kinetochores and the arrow indicate the position of centromeric Aurora B. Scale bar = 0.5 µm. (B) Normalized ratio of pAurora B/ACA fluorescence signal at centromeres of NOC and NOC + CHX treated cells. Each dot represents an individual kinetochore. The red line represents the mean of all quantified kinetochores and the error bars represent the standard deviation from a pool of two technical replicates. (NOC, 1.00 ± 0.48, n = 474; NOC + CHX, 1.09 ± 0.40, n = 116; n.s. p>0.05 relative to control, Mann-Whitney Rank Sum Test). (C) Representative immunofluorescence images of HeLa cells treated with DMSO (NOC) or Aurora B inhibitor for 4 hr (NOC + AurBi) after NOC treatment with the indicated antibodies. Scale bar = 5 µm.
Figure 2—figure supplement 4

Actinomycin D does not compromise pMPS1 localization at kinetochores and pH3T3 levels.
(A) Representative immunofluorescence images of HeLa cells treated with DMSO (NOC) or ActD for 4 hr (NOC + ActD) after nocodazole treatment with the indicated antibodies. Scale bar = 5 µm. (B) Normalized ratio of pMPS1/ACA fluorescence signal at outer kinetochores of NOC and NOC + ActD cells. Each dot represents an individual kinetochore. The red line represents the mean of all quantified kinetochores and the error bars represent the standard deviation from a pool of two technical replicates (NOC, 1.00 ± 0.48, n = 99; NOC + ActD, 0.93 ± 0.57, n = 99; n.s. p>0.05 relative to control, Mann-Whitney Rank Sum Test). (C) Representative immunofluorescence images of HeLa cells treated with DMSO (NOC) or ActD for 4 hr (NOC + ActD) after nocodazole treatment with the indicated antibodies. Scale bar = 5 µm. (D) Normalized ratio of pH3T3/DAPI fluorescence signal of NOC and NOC + ActD cells. Each dot represents an individual cell. The red line represents the mean of all cells and the error bars represent the standard deviation from a pool of two technical replicates (NOC, 1.00 ± 0.48, n = 21; NOC + ActD, 0.82 ± 0.16, n = 22; n.s. p>0.05 relative to control, t test).
Figure 3 with 2 supplements
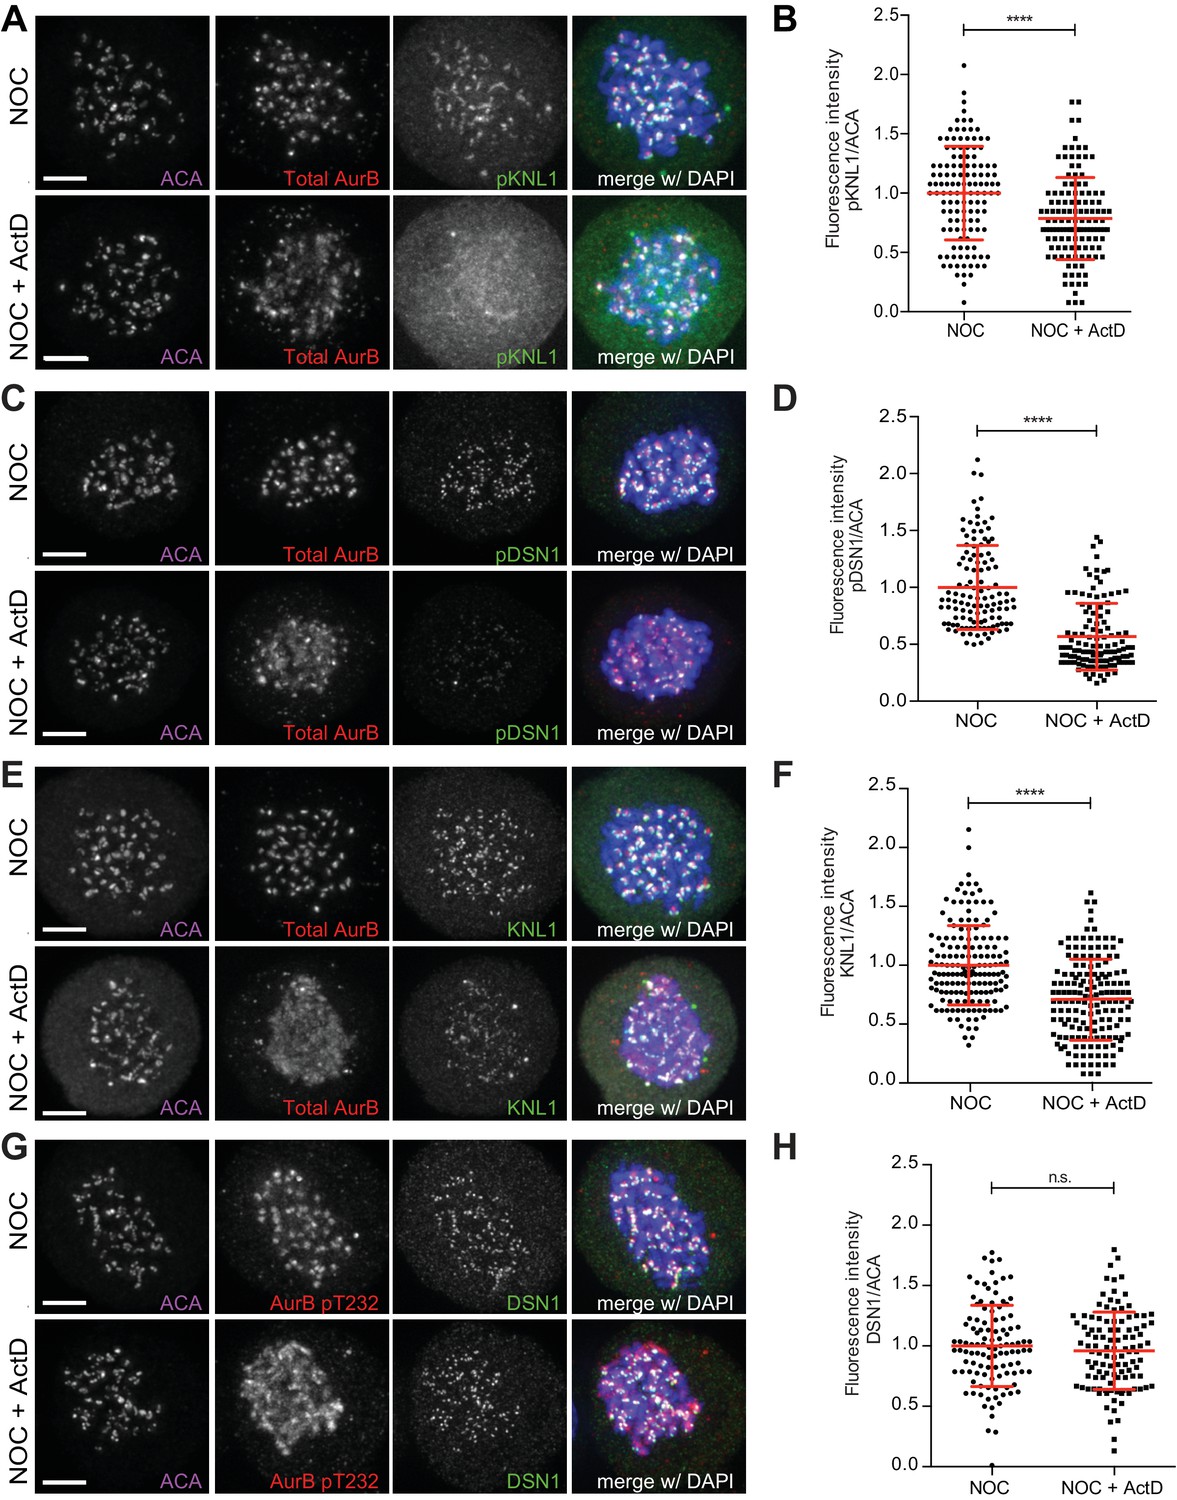
Actinomycin D affect recruitment of KNL1 and pDSN1 to kinetochores.
(A) Representative immunofluorescence images of HeLa cells treated with DMSO (NOC) or ActD for 4 hr (NOC + ActD) after nocodazole treatment with the indicated antibodies. Scale bar = 5 µm. (B) Normalized ratio of pKNL1/ACA fluorescence signal at outer kinetochores of NOC and NOC + ActD cells. Each dot represents an individual kinetochore. The red line represents the mean of all quantified kinetochores and the error bars represent the standard deviation from a pool of two technical replicates (NOC, 1.00 ± 0.40, n = 126; NOC + ActD, 0.79 ± 0.35, n = 126; ****p≤0.0001 relative to control, t test). (C) Representative immunofluorescence images of Hela cells treated with DMSO (NOC) or ActD for 4 hr (NOC + ActD) after nocodazole treatment with the indicated antibodies. Scale bar = 5 µm. (D) Normalized ratio of pDNS1/ACA fluorescence signal at outer kinetochores of NOC and NOC + ActD cells. Each dot represents an individual kinetochore. The red line represents the mean of all quantified kinetochores and the error bars represent the standard deviation from a pool of two technical replicates (NOC, 1.00 ± 0.37, n = 116; NOC + ActD, 0.57 ± 0.29, n = 116; ****p≤0.0001 relative to control, Mann-Whitney Rank Sum Test). (E) Representative immunofluorescence images of HeLa cells treated with DMSO (NOC) or ActD for 4 hr (NOC + ActD) after nocodazole treatment with the indicated antibodies. Scale bar = 5 µm. (F) Normalized ratio of KNL1/ACA fluorescence signal at outer kinetochores of NOC and NOC + ActD cells. Each dot represents an individual kinetochore. The red line represents the mean of all quantified kinetochores and the error bars represent the standard deviation from a pool of two technical replicates (NOC, 1.00 ± 0.34, n = 160; NOC + ActD, 0.71 ± 0.34, n = 160; ****p≤0.0001 relative to control, Mann-Whitney Rank Sum Test). (G) Representative immunofluorescence images of HeLa cells treated with DMSO (NOC) or ActD for 4 hr (NOC + ActD) after nocodazole treatment with the indicated antibodies. Scale bar = 5 µm. (H) Normalized ratio of DSN1/ACA fluorescence signal at outer kinetochores of NOC and NOC + ActD cells. Each dot represents an individual kinetochore. The red line represents the mean of all quantified kinetochores and the error bars represent the standard deviation from a pool of two technical replicates (NOC, 1.00 ± 0.34, n = 110; NOC + ActD, 0.96 ± 0.32, n = 110; n.s. p>0.05 relative to control, t test).
Figure 3—figure supplement 1
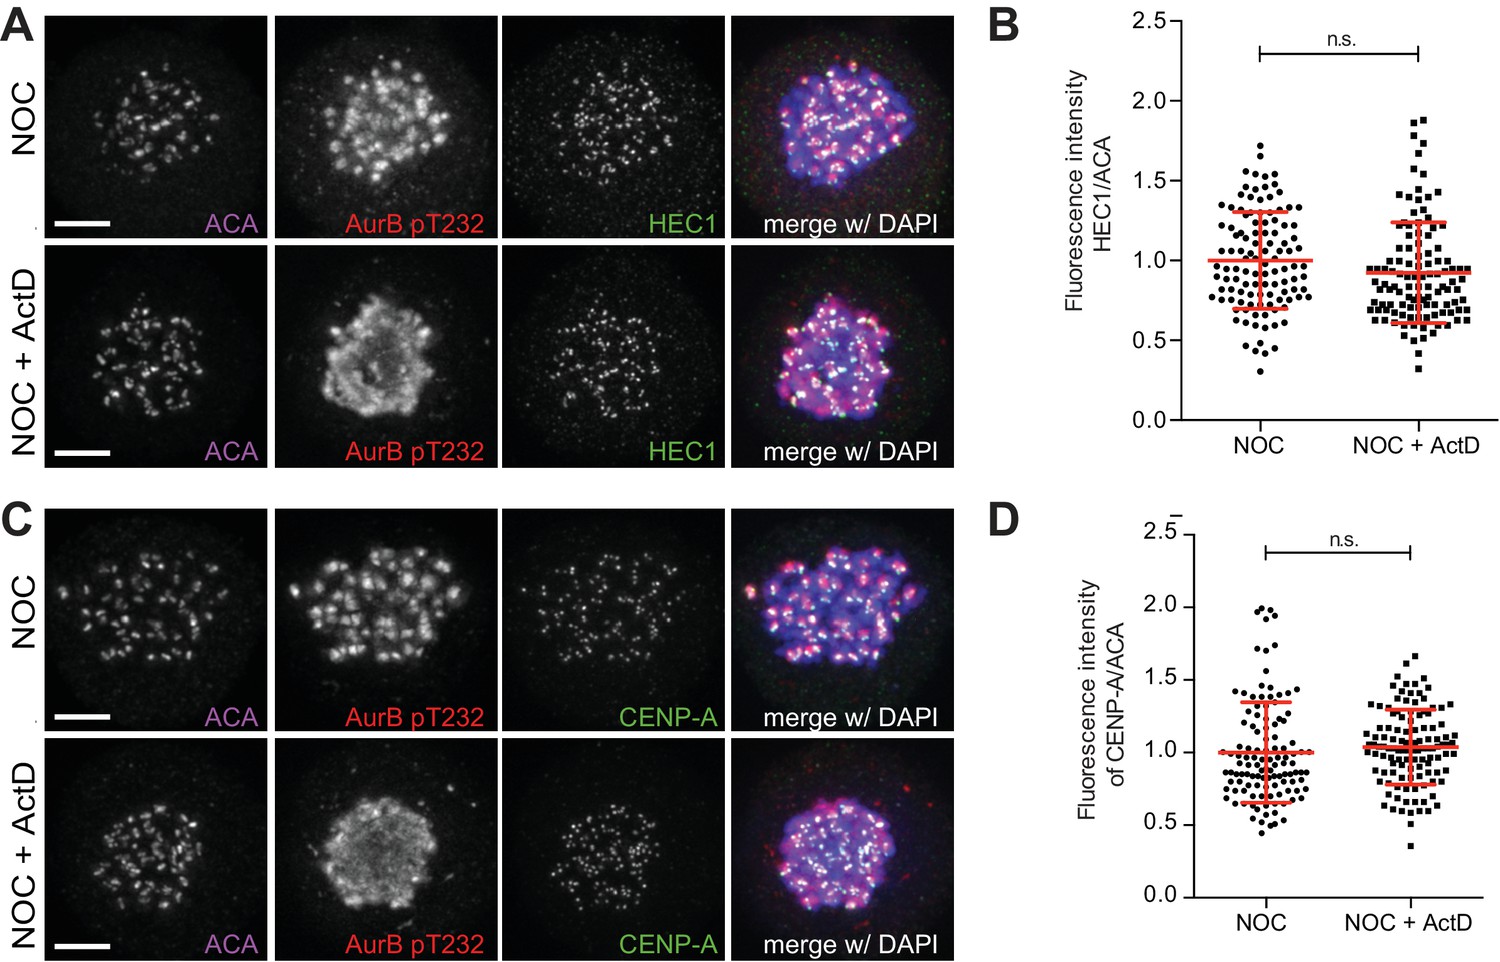
Actinomycin D does not affect levels of HEC1 and CENP-A (A) Representative immunofluorescence images of HeLa cells treated with DMSO (NOC) or ActD for 4 hr (NOC + ActD) after nocodazole treatment with the indicated antibodies.
Scale bar = 5 µm. (B) Normalized ratio of HEC1/ACA fluorescence signal at outer kinetochores of NOC and NOC + ActD cells. Each dot represents an individual kinetochore. The red line represents the mean of all quantified kinetochores and the error bars represent the standard deviation from a pool of two technical replicates (NOC, 1.00 ± 0.30, n = 112; NOC + ActD, 0.93 ± 0.32, n = 112; n.s. p>0.05 relative to control, Mann-Whitney Rank Sum Test). (C) Representative immunofluorescence images of HeLa cells treated with DMSO (NOC) or ActD for 4 hr (NOC + ActD) after nocodazole treatment with the indicated antibodies. Scale bar = 5 µm. (D) Normalized ratio of CENP-A/ACA fluorescence signal at outer kinetochores of NOC and NOC + ActD cells. Each dot represents an individual kinetochore. The red line represents the mean of all quantified kinetochores and the error bars represent the standard deviation from a pool of two technical replicates (NOC, 1.00 ± 0.35, n = 116; NOC + ActD, 1.04 ± 0.26, n = 116; n.s. p>0.05 relative to control, Mann-Whitney Rank Sum Test).
Figure 3—figure supplement 2
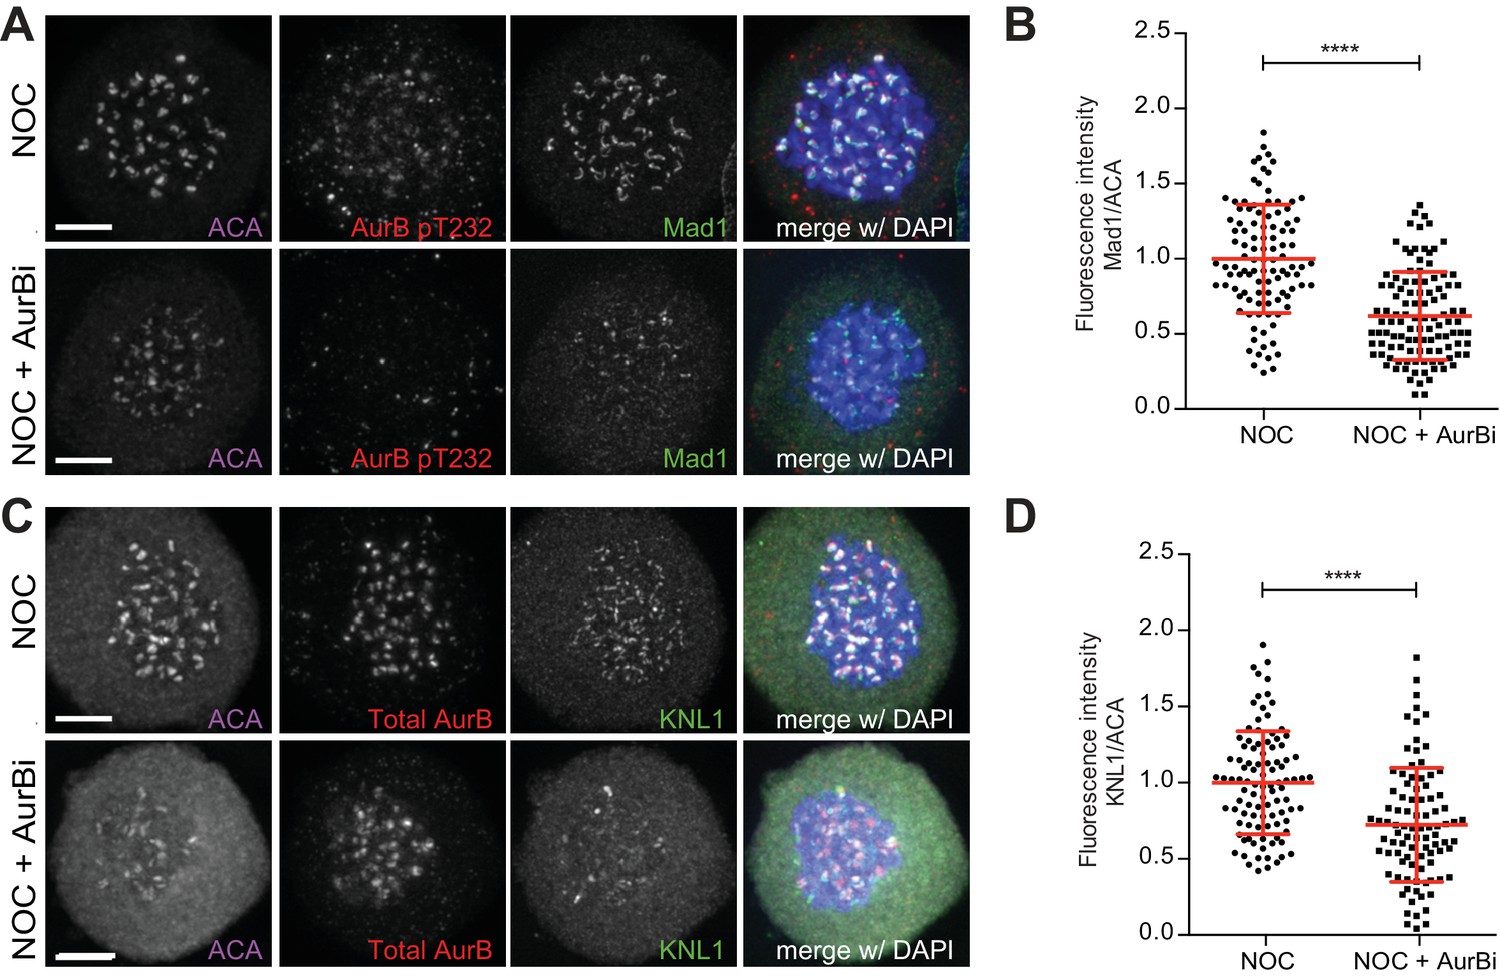
Aurora B inhibition affects recruitment of Mad1 and KNL1 to kinetochores.
(A) Representative immunofluorescence images of HeLa cells treated with DMSO (NOC) or Aurora B inhibitor for 4 hr (NOC + AurBi) after NOC treatment with the indicated antibodies. Scale bar = 5 µm. (B) Normalized ratio of Mad1/ACA fluorescence signal at outer kinetochores of NOC and NOC + AurBi cells. Each dot represents an individual kinetochore. The red line represents the mean of all quantified kinetochores and the error bars represent the standard deviation from a pool of two technical replicates (NOC, 1.00 ± 0.36, n = 105; NOC + AurBi, 0.62 ± 0.29, n = 110; ****p≤0.0001 relative to control, Mann-Whitney Rank Sum Test). (C) Representative immunofluorescence images of HeLa cells treated with DMSO (NOC) or Aurora B inhibitor for 4 hr (NOC + AurBi) after NOC treatment with the indicated antibodies. Scale bar = 5 µm. (D) Normalized ratio of KNL1/ACA fluorescence signal at outer kinetochores of NOC and NOC + AurBi cells. Each dot represents an individual kinetochore. The red line represents the mean of all quantified kinetochores and the error bars represent the standard deviation from a pool of two technical replicates (NOC, 1.00 ± 0.34, n = 99; NOC + AurBi, 0.72 ± 0.37, n = 92; ****p≤0.0001 relative to control, t test).
Figure 4
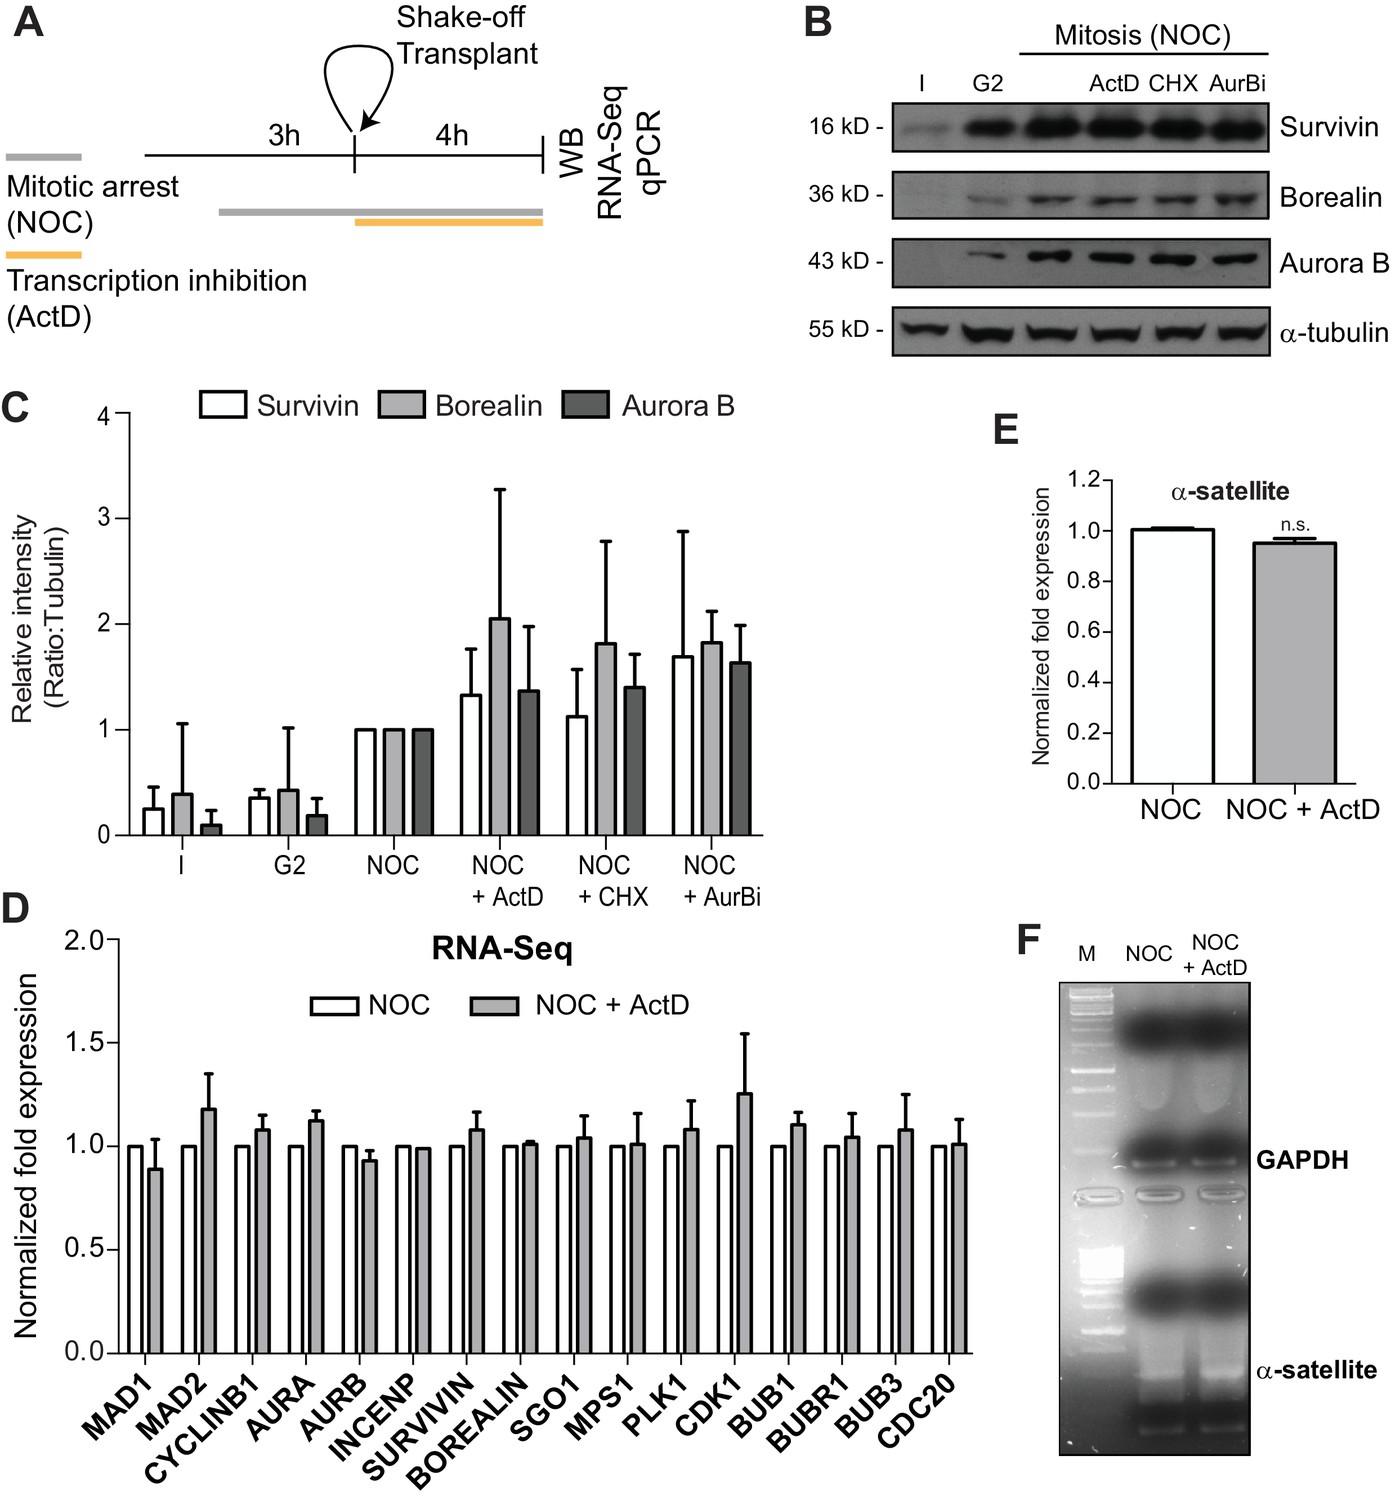
Actinomycin D treatment does not affect the levels of Aurora B or mitotic transcripts.
(A) Schematic representation of the experimental protocol used to study the effect of ActD in NOC induced mitotic arrested cells by western blot, RNA-seq and qPCR. (B) Western blot analysis of asynchronous (I), G2, and mitotic HeLa cell extracts (Mitosis) with the indicated antibodies. Mitotic extracts were derived from isolated mitotic cells treated cells with DMSO (control), ActD (ActD), cycloheximide (CHX) or Aurora B inhibitor (AurBi). α-tubulin was used as loading control. Approximate molecular weights are shown on the left. (C) Quantification of western blot is depicted in B. The bar represents the mean and the standard deviation from three independent experiments. (D) Normalized expression after RNA-seq of the indicated genes in control or ActD-treated mitotic cells. Error bars represent standard deviations from two independent experiments. (E) Normalized expression after qPCR of human alpha satellite gene in control or ActD-treated mitotic cells (NOC, 1.00 ± 0.01; NOC + ActD, 0.95 ± 0.02, median ±SD from three technical replicates, n.s. p>0.05 relative to control, Mann-Whitney Rank Sum Test). (F) Agarose gel electrophoresis of the qPCR product after amplification of cDNA, obtained from control or ActD-treated mitotic cells, with primers specific for the human alpha-satellite and GAPDH.
Figure 5 with 1 supplement
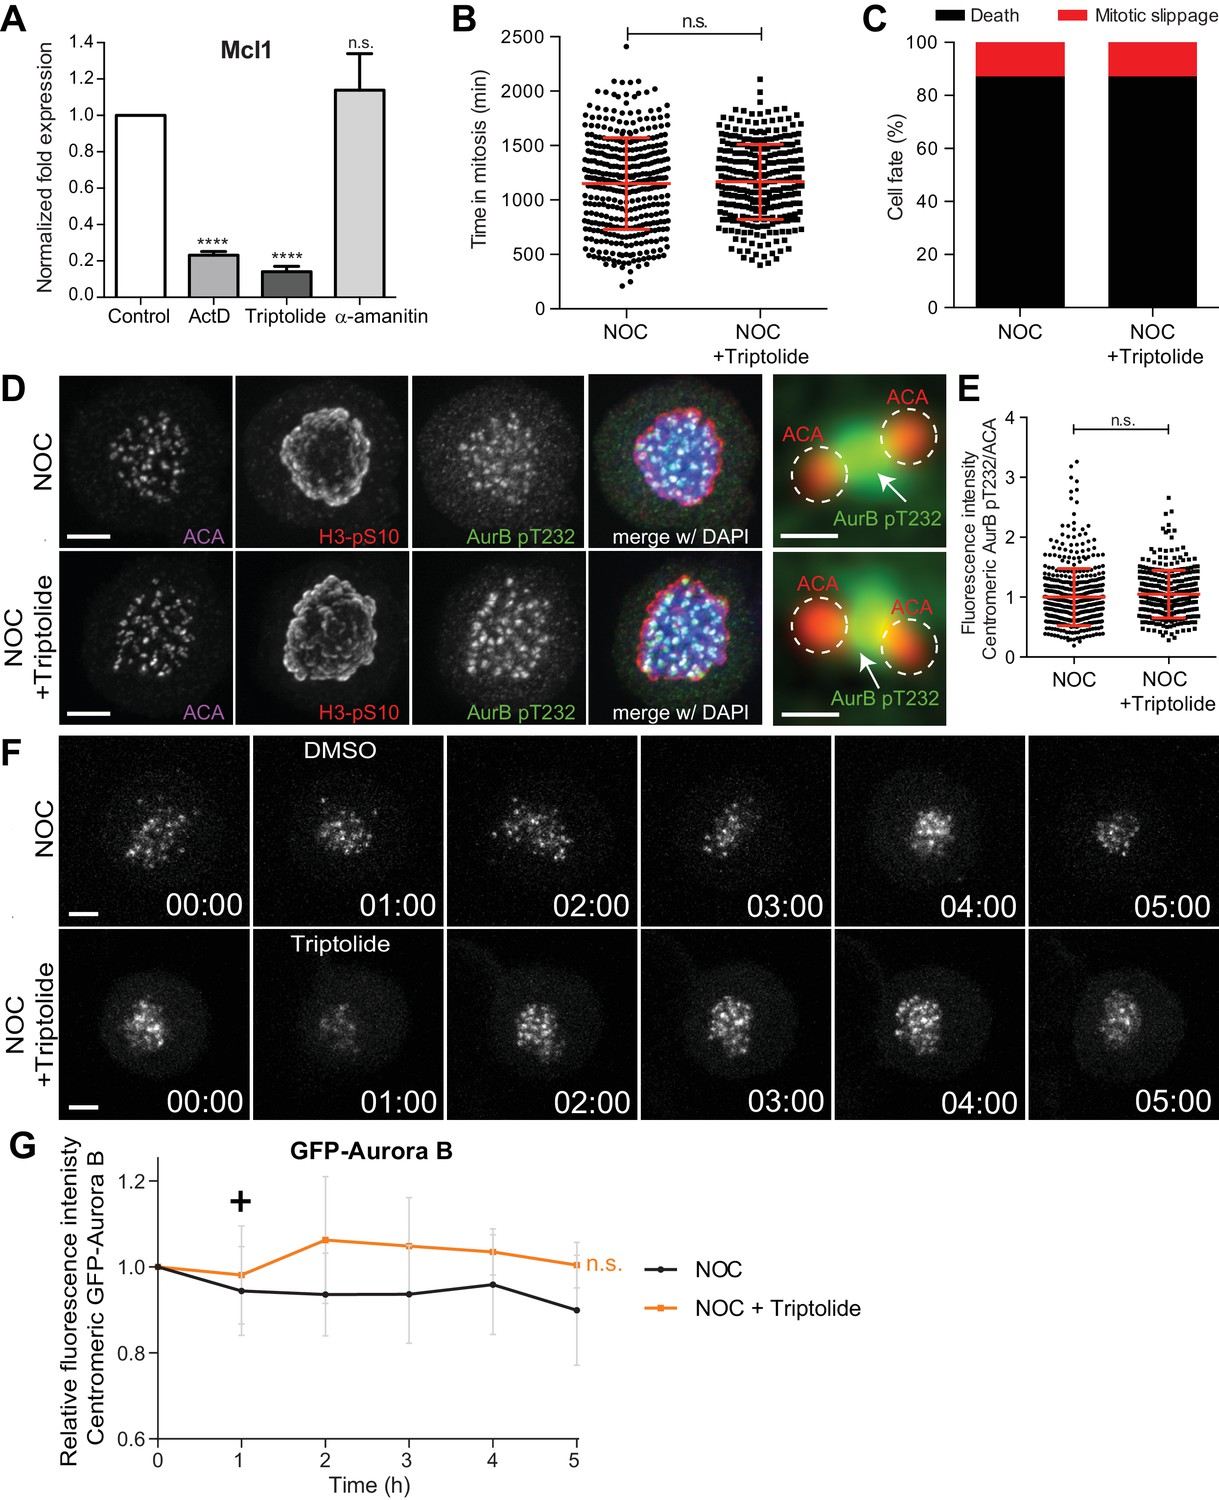
Inhibition of transcription independently of DNA-intercalation does not affect spindle assembly checkpoint robustness nor the capacity to trigger mitotic cell death.
(A) Normalized expression of Mcl1 in asynchronous control HeLa cells or cells treated with ActD, triptolide or α-amanitin (ActD, 0.23 ± 0.02, Triptolide, 0.14 ± 0.03; α-amanitin, 1.13 ± 0.2, median ±SD from three technical replicates, n.s. p>0.05, ****p≤0.0001 relative to control, t test). (B) Scatter plot showing the duration of the mitotic arrest of control (NOC) and HeLa cells treated with Triptolide (NOC + Triptolide) after nocodazole treatment. The red line represents the mean and the error bars represent the standard deviation from a pool of at least two independent experiments. (NOC, 19.2 ± 7.0 hr, n = 386; NOC + Triptolide, 30.1 ± 14.7 hr, n = 301; median ±SD; n.s. p>0.05, Mann-Whitney Rank Sum Test) (C) Cell fate of mitotic HeLa cells treated with the same drugs as in 4B. (D) Representative immunofluorescence images of HeLa cells treated with DMSO (NOC) or Triptolide for 4 hr (NOC + Triptolide) after nocodazole treatment with the indicated antibodies. Scale bar = 5 µm. 10x magnification of a pair of kinetochores are shown in the right. Dashed circle encompasses a single kinetochore and the arrow indicates the position of centromeric Aurora B. Scale bar = 0.5 µm. (E) Normalized ratio of pAurora B/ACA fluorescence signal at inner centromere of NOC and NOC + Triptolide. Each dot represents an individual kinetochore. The red line represents the mean of all quantified kinetochores and the error bars represent the standard deviation from a pool of two independent experiments. (NOC, 1.00 ± 0.48, n = 474; NOC + Triptolide, 1.05 ± 0.00.40, n = 296; n.s. p>0.05 relative to control, Mann-Whitney Rank Sum Test) (F) Selected time frames from fluorescence microscopy of HeLa LAP-Aurora B cells treated with DMSO or Triptolide after nocodazole treatment. Images were acquired every 10 min. Scale bar = 5 µm. Time = h:min. (G) Relative fluorescence intensity curves of centromeric GFP-Aurora B for control and Triptolide-treated HeLa cells after nocodazole treatment. Fluorescence intensities were normalized to the level at time = 0. The curves depict mean GFP-Aurora B fluorescent intensity from analyzed cells (NOC n = 9; NOC + Triptolide n = 8; from time = 0 to 30 time frames), and error bars represent the standard deviation (n.s. p>0.05 relative to control, Analysis of covariance). Plus symbol on the graph indicates the time when the drug was added.
Figure 5—figure supplement 1
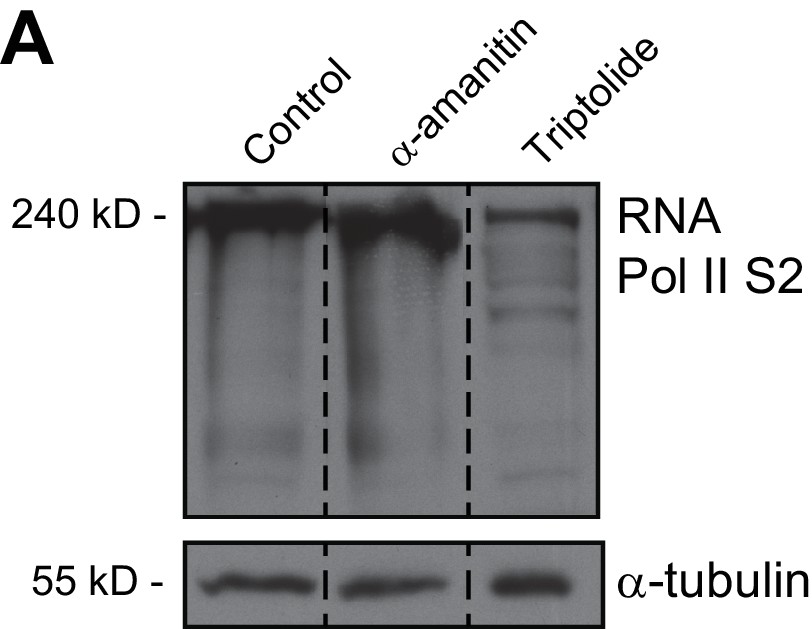
RNA Pol II is not degraded with 12 hr α-amanitin treatment.
Western blot analysis of control asynchronous HeLa cells extracts or asynchronous HeLa cells treated with α-amanitin or Triptolide with the indicated antibodies. Cell lysates were resolved with 7% SDS-PAGE. α-tubulin was used as loading control. Dashed lines indicate that intervening lanes have been spliced out. Approximate molecular weights indicated on the left.
Figure 6
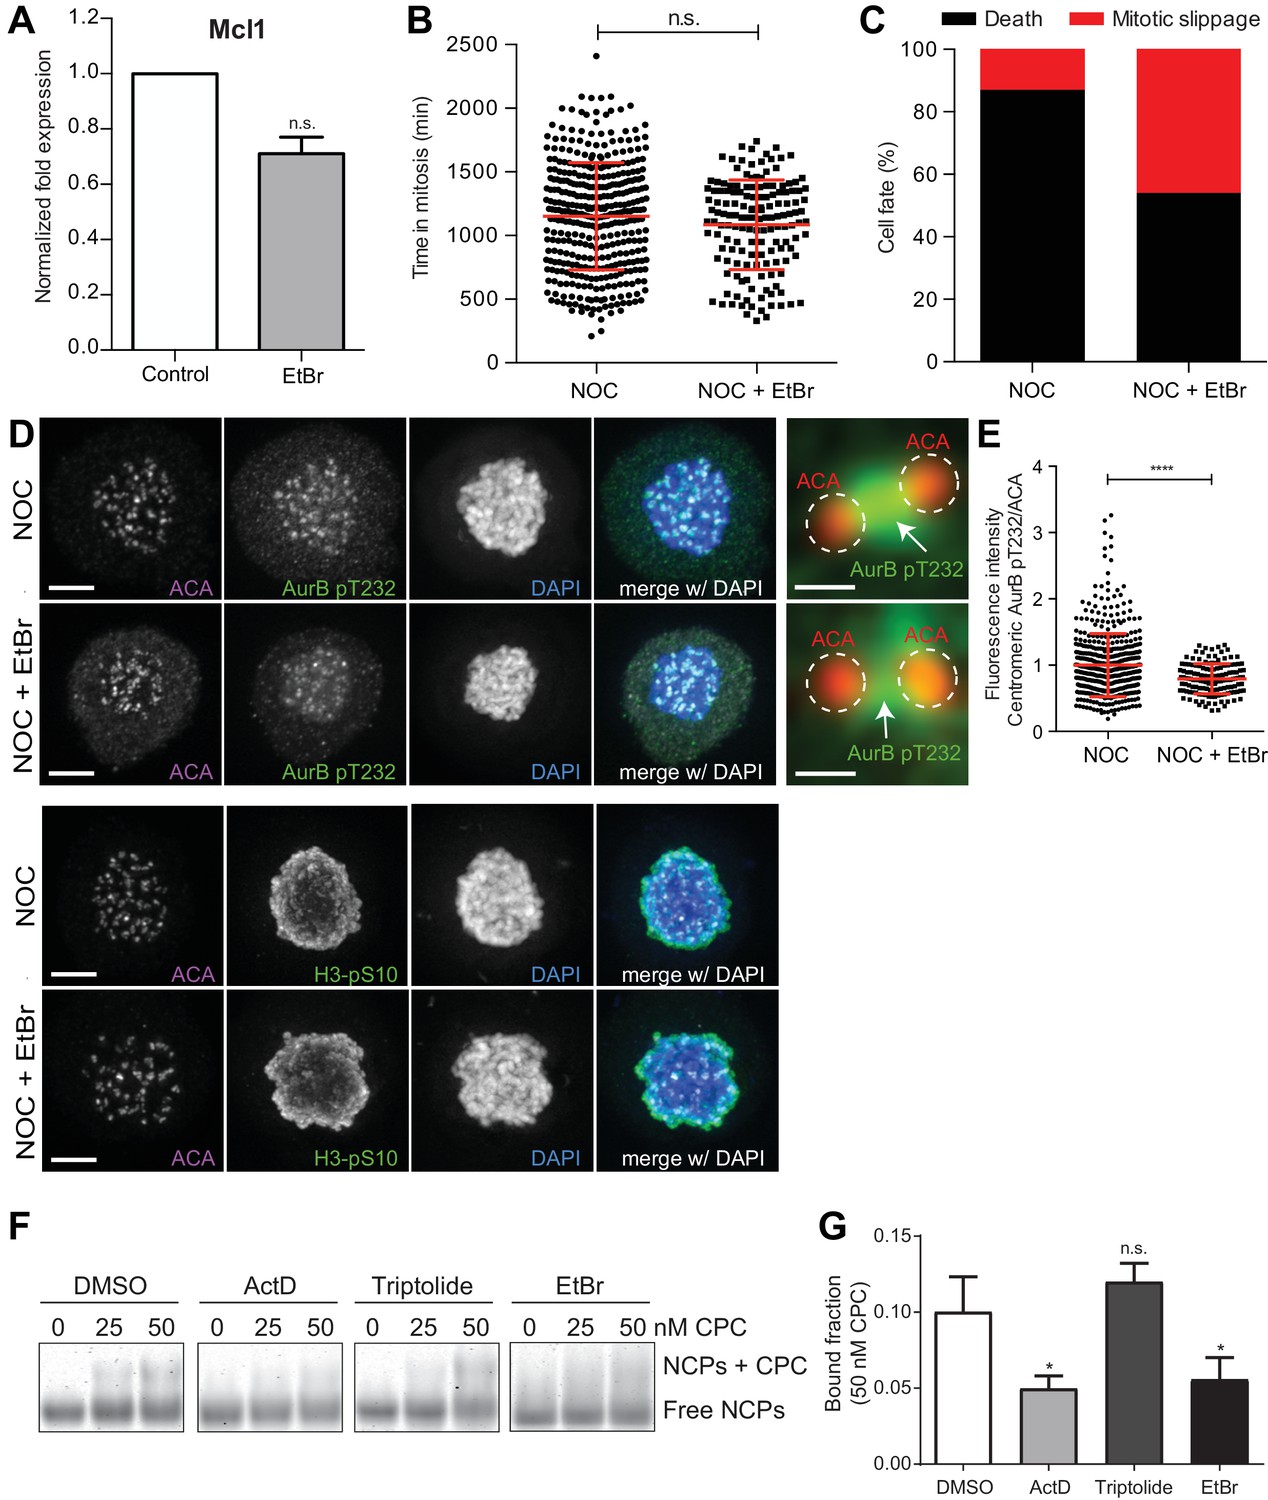
DNA intercalation compromises SAC response by interfering with Aurora B localization.
(A) Normalized expression of Mcl1 in asynchronous control HeLa cells or cells treated with ethidium bromide (EtBr) (EtBr, 0.71 ± 0.06, median ±SD from three technical replicates, n.s. p>0.05, Mann-Whitney Rank Sum Test). (B) Scattered plot showing the duration of the mitotic arrest of control (NOC) and Hela cells treated with ethidium bromide (NOC + EtBr) after nocodazole treatment (NOC, 19.2 ± 7.0 hr, n = 386; NOC + EtBr, 18.1 ± 5.9 hr, n = 151; median ±SD; n.s. p>0.05, Mann-Whitney Rank Sum Test). The red line represents the mean and the error bars represent the standard deviation from a pool of at least two independent experiments. (C) Cell fate of mitotic HeLa cells treated with the same drugs as in 5B. (D) Representative immunofluorescence images of HeLa cells treated with DMSO (NOC) or ethidium bromide for 4 hr (NOC + EtBr) after nocodazole treatment with the indicated antibodies. Scale bar = 5 µm. 10x magnification of a pair of kinetochores are shown in the right. Dashed circle encompasses a single kinetochore and the arrow indicate the position of centromeric Aurora B. Scale bar = 0.5 µm. (E) Normalized ratio of pAurora B/ACA fluorescence signal at inner centromere of NOC and NOC + EtBr. Each dot represents an individual kinetochore. The red line represents the mean of all quantified kinetochores and the error bars represent the standard deviation. (NOC, 1.00 ± 0.48, n = 474; NOC + EtBr, 0.79 ± 0.23, n = 143; ****p≤0.0001 relative to control, Mann-Whitney Rank Sum Test). (F) Shows the Electrophoretic Mobility Shift Assay (EMSA) experiments carried out to assess the binding chromosomal passenger complex (CPC) ability to recombinant nucleosome core particles (NCPs) in the presence of DMSO, ActD, Triptolide or EtBr. Different molar concentrations (0, 25 and 50 nM) of CPC were tested. (G) The bar diagram shows the densitometric profile of the autoradiograph depicted in F. The bar represents the mean ±SD from at least three independent experiments (n.s. p>0.05, *p≤0.05 relative to control, t test).
Figure 7 with 1 supplement
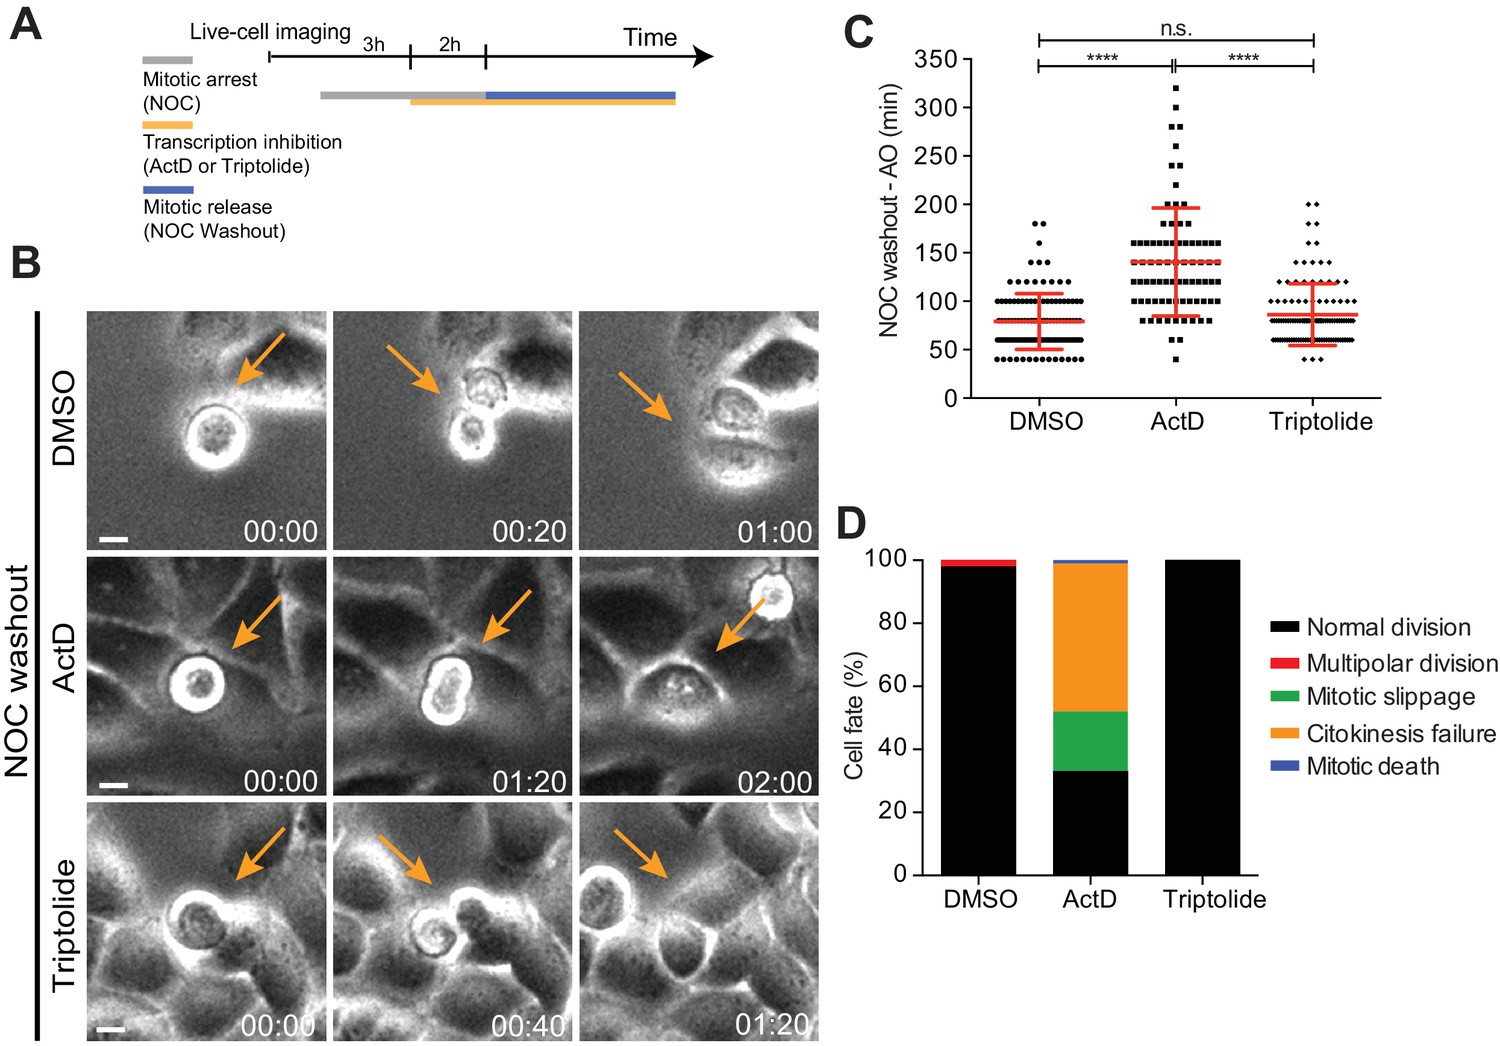
Mitotic progression and cytokinesis after nocodazole washout does not require de novo transcription.
(A) Schematic representation of the experimental protocol used to study the effect of the transcription inhibitors ActD and triptolide on mitotic progression. (B) Selected time frames from phase contrast microscopy of HeLa cells treated after the NOC washout with DMSO, ActD or Triptolide. Images were acquired every 20 min. For control (DMSO) and Triptolide (Triptolide), arrows highlight a normal mitotic progression after nocodazole washout. For ActD-treated cells (ActD), arrows highlight a cell that fails to divide after release from nocodazole arrest. Scale bar = 10 µm. Time = hr:min. (C) Scattered plot showing the mitotic duration between nocodazole washout and anaphase onset in control (DMSO), ActD and Triptolide treated HeLa cells (DMSO, 79.1 ± 28.8 min, n = 116; ActD, 140.5 ± 55.7 hr, n = 79; Triptolide, 86.2 ± 31.9 hr, n = 113, median ±SD from a pool of two technical replicates, n.s. p>0.05, ****p≤0.0001, Mann-Whitney Rank Sum Test). (D) Cell fate of mitotic HeLa cells treated with the same drugs as in 7B.
Figure 7—figure supplement 1
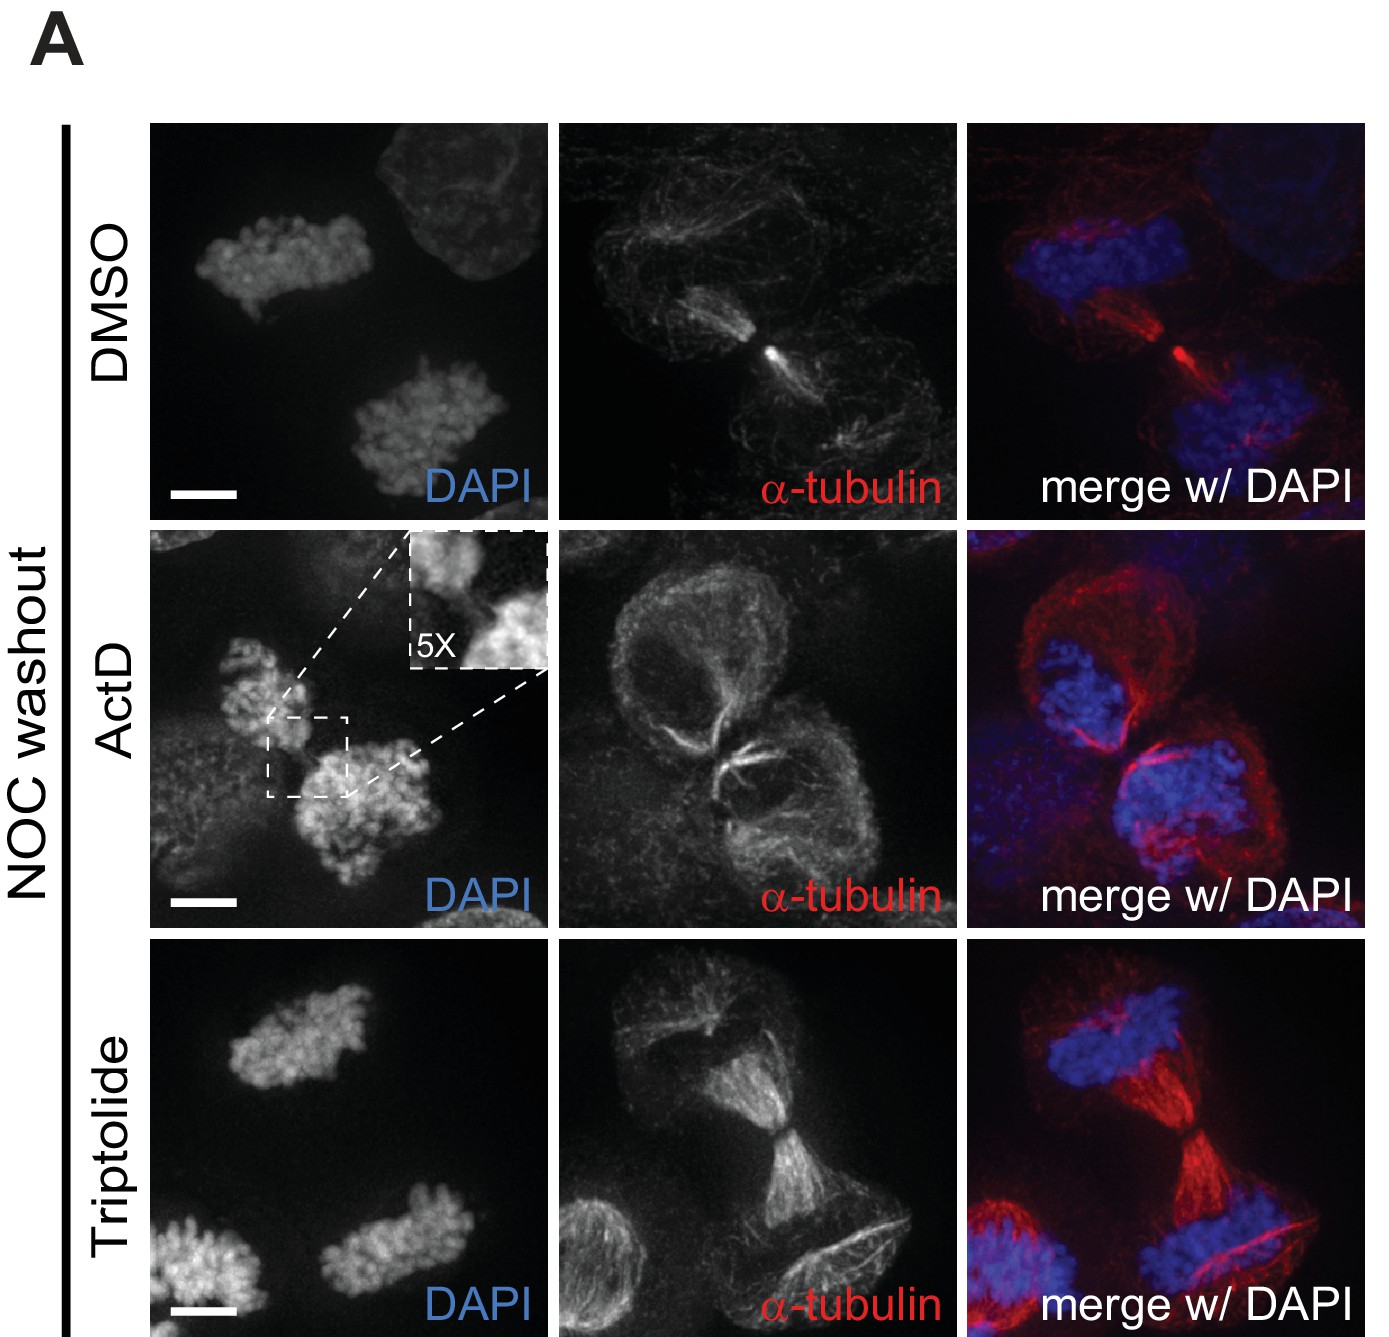
Actinomycin D promotes cytokinesis failure.
(A) Representative immunofluorescence images of HeLa cells treated with DMSO, ActD or Triptolide for 2 hr after the NOC washout with the indicated antibodies. For ActD-treated cells, arrow highlights a cell with missegregated DNA in the spindle midzone. Scale bar = 5 µm. Dashed square encompasses a DNA bridge on the midzone and respective 5x magnification.
Videos
Video 1
Phase contrast microscopy of HeLa cells treated with DMSO, Mps1 or ActD after nocodazole (NOC) treatment with (+) or without (-) MG132.
Images were acquired every 15 min. Time = h:min.
Video 2
Phase contrast microscopy of HeLa cells treated with DMSO, Triptolide or ethidium bromide after nocodazole (NOC) treatment.
Images were acquired every 15 min. Time = h:min.
Video 3
Phase contrast microscopy of HeLa cells treated with DMSO, ActD or Triptolide after NOC washout.
Images were acquired every 20 min. Time = hr:min.
Tables
Key resources table
| Reagent type | Designation | Source or reference | Identifiers | Additional information |
|---|---|---|---|---|
| Cell line (human) | HeLa parental | Provided by Y. Mimori-Kiyosue | ||
| Cell line (human) | GFP-Aurora B HeLa | Provided by M. Lampson | ||
| Cell line (human) | Cyclin B1- Venus HeLa | Provided by J. Pines | ||
| Antibody | anti-Aurora B pT232 (Rabbit Polyclonal) | Rockland Immuno chemicals | Cat#600-401-677 | IF: (1:500) |
| Antibody | anti-Aim1 (Mouse Monoclonal) | BD Biosciences | Cat#611083 | IF: (1:500) WB: (1:1,000) |
| Antibody | anti-Mad1 (Mouse Monoclonal) | Merck Millipore | Cat#MABE867 | IF: (1:500) |
| Antibody | anti-phospho- Histone H3 Ser10 (Mouse Monoclonal) | Abcam | Cat#ab14955 | IF: (1:100,000) |
| Antibody | anti-Cleaved Caspase-3 (Rabbit Polyclonal) | Cell Signaling Technology | Cat#9661 | IF: (1:1,000) |
| Antibody | anti-Centromere antibody (Human) | Fitzgerald | Cat#90C-CS1058 | IF: (1:500) |
| Antibody | anti-phospho- Mps1 Thr676 (Rabbit Polyclonal) | a gift from G. Kops | IF: (1:2,000) | |
| Antibody | anti-phospho- Histone H3 Thr3 (Mouse Monoclonal) | a gift from J. Higgins | IF: (1:1,000) | |
| Antibody | anti-HEC1 (Mouse Monoclonal) | a gift from R. Gassmann | IF: (1:2,000) | |
| Antibody | anti-KNL1 (Rabbit Polyclonal) | a gift from R. Gassmann | IF: (1:500) | |
| Antibody | anti-phosho DSN1 (Rabbit Polyclonal) | a gift from I. Cheeseman | IF: (1:1,000) | |
| Antibody | anti-phospho KNL1 (Rabbit Polyclonal) | a gift from I. Cheeseman | IF: (1:1,000) | |
| Antibody | anti-CENPA (Mouse Monoclonal) | a gift from L. Jansen | IF: (1:200) | |
| Antibody | anti-DSN1 (Mouse Monoclonal) | a gift from A. Musacchio | IF: (1:200) | |
| Antibody | Alexa 488- or 568-or 647 secondaries | Invitrogen | IF: (1:1,000) | |
| Antibody | anti-Survivin (Rabbit Polyclonal) | Novus Biologicals | Cat#NB500-201 | WB: (1:1,000) |
| Antibody | anti-Borealin (Rabbit Polyclonal) | a gift from R. Gassmann | WB: (1:1,000) | |
| Antibody | anti-α-tubulin clone B-512 (Mouse Monoclonal) | Sigma-Aldrich | Cat#T5168 | WB: (1:5,000) |
| Antibody | anti-RNA Pol II S2 (Rabbit Polyclonal) | Abcam | Cat#ab5095 | WB: (1:1,000) |
| Antibody | anti-mouse or anti-rabbit | Jackson Immuno Research | WB: (1:5,000) | |
| Chemical compound, drug | Nocodazole | Sigma-Aldrich | Cat#M1404 | 1 μM |
| Chemical compound, drug | MG132 | EMD Millipore | Cat#133407-82-6 | 5 μM |
| Chemical compound, drug | Mps1-IN-1 | Provided by N. Gray | 10 μM | |
| Chemical compound, drug | RO3306 | Roche | Cat#SML0569 | 10 μM |
| Chemical compound, drug | Actinomycin D | Sigma-Aldrich | Cat#A9415 | 8 μM |
| Chemical compound, drug | α-amanitin | Sigma-Aldrich | Cat#A2263 | 2 μM |
| Chemical compound, drug | Triptolide | Sigma-Aldrich | Cat#T3652 | 1 μM |
| Chemical compound, drug | Cycloheximide | Sigma-Aldrich | Cat#01810 | 35.5 μM |
| Chemical compound, drug | Ethidium Bromide | Sigma-Aldrich | Cat#E8751 | 25 μM |
| Chemical compound, drug | ZM447439 (Aurora B inhibitor) | Selleckchem.com | Cat#S1103 | 3.3 μM |
Additional files
-
Transparent reporting form
- https://doi.org/10.7554/eLife.36898.020
Download links
A two-part list of links to download the article, or parts of the article, in various formats.
Downloads (link to download the article as PDF)
Open citations (links to open the citations from this article in various online reference manager services)
Cite this article (links to download the citations from this article in formats compatible with various reference manager tools)
Mitotic progression, arrest, exit or death relies on centromere structural integrity, rather than de novo transcription
eLife 7:e36898.
https://doi.org/10.7554/eLife.36898


