Topography of cancer-associated immune cells in human solid tumors
- National Center for Tumor Diseases, University Hospital Heidelberg, Germany
- German Cancer Consortium, Germany
- German Cancer Research Center, Germany
- University Hospital RWTH Aachen, Germany
- University Medical Center Mannheim, Heidelberg University, Germany
- Centre for Cancer Research and Cell Biology, Queen’s University Belfast, United Kingdom
- University Hospital Heidelberg, Germany
- Tissue Bank of the National Center for Tumor Diseases, Germany
- German Cancer Research Center and National Center for Tumor Diseases, Germany
- German Cancer Research Centre, Germany
- University Cancer Center Hamburg, University Medical Center Hamburg-Eppendorf, Germany
Figures
Figure 1 with 1 supplement
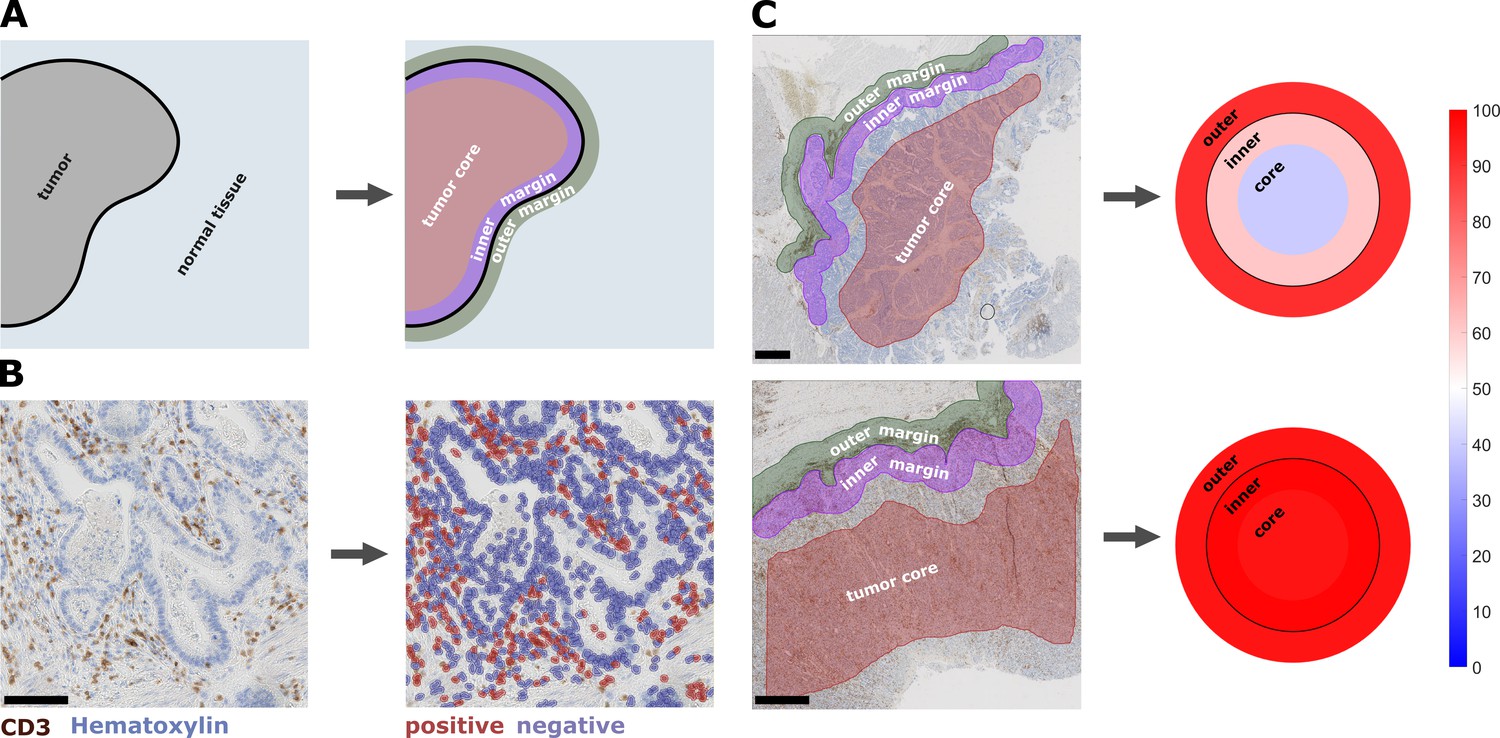
Semiautomatic image analysis defines immune cell topography.
(A) Manual delineation of three compartments: outer 500 µm invasive margin, inner 500 µm invasive margin, tumor core. (B) Example of automatic cell detection in a CD3-stained gastric carcinoma slide. Left: original image, right: after cell detection and classification. (C) Cell counts in all three compartments can be used to create a ‘target plot’ (visualization resembling a shooting target) where the color of each compartment corresponds to the percentile-normalized cell density. Here, two examples of CD3-stained gastric carcinoma tissue slides are shown. The upper sample has an immune-excluded phenotype while the lower sample has an inflamed phenotype. Unit on the color scale: percentile-normalized cell density. Scale bar in B is 100 µm, scale bars in C are 1 mm.
Figure 1—figure supplement 1
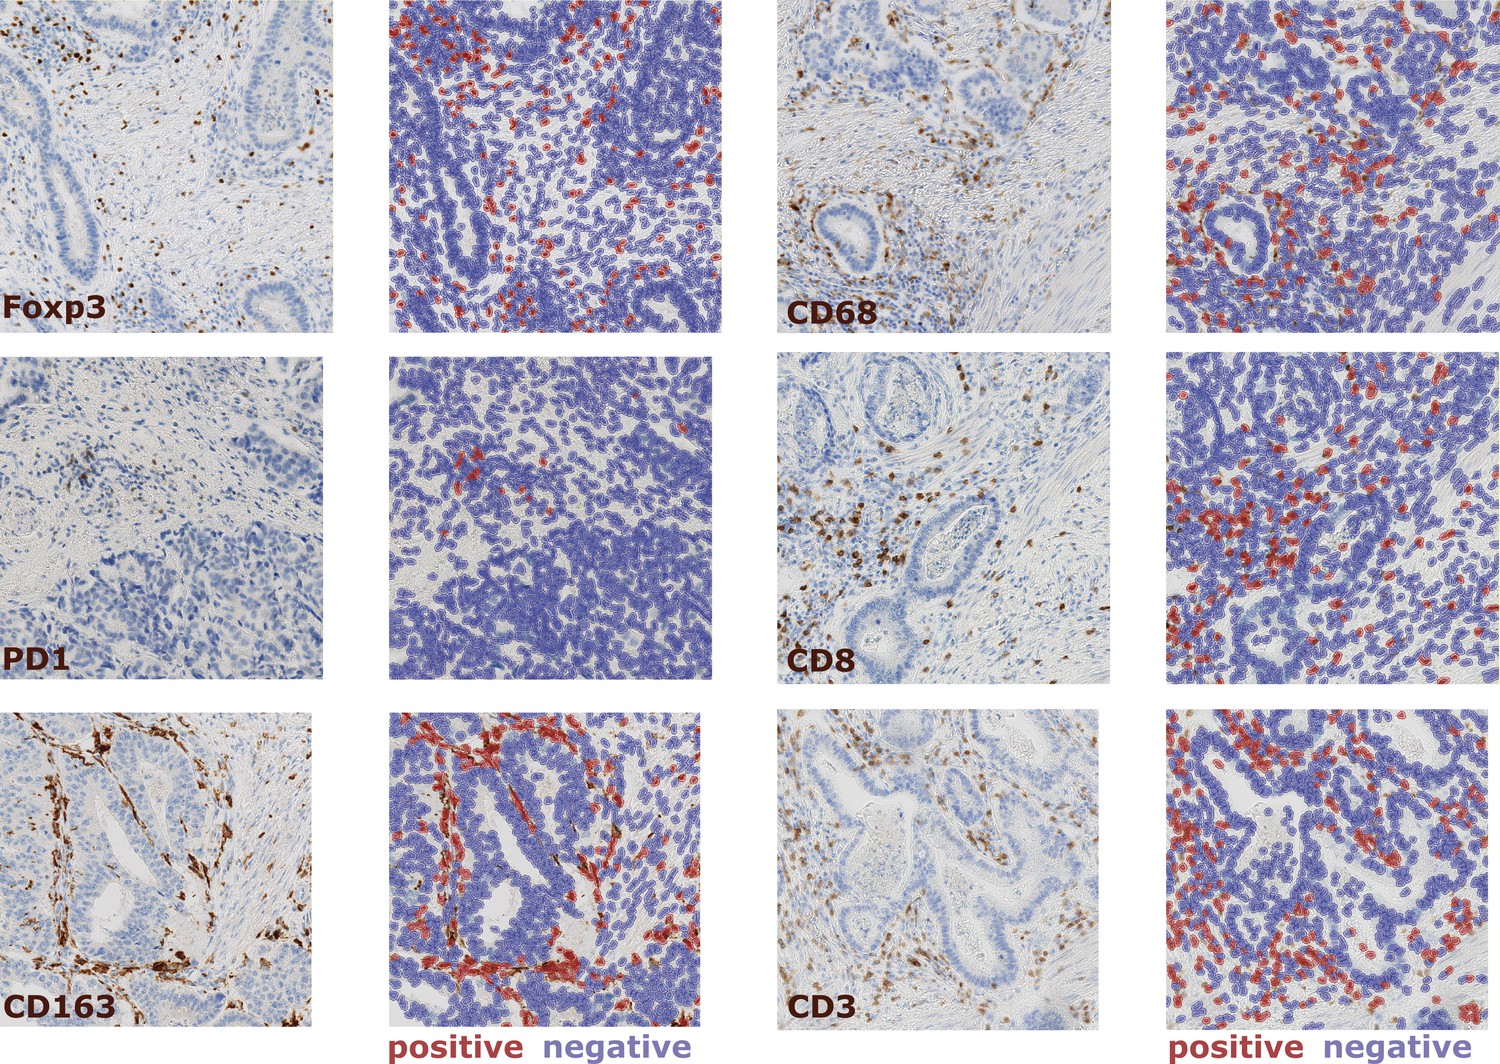
Example images for cell count in all six immunostains.
For all slides with sufficient sample availability, we performed immunostaining for Foxp3, CD68, PD1, CD8, CD163 and CD3. QuPath was used for automatic cell detection and classification. Here, example images are shown for each staining type (20x magnification) along with the result of the cell segmentation.
Figure 2 with 5 supplements
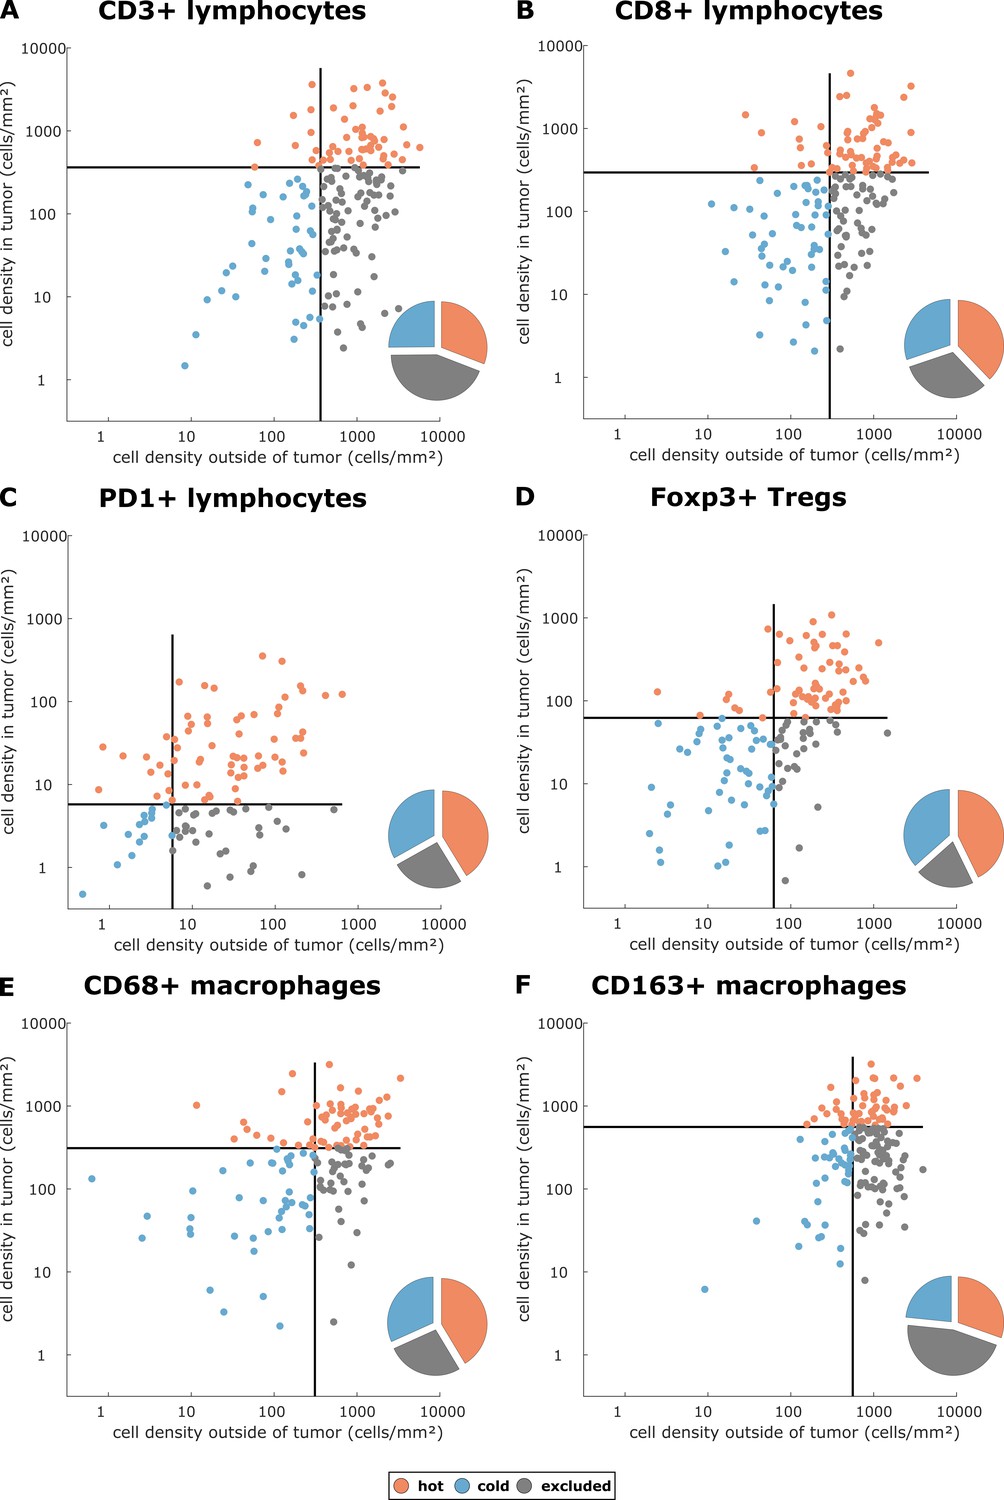
Cell densities in the tumor core and in the outer invasive margin in the pan-cancer cohort.
Raw cell densities are plotted for each cell type and both major compartments. Gray lines indicate the median density for this cell type. Split at the median, tumors can be classified as cold, hot or immune excluded for all immune cell types. However, the scatter plot shows that for all immune cell types, there is no natural clustering into these phenotypes – the phenotypes blend into each other.
Figure 2—figure supplement 1
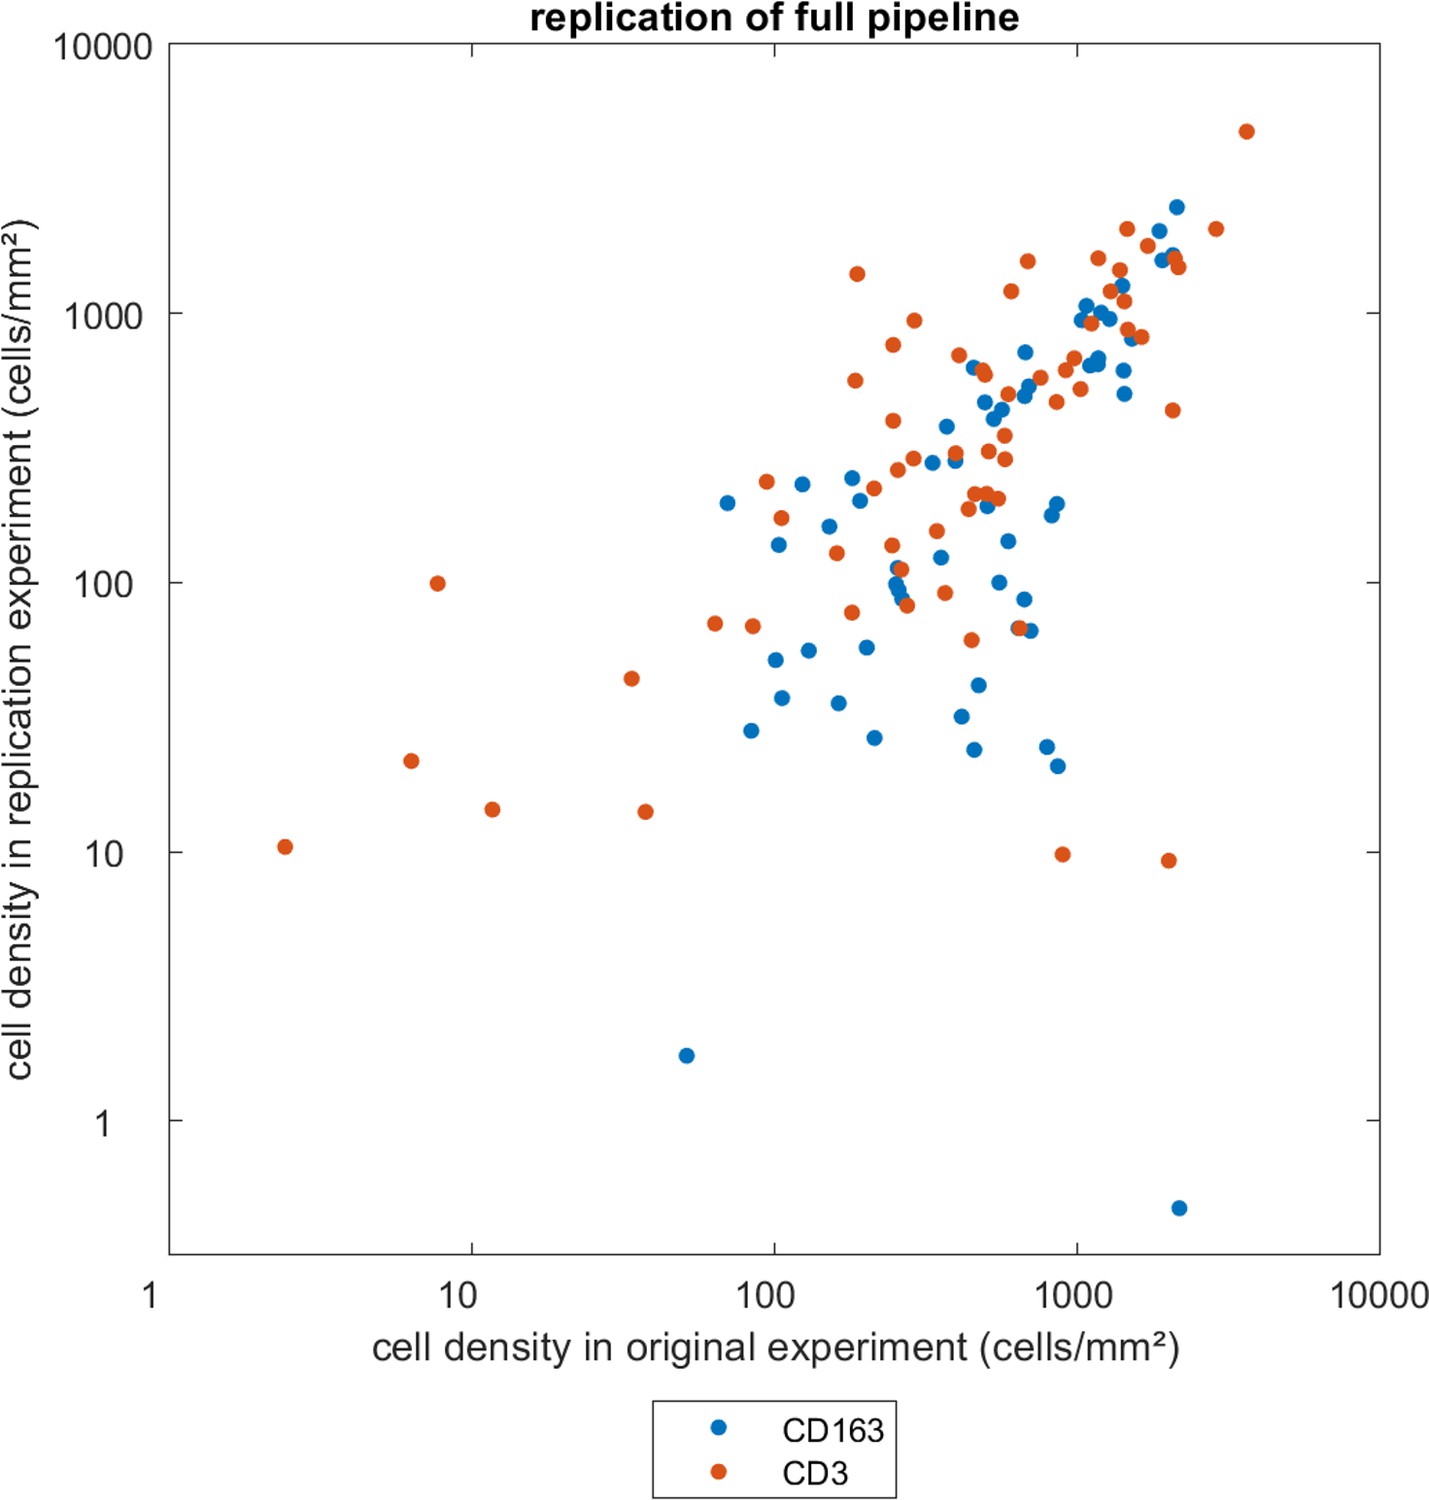
Replication experiment for the full tissue analysis pipeline.
60 tissue specimens were randomly selected and stained for CD3 or CD163, scanned and analyzed independently and by blinded observers. The resulting cell counts were similar to the original analysis. In this scatter plot, each data point corresponds to one spatial compartment in one patient. There are two spatial compartments per patient. Pearson’s correlation coefficient is 0.74.
Figure 2—figure supplement 2
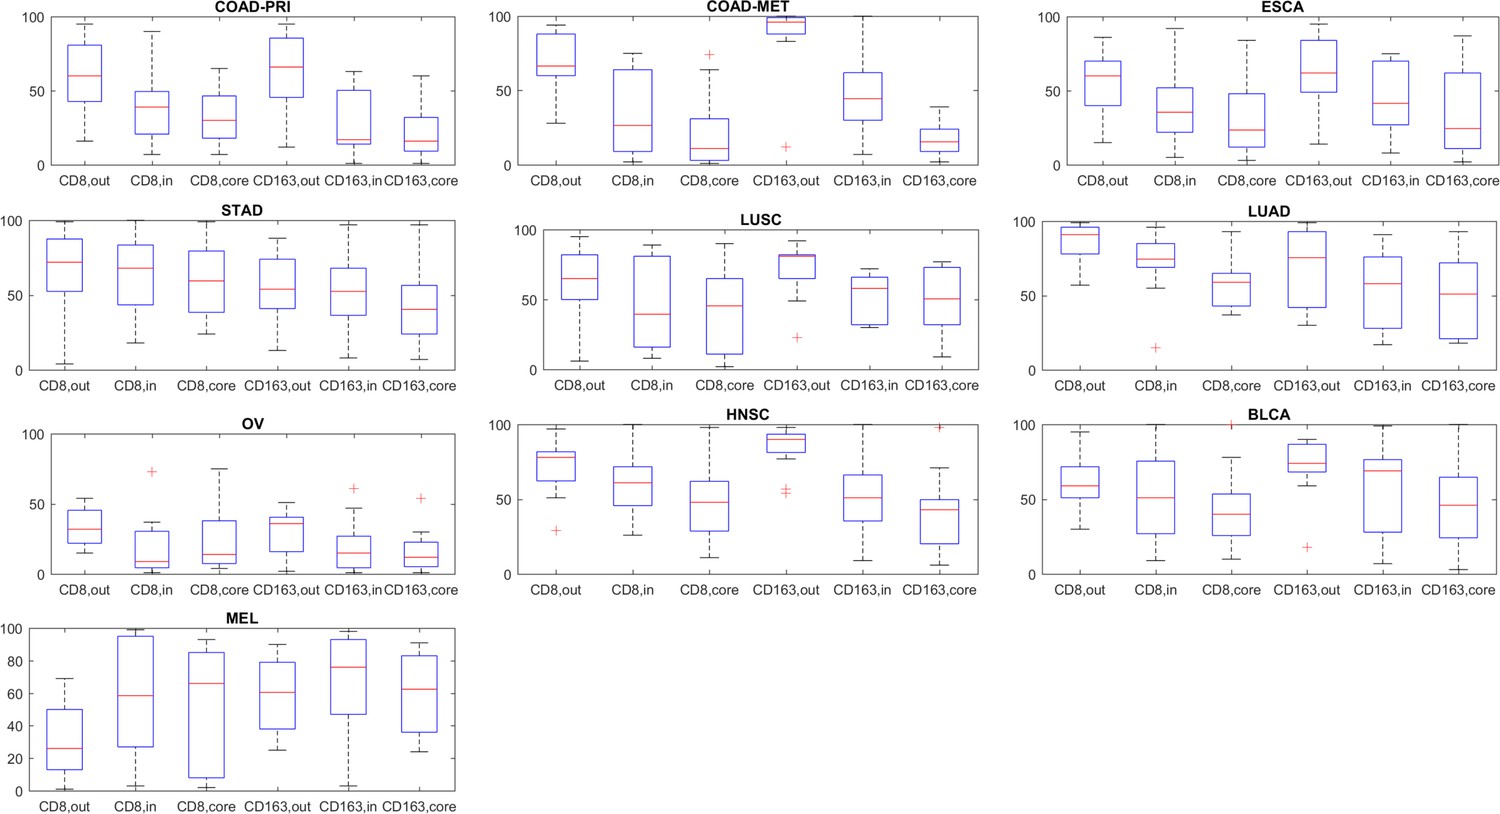
Normalized immune cell counts for cytotoxic T lymphocytes (CD8) and pro-tumor macrophages (CD163).
For all three compartments outer invasive margin [out], inner invasive margin [in] and tumor core [core], normalized cell density is shown. In accordance with previous reports, lymphocytes and macrophages are on average more abundant around the tumor in colorectal cancer primary tumors (COAD-PRI) and liver metastases (COAD-MET), the opposite was seen in melanoma (MEL). However, these average values might obscure underlying patterns that are independent of tumor type, highlighting the need for more detailed analysis of spatial immunophenotypes.
Figure 2—figure supplement 3
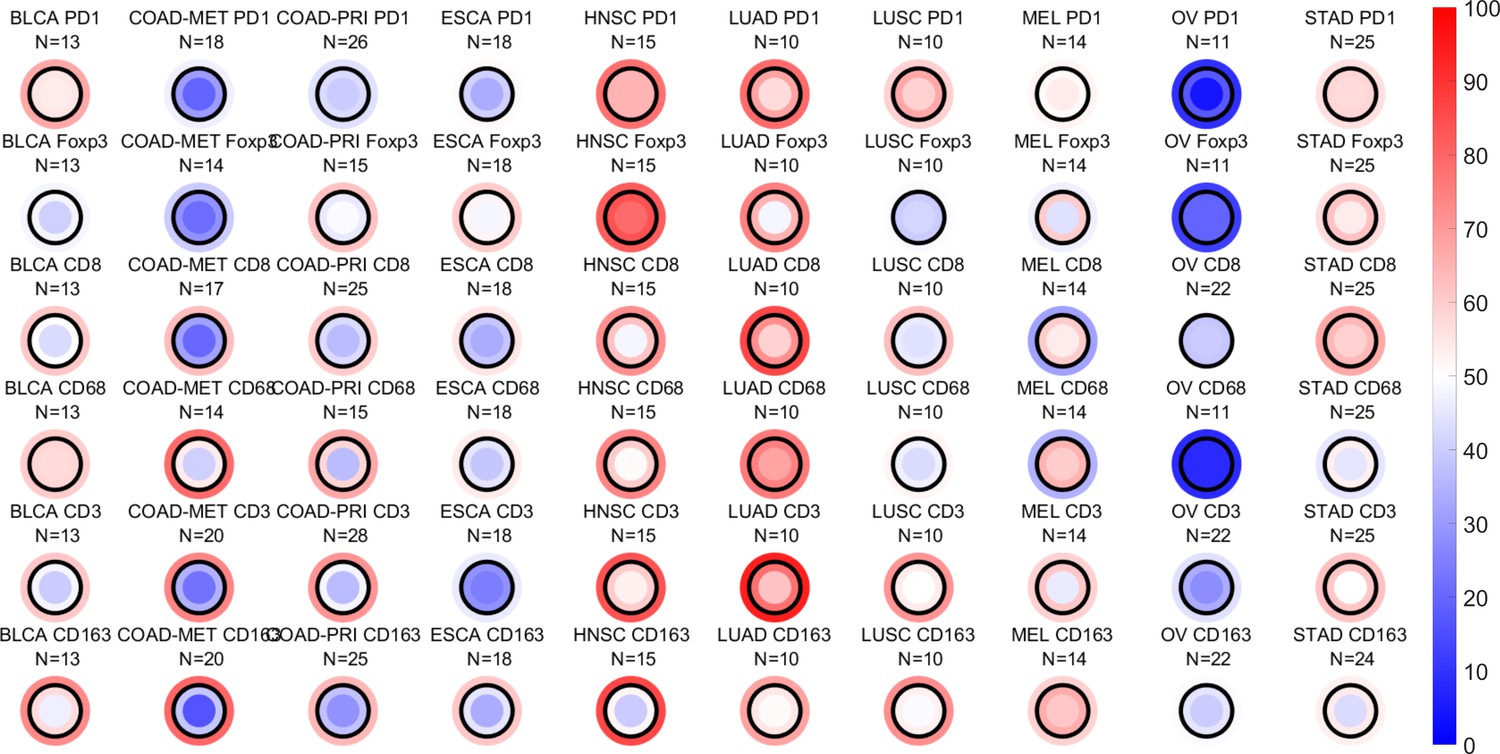
Average cell density percentile score for all compartments in ten tumor entities and six immunostains.
For all tumor types and all immunostains, the average target plot is shown based on the mean value of all tumor samples in each group.
Figure 2—figure supplement 4
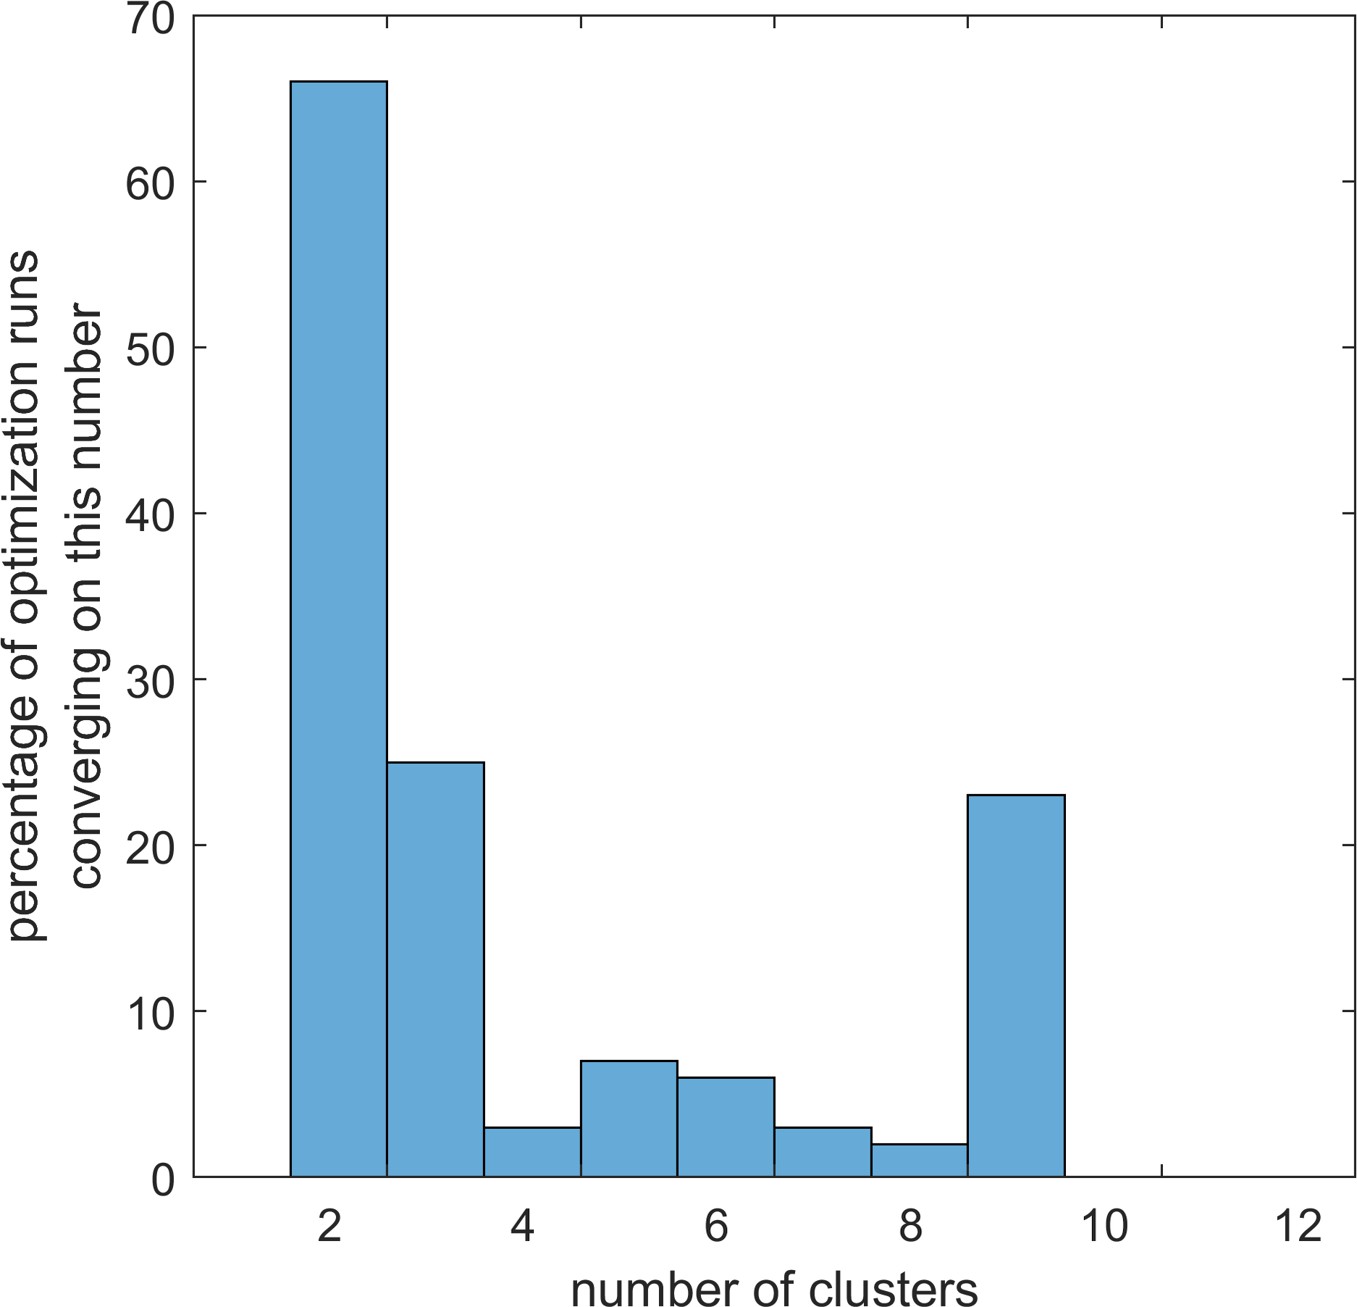
Optimal number of lymphocyte topography clusters arising in repeated optimization runs with different methods.
Using lymphocyte densities in three regions in tumors from 168 cancer patients, we looked for the optimal number of clusters (1 to 12) to group the topography phenotypes. We used CD3+ and CD8+ cell densities separately and together. We used three clustering methods with three loss functions each. The vast majority of clustering runs converged on two clusters which mostly corresponded to high and low overall cell densities.
Figure 2—figure supplement 5
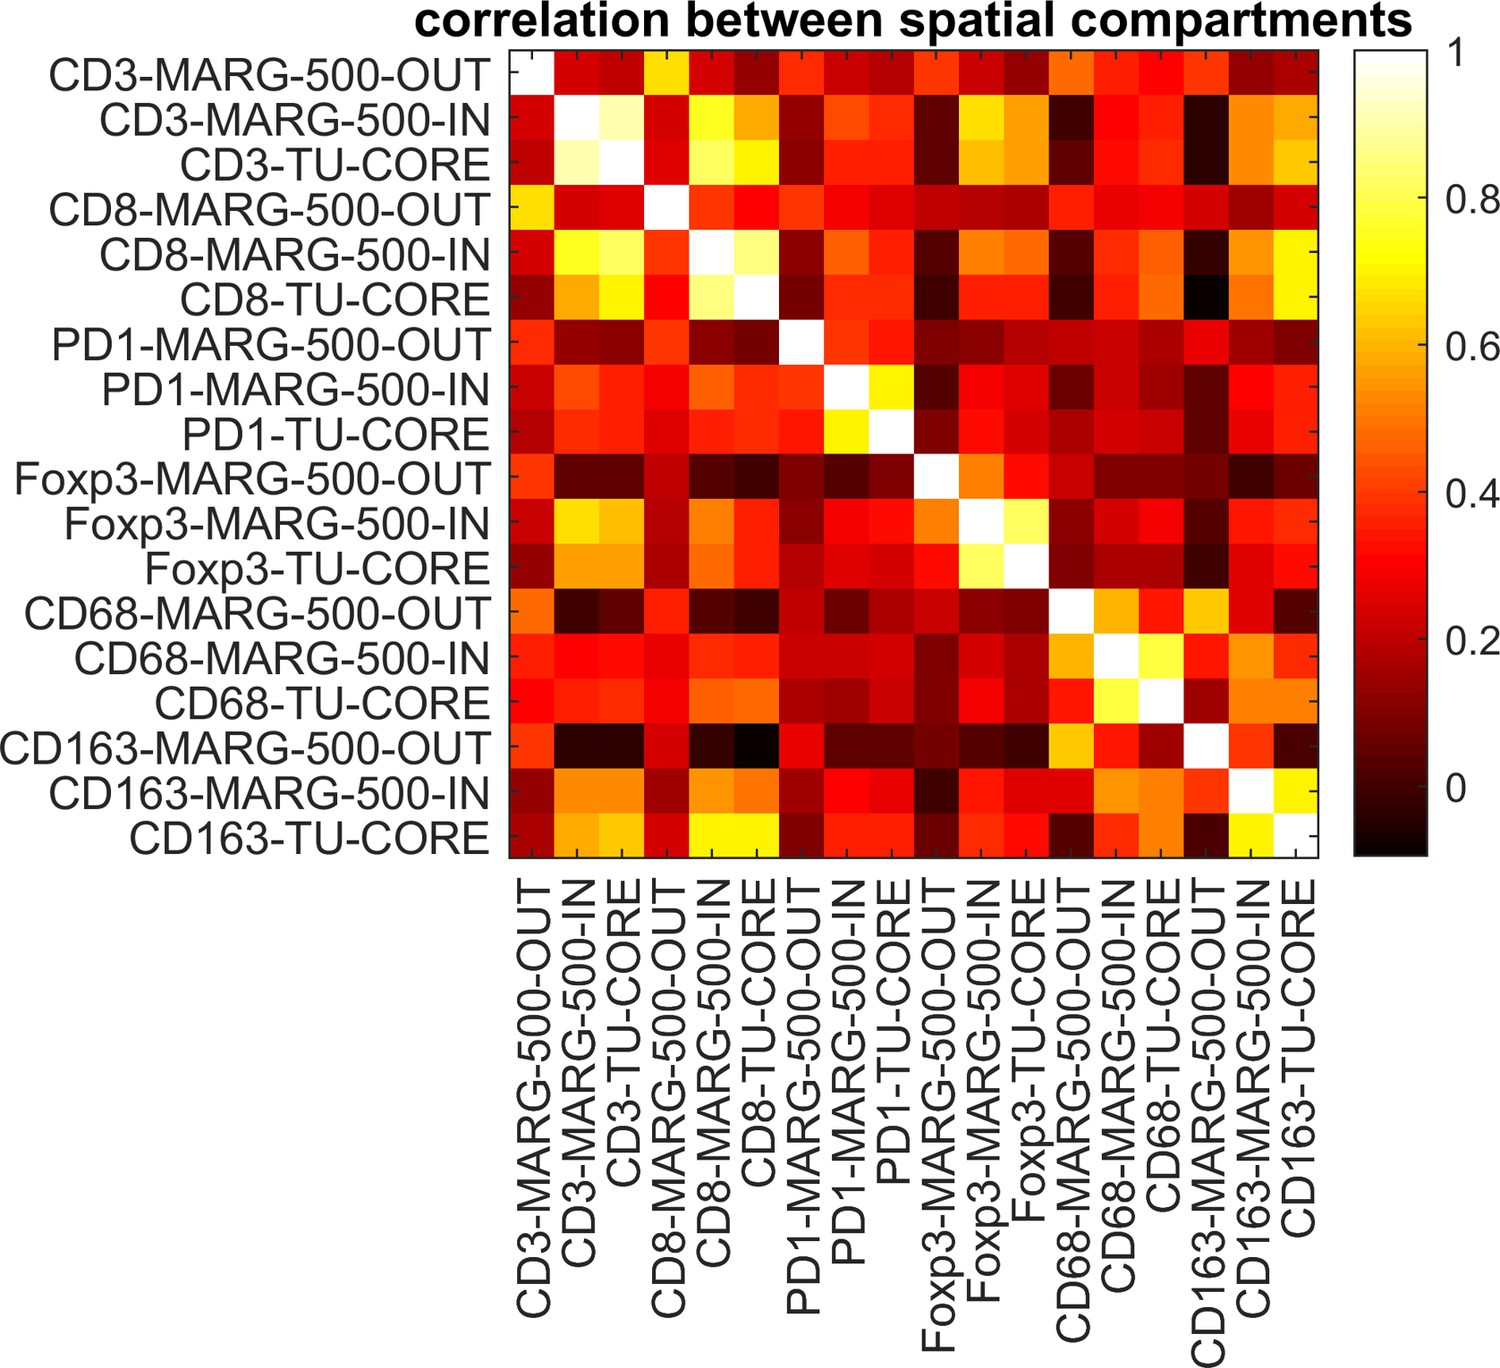
Correlations between cell densities in different spatial compartments.
Pearson’s correlation coefficient is shown for all pairwise comparisons between cell densities in three spatial compartments in tumors from N = 144 cancer patients. Cell densities in the ‘inner invasive margin’ (MARG-500-IN) are highly correlated to cell densities in the ‘tumor core’ (TU-CORE) for all six immune cell types. The ‘outer invasive margin’ (MARG-500-OUT) is less well correlated to the other compartments. This provides a rationale to reduce the complexity of the data set and use only ‘MARG-500-OUT’ and ‘TU-CORE’ in further steps of the analysis.
Figure 3
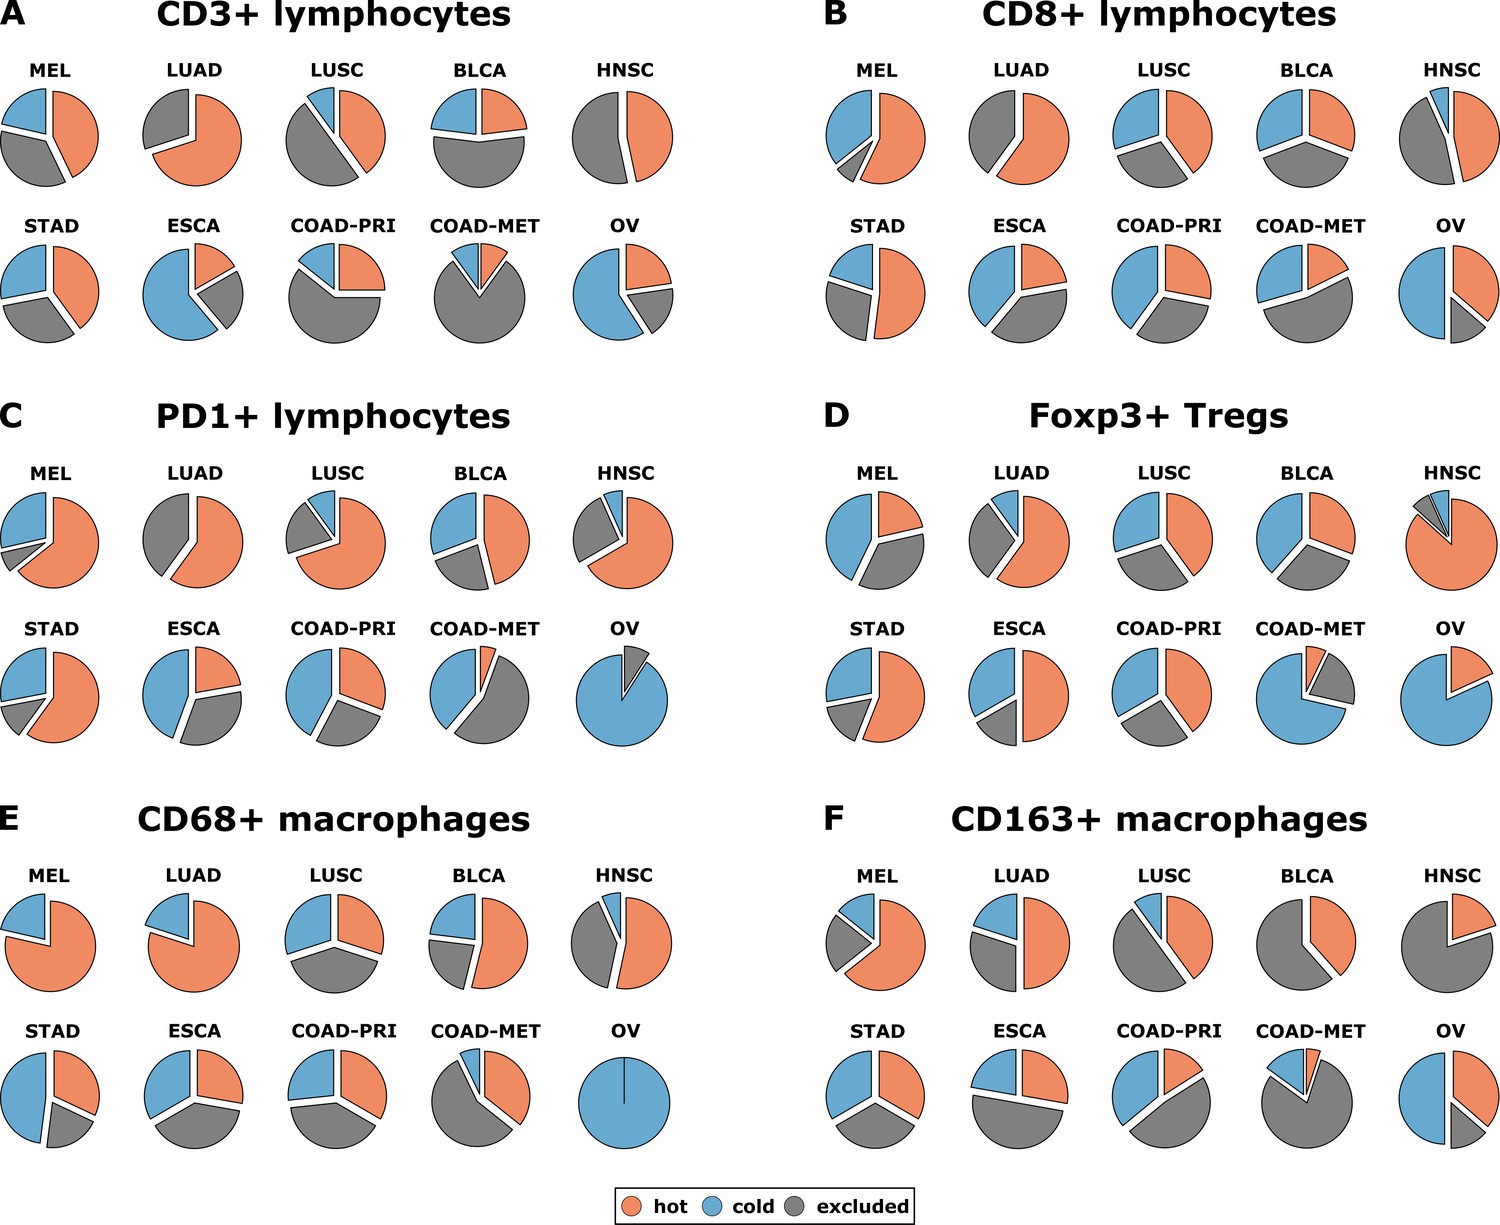
Distribution of immune topography phenotypes among different tumor types in the pan-cancer cohort.
Analysis for all six immune cell types (A–F) and for all analyzed tumor types (MEL = melanoma, LUAD = lung adeno, LUSC = lung squamous, BLCA = bladder, HNSC = head and neck squamous, STAD = stomach adeno, ESCA = esophageal squamous, COAD-PRI = colorectal primary, COAD-MET = colorectal liver metastasis, OV = ovarian). These data comprise all N = 965 tissue slides from N = 177 patients. MEL through HNSC are to some degree sensitive to approved immunotherapies and predominantly have ‘hot’ phenotypes for most immune cells. However, among these tumor types, different phenotypes for immunosuppressive immune cells (Foxp3+ regulatory T-cells [Tregs]) and CD163+ macrophages prevail.
Figure 4
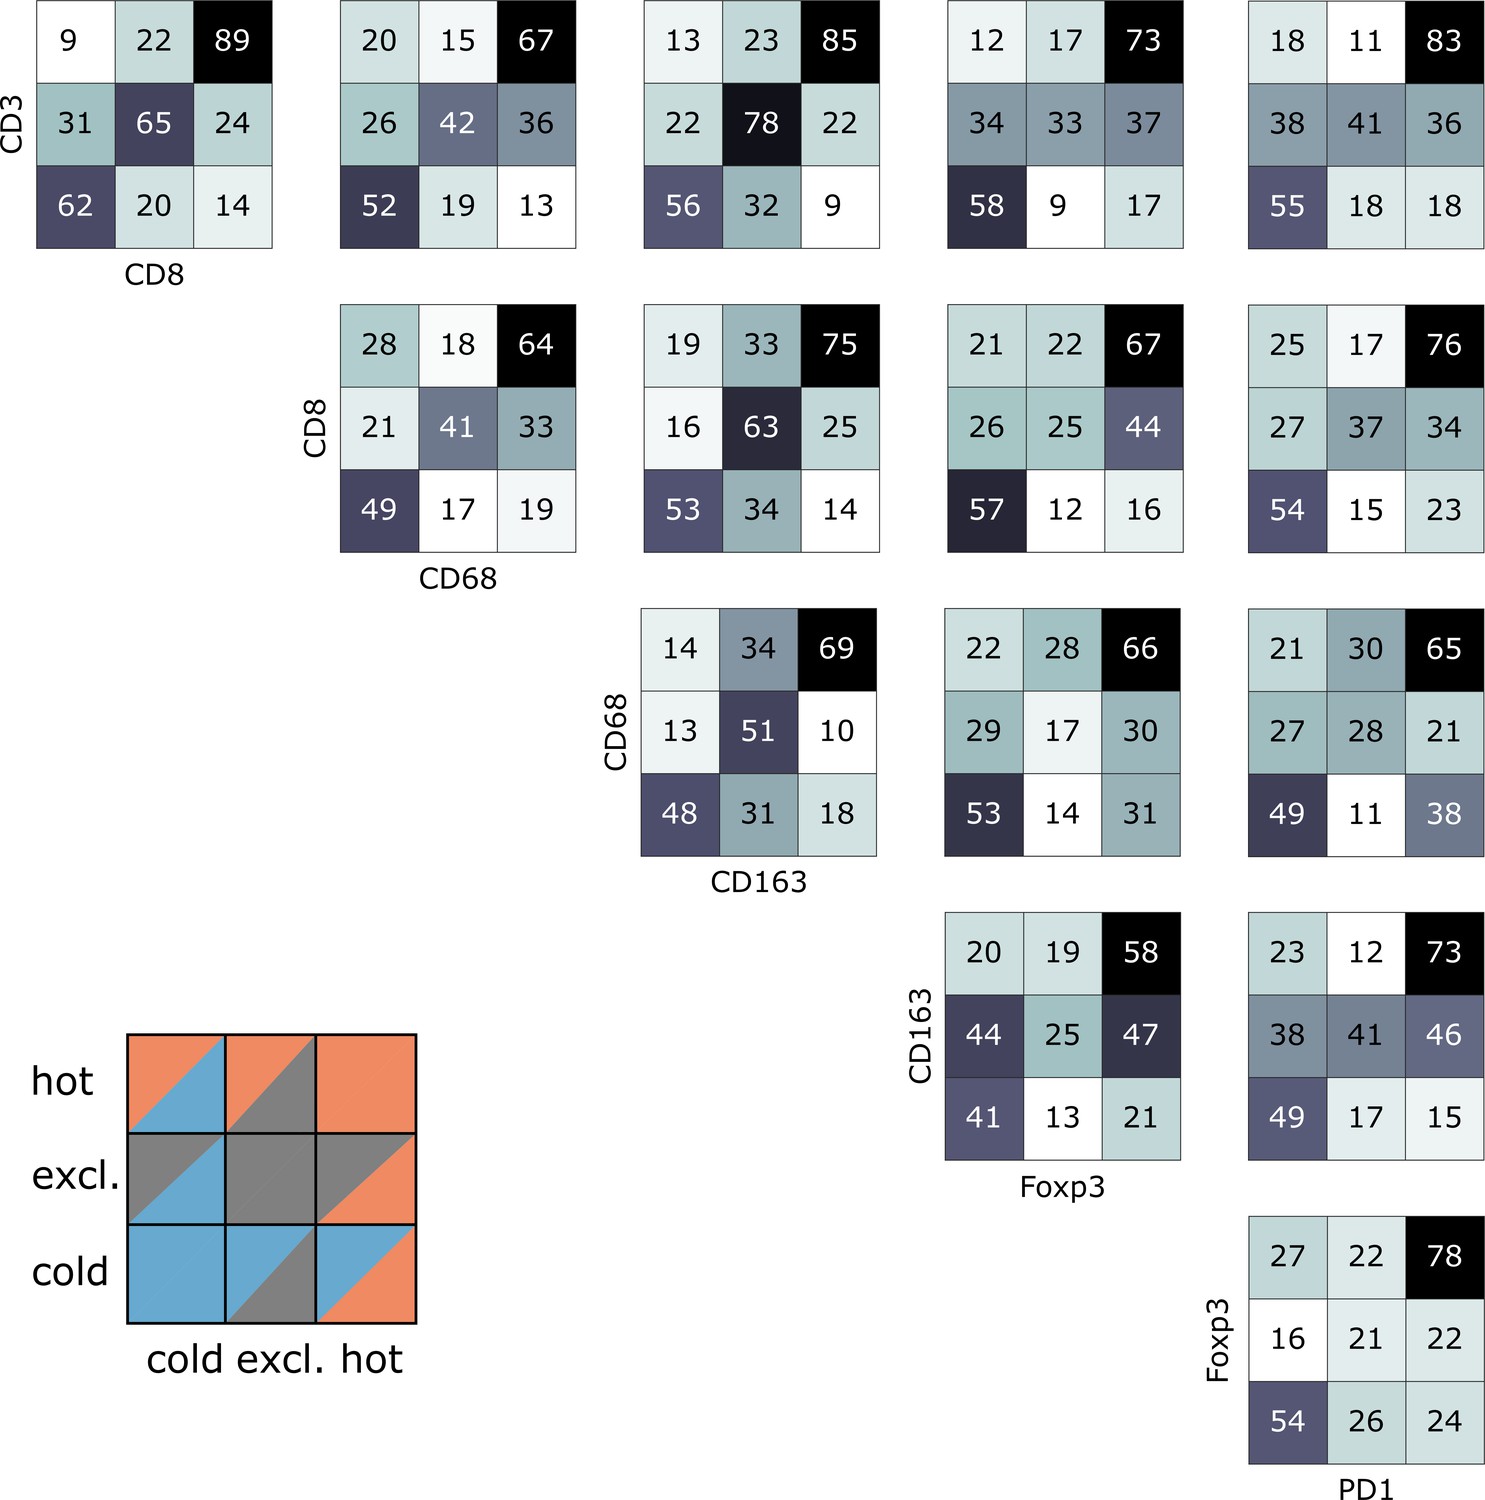
Pairwise analysis of immune phenotypes for all immune cell types in the pan-cancer cohort.
For all tissue samples in all tumor types, a pairwise classification into cold-excluded-hot was done for all immune cell types. This analysis was based on the median cutoff for high and low cell densities. Absolute numbers of tumor are given, black marks the most abundant and white the least abundant group. For some pairwise comparisons such as CD3 and CD8 cells (top left corner), there is a high concordance between the phenotypes. For other comparisons such as Foxp3 and CD163 cells, phenotypes are mostly discordant.
Figure 5
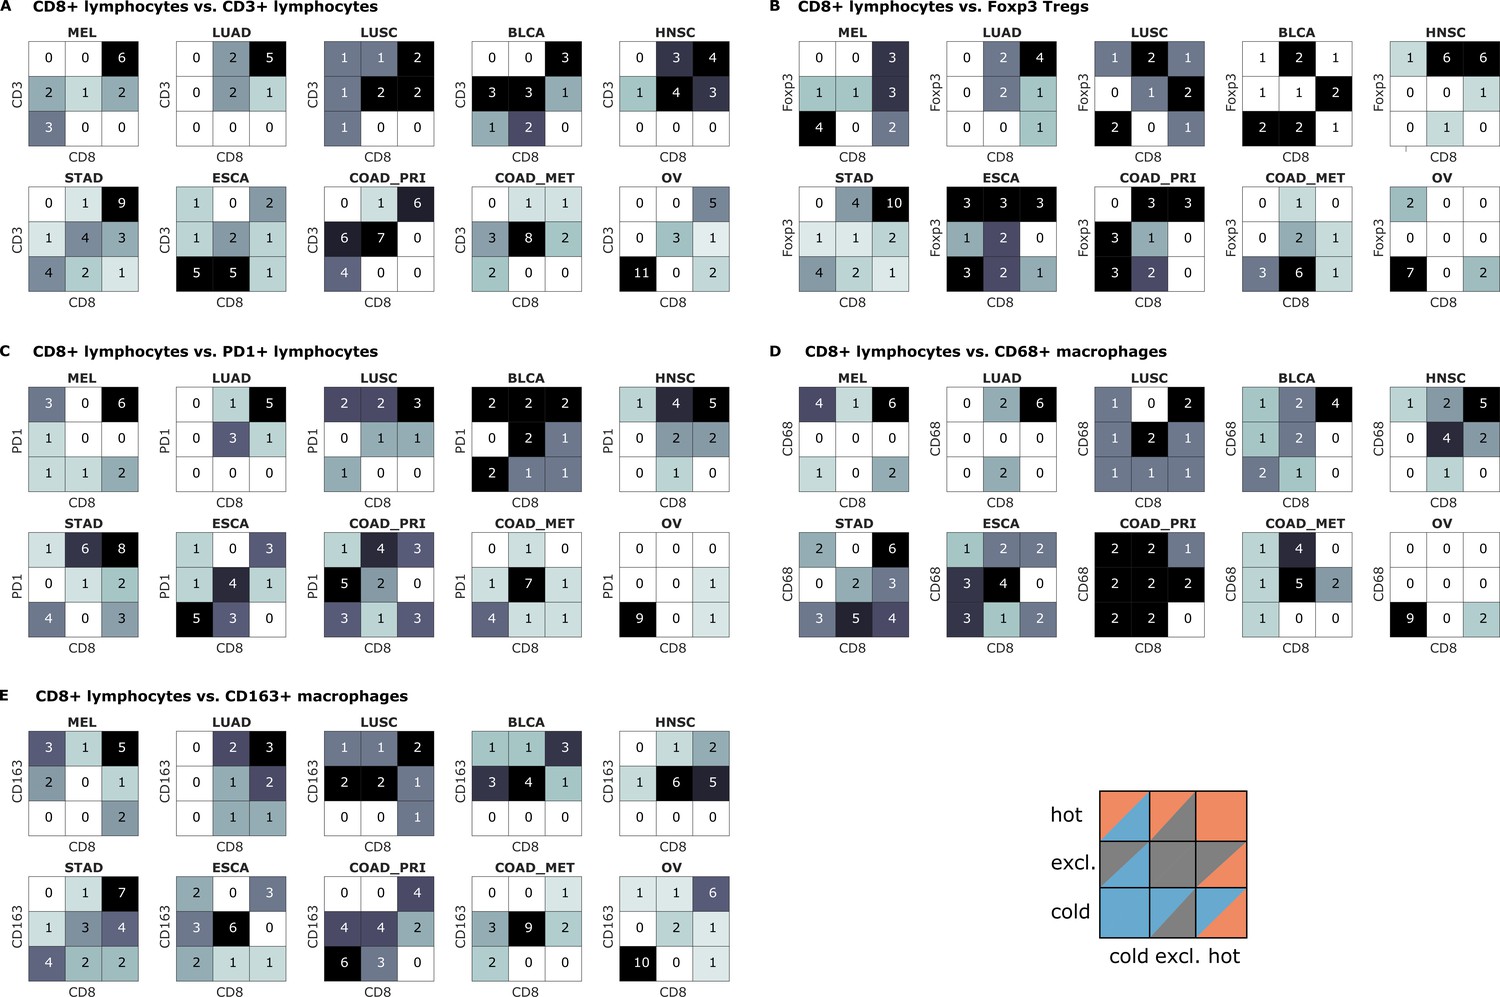
Bivariate immune phenotypes for each tumor type in the pan-cancer cohort.
We analyzed the concordance between hot-cold-excluded topographies for CD8+ lymphocytes and all other cell types for each tumor type separately. Absolute numbers of patients assigned to each of nine phenotypes are overlaid on the heat map. For some cell types and some tumor types, immune topographies are concordant. This suggests that in these settings, a detailed analysis of multiple immune cell types in biomarker studies is not necessary. On the other hand, some cell types in other tumor entities (such as CD8+ lymphocytes and CD68+ macrophages in panel (D) show a high discordance in multiple tumor types. This suggests that measuring one of these cell types only may not be informative enough for biomarker studies.
Figure 6
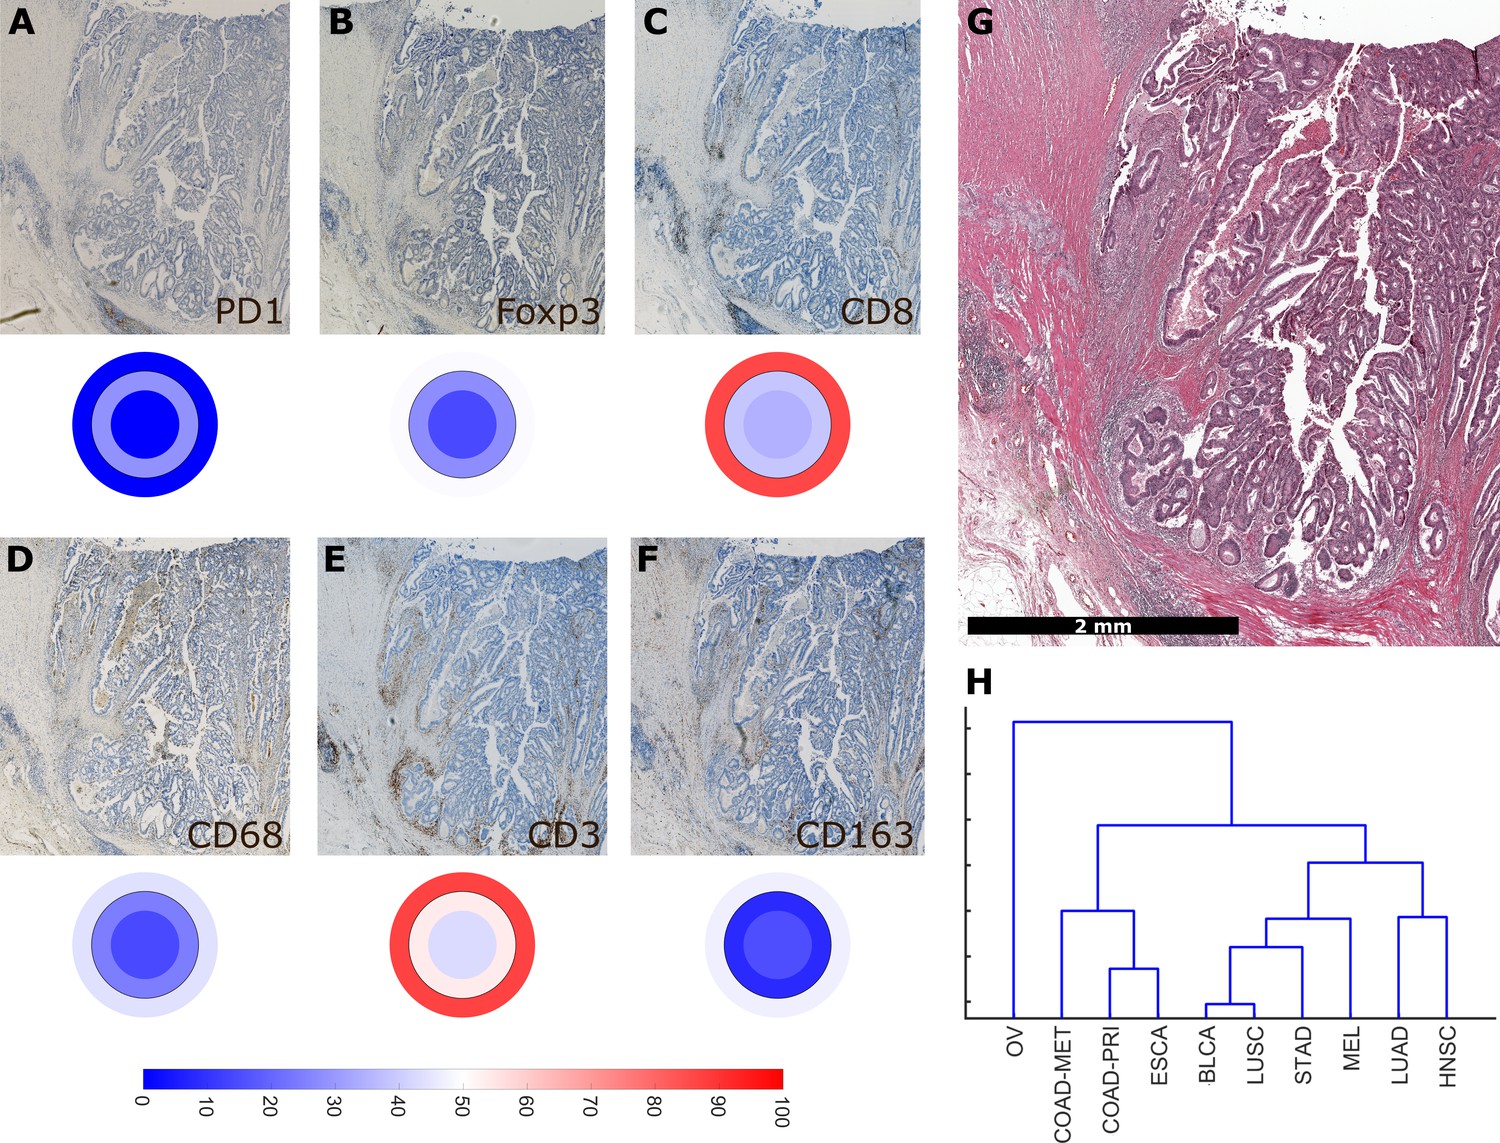
Overall similarity between tumor entities based on full immune topography.
Hierarchical clustering based on all normalized cell densities of (A) PD1+exhausted lymphocytes; (B) Foxp3+regulatory T cells; (C) CD8+cytotoxic T lymphocytes; (D) CD68+monocytes/macrophages; (E) CD3+lymphocytes and (F) CD163+pro tumor macrophages. Unit on the color scale: percentile-normalized cell density. (G) corresponding H & E image of the colorectal cancer sample used in this figure. (H) Hierarchical clustering of tumor types (N = 144 total patient samples).
Figure 7
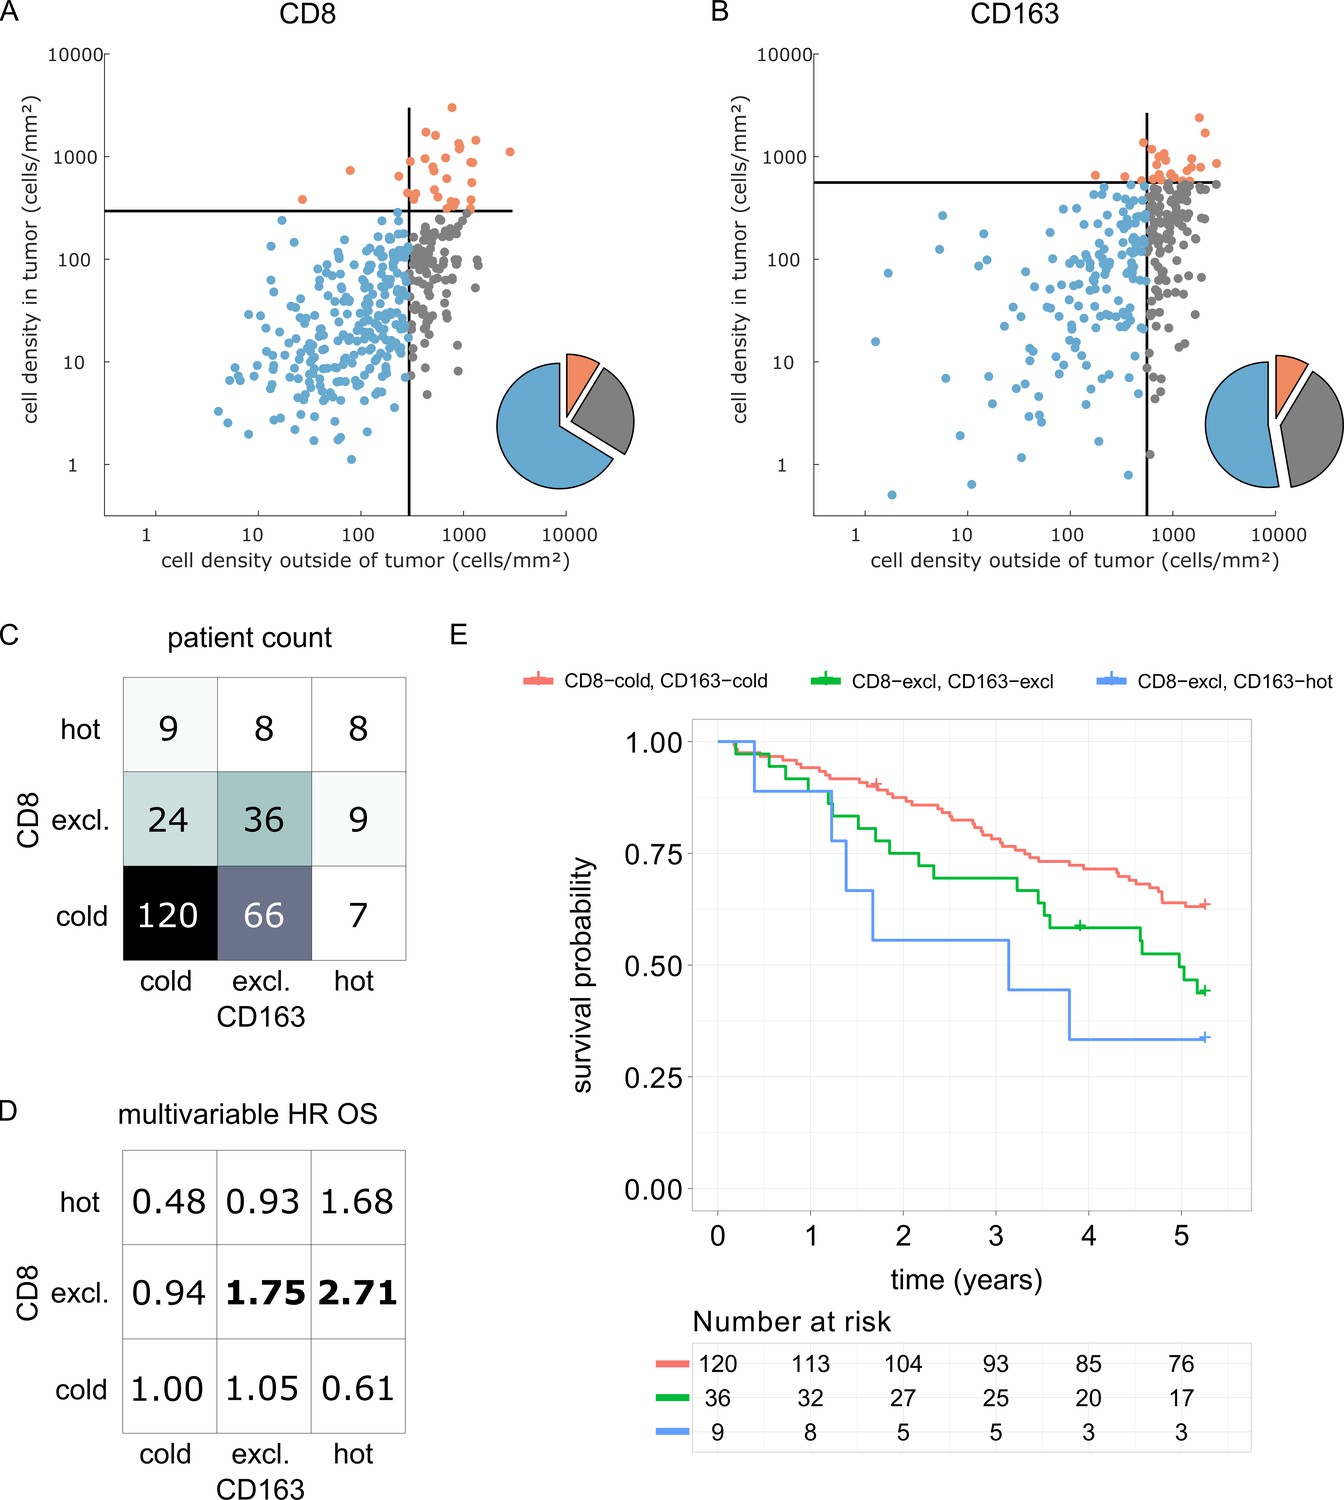
Prognostic value of the myeloid-lymphoid topography in primary colorectal cancer (CRC) in the DACHS cohort.
In a validation cohort of N = 287 colorectal cancer patients (N = 286 with follow-up data) from the DACHS study, CD8 and CD163 staining of the primary surgical sample was correlated to clinical outcome (overall survival) using the cutoffs from the pan-cancer cohort. (A) As in the CRC subgroup in the pan-cancer cohort, CD8-cold was the most prevalent phenotype, followed by CD8-excluded. (B) A similar distribution of phenotypes was observed for CD163+ macrophages. (C) In the bivariate analysis for CD8 and CD163, most patients had cold and excluded phenotypes for both antigens. (D) For each of these nine phenotypes, the hazard ratio (HR) for death of any cause (inverse overall survival, OS) was derived from a multivariable Cox proportional hazard model (covariates UICC stage, age and sex). Bold HR indicates statistically significant findings with p<0.05. Bivariate analysis of both antigens is essential for risk stratification as CD8 and CD163 phenotypes show non-trivial interaction. Raw data for panel D are shown in Supplementary file 5. (E) The Kaplan-Meier plots for the reference groups (CD8-cold CD163 cold) and the two significant groups (‘CD8-excl., CD163 excl’ and ‘CD8 excl., CD163 hot’) show significant differences in overall survival. These differences are not captured by univariate, but only by this bivariate stratification system. Log rank p-value=0.019.
Tables
Key resources table
| Reagent type (species) or resource | Designation | Source/Reference | Identifier | Additional information |
|---|---|---|---|---|
| Software, algorithm | QuPath v0.1.2 | Bankheadet al. | DOI: 10.1038/s41598-017-17204-5 | - |
| Antibody | Anti-human CD3 | Leica Novocastra | RRID:AB_563544 | Dilution 1:100 |
| Antibody | Anti-human CD8 | Leica Novocastra | RRID:AB_442068 | Dilution 1:50 |
| Antibody | Anti-human Foxp3 | eBioscience | RRID:AB_467555 | Dilution 1:100 |
| Antibody | Anti-human CD163 | BioRad | RRID:AB_2074540 | Dilution 1:500 |
| Antibody | Anti-human CD68 | Thermo Fisher Scientific | RRID:AB_720547 | Dilution 1:2000 |
| Antibody | Anti-human PD1 | Abcam | RRID:AB_881954 | Dilution 1:50 |
Additional files
-
Supplementary file 1
Clinical characterization of the DACHS cohort.
This table lists summary statistics of all relevant clinico-pathological features of the DACHS cohort.
- https://doi.org/10.7554/eLife.36967.015
-
Supplementary file 2
List of all image analysis parameters.
In this table, all parameters for cell detection and classification using the open source software QuPath are listed. Two sets of parameters are distinguished: ‘DAB’ (diaminobenzidine), used for blue-brown staining, and ‘Red’, used for blue-red staining in melanoma. OD = optical density. All parameters were used in the pan-cancer cohort unless labeled as ‘DACHS’, in which case they were used in the DACHS cohort.
- https://doi.org/10.7554/eLife.36967.016
-
Supplementary file 3
List of all samples and all measurement values of the pan-cancer cohort.
In this table, we report all raw measurements for all samples that were used in this study. Column names are: ‘class’ (tumor type as listed above), ‘patient’ (patient pseudonym), ‘antigen’ (antigen for immunostain), ‘TU_CORE_cells_mm2’ (number of positively stained cells per square millimeter in the tumor core), ‘MARG_500_IN_cells_mm2’ (number of positively stained cells per square millimeter in the inner invasive margin, defined as ranging 0–500 µm to the inside from the tumor edge), ‘MARG_500_OUT_cells_mm2’ (number of positively stained cells per square millimeter in the inner invasive margin, defined as ranging 0–500 µm to the outside from the tumor edge).
- https://doi.org/10.7554/eLife.36967.017
-
Supplementary file 4
List of all cutoff values for all cell types.
On the full data set of N = 965 tissue slides from N = 177 patients in 10 tumor types, we calculated the median cell density for each antigen, taking the compartments ‘outer invasive margin’ and ‘tumor core’ into account. These median values were subsequently used as cutoff values for low and high cell densities which were then used to define hot, cold and excluded phenotypes.
- https://doi.org/10.7554/eLife.36967.018
-
Supplementary file 5
Continuous cell densities of CD8+ and CD163+ cells are not significantly associated with overall survival in colorectal cancer.
A multivariable Cox proportional hazard model was fitted to all variables listed in this table. N = 286 CRC patients in the DACHS cohort, number of events = 108, significance codes (sig): *<0.05, **<0.01, ***<0.001. HR = hazard ratio, UICC = Union internationale contre le cancer.
- https://doi.org/10.7554/eLife.36967.019
-
Supplementary file 6
Bivariate immune phenotype predicts risk of death of any cause.
A multivariable Cox proportional hazard model was fitted to all variables listed in this table. N = 286 CRC patients in the DACHS cohort, number of events = 108, significance codes (sig): *<0.05, **<0.01, ***<0.001. HR = hazard ratio, UICC = Union internationale contre le cancer.
- https://doi.org/10.7554/eLife.36967.020
-
Transparent reporting form
- https://doi.org/10.7554/eLife.36967.021
Download links
A two-part list of links to download the article, or parts of the article, in various formats.
Downloads (link to download the article as PDF)
Open citations (links to open the citations from this article in various online reference manager services)
Cite this article (links to download the citations from this article in formats compatible with various reference manager tools)
Topography of cancer-associated immune cells in human solid tumors
eLife 7:e36967.
https://doi.org/10.7554/eLife.36967


