Systematic studies of all PIH proteins in zebrafish reveal their distinct roles in axonemal dynein assembly
- The University of Tokyo, Japan
- University of Yamanashi, Japan
Figures
Figure 1 with 1 supplement

Zebrafish PIH genes, pih1d1, pih1d2, ktu, and twister, were expressed in ciliated organs.
(A) Phylogenetic tree of PIH proteins in yeast, Chlamydomonas, and vertebrates. Amino acid sequences were aligned by MAFFT program with FFT-NS-i option (Katoh and Standley, 2013) and evolutionary distances were calculated using neighbor-joining (Saitou and Nei, 1987). yeast, Saccharomyces cerevisiae; Chlamy, Chlamydomonas reinhardtii; z, zebrafish (Danio rerio); o, medaka (Oryzias latipes); m, Mus musculus; h, Homo sapiens. (B) Genomic organization of PIH genes in zebrafish. Black: exons. Gray: untranslated regions. Red asterisks indicate the target sites of our genome-editing. (C) Immunoblot of PIH proteins. None of the PIH proteins were detected in the sperm flagella fraction (asterisks). α-tubulin: control. (D) Whole-mount in situ hybridization of PIH genes. Arrows in lateral views indicate expression of PIH genes in ciliated organs (Kupffer’s vesicle, floor plate, otic vesicle, and pronephric duct). Flat mount preparations show dorsal views of the posterior regions of 12 hpf embryos. pih1d1 was ubiquitously expressed in 12 hpf embryos (black asterisk) containing Kupffer’s vesicle and floor plate (red arrowheads). ktu was also expressed in brain rudiments at 32 hpf (black arrowhead). White asterisks: non-specific staining of yolk. Scale bars: 200 μm. (E and F) Diagrams of zebrafish embryos at (E) 12 hpf and (F) 32 hpf, showing typical ciliated organs. (G) Left: preparation procedure of flat mount. Right: diagram of Kupffer’s vesicle and floor plate in flat-mounted embryos.
Figure 1—figure supplement 1
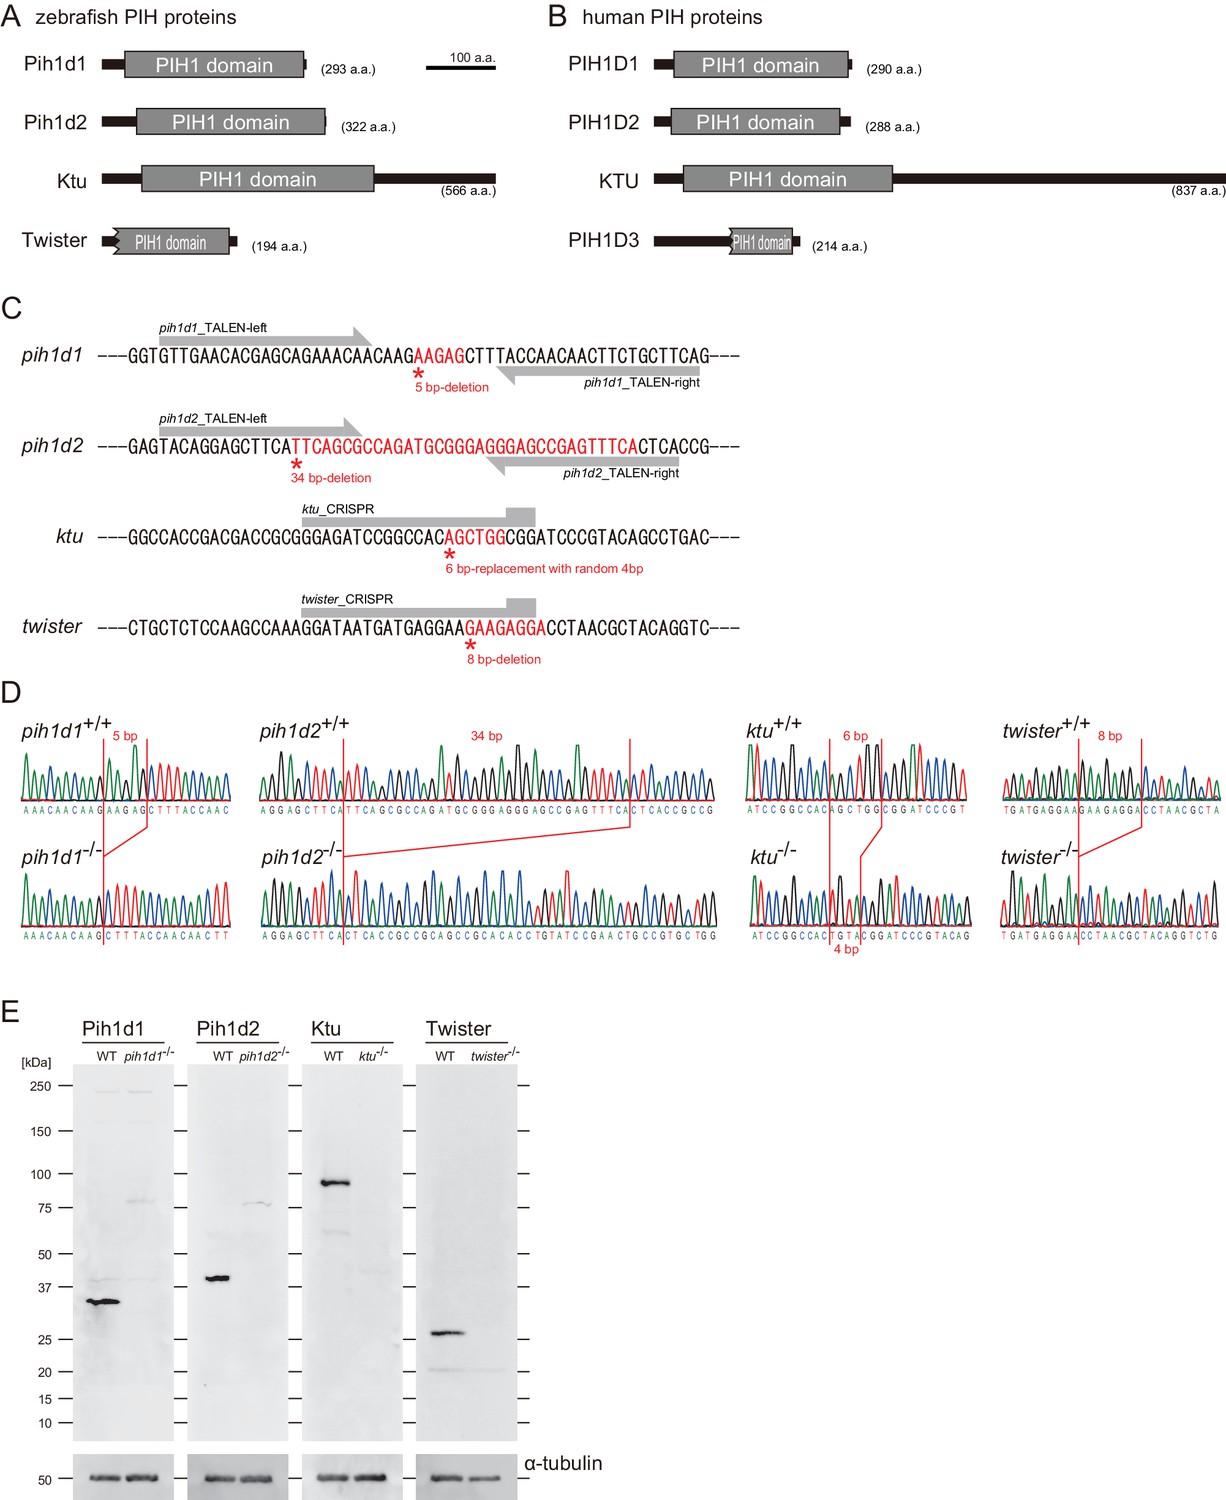
PIH gene mutants were established by genome-editing.
(A and B) Domain structures of PIH proteins in (A) zebrafish and (B) human. Protein motifs were obtained by SMART or Pfam analyses. (C) Target sites of our genome-editing. Induced mutations changed the sequences shown in red. (D) Sanger sequencings of WT and PIH gene mutants around the target sites of our genome-editing. (E) Immunoblot of testis lysate of WT and PIH gene mutants. Induced mutations caused null of each PIH protein. α-tubulin: control.
Figure 2 with 1 supplement
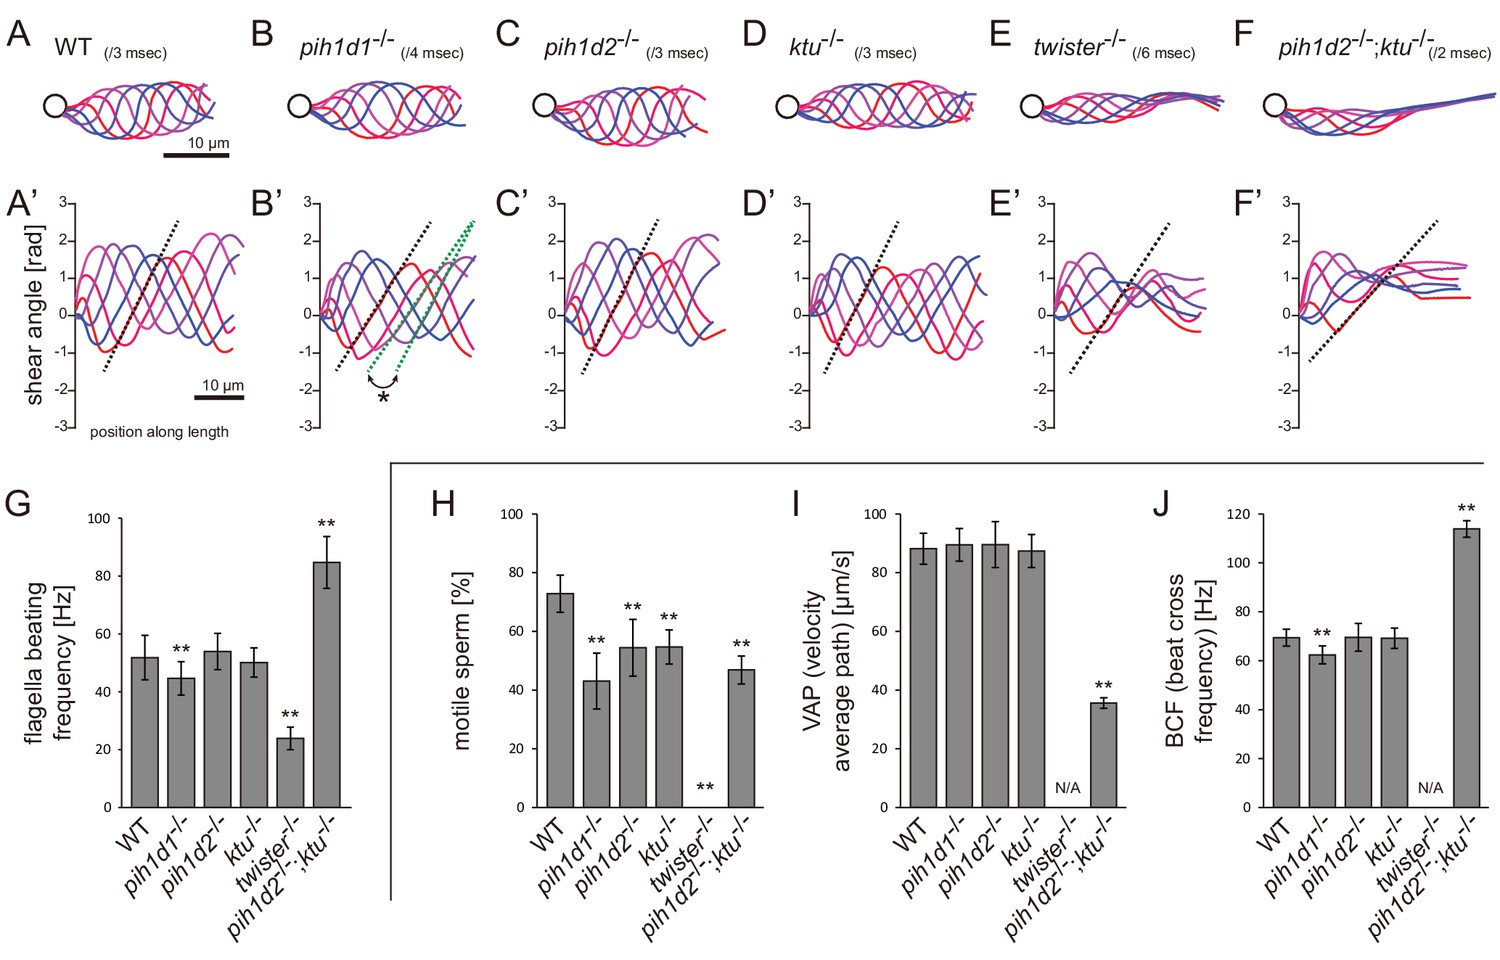
Mutations of PIH genes caused abnormal sperm motilities.
(A–G) Waveforms and the beating frequencies of motile sperms were analyzed using a high-speed camera at 1000 fps (frames per second). (A–F) Sperm waveforms were traced six times in one beating cycle and overlaid. Intervals are as follows: WT, 3 ms; pih1d1-/-, 4 ms; pih1d2-/-, 3 ms; ktu-/-, 3 ms; twister-/-, 6 ms; and pih1d2-/-;ktu-/-, 2 ms. Traces are painted in a color gradient of from red (first traces) to blue (sixth traces). (A’–F’) Shear angles of beating flagella were calculated from each trace of A-F. Slopes of dotted lines represent the size of flagellar bending. An asterisk with green dotted lines in B’ shows unstable propagation of flagellar bending in pih1d1-/- sperm. (G) Beating frequencies of sperm flagella were measured by sperm kymographs. Kymographs of pih1d2-/-;ktu-/- were obtained from the proximal region of sperm flagella, as distal flagella were immotile. Number of samples: WT, 23; pih1d1-/-, 23; pih1d2-/-, 26; ktu-/-, 15; twister-/-, 8; and pih1d2-/-;ktu-/-, 14. (H–J) Motilities of free-swimming spermatozoa were observed using a high-speed camera at 200 fps and analyzed by CASA modified for zebrafish. For each zebrafish line, more than 1200 spermatozoa were observed in total with sixteen technical replicates. Spermatozoa with less than 20 μm/s velocities were considered immotile. (H) Ratio of motile (locomotive) sperm. (I) Velocity of spermatozoa on averaged paths. Averaged paths were constructed by connecting the points of averaged sperm positions of coordinating 33 frames. (J) Frequencies at which sperm heads crossed their averaged paths. Bar graphs show mean ±SD. **: p-value<0.01 in Dunnett's test of each mutant against WT.
-
Figure 2—source data 1
Data for Figure 2G, beating frequencies of sperm flagella.
- https://doi.org/10.7554/eLife.36979.008
-
Figure 2—source data 2
Data for Figure 2H, ratio of motile sperm.
- https://doi.org/10.7554/eLife.36979.009
-
Figure 2—source data 3
Data for Figure 2I, velocity of spermatozoa on averaged paths.
- https://doi.org/10.7554/eLife.36979.010
-
Figure 2—source data 4
Data for Figure 2J, frequencies at which sperm heads crossed their averaged paths.
- https://doi.org/10.7554/eLife.36979.011
Figure 2—figure supplement 1
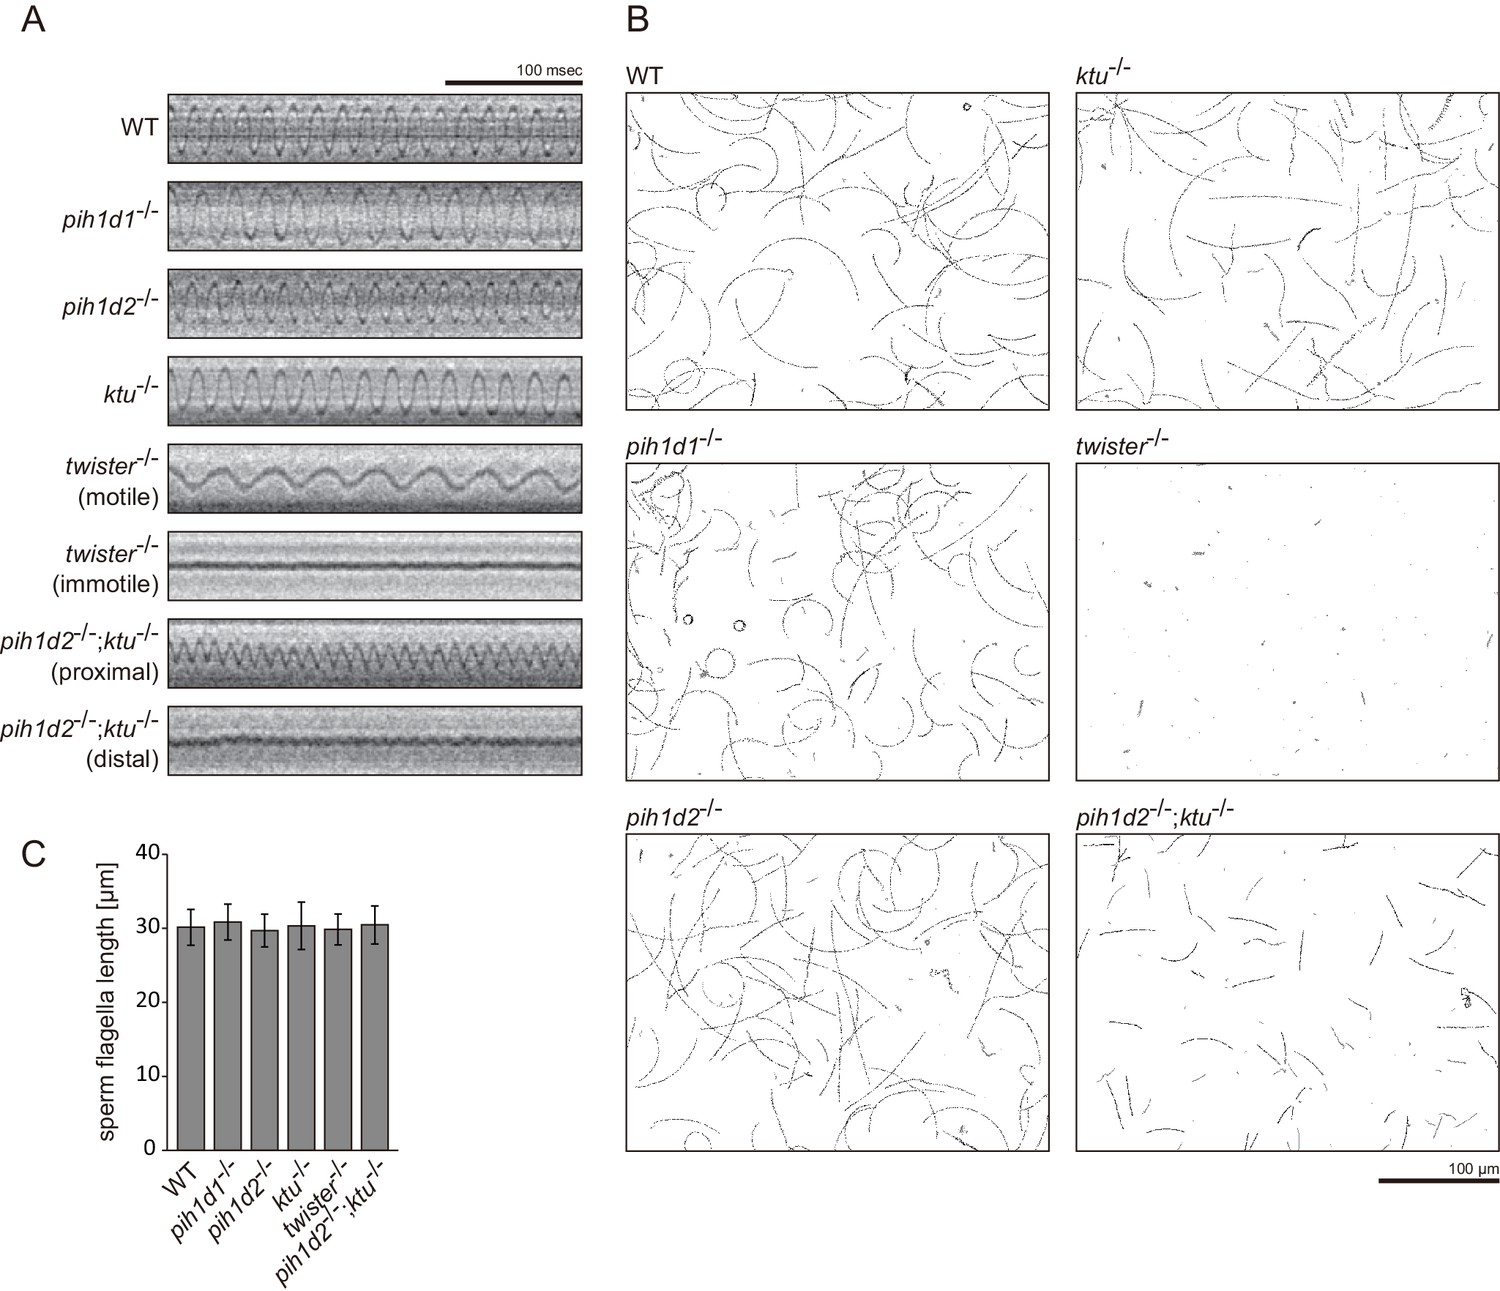
Sperm motilities and flagellar length.
(A) Typical kymographs of sperm flagella. (B) Typical traced paths of sperm heads in CASA. Black: traced paths of motile spermatozoa. Gray: traced paths of immotile (velocity <20 μm/s) spermatozoa. (C) Length of sperm flagella. Immunofluorescent staining of sperm with acetylated tubulin antibodies was performed to measure the length of the flagella. Number of samples: WT, 129; pih1d1-/-, 64; pih1d2-/-, 78; ktu-/-, 84; twister-/-, 81; and pih1d2-/-;ktu-/-, 80. Bar graphs show mean ± SD. Significant differences (p-value<0.05) were not detected in a Dunnett's test of each mutant against WT.
-
Figure 2—figure supplement 1—source data 1
Data for Figure 2—figure supplement 1C, length of sperm flagella.
- https://doi.org/10.7554/eLife.36979.012
Figure 3 with 1 supplement
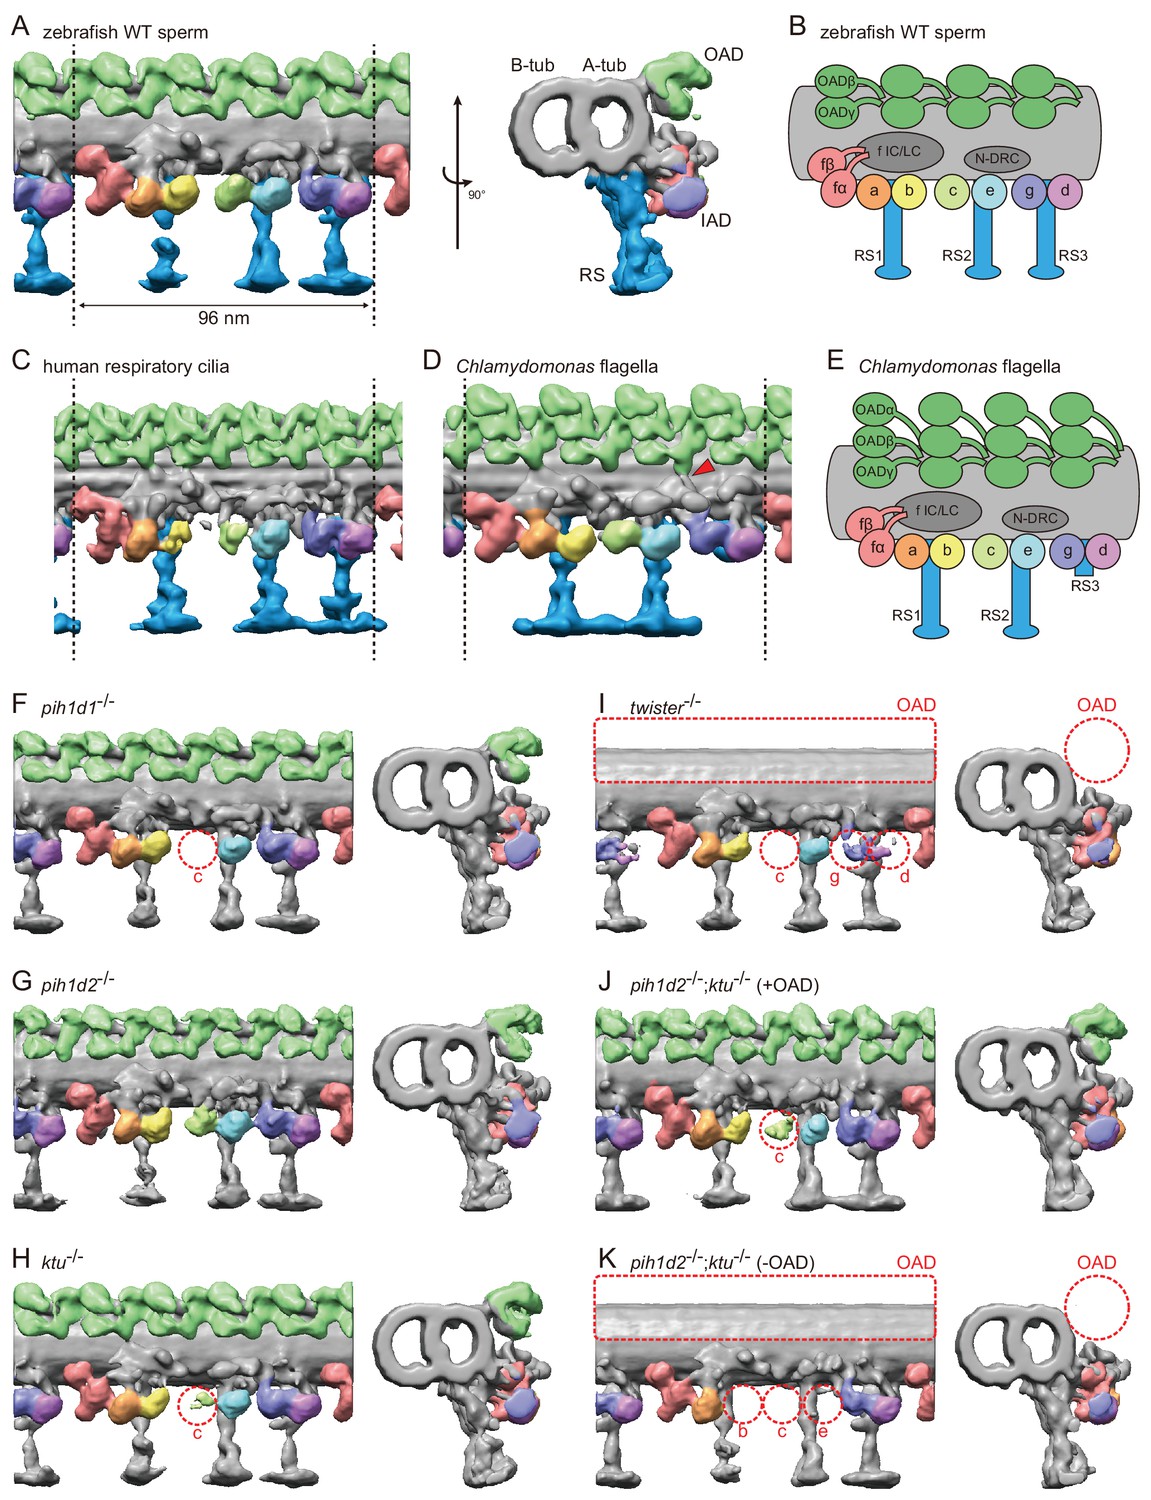
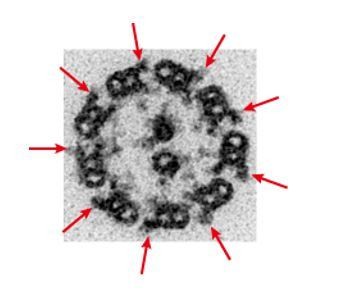
Cryo-ET revealed structural defects of axonemal dyneins in mutant spermatozoa.
(A) DMT structure of native zebrafish sperm. Left: side view. Right: base-to-tip view. A-tub and B-tub: A- and B-tubule of DMT, respectively. (B) Diagram of the DMT structure of zebrafish sperm. f IC/LC means IAD f intermediate chain and light chain complex. (C) DMT structure of human respiratory cilia (EMD-5950; Lin et al., 2014). (D) DMT structure of Chlamydomonas flagella (DMT 2–8 averaged; EMD-2132; Bui et al., 2012). Red arrow indicates a linker between N-DRC and OAD. (E) Diagram of the DMT structure of Chlamydomonas flagella. (F–K) DMT structures of PIH gene mutant spermatozoa. For pih1d2-/-;ktu-/-, J (+OAD) and K (-OAD) represent subtomograms of axonemes with or without OADs, respectively. Red circles indicate the defects of axonemal dyneins. Green, OADs; red, IAD f; orange, IAD a; yellow, IAD b; light-green, IAD c; cyan, IAD e; indigo, IAD g; violet, IAD d; blue, RSs.
Figure 3—figure supplement 1
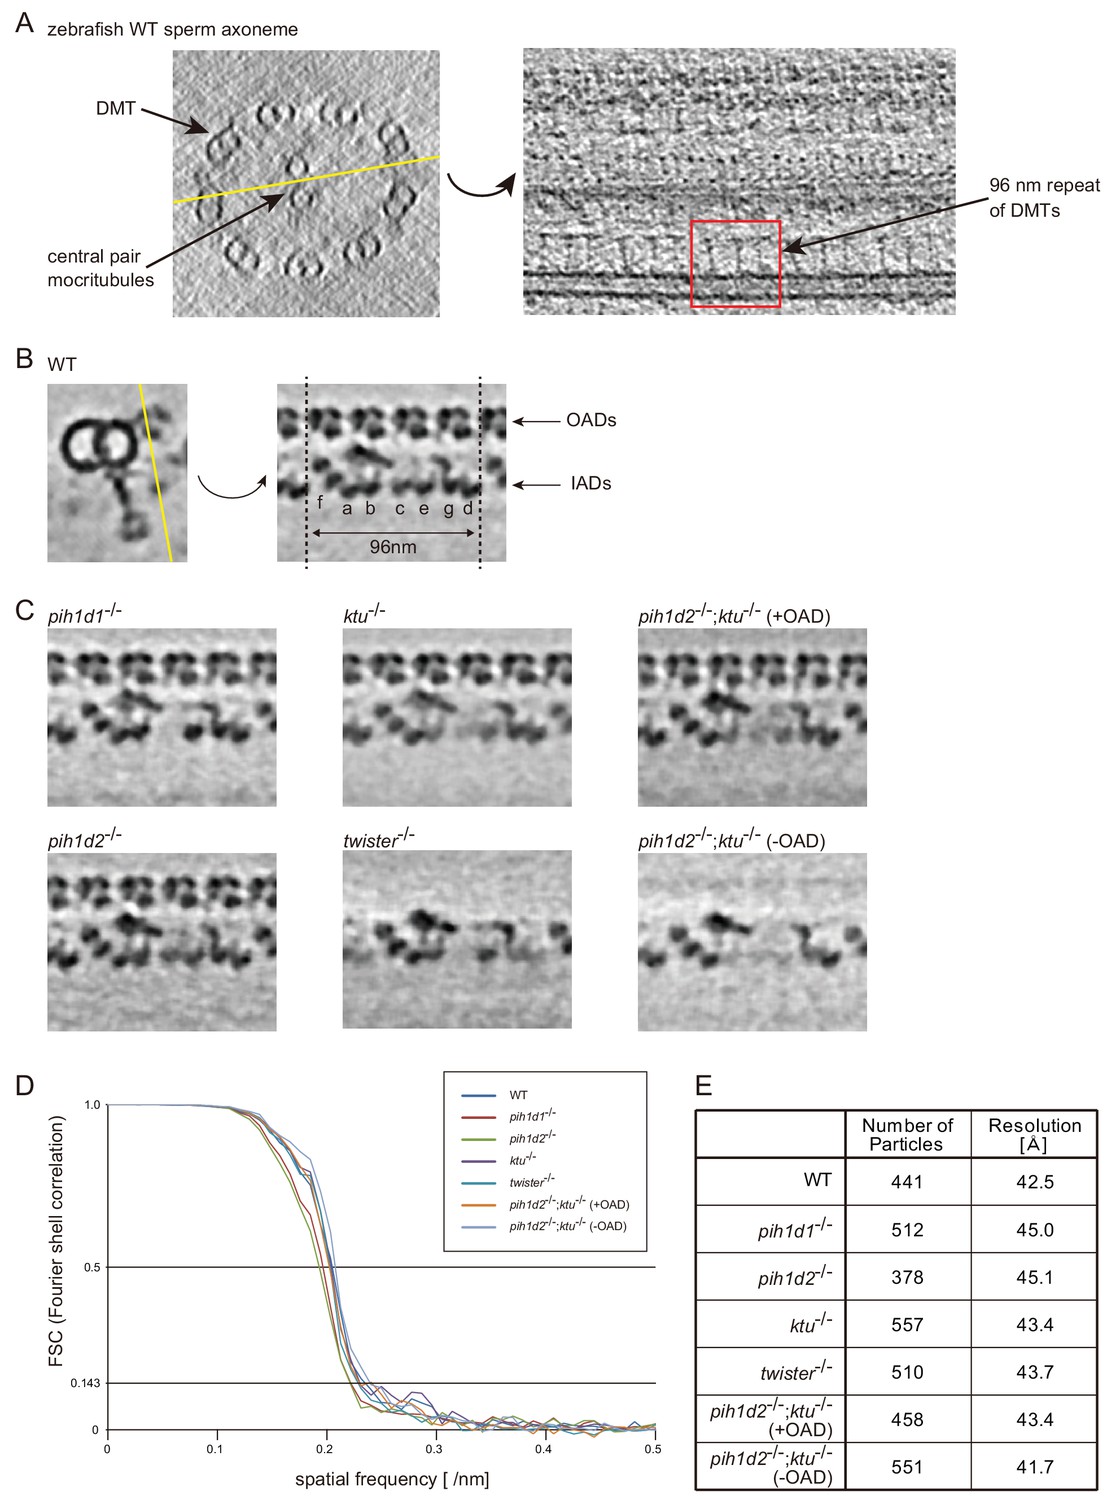
Tomographic slices and Fourier shell correlations of the averaged subtomograms.
(A) Tomographic slices (20 nm thick) of WT sperm axoneme. Left: cross-section (base-to-tip view). Right: longitudinal section at the location indicated by the yellow line in the left-hand image. (B) 2-nm-thick slices of the WT sperm subtomogram. Cross-section is shown on the left. Yellow line indicates the position of the right-hand slice and the slices in C. (C) 2-nm-thick slices of PIH gene mutant subtomograms. (D) Fourier shell correlation curves of the averaged subtomograms in this study. Effective resolutions were determined by a cutoff value of 0.143. (E) Number of particles and effective resolutions of the averaged subtomograms.
Figure 4 with 1 supplement
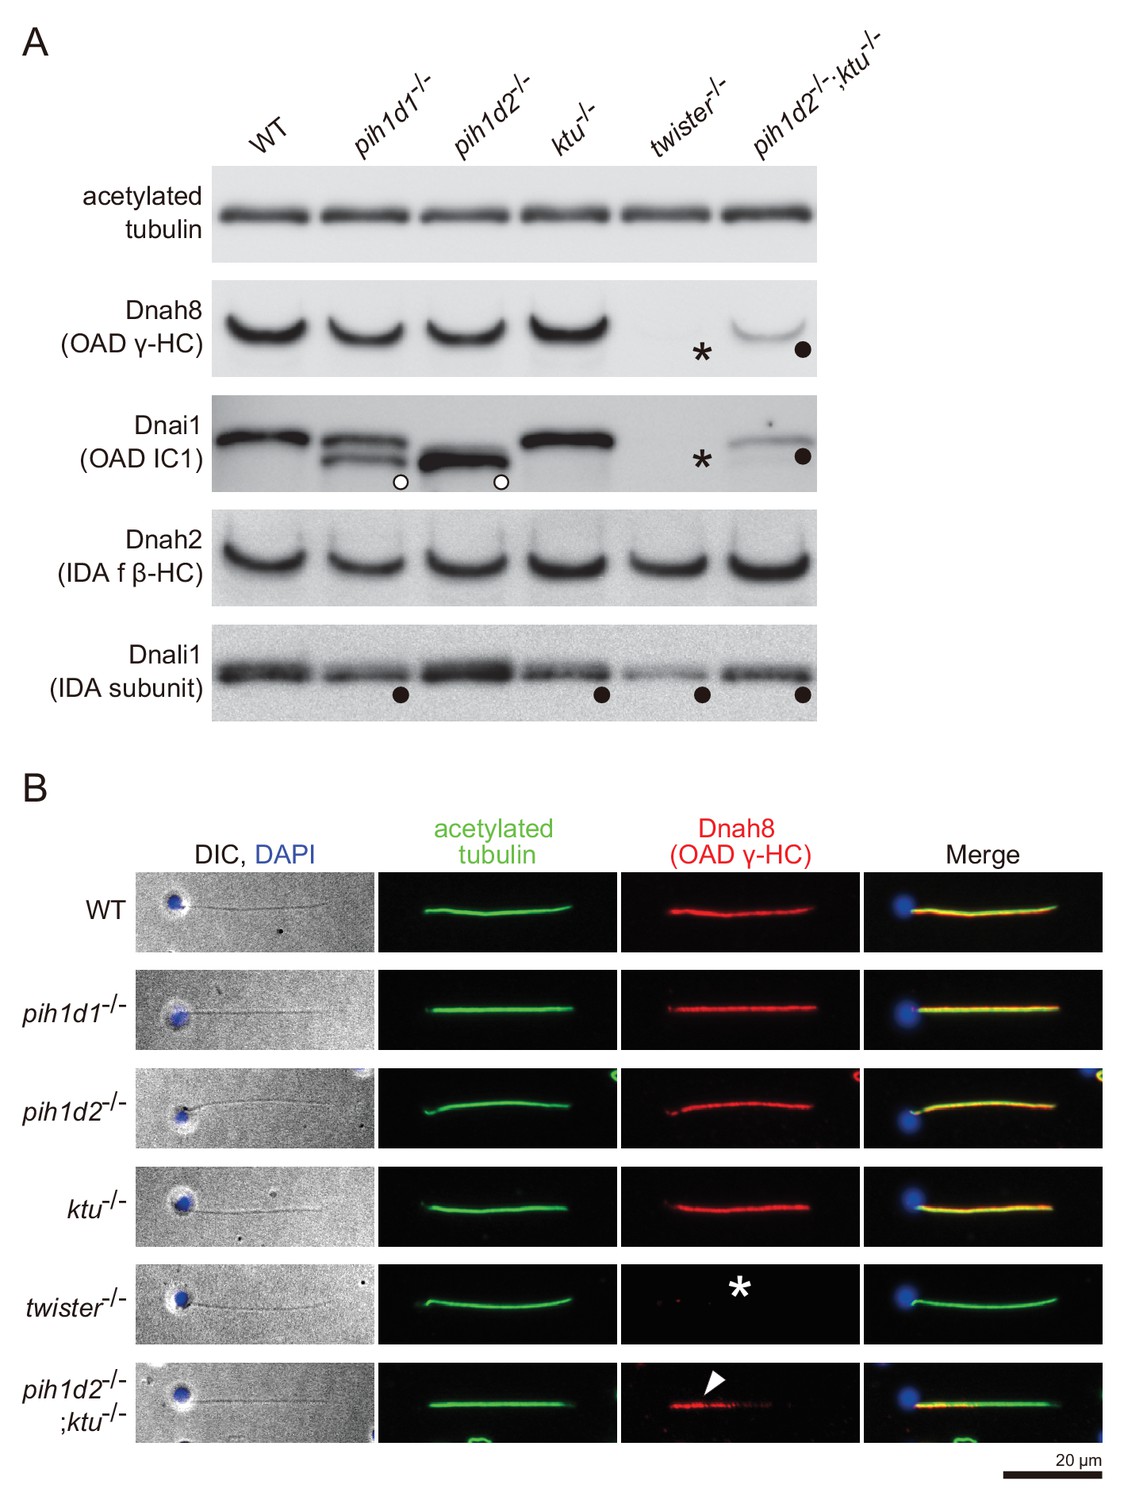
Immunoblot and immunofluorescence microscopy of axonemal dyneins.
(A) Immunoblot of sperm axonemes. Asterisks, filled circles, and open circles indicate missing, decreased, and shifted bands, respectively. Acetylated tubulin: control. (B) Immunofluorescence microscopy of zebrafish spermatozoa. Dnah8 was localized along the entire length of sperm flagella in WT, pih1d1-/-, pih1d2-/-, ktu-/-. In twister-/-, Dnah8 was lost (white asterisk), while in pih1d2-/-;ktu-/-, Dnah8 was localized only in the proximal half of the flagella (white arrowhead).
Figure 4—figure supplement 1
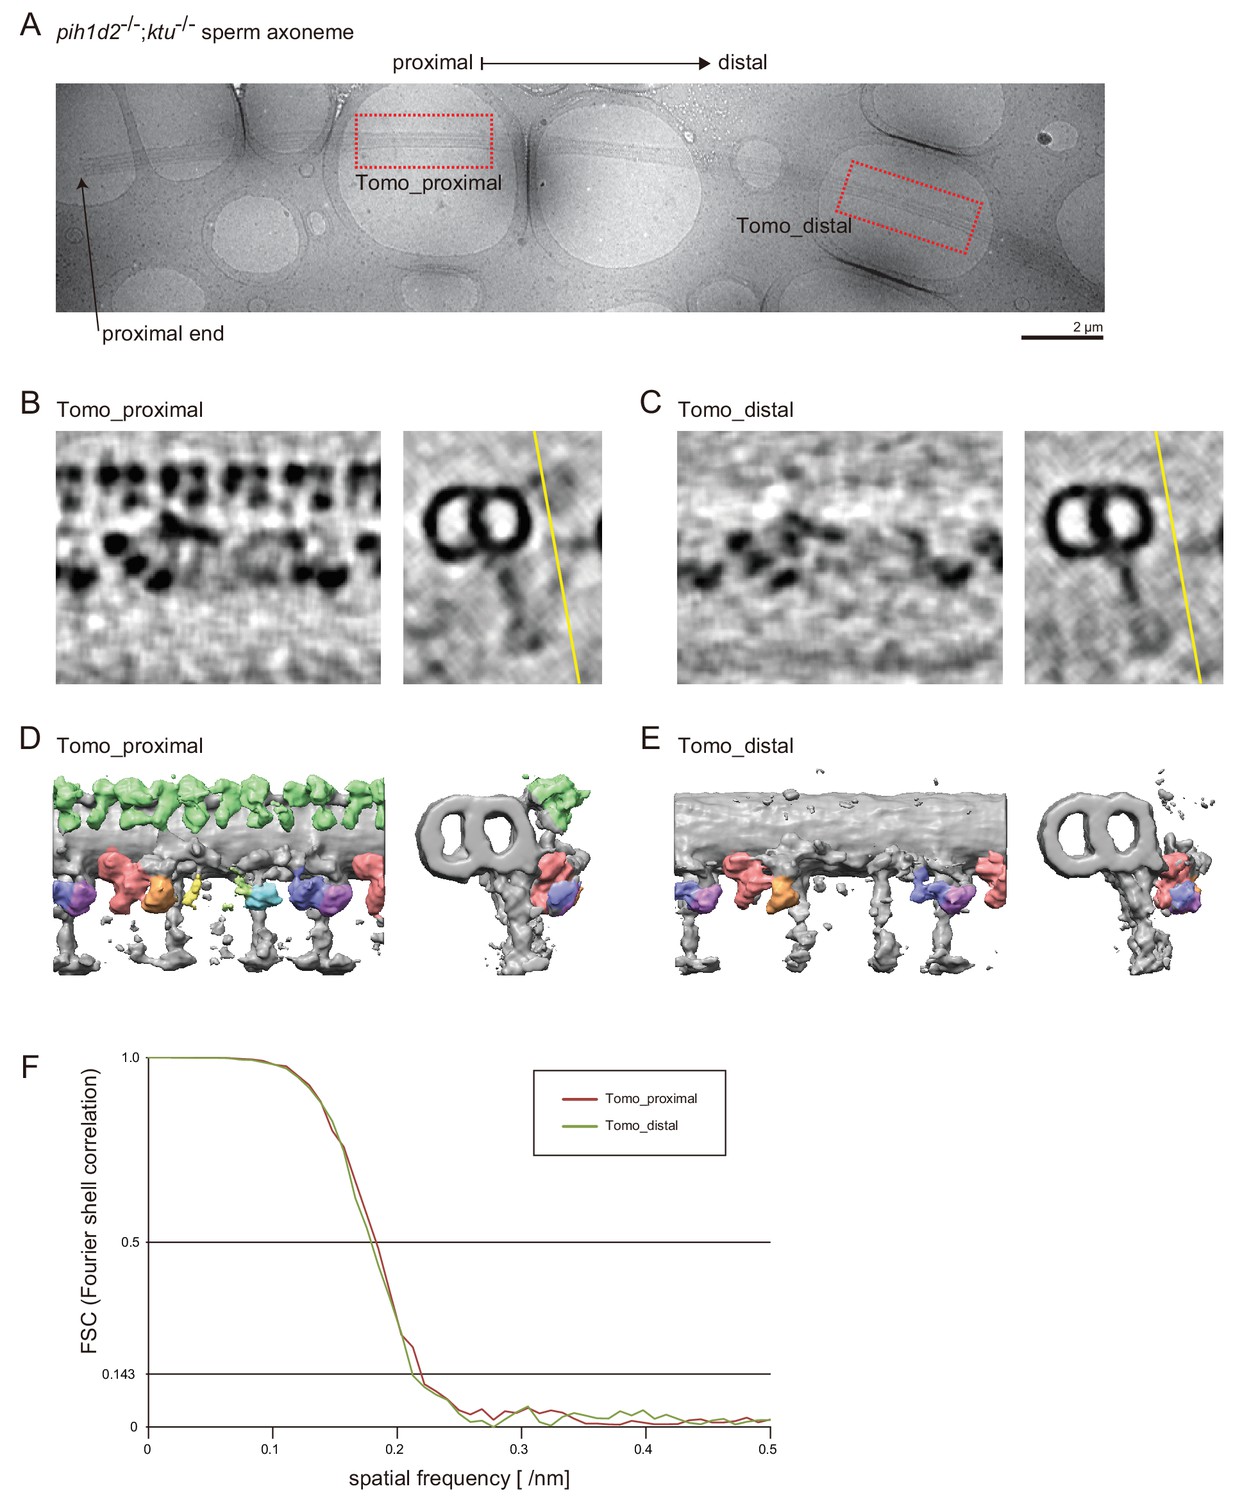
Axonemal structures in pih1d2-/-;ktu-/- sperm.
(A) Cryo-TEM image of pih1d2-/-;ktu-/- axoneme, which was suitable for observing both proximal and distal regions by cryo-ET. Red squares indicate the observed areas. (B and C) 5-nm-thick slices of the subtomograms of the proximal (B; Tomo_proximal) and the distal (C; Tomo_distal) regions. Images on the left show slices of subtomograms at the point indicated by the yellow lines in the images on the right (cross-section). (D and E) 3D images of averaged subtomograms. Left: side views. Right: cross views. (F) Fourier shell correlation curves of the averaged subtomograms in this study. Number of particles: Tomo_proximal, 128; and Tomo_distal, 115. Effective resolutions were determined by a cutoff value of 0.143, and approximately 46 Å was estimated.
Figure 5

Mutations of PIH genes caused abnormal motilities of Kupffer’s vesicle cilia.
(A) Images of zebrafish embryo and Kupffer's vesicle. Red square in left-hand image indicates the position of the Kupffer's vesicle in a 12 hpf embryo. Right-hand image shows the dorsal view of the Kupffer's vesicle. (B) Diagram of zebrafish Kupffer's vesicle. Mono-cilia, which project from epithelial cells, have rotational motilities to produce left-ward fluid flow (red arrow) in the organ. (C) Typical kymographs of Kupffer’s vesicle cilia in WT and PIH gene mutants. Patterns of the kymographs were categorized into three classes: rotating (blue), irregular (green), and immotile (red). (D) Ratios of each motility class. Number of observed cilia: WT, 76; pih1d1-/-, 67; pih1d2-/-, 198; ktu-/-, 190; twister-/-, 53; and pih1d2-/-;ktu-/-, 48. (E) Rotational frequencies of Kupffer’s vesicle cilia. Bar graphs show mean ±SD. **: p-value<0.01 in Dunnett's test of each mutant against WT. (F) Heart looping of WT and mutant embryos at 30 hpf. Number of samples: WT, 247; pih1d1-/-, 288; pih1d2-/-, 275; ktu-/-, 285; twister-/-, 139; and pih1d2-/-;ktu-/-, 276. (G) Diagram represents normal heart looping of the 30 hpf embryo. V, ventricle; A, atrium.
-
Figure 5—source data 1
Data for Figure 5E, rotational frequencies of Kupffer’s vesicle cilia.
- https://doi.org/10.7554/eLife.36979.026
Figure 6

DNAH genes showed distinct expression patterns in zebrafish embryos and testis.
(A) Whole-mount in situ hybridization of DNAH genes with embryos (12 and 32 hpf) and dissected testis (seminal lobule). For embryos, lateral views are shown. Yolk of 12 hpf embryos was removed before observation to show Kupffer’s vesicle clearly. Red arrowheads indicate Kupffer’s vesicles or testes in which DNAH gene expressions were not detected. White asterisks: non-specific staining of yolk. Scale bars: 200 μm for embryos; 100 μm for testes. (B) Comparison of DNAH gene expression between Kupffer’s vesicle and testis. +, expressed; -, expression not detected. Red indicates when DNAH gene expression was difference between the two organs.
Figure 7 with 1 supplement

Mutant phenotypes revealed axonemal dyneins assembled by distinct PIH proteins in zebrafish.
(A) Summary of the sperm motilities and the axonemal structures of WT and each PIH gene mutant. Abnormal axonemal dyneins are indicated by red circles filled with white (missing) or color (diminished or Dnai1 defects). (B) Summary of the motilities of Kupffer’s vesicle cilia. (C) Proposed model of the axonemal dynein assembly by distinct PIH proteins. Pih1d1, Pih1d2 and Ktu, and Twister are required for the assembly of specific subsets of axonemal dyneins. Factors responsible for the construction of IAD a or IAD f were not revealed in our research. (D) Possible combinations of OAD HCs in zebrafish sperm flagella and Kupffer’s vesicle cilia, suggested by the expression analysis of DNAH genes. Although testis showed expression of both γ-HC genes (dnah5 and dnah8), Dnah8 were present along the entire length of sperm flagella, while the distribution of Dnah5 is not known. (E) Possible combinations of OAD HCs in human sperm flagella and respiratory cilia. Localizations of DNAH9 and DNAH5 in human spermatozoa were reported by Fliegauf et al. (2005). Localizations of DNAH9, DNAH11 and DNAH5 in human respiratory cilia were reported by Dougherty et al. (2016).
Figure 7—figure supplement 1
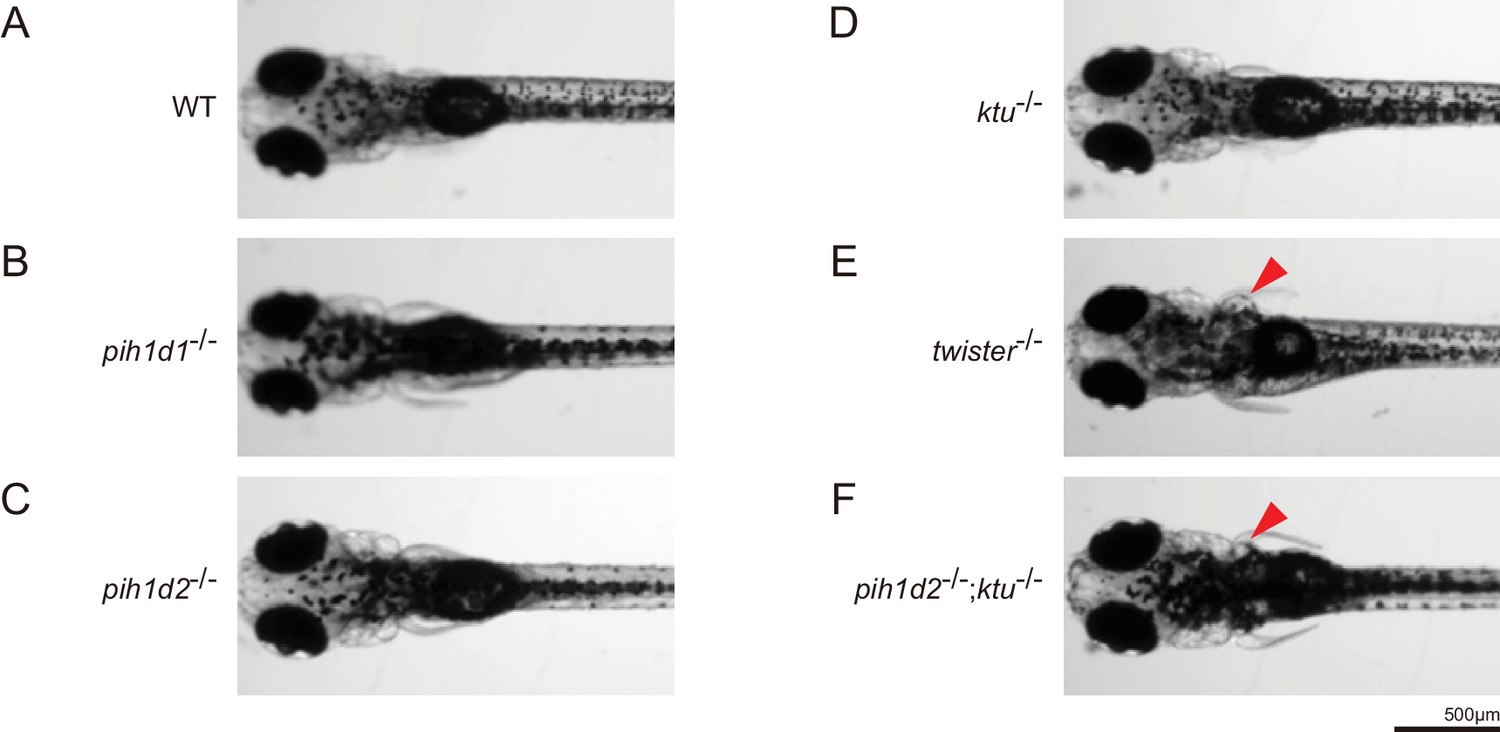
Expansion of pronephric duct was observed in twister-/- and pih1d2-/-;ktu-/-.
(A–F) Dorsal views of zebrafish larvae at 4 days post-fertilization. (A) WT, (B) pih1d1-/-, (C) pih1d2-/-, (D) ktu-/-, (E) twister-/-, (F) pih1d2-/-;ktu-/-. twister-/- and pih1d2-/-;ktu-/- exhibited abnormal expansions of pronephric ducts (red arrowheads), which disabled larvae from having their pectoral fins close to their bodies.
Author response image 1
TEM image of zebrafish sperm axoneme.
https://doi.org/10.7554/eLife.36979.035Videos
Video 1
Sperm waveforms of WT and PIH gene mutants.
For each strain, two spermatozoa whose heads were attached to the coverslip are shown. Movies were filmed by a high-speed camera at 1000 fps and played at 30 fps. Scale bar: 10 μm.
Video 2
Sperm motilities of WT and PIH gene mutants.
Movies of free-swimming spermatozoa for CASA, filmed by a high-speed camera at 200 fps and played at 30 fps. Scale bar: 50 μm.
Video 3
3D structure of DMT in WT sperm
https://doi.org/10.7554/eLife.36979.014
Video 4
3D structure of DMT in pih1d1-/- sperm.
https://doi.org/10.7554/eLife.36979.017
Video 5
3D structure of DMT in pih1d2-/- sperm.
https://doi.org/10.7554/eLife.36979.018
Video 6
3D structure of DMT in ktu-/- sperm.
https://doi.org/10.7554/eLife.36979.019
Video 7
3D structure of DMT in twister-/- sperm.
https://doi.org/10.7554/eLife.36979.020
Video 8
3D structure of DMT (+OAD) in pih1d2-/-;ktu-/- sperm.
https://doi.org/10.7554/eLife.36979.021
Video 9
3D structure of DMT (-OAD) in pih1d2-/-;ktu-/- sperm.
https://doi.org/10.7554/eLife.36979.022
Video 10
Motilities of Kupffer’s vesicle cilia of WT and PIH gene mutants.
Typical movies of Kupffer’s vesicle cilia, filmed by a high-speed camera at 1000 fps and played at 30 fps. Scale bar: 5 μm.
Tables
Table 1
Correspondence of DNAH genes/proteins among zebrafish, human, and Chlamydomonas.
https://doi.org/10.7554/eLife.36979.028| Gene/protein names | |||
|---|---|---|---|
| Zebrafish | Human | Chlamydomonas | |
| OAD HCs | OAD α (DHC13) | ||
| Dnah9 | DNAH9 | OAD β (DHC14) | |
| Dnah11 | DNAH11 | ||
| Dnah9l | |||
| DNAH17 | |||
| Dnah5 | DNAH5 | OAD γ (DHC15) | |
| Dnah8 (Dnah5l) | |||
| DNAH8 | |||
| IAD f HCs | Dnah10 | DNAH10 | IAD fα (DHC1) |
| Dnah2 | DNAH2 | IAD fβ (DHC10) | |
| IAD HCs | Dnah3 | DNAH3 | IAD a (DHC6) IAD b (DHC5) IAD c (DHC9) IAD e (DHC8) minor var. DHC11 minor var. DHC4 |
| Dnah7 | DNAH7 | ||
| Dnah12 | DNAH12 | ||
| Dnah1 | DNAH1 | IAD d (DHC2) | |
| Dnah7l (Dnah6) | DNAH6 | IAD g (DHC7) minor var. DHC3 | |
| DNAH14 | |||
Key resources table
| Reagent type (species) or resource | Designation | Source or reference | Identifiers | Additional information |
|---|---|---|---|---|
| Gene (Danio rerio) | pih1d1 | NA | ZFIN:ZDB-GENE-050309–147 | |
| Gene (D. rerio) | pih1d2 | NA | ZFIN:ZDB-GENE-041212–54 | |
| Gene (D. rerio) | ktu | NA | ZFIN:ZDB-GENE-050809–128 | |
| Gene (D. rerio) | twister | NA | ZFIN:ZDB-GENE-040722–2 | |
| Antibody | anti-Pih1d1 | This paper | Rabbit polyclonal; against full length | |
| Antibody | anti-Pih1d2 | This paper | Rabbit polyclonal; against full length | |
| Antibody | anti-Ktu | This paper | Rabbit polyclonal; against full length | |
| Antibody | anti-Twister | This paper | Rabbit polyclonal; against full length | |
| Antibody | anti-Dnah8 | This paper | Rabbit polyclonal; against aa 895–1402 | |
| Antibody | anti-Dnah2 | This paper | Rabbit polyclonal; against aa 802–1378 | |
| Antibody | anti-Dnai1 | GeneTex | GeneTex:GTX109719 | |
| Antibody | anti-Dnali1 | PMID: 7579689 | anti-p28 antibody | |
| Antibody | anti-α-tubulin (mouse monoclonal) | Sigma | Sigma:T9026 | |
| Antibody | anti-acetylated tubulin (mouse monoclonal) | Sigma | Sigma:T6793 | |
| Software, algorithm | CASA modified for zebrafish | PMID:17137620 | ||
| Software, algorithm | IMOD | PMID:8742726 | ||
| Software, algorithm | PEET | PMID:16917055 | ||
| Software, algorithm | UCSF Chimera | PMID:15264254 |
Table 2
Primer sequences used in this study
https://doi.org/10.7554/eLife.36979.032| Purpose | Name | Sequence |
|---|---|---|
| Probes for in situ hybridization | pih1d1.F | GAACCGGAACAGTCAGTGAA |
| pih1d1.R | TAGGGCACAAAAACGGAAAC | |
| pih1d2.F | GTGAGTCCAAGTAGGCTATT | |
| pih1d2.R | GGATAAACAAGAGTGAACTATTT | |
| ktu.F | GACGCGCTGTTCACCGGAGC | |
| ktu.R | GGATCCGCCAGCTGTGGCC | |
| twister.F | AGAGCAGGACATTCACTTCA | |
| twister.R | TTGTCTATCTTTCTCTCTGTTTCC | |
| dnah9.F | ATGTATGGAGTCTGTGGATGCAAAG | |
| dnah9.R | ACATGGCCGTACAGCAGGAA | |
| dnah9l.F | CGCGTGGACTTCATTAGAG | |
| dnah9l.R | TTTGACCGTAAGGCCTG | |
| dnah11.F | GTGTCAATATTTTTTAACAAGGTGT | |
| dnah11.R | AATATTGGACAGTTGTCGATCA | |
| dnah5.F | AAATACCTCTGTCGAATCACTG | |
| dnah5.R | ATCCTGTGGAGCCAATCC | |
| dnah8.F | ACAGAAAACGAAGAGTCTCCTC | |
| dnah8.R | ATCCATAAGGCTGCAGAAG | |
| dnah2.F | ATGGCTGACCCAGAGACC | |
| dnah2.R | CTCAGAATGGAACAGATTGTACAC | |
| dnah3.F | AGGTATTTATACTATGTCACGGAGG | |
| dnah3.R | AGTGACTTCACTTGTGTGTTTCA | |
| dnah7l.F | ATGTATTCTTTTCAGAAAGGACATC | |
| dnah7l.R | AGCATCTTCTTCAAGAATTTCCT | |
| Antigen generation | pih1d1_Ag.F | ATGTCTGAGGCACTCATCATG |
| pih1d1_Ag.R | TCACAAAGACACGACTGGC | |
| pih1d2_Ag.F | ATGGCAATCCATGGCTAT | |
| pih1d2_Ag.R | TCATAATACATTTACCGTCACATT | |
| ktu_Ag.F | ATGGACGCGGACAGACTG | |
| ktu_Ag.R | TGCTTCCAGTTGGACTGA | |
| twister_Ag.F | ATGGAGGGTCTCGCGTCC | |
| twister_Ag.R | TCAGGTCAGATTAATGCAGTC | |
| dnah8_Ag.F | TATTTCATAGGTTGTGTGTACAAG | |
| dnah8_Ag.R | TTCACGTGGCGGCAAACC | |
| dnah2_Ag.F | AGCGCCTTTATCAATGACTG | |
| dnah2_Ag.R | GATGATCTTCTTAAACTGCTCA |
Additional files
-
Transparent reporting form
- https://doi.org/10.7554/eLife.36979.033
Download links
A two-part list of links to download the article, or parts of the article, in various formats.
Downloads (link to download the article as PDF)
Open citations (links to open the citations from this article in various online reference manager services)
Cite this article (links to download the citations from this article in formats compatible with various reference manager tools)
Systematic studies of all PIH proteins in zebrafish reveal their distinct roles in axonemal dynein assembly
eLife 7:e36979.
https://doi.org/10.7554/eLife.36979


