The ER membrane protein complex interacts cotranslationally to enable biogenesis of multipass membrane proteins
- University of California, San Francisco, United States
- Max Planck Institute of Biochemistry, Germany
- University of Pittsburgh, United States
- Chan Zuckerberg Biohub, United States
- Howard Hughes Medical Institute, University of California, San Francisco, United States
Figures
Figure 1
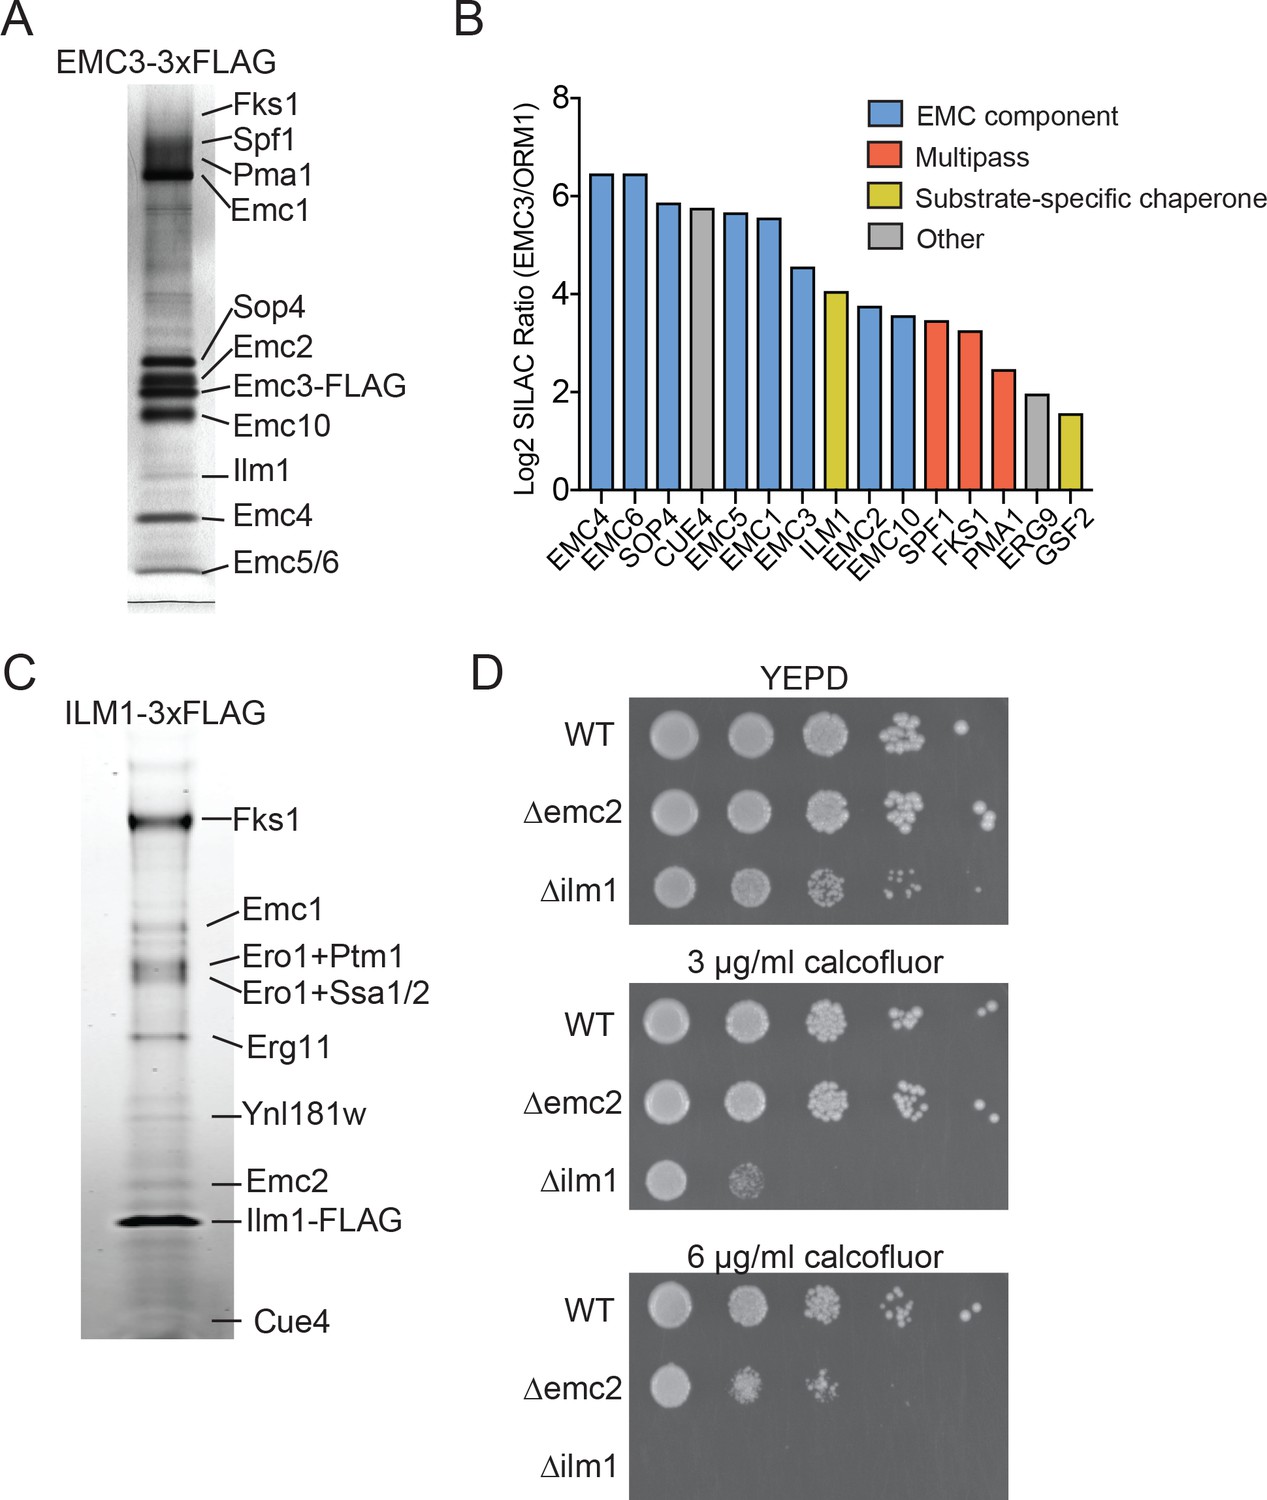
Identifying EMC interaction partners in S. cerevisiae.
(A) SDS-PAGE gel of Emc3-3xFLAG co-immunoprecipitated proteins. Proteins identified from excised bands are indicated. (B) SILAC ratios for proteins identified by mass spectrometry for Emc3-3xFLAG (heavy) and ORM1-3xFLAG (light) immunoprecipitations. The most Emc3-3xFLAG enriched proteins are shown. (C) SDS-PAGE gel of Ilm1-3xFLAG co-immunoprecipitated proteins. Proteins identified from excised bands are indicated. (D) 10-fold serial dilutions of log phase cultures of the indicated strains were plated on YEPD, YEPD containing calcofluor white at the indicated concentrations and incubated at 30°C for 24 hr.
Figure 2
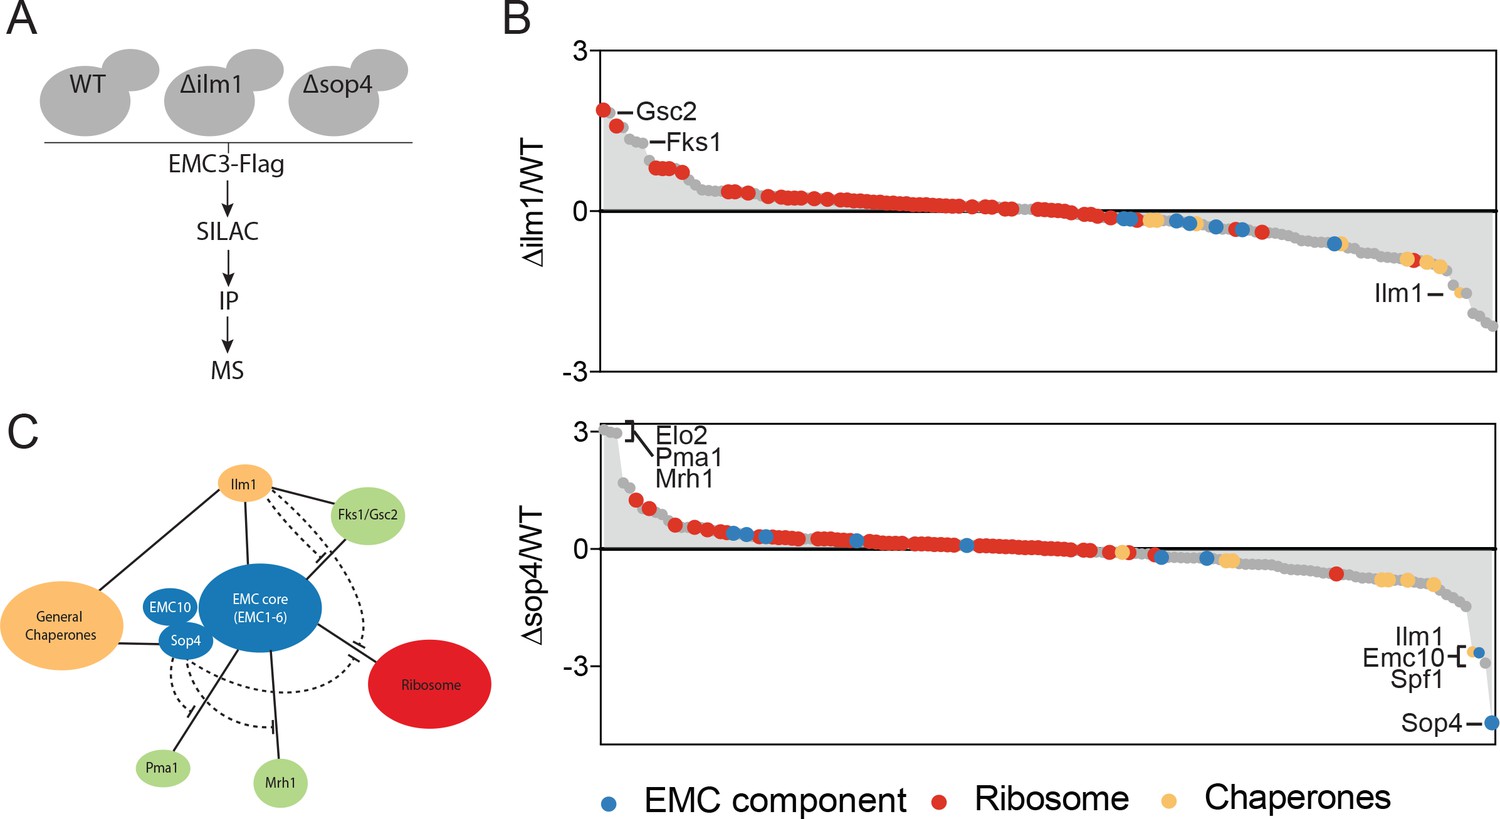
The EMC interacts with multipass client proteins independent of co-chaperones.
(A) Schematic showing SILAC strategy for comparative analysis of EMC3-3xFLAG interactions in wildtype (WT - light) and ∆ilm1 (heavy) and ∆sop4 (heavy) cells. IP – immunoprecipitation, MS – mass spectrometry. (B) Log2 SILAC ratios for all proteins identified in EMC3-FLAG expressing strains (top - ∆sop4 and WT, bottom - ∆ilm1 and WT). Enriched multipass proteins and strongly depleted proteins are indicated. (C) Schematic showing a summary of physical interactions based on pull downs presented in Figures 1 and 2.
Figure 3 with 1 supplement
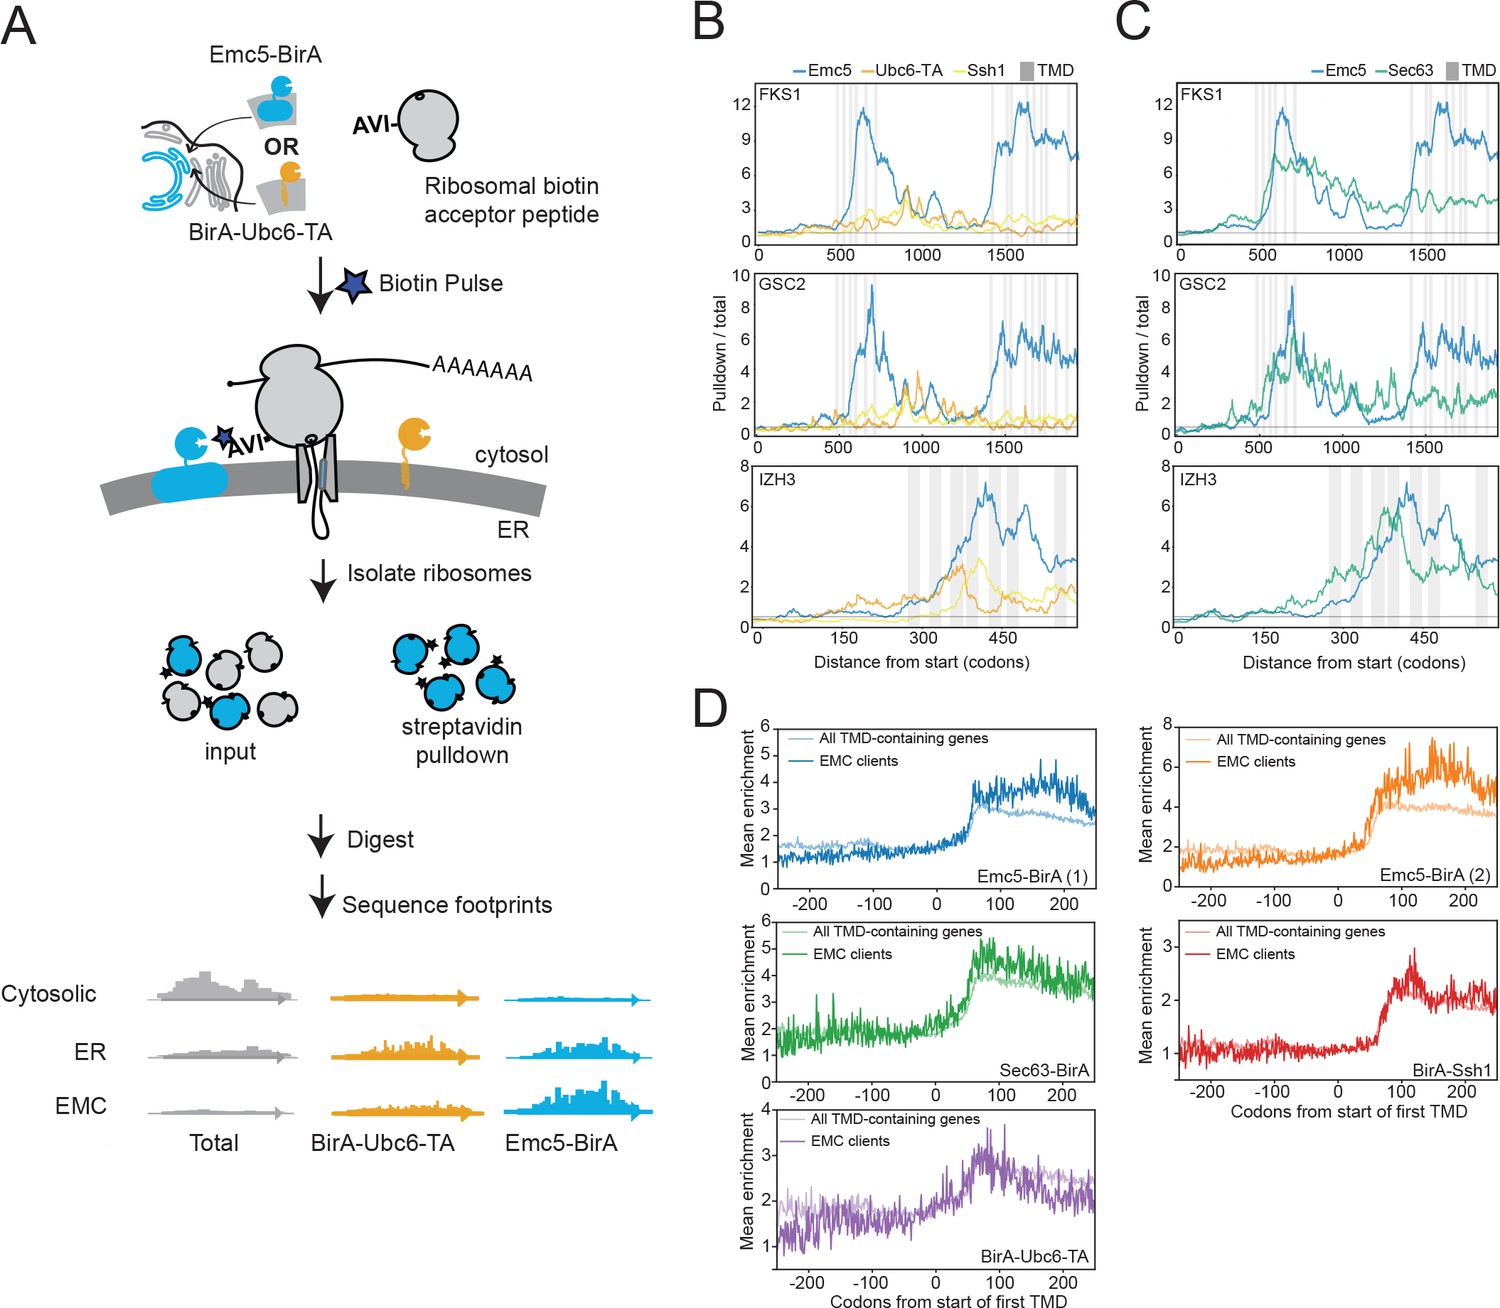
The EMC engages client proteins cotranslationally.
(A) Schematic for strategy to examine the role of the EMC (Emc5-BirA) in cotranslational interaction with clients using proximity-specific ribosome profiling. (B) Positional enrichment plots showing footprint reads across the full-length mRNAs of the genes indicated for Emc5-BirA, BirA-Ubc6-TA and Ssh1-BirA expressing strains. Transmembrane domains (TMDs) are indicated in gray. (C) As in (B), except comparing Emc5-BirA and Sec63-BirA expressing strains. (D) Mean enrichments of all TMD-containing genes and EMC clients (N = 51) following start of first TMD for two independent replicates of Emc5-BirA, Sec63-BirA, BirA-Ssh1 and BirA-Ubc6-TA.
-
Figure 3—source data 1
Positional enrichment plots across genes in the >90th percentile for Emc5-BirA/Ubc6-BirA 101 codon window enrichments.
- https://doi.org/10.7554/eLife.37018.006
Figure 3—figure supplement 1
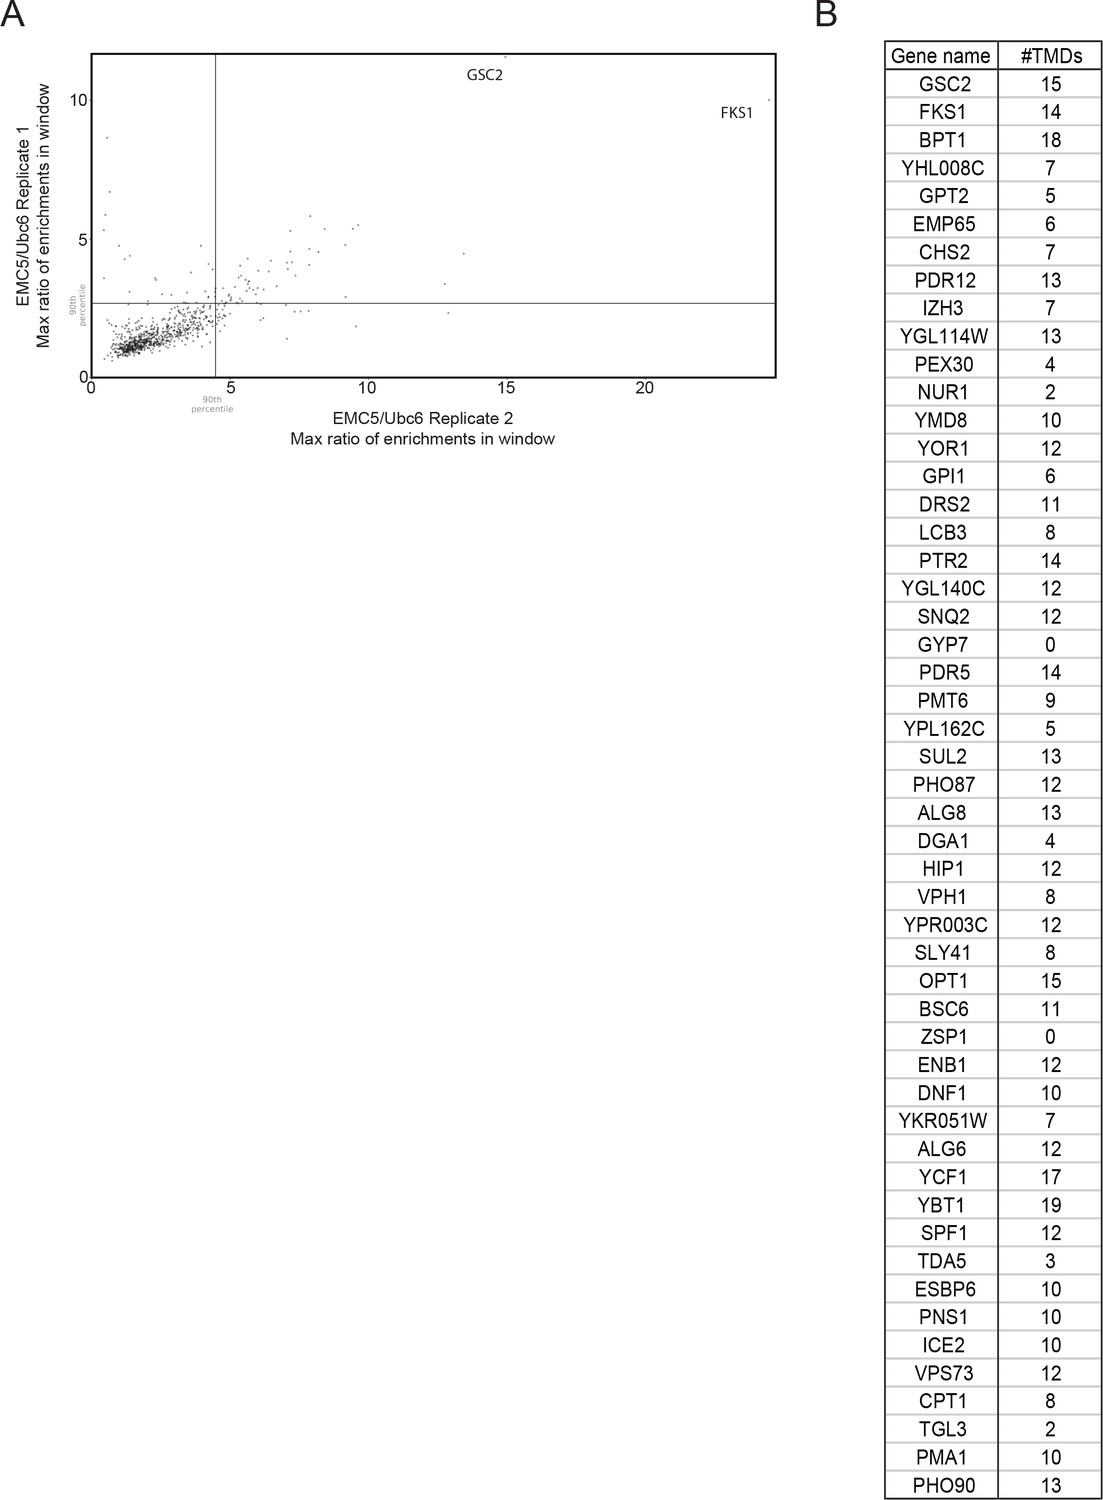
Maximum 101-codon EMC/Ubc6 enrichment ratio windows from two independent Emc5-BirA replicates.
(A) Scatterplot of maximum 101-codon enrichment windows for each gene represented in two independent replicates of Emc5-BirA ribosome profiling. (B) List of genes above the 90th percentile in both replicates.
Figure 4

EMC clients are enriched for multipass membrane proteins with sub-optimal transmembrane helices.
(A) Histogram showing the proportion of proteins containing the given number of TMDs for all proteins that enter the secretory pathway (Uniprot annotations) and EMC clients. (B) Fraction of amino acids with the given properties in TMDs from EMC client proteins compared to all secretory proteins. Proportion of EMC TMD amino acids/all TMDs for each property is shown by a blue line. Blue boxes indicate 95% confidence ranges defined by 10,000 random sub-samplings of total TMDs with a pool size equal to EMC TMDs (N = 51). (C) Top non-redundant over-represented GOMF terms calculated from PANTHER (FDR < 0.05; redundant terms removed by REViGO). Inset: PANTHER protein classifications pie chart for all clients (N = 51).
Figure 5 with 2 supplements
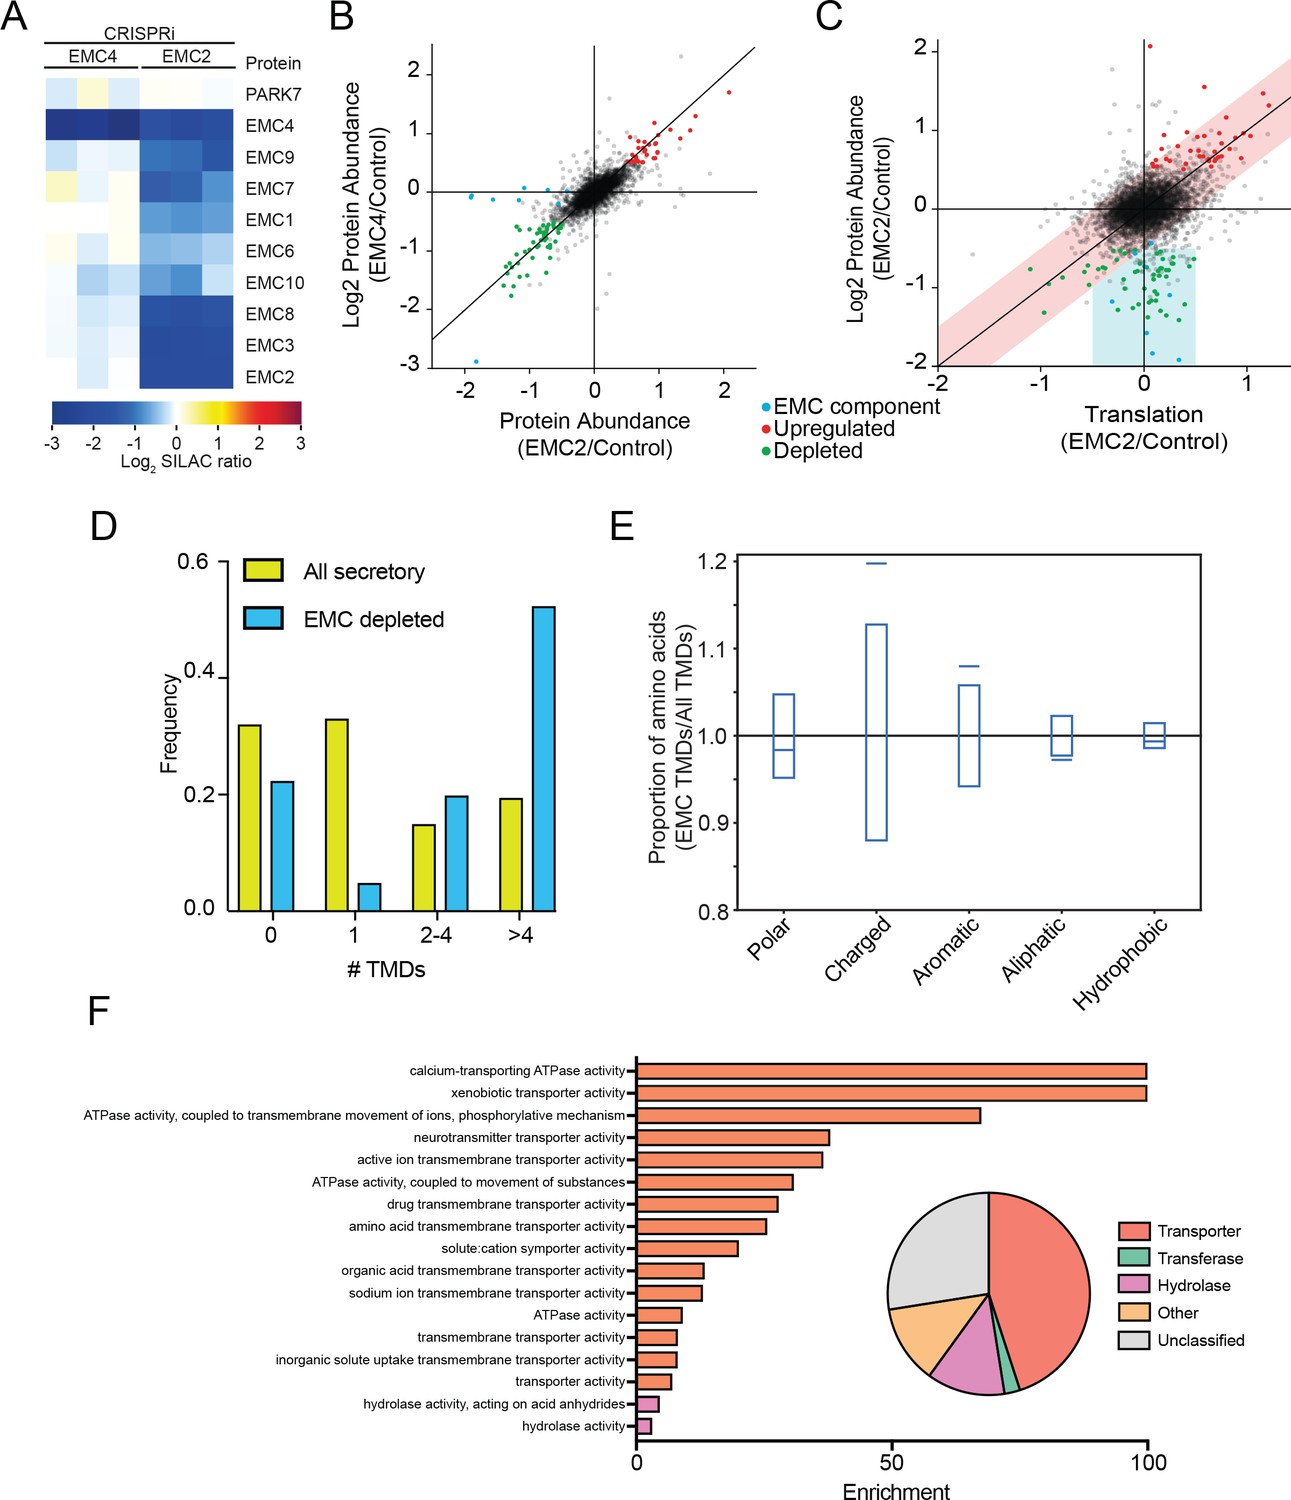
The mammalian EMC stabilizes multipass transmembrane proteins.
(A) SILAC quantification of EMC components, comparing their expression level in cells with guide RNAs targeting EMC2 or EMC4 with those expressing non-targeting GAL4 guide RNA. PARK7 is shown as a control (Wiśniewski and Mann, 2016). (B) Full proteome comparison scatter plot of protein abundance change in cells expressing EMC2 guide RNA against abundance change in cells expressing EMC4 guide. Expression is relative to non-targeting GAL4 guide RNA. Proteins colored red are significantly upregulated in both EMC2 and EMC4 cells. Proteins colored green are significantly downregulated in both EMC2 and EMC4 cells (Log2 >0.5). EMC components are colored blue. (C) Comparison of translation change by ribosome profiling with proteome change. (D) Histogram showing the proportion of proteins containing the given number of TMDs for all proteins that enter the secretory pathway (as defined in Uniprot) and EMC clients. (E) Fraction of amino acids with the given properties in TMDs from EMC client proteins compared to all secretory proteins. Proportion of EMC TMD amino acids/all TMDs for each property is shown by a blue line. Blue boxes indicate 95% confidence ranges defined by 10,000 random sub-samplings of total TMDs with a pool size equal to EMC TMDs (N = 37). (F) Top non-redundant over-represented GOMF terms calculated from PANTHER (FDR < 0.05; redundant terms removed by REViGO). Inset: Protein classifications pie chart for EMC client proteins (N = 37).
Figure 5—figure supplement 1
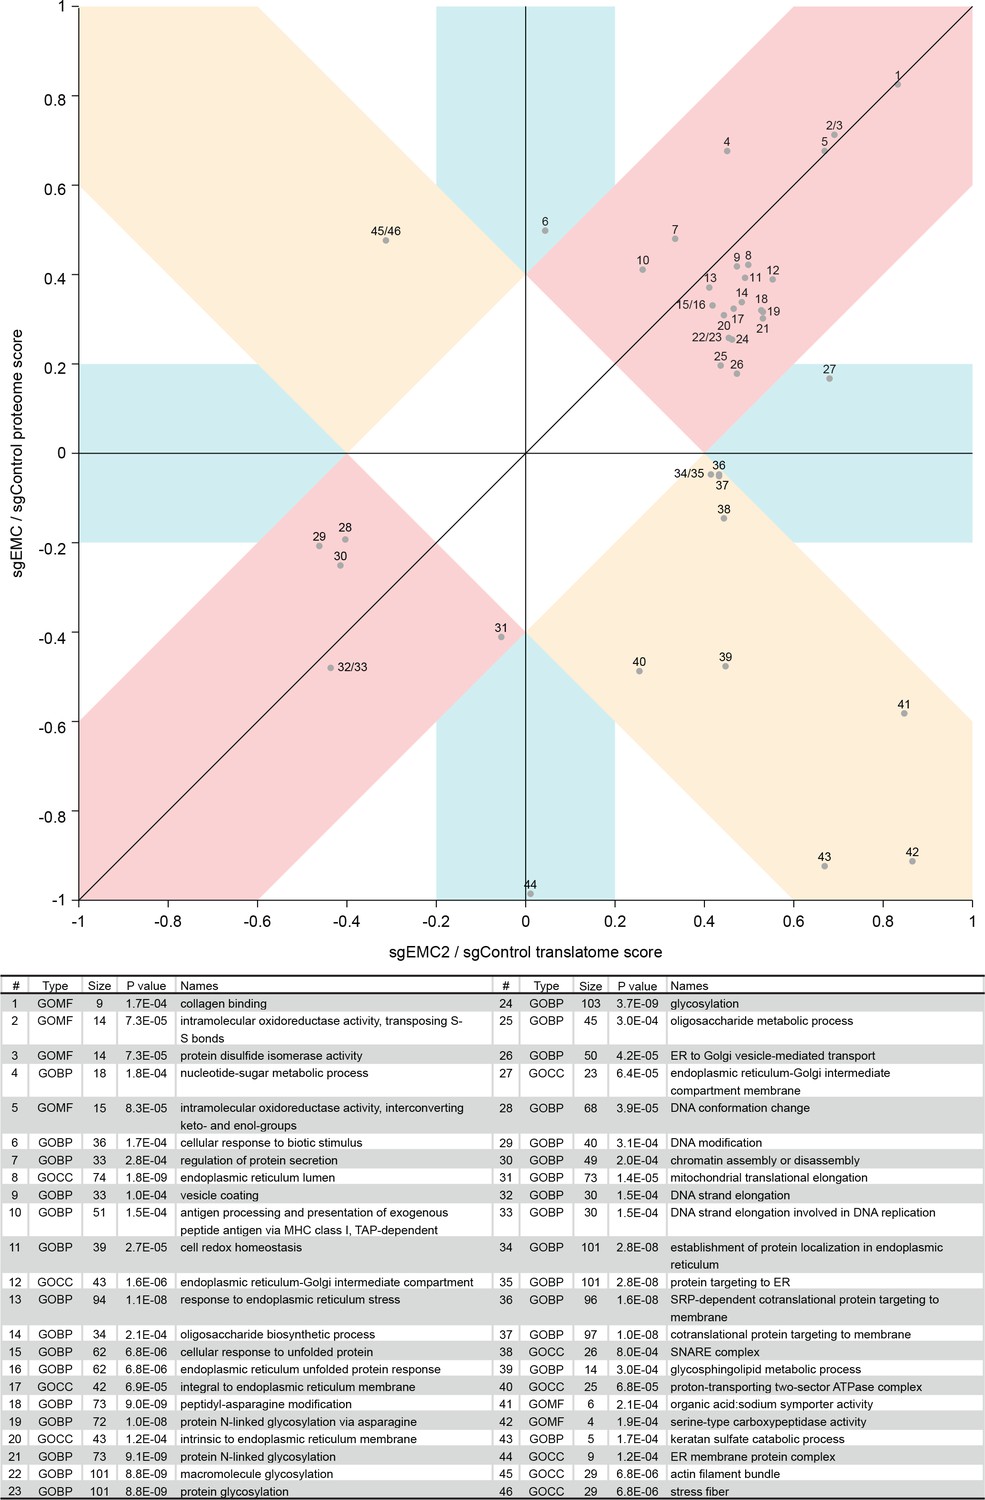
2D annotation enrichment based on the protein ratios and ribosome profiling ratios of EMC knockdown versus control knockdown cells.
Each point relates to a GO term whose corresponding protein or RNA expression values are significantly skewed in their distribution compared to the global distribution of the values for all proteins. The position on the plot relates to how the distribution is skewed, for example point one is concordantly upregulated at both the RNA and protein level in EMC2 knockdown cells.
Figure 5—figure supplement 2
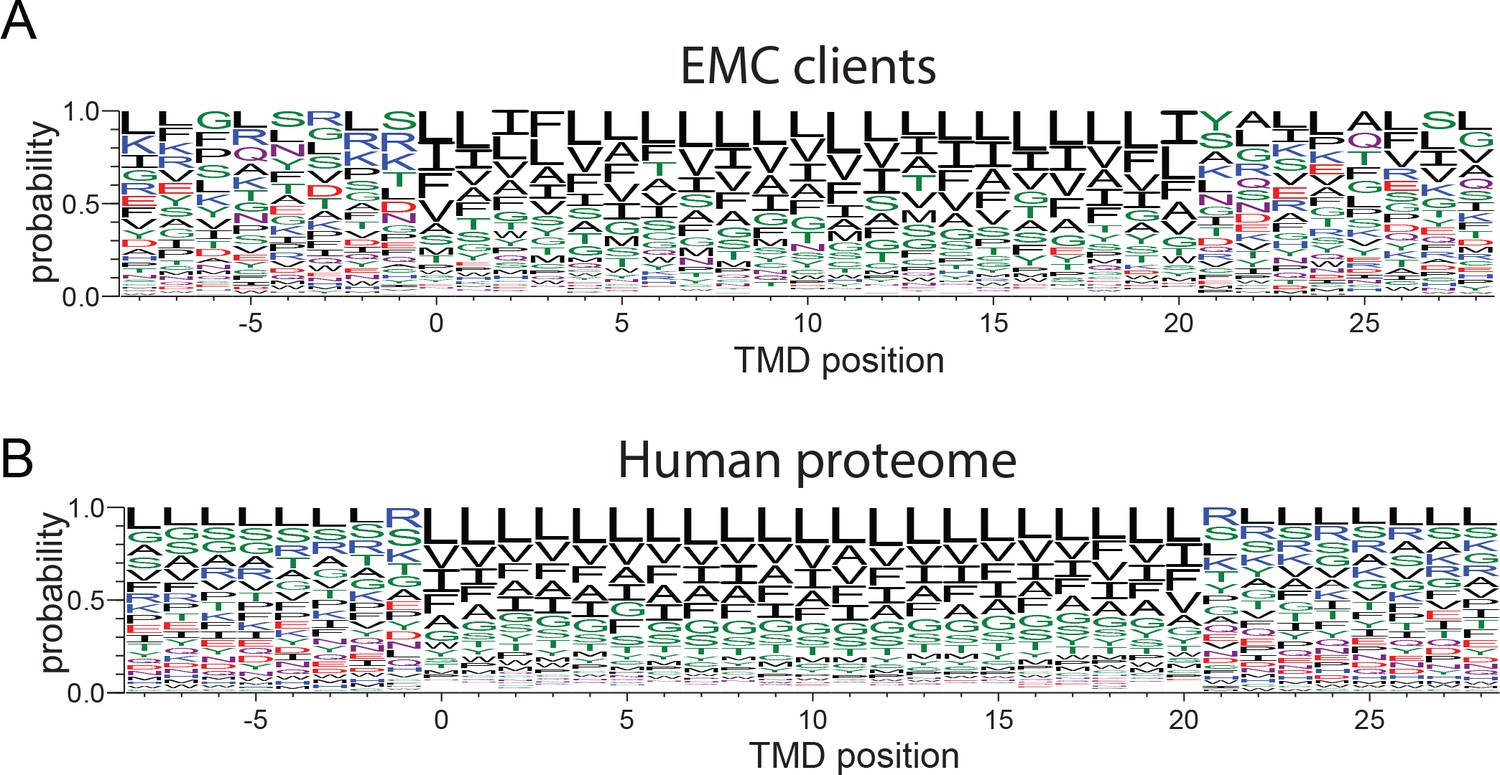
Amino acid composition of transmembrane domains of EMC clients and background.
(A,B) Weblogos of amino acid frequencies at positions along transmembrane domains of EMC clients (A) and transmembrane domains in the total human proteome (B).
Figure 6
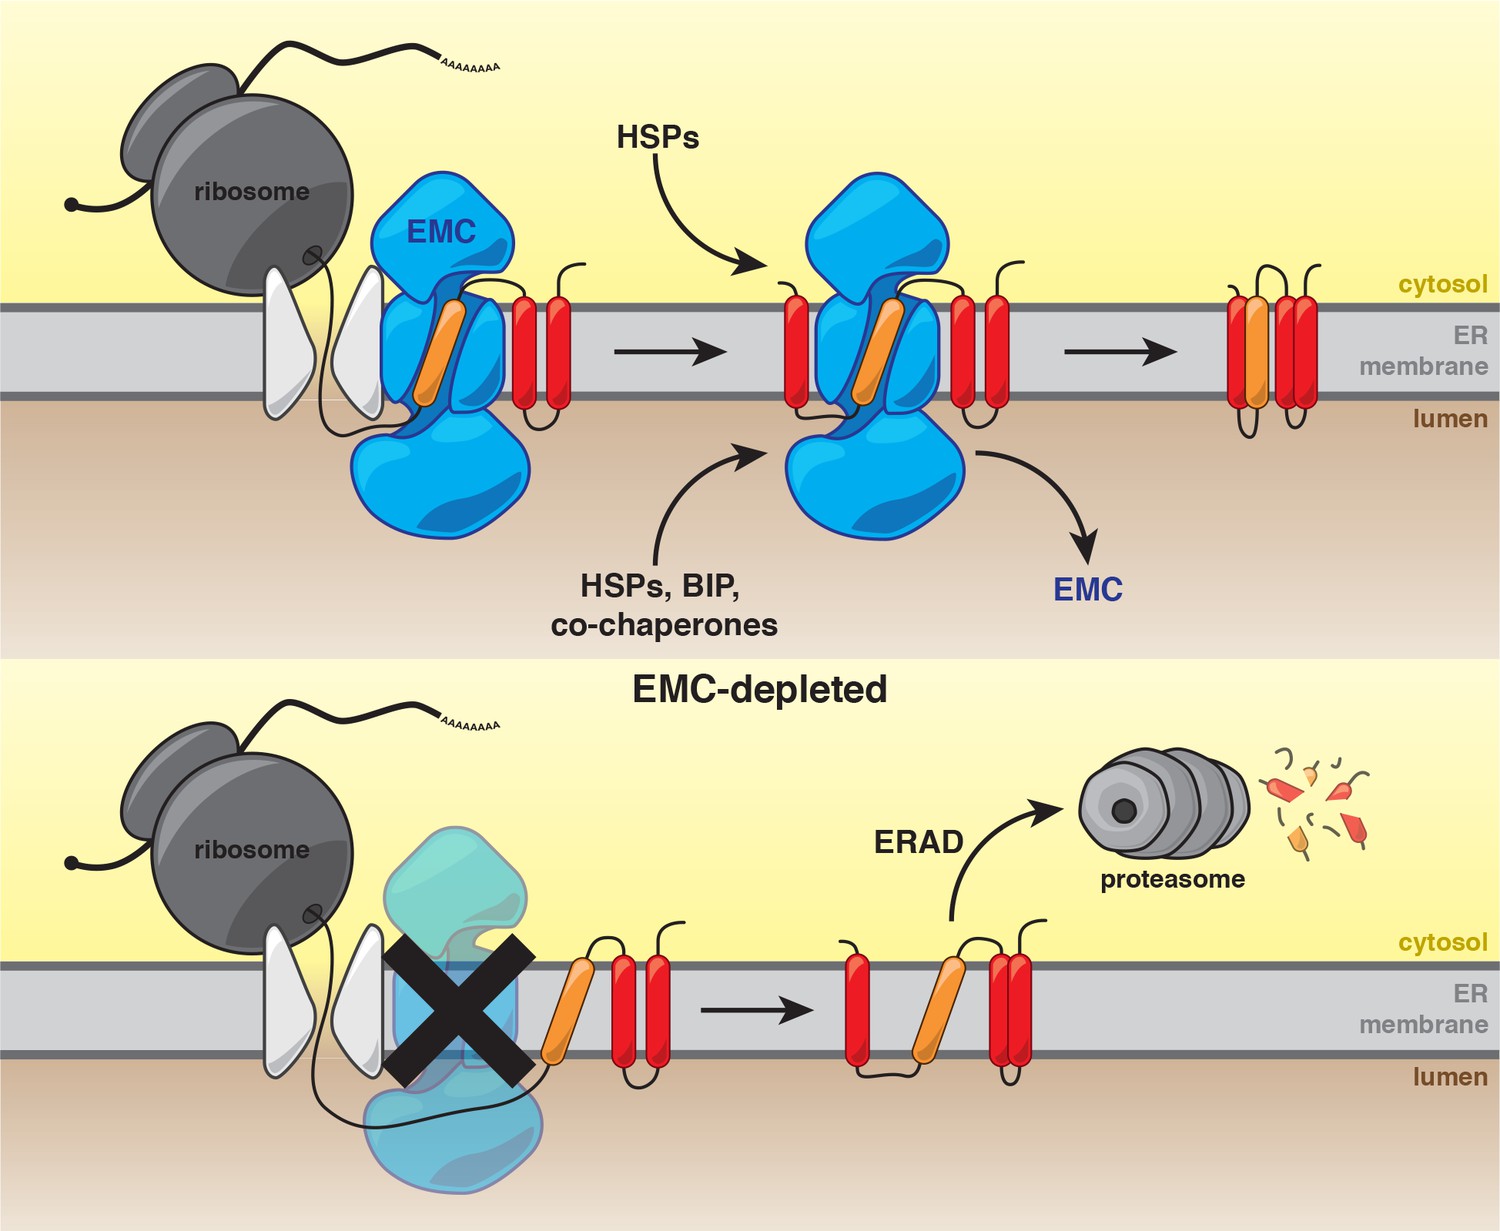
Model for the role of the EMC in multipass transmembrane protein biogenesis.
See text for details. Unstable transmembrane domains are shown in orange. Note, while the EMC is depicted here as cooperating with the translocon following insertion, our data do not exclude the possibility that the EMC acts as an insertase for some substrates.
Additional files
-
Supplementary file 1
EMC client proteins identified by mass spectrometry.
The number of transmembrane domains (TMDs), whether the protein enters the secretory pathway based on Uniprot annotation and the Log2 fold changes in protein abundance in EMC2 or EMC4 depleted cells compared to control cells expressing a non-targeting sgRNA (GAL4).
- https://doi.org/10.7554/eLife.37018.012
-
Supplementary file 2
Transmembrane domain annotations in yeast.
A list of all transmembrane domains annotated in the yeast proteome for analyses performed in Figure 3. See Materials and methods for details on TMD annotation.
- https://doi.org/10.7554/eLife.37018.013
-
Transparent reporting form
- https://doi.org/10.7554/eLife.37018.014
Download links
A two-part list of links to download the article, or parts of the article, in various formats.
Downloads (link to download the article as PDF)
Open citations (links to open the citations from this article in various online reference manager services)
Cite this article (links to download the citations from this article in formats compatible with various reference manager tools)
The ER membrane protein complex interacts cotranslationally to enable biogenesis of multipass membrane proteins
eLife 7:e37018.
https://doi.org/10.7554/eLife.37018


