Altered bone growth dynamics prefigure craniosynostosis in a zebrafish model of Saethre-Chotzen syndrome
- University of Southern California, United States
Figures
Figure 1 with 3 supplements

Coronal suture loss in tcf12; twist1b mutant zebrafish.
(A) Diagrams of zebrafish, mouse, and human skulls, with neural crest contributions in turquoise and mesoderm contributions in gold. The coronal suture is at a mesoderm-mesoderm boundary in zebrafish and a neural-crest-mesoderm boundary in mouse and human. Instead of a suture, an epiphyseal bar cartilage (eb) is present at the neural-crest-mesoderm boundary in zebrafish. ms, metopic suture; ss, sagittal suture. (B) Dissected skullcaps of adult fish stained with Alizarin Red show loss of the coronal suture (asterisks) in tcf12-/-; twist1b-/- double mutants but not single mutants. Scale bar, 1 mm. (C) Micro-CT scans of adult fish heads show unilateral (left) and bilateral (right) coronal suture loss in tcf12-/-; twist1b-/- mutants. Shading indicates bone derived from neural crest (turquoise) and mesoderm (gold). Panels below are digital sections through the coronal sutures indicated by the dotted lines above. Arrowhead indicates the wild-type suture. (D) Hematoxylin and eosin-stained sections show loss of the coronal suture mesenchyme (arrowhead) in tcf12-/-; twist1b-/- mutants. Scale bar, 100 µm.
Figure 1—figure supplement 1
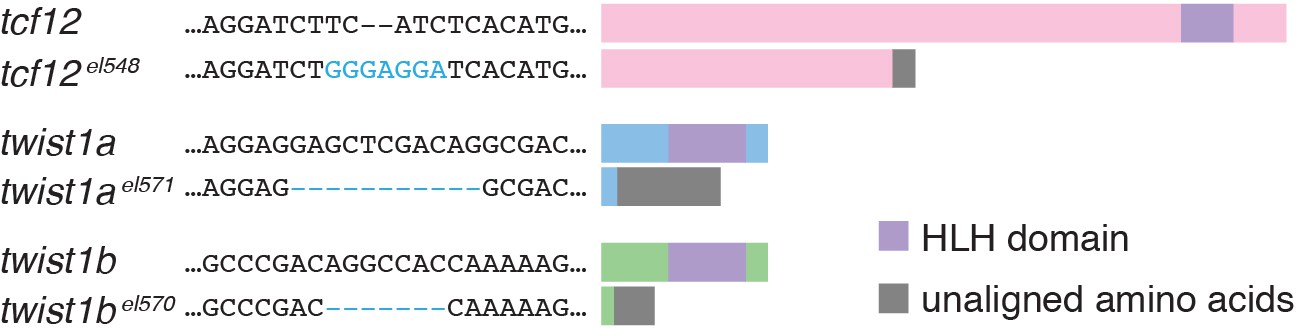
Zebrafish TALEN mutants.
The sites of nucleotide changes induced by TALEN cleavage are shown for each mutant allele. Schematics show the predicted protein truncations caused by the frame-shift mutations, relative to the DNA-binding basic helix-loop-helix domain (HLH, purple).
Figure 1—figure supplement 2
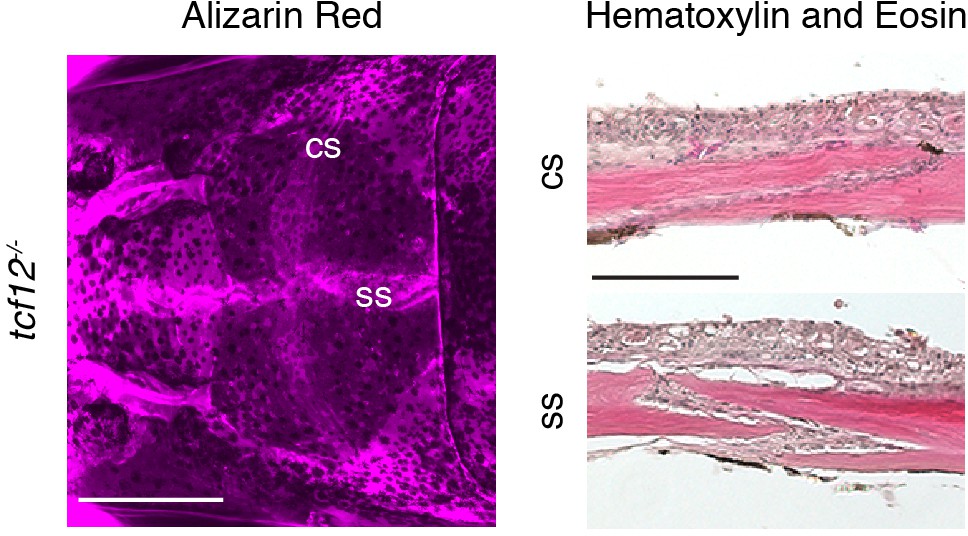
Patent sutures in tcf12 single mutants.
Skull bones of an adult tcf12-/- fish were stained with Alizarin Red. Scale bar, 1 mm. Sections of the coronal suture (cs) and sagittal suture (ss) were stained with hematoxylin and eosin to show presence of suture mesenchyme. Scale bar, 100 µm.
Figure 1—figure supplement 3
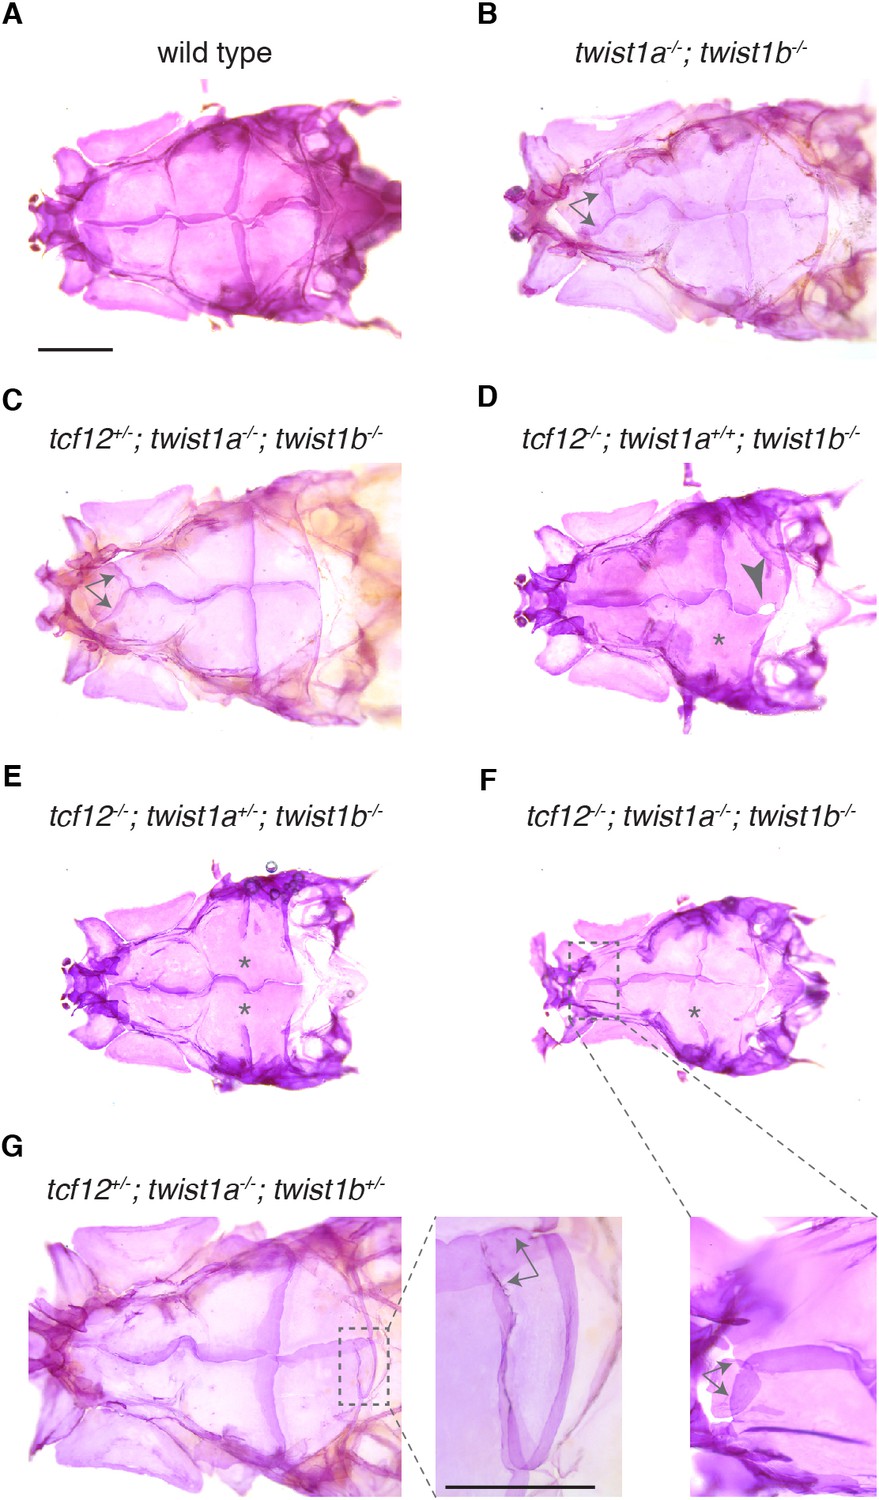
Zebrafish skull phenotypes in different mutant combinations.
Dorsal views of adult zebrafish skull bones stained with Alizarin Red. We observed coronal suture loss (asterisks) in tcf12-/-; twist1b-/- mutants of any twist1a genotype (D–F). Animals lacking both Twist1 homologs occasionally develop ectopic sutures (arrows) in the anterior frontal bone region (B,C, enlarged in F). We also occasionally observed gaps (arrowhead, (D) and ectopic sutures (arrows, enlarged in G) in the posterior region of the parietal bone. Scale bars, 1 mm.
Figure 2
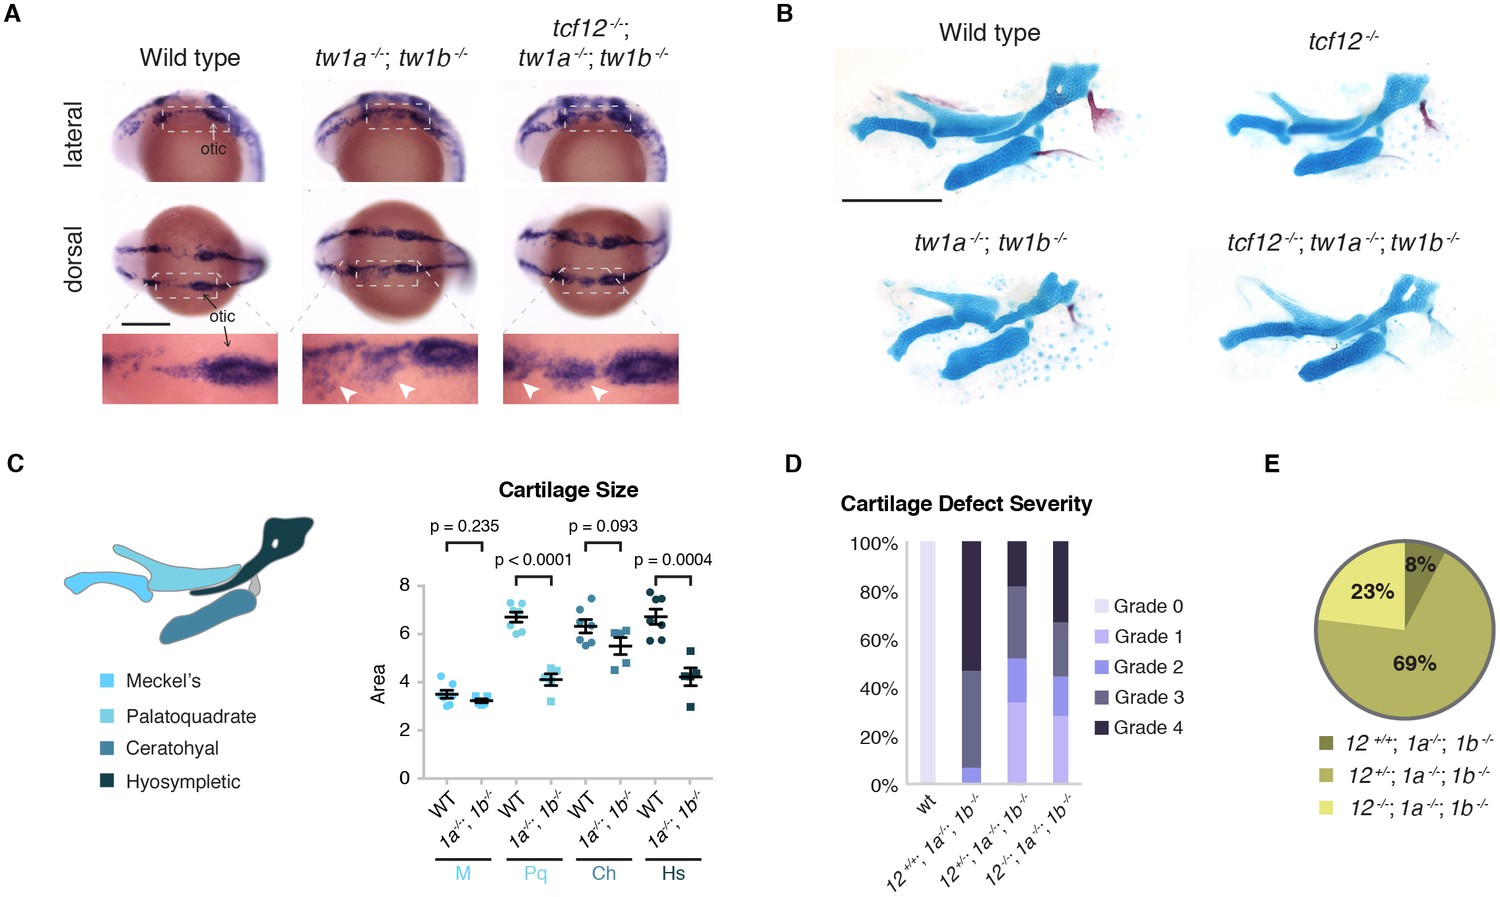
Loss of tcf12 partially rescues twist1a; twist1b jaw cartilage defects and viability.
(A) In situ hybridizations at 20 hpf show abnormal persistence of sox10 expression in arch ectomesenchyme (boxed region) in twist1a-/-; twist1b-/- and tcf12-/-; twist1a-/-; twist1b-/- mutants. Arrowheads indicate persistent sox10 expression in arches. (B) Unilateral dissections of the first and second arch skeletons stained with Alcian Blue (cartilage) and Alizarin Red (bone) at 5 dpf. Compared to the reductions of the upper facial skeleton in twist1a-/-; twist1b-/- mutants, tcf12-/-; twist1a-/-; twist1b-/- triple mutants display less severe defects. Scale bars, 250 µm. (C) Quantitation of wild-type and twist1a-/-; twist1b-/- jaw cartilage areas show specific reductions in more dorsal cartilages, the palatoquadrate (Pq) and hyosympletic (Hs). M, Meckel’s cartilage; Ch, ceratohyal. (D) Qualitative scoring of facial skeletal defects from Grade 0 (unaffected) to Grade 4 (most affected). Loss of one or two copies of tcf12 improved the facial skeletal morphology of twist1a-/-; twist1b-/- mutants. Wild type (wt, n = 20), twist1a-/-; twist1b-/- (12+/+, 1a-/-, 1b-/-, n = 25), tcf12+/-; twist1a-/-; twist1b-/- (12+/-, 1a-/-, 1b-/-, n = 32), tcf12-/-; twist1a-/-; twist1b-/- (12-/-, 1a-/-, 1b-/-, n = 22). Using a Fisher’s Exact Test, p=0.0032 for 12+/+, 1a-/-, 1b-/- versus 12-/-, 1a-/-, 1b-/- and p=0.001 for 12+/+, 1a-/-, 1b-/- versus 12+/-, 1a-/-, 1b-/-. (E) Reduction of tcf12 dosage improves adult viability of twist1a-/-; twist1b-/- mutants. From an incross of tcf12+/-; twist1a+/-; twist1b+/- fish, we obtained twist1a-/-; twist1b-/- mutants and assessed their viability to 3 months of age. After genotyping for tcf12, we observed a 4:36:12 ratio of tcf12+/+: tcf12+/-: tcf12-/-, compared to the predicted 13:26:13 ratio, which was significantly skewed as determined by a Chi-squared test (p=0.0062).
-
Figure 2—source data 1
Cartilage size in twist1a;twist1b mutants.
- https://doi.org/10.7554/eLife.37024.008
-
Figure 2—source data 2
Severity of cartilage defects in combinatorial Twist1 and Tcf12 mutants.
- https://doi.org/10.7554/eLife.37024.009
-
Figure 2—source data 3
Adult viability of combinatorial Twist1 and Tcf12 mutants.
- https://doi.org/10.7554/eLife.37024.010
Figure 3
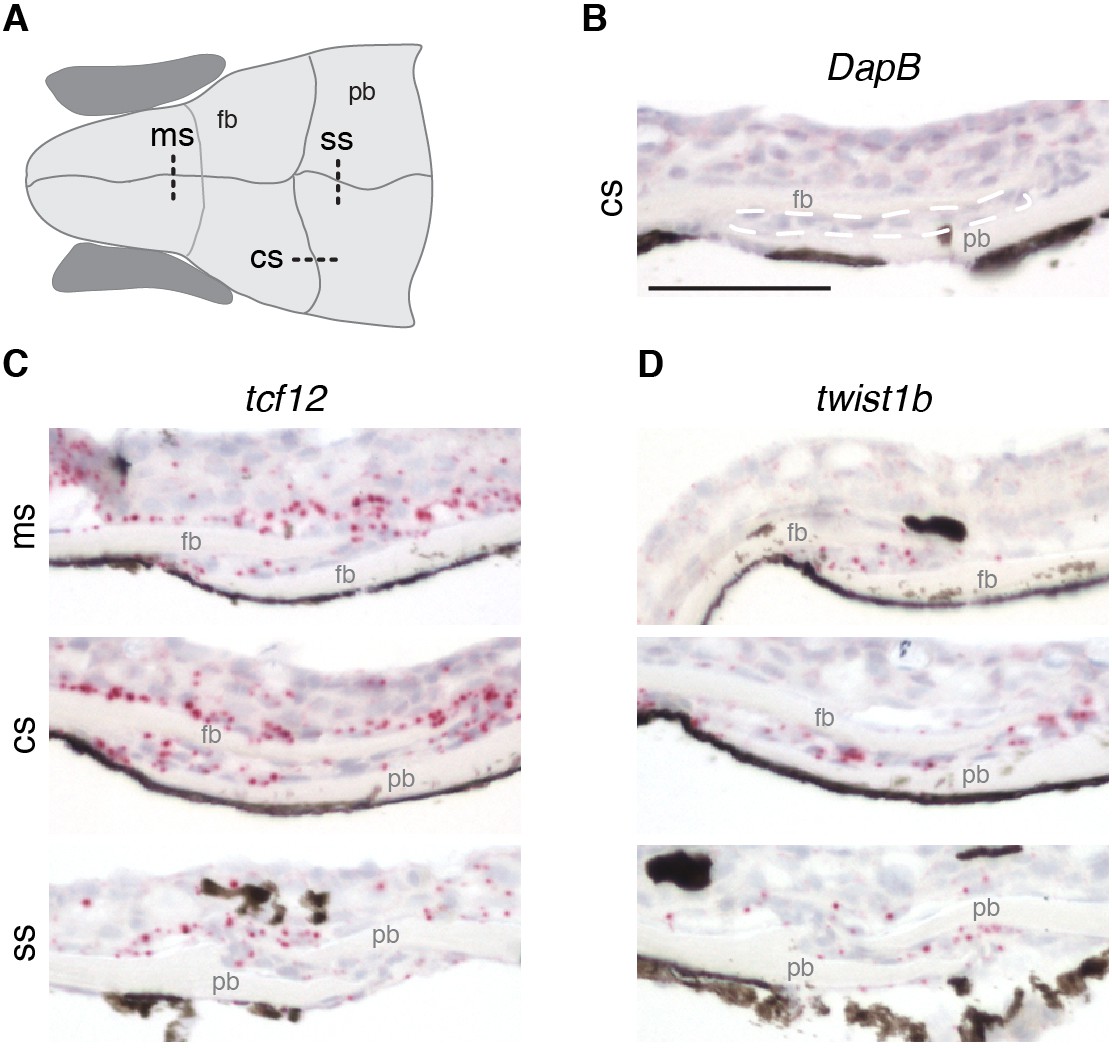
Expression of tcf12 and twist1b in multiple sutures of zebrafish.
(A) Schematic of the zebrafish skull depicting positions of sections (dotted lines) used for RNAscope in situ hybridizations. cs, coronal suture; ms, metopic suture; ss, sagittal suture; fb, frontal bone; pb, parietal bone. (B–D) In situ hybridizations on sections taken from zebrafish at 14 mm standard length. Red puncta indicate positive expression. DapB (B) was included as a negative control, with suture mesenchyme outlined in a dashed white line for reference. Expression of tcf12 (C) and twist1b (D) was detected in the metopic, coronal and sagittal suture mesenchyme, with tcf12 also expressed broadly outside the sutures. n = 3 for each experiment. Scale bar, 50 µm.
Figure 4
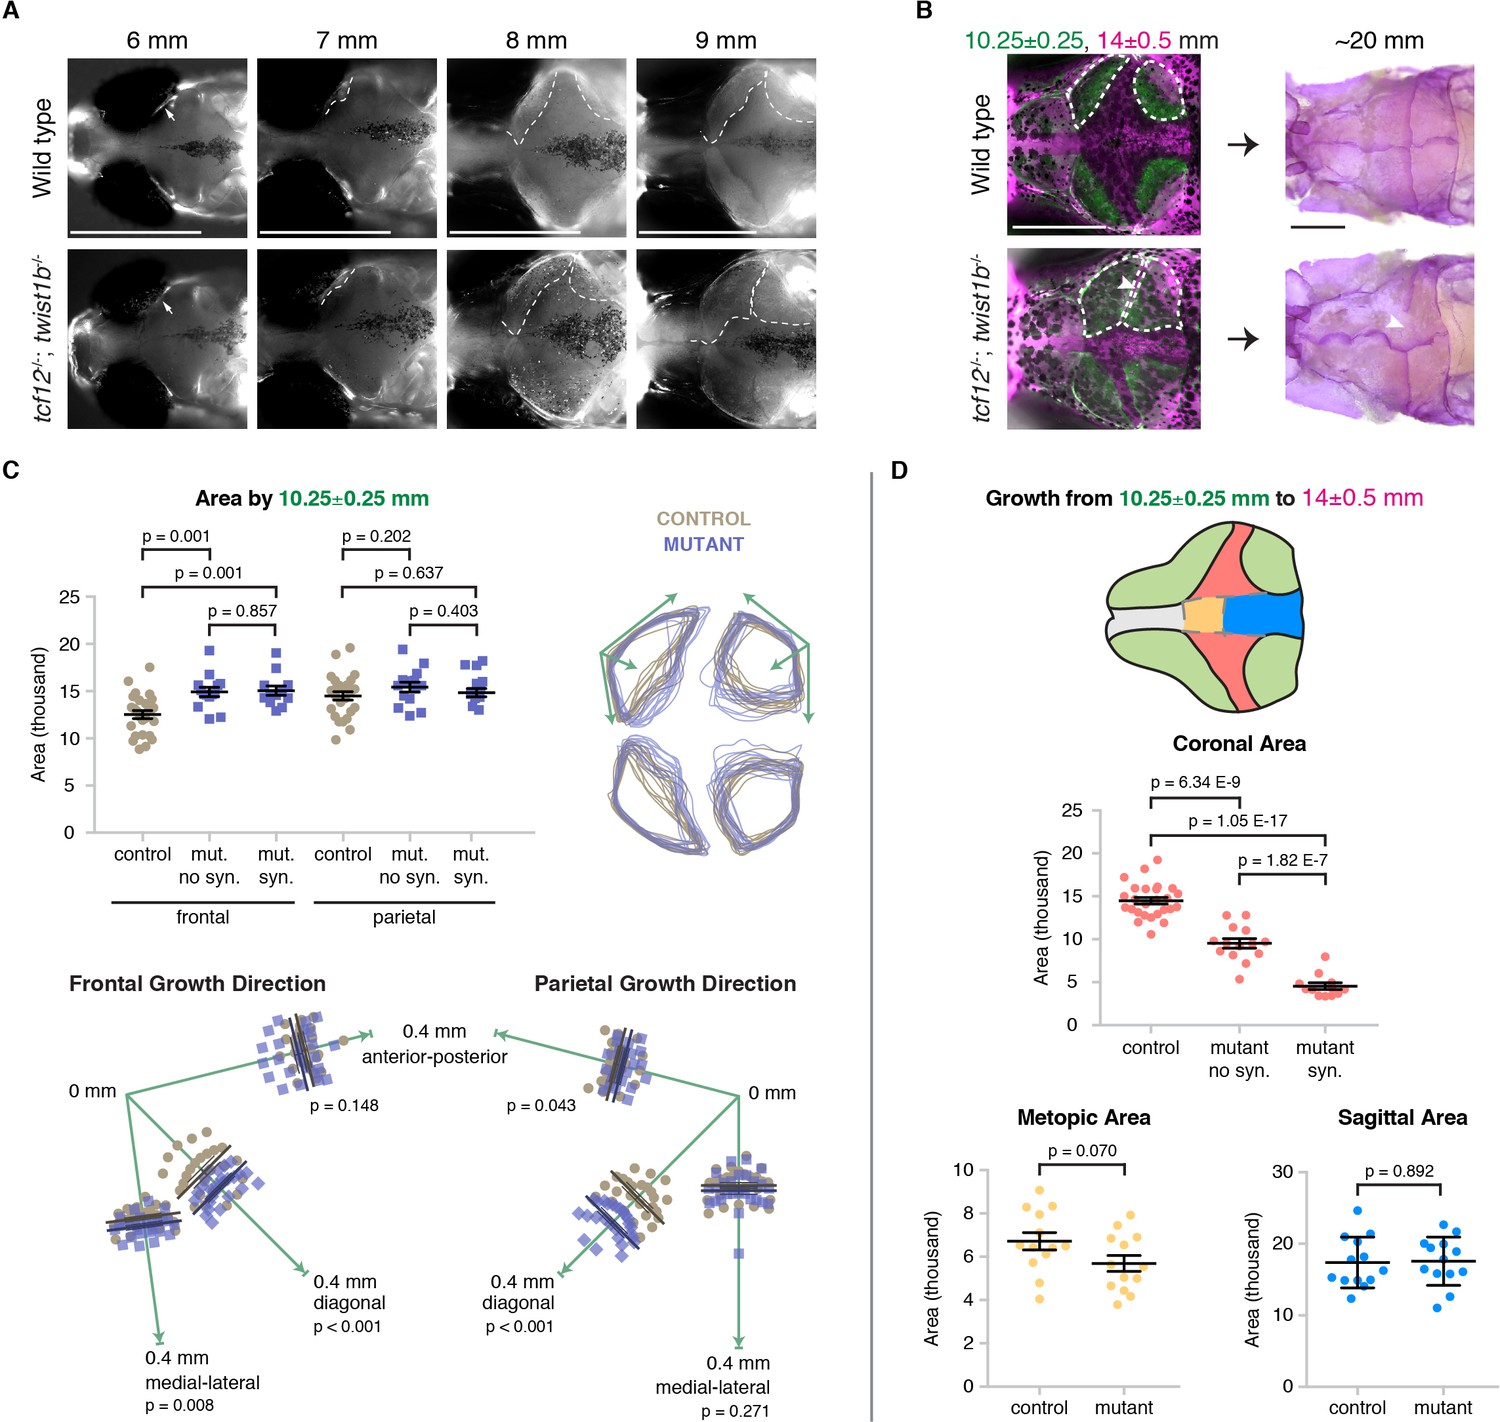
Altered bone growth dynamics precede craniosynostosis in mutant zebrafish.
(A) Dorsal views of the developing skull bones in the same wild-type and mutant individuals across four developmental stages. Live fish were stained with Calcein Green at 6, 7, and 8 mm and Alizarin Red at 9 mm. For the right sides, arrows show initiation of the frontal bone at 6 mm and dashed lines show the frontal (left) and parietal (right) fronts at successive later stages. (B) Individual wild-type and tcf12; twist1b mutant fish were stained with Calcein Green at 10.25 ± 0.25 mm, recovered, and then stained again with Alizarin Red and imaged at 14 ± 0.5 mm. These same fish were then grown to 20 mm, at which stage they were fixed and stained again with Alizarin Red to assess suture patency. White dotted lines indicate bone generated by 10.25 mm. Arrowheads indicate missing coronal suture. Scale bars, 1 mm. (C) Quantification of calvarial bone growth. Bone produced by 10.25 ± 0.25 mm was calculated based on the area (µm) stained with Calcein Green (white outlines in B). At 10.25 mm, compared to control frontal bones (n = 12), tcf12; twist1b mutant frontal bones that developed synostosis later (n = 11) and those that did not (n = 11) showed similar increases in bone formation. Bone shape was assessed by overlaying tracings of posterior frontal bones and parietal bones for wild types and mutants. Specific growth directionality in the anterior-posterior, medial-lateral, and diagonal axes were measured and quantified (green arrows). (D) Bone growth from 10.25 ± 0.25 mm to 14 ± 0.5 mm was analyzed in respect to prospective suture zones. Growth in the metopic (yellow) and sagittal (blue) zones did not differ significantly in controls versus tcf12; twist1b mutants, which correlated with no defects in these sutures in mutants. In contrast, growth in the coronal zone was reduced in tcf12; twist1b mutants, with a more pronounced decrease in mutant sides that later developed synostosis. p values were determined by Student’s t-tests; error bars represent standard error of the mean.
-
Figure 4—source data 1
Quantification of skull bone area in mutants by 10.25 mm.
- https://doi.org/10.7554/eLife.37024.013
-
Figure 4—source data 2
Directionality of bone growth in mutants.
- https://doi.org/10.7554/eLife.37024.014
-
Figure 4—source data 3
Quantification of growth in coronal area.
- https://doi.org/10.7554/eLife.37024.015
-
Figure 4—source data 4
Quantification of growth in metopic area.
- https://doi.org/10.7554/eLife.37024.016
-
Figure 4—source data 5
Quantification of growth in sagittal area.
- https://doi.org/10.7554/eLife.37024.017
Figure 5 with 2 supplements
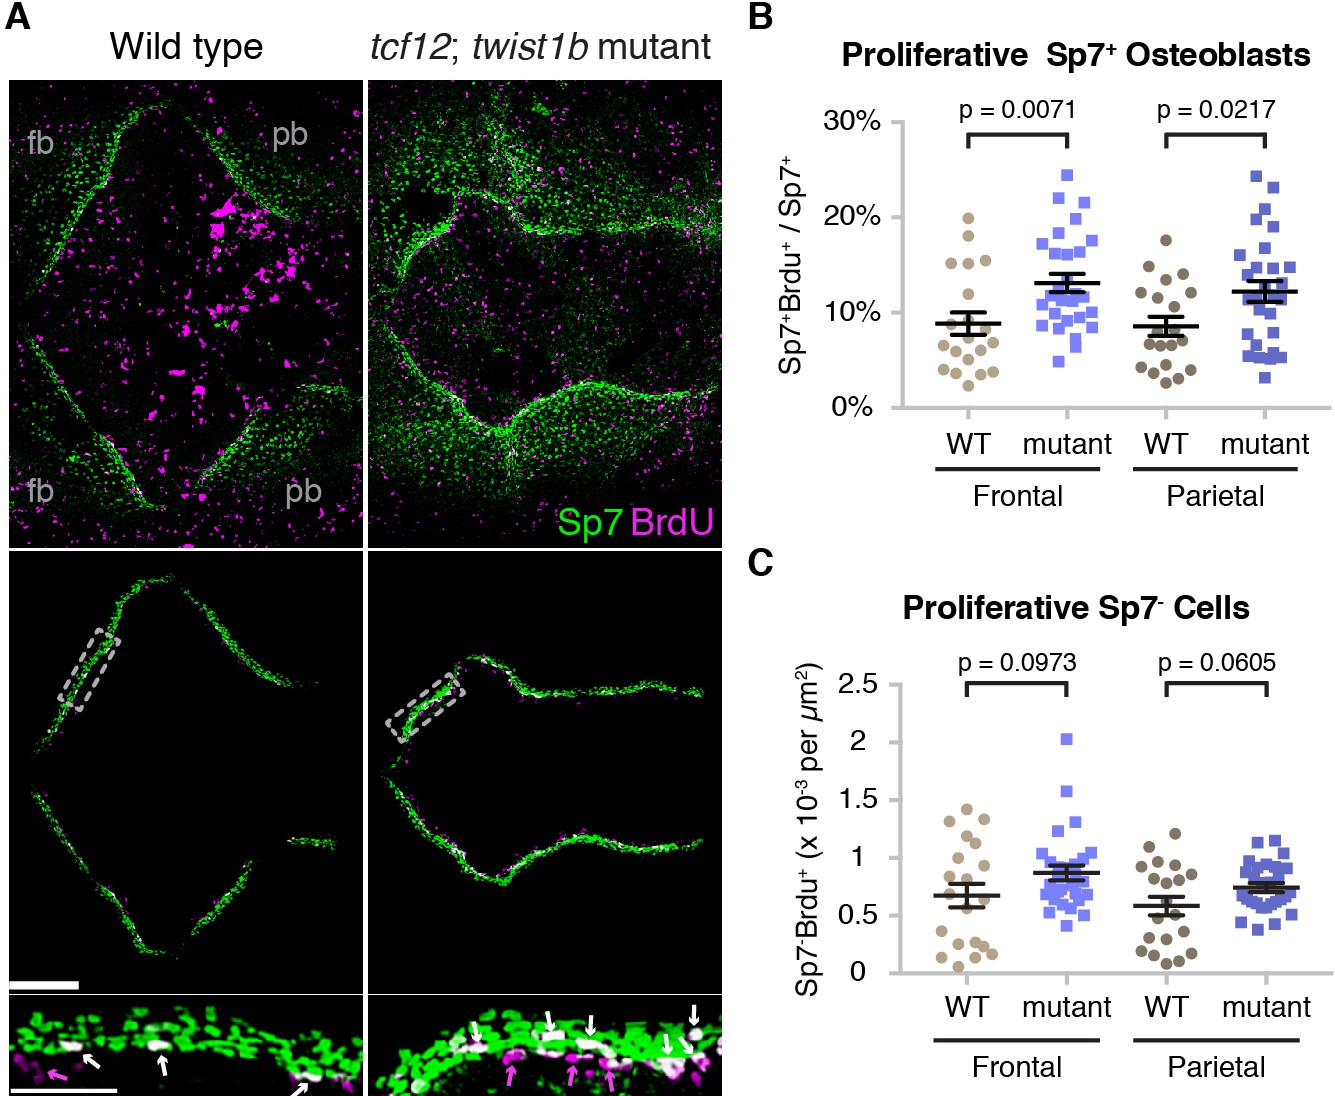
Altered proliferation and osteoblast production at mutant zebrafish bone fronts.
(A) Dissected skullcaps were stained for BrdU (magenta) and Sp7 protein (green) at 9 mm. Top panels show maximum intensity projections of whole skull volumes, and middle panels are the same volumes but processed to extract the bone fronts (note that much of the BrdU staining in the center of the top images is in the skin). Bottom panels show enlarged regions of the osteogenic fronts (dotted rectangles). White arrows show proliferative osteoblasts (BrdU+/Sp7+) and magenta arrows show adjacent proliferative Sp7- cells. fb, frontal bone; pb, parietal bone. Scale bars, 300 µm for whole skull view, 100 µm for enlarged view. (B, C) Based on the extracted osteogenic fronts (middle panels in A), we quantified the percentage of Sp7+ osteoblasts that were BrdU+ (B) and the number of adjacent BrdU+/Sp7- cells per area (C). Wild-type controls, n = 20; tcf12; twist1b mutants, n = 28. p values were determined by a Student’s t-test; error bars represent standard error of the mean.
-
Figure 5—source data 1
Quantification of proliferative sp7+ osteoblasts in mutant zebrafish.
- https://doi.org/10.7554/eLife.37024.021
-
Figure 5—source data 2
Quantification of proliferative sp7- cells in mutant zebrafish.
- https://doi.org/10.7554/eLife.37024.022
Figure 5—figure supplement 1
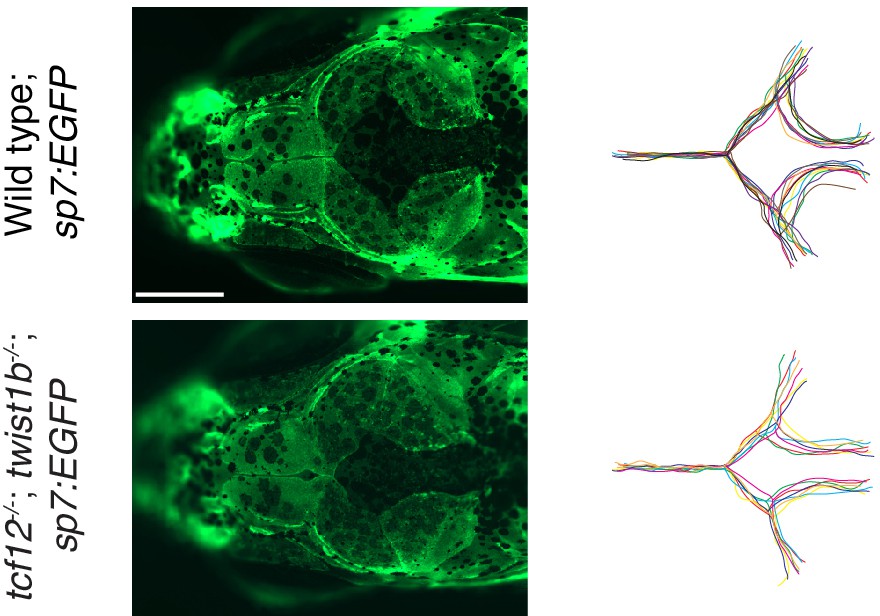
Accelerated bone fronts in tcf12; twist1b mutants transgenic for sp7:EGFP.
Live imaging of sp7:EGFP was performed on wild-type sibling controls (n = 11) and tcf12; twist1b mutants (n = 7) at 10 mm standard length. Dorsal views of the skull bones showed accelerated and dysmorphic bone fronts in all mutants examined. To the right, bone fronts of individual fish were traced and overlaid according to genotype. Scale bar, 250 µm.
Figure 5—figure supplement 2
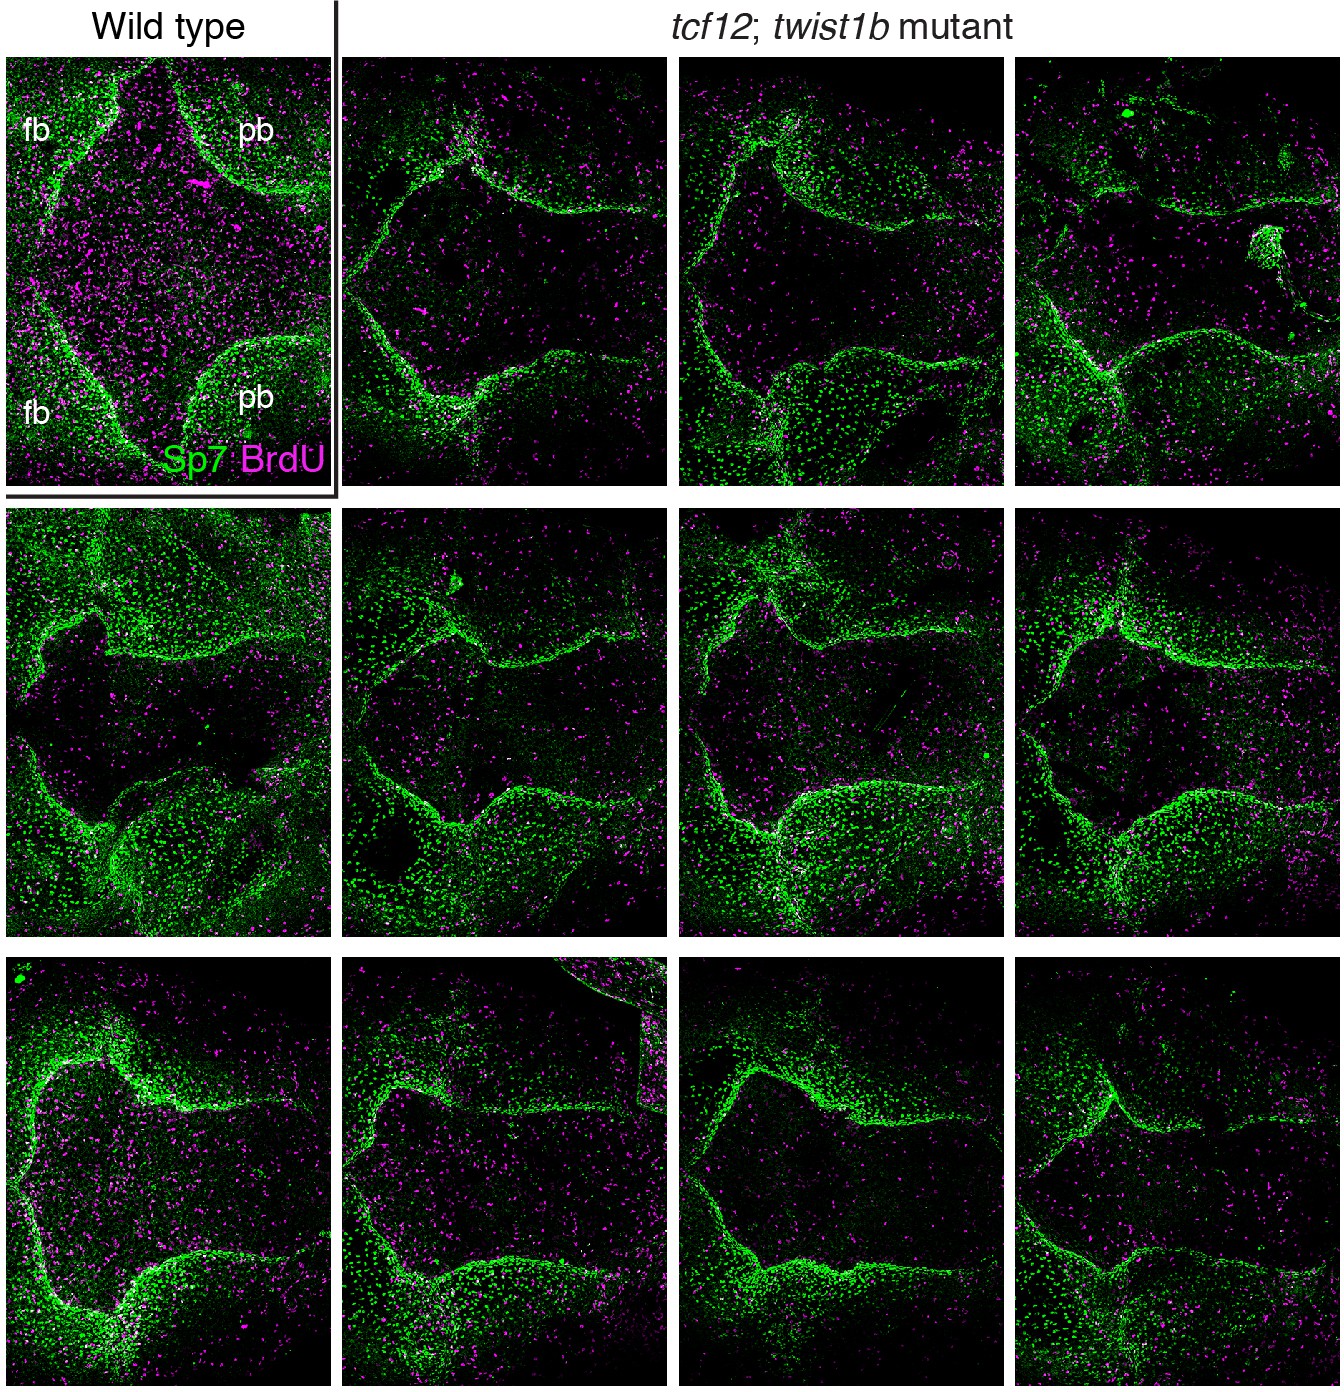
Additional examples of BrdU and Sp7 staining in tcf12; twist1b mutant zebrafish.
Dorsal views of 9 mm zebrafish skullcaps stained with Sp7 antibody (green) and BrdU (magenta) show an array of altered bone shapes in mutants compared to wild type. fb, frontal bone; pb, parietal bone.
Figure 6 with 1 supplement
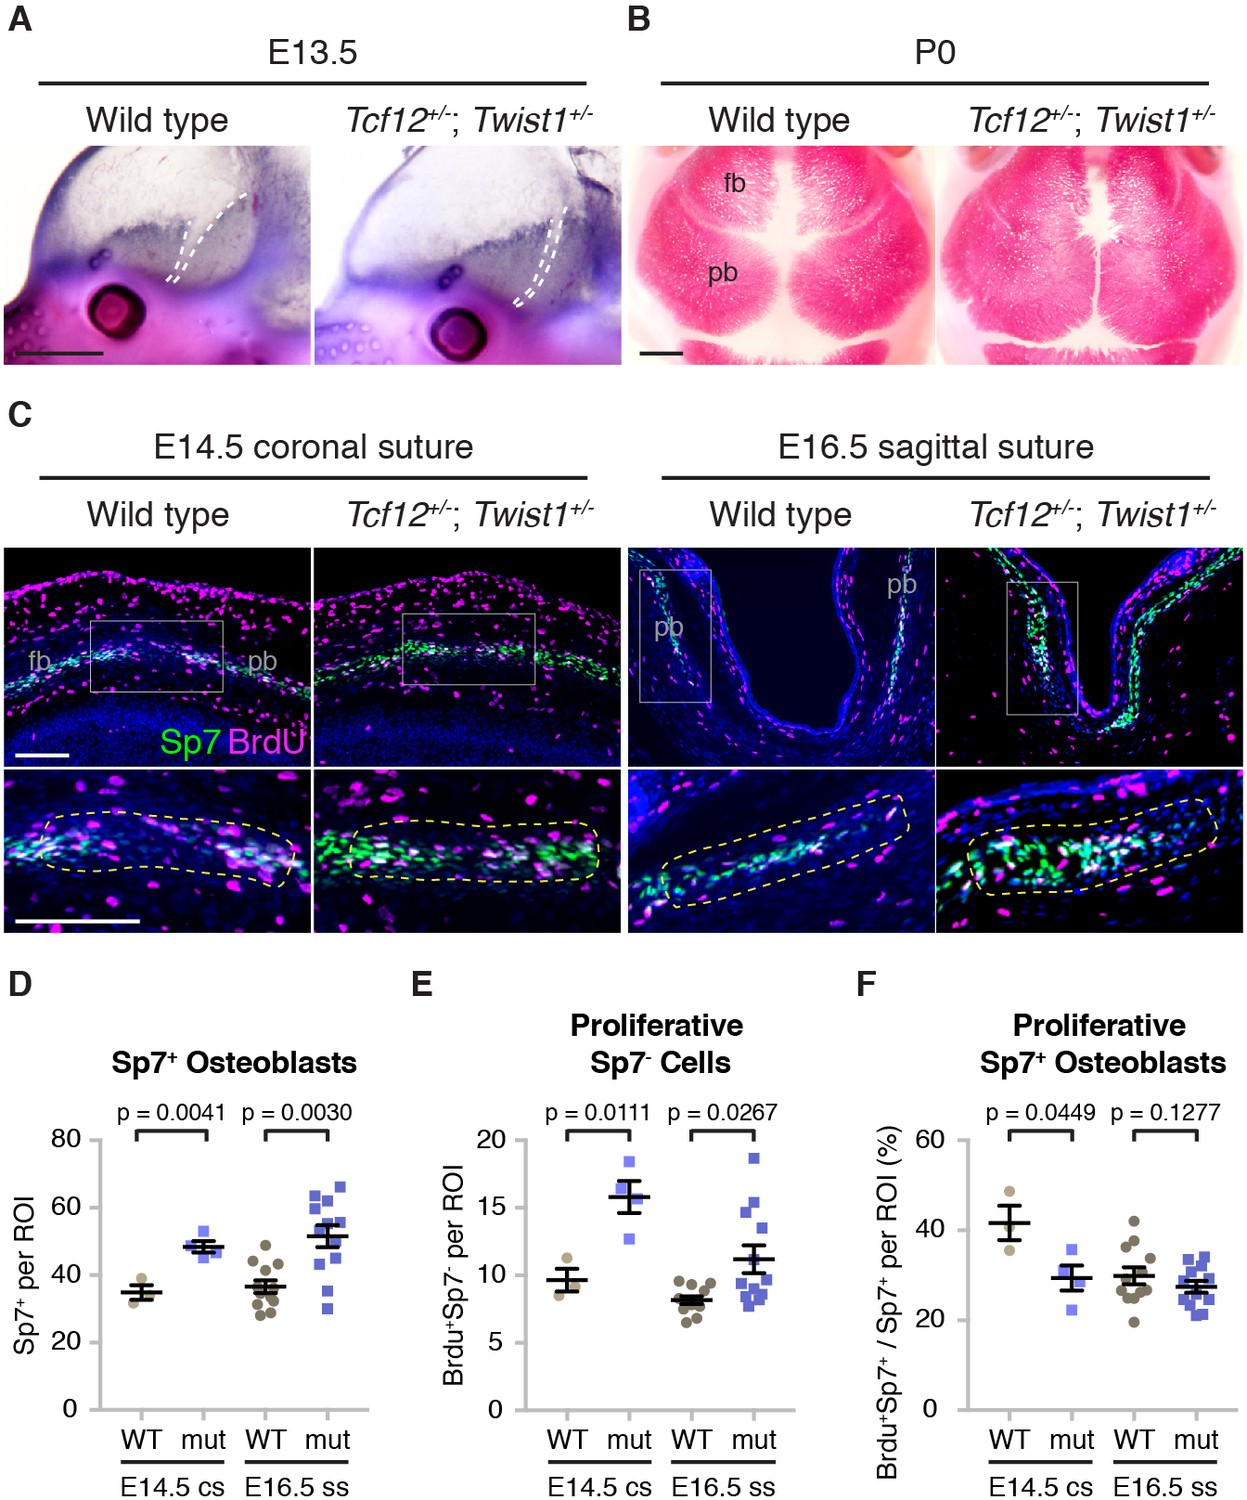
Altered bone growth dynamics in Tcf12+/-; Twist1+/- mice.
(A) Lateral views of E13.5 mouse heads show Alkaline phosphatase staining of developing frontal and parietal bones. Dotted lines indicate the bone fronts that will form the coronal suture. Compared to wild types (n = 5), the fronts were accelerated in all Tcf12+/-; Twist1+/- mutants (n = 12). Scale bar, 1 mm. (B) Dorsal views of skull bones stained with Alizarin Red at birth (P0). Compared to wild types (n = 5), the fronts were closer together in all Tcf12+/-; Twist1+/- mutants (n = 11). Scale bar, 1 mm. (C) Sections of E14.5 coronal sutures and E16.5 sagittal sutures stained for BrdU (magenta), Sp7 protein (green), and DAPI (blue, nuclei). Boxed regions are magnified in lower panels, with yellow dotted lines indicating the regions of interest (ROI) used for quantification. fb, frontal bone; pb, parietal bone. Scale bar, 100 µm. (D–F) Quantification of Sp7+ osteoblasts per ROI (D), BrdU+Sp7- bone front cells per ROI (E), and the percentage of Sp7+ osteoblasts that are BrdU+ in the ROI (F). Cell counts were performed at the developing coronal sutures (cs, four wild types, three mutants) and sagittal sutures (ss, six wild types, six mutants). p values were determined by Student’s t-tests; error bars represent standard error of the mean.
-
Figure 6—source data 1
Quantification of Sp7+ osteoblast number in mutant mice.
- https://doi.org/10.7554/eLife.37024.026
-
Figure 6—source data 2
Quantification of proliferative Sp7- cells in mutant mice.
- https://doi.org/10.7554/eLife.37024.027
-
Figure 6—source data 3
Quantification of proliferative Sp7+ osteoblasts in mutant mice.
- https://doi.org/10.7554/eLife.37024.028
Figure 6—figure supplement 1
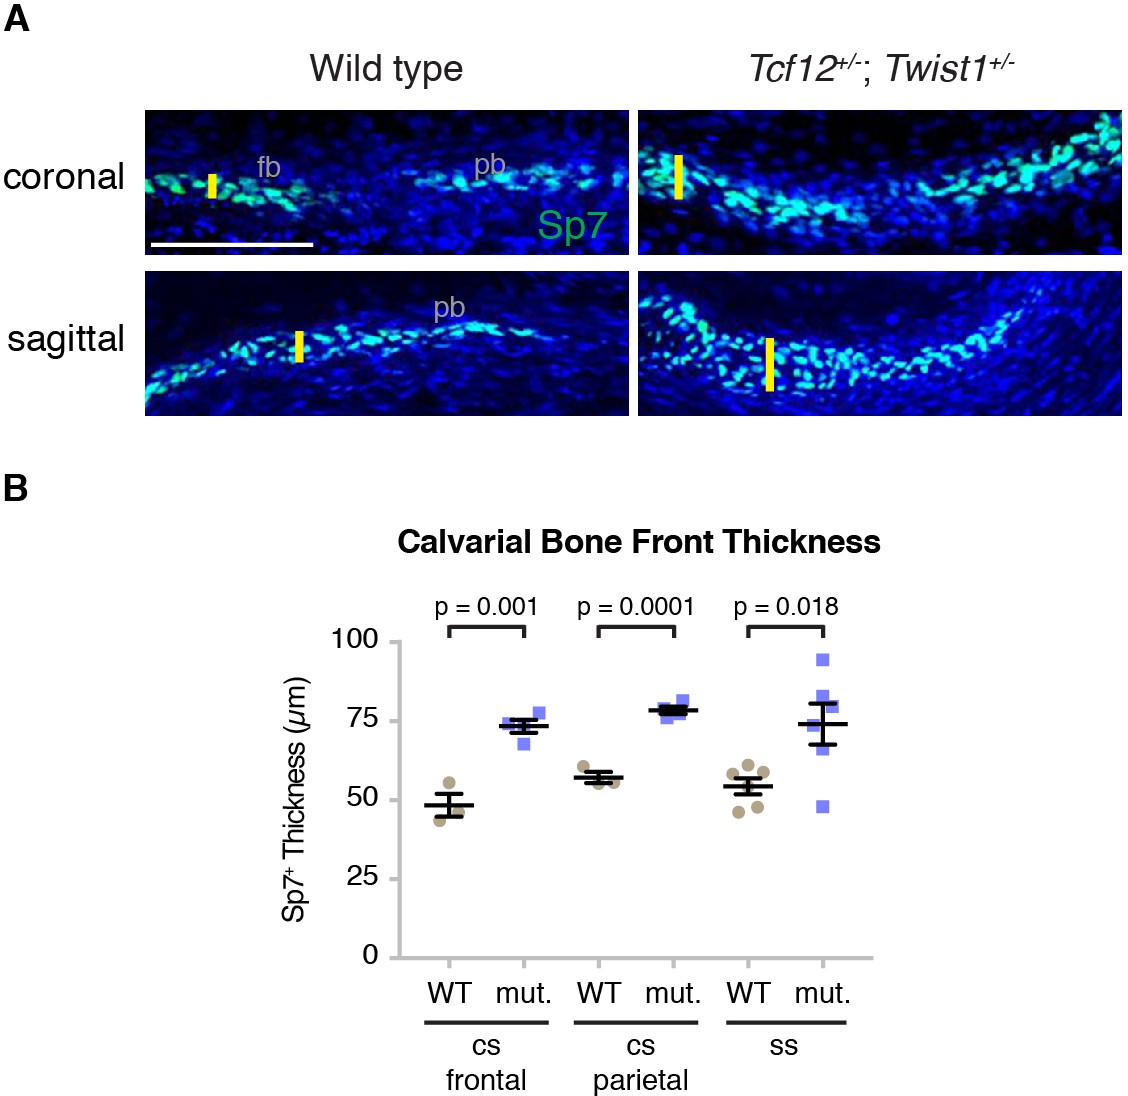
Increased calvarial bone front thickness in mutants.
(A) Sections of mouse E14.5 coronal sutures and E16.5 sagittal sutures stained for Sp7 protein (green) and DAPI (blue, nuclei) were used to assess bone thickness. Yellow lines indicate thickness measurements used for quantification. fb, frontal bone; pb, parietal bone. Scale bar, 100 µm. (B) Bone front thickness of the coronal (four wild types, three mutants) and sagittal sutures (six wild types, six mutants) were quantified. p values were determined by Student’s t-tests; error bars represent standard error of the mean.
-
Figure 6—figure supplement 1—source data 1
Quantification of calvarial bone front thickness in mutant mice.
- https://doi.org/10.7554/eLife.37024.025
Figure 7 with 1 supplement

Reduced osteoprogenitor pool at the mutant coronal suture.
(A, B) Sections of forming coronal and sagittal sutures of 10 mm fish and fully formed sutures of adult fish were assessed for gli1, grem1a, and prrx1a mRNA expression (white) by RNAscope in situ hybridization. Orange dotted lines indicate bones, and the boxed regions of the coronal suture regions are magnified below. For adult sutures, yellow arrowheads show expression in the suture mesenchyme, yellow arrows show expression of prrx1a in the periosteum, and grew arrows show lack of expression of gli1 and grem1a in the periosteum. Scale bar at 10 mm stage, 20 µm; scale bar at adult stage, 50 µm. (C, D) Sections of E14.5 coronal sutures and E16.5 forming sagittal sutures of mice stained for Gli1/Grem1 (magenta) and Sp7 protein (green). Yellow arrowheads indicate progenitor regions in forming coronal sutures. Boxed regions of parietal bone fronts in the forming sagittal sutures are magnified in lower panels. Nuclei are stained blue by DAPI in all images. Scale bars, 100 µm.
Figure 7—figure supplement 1

Quantification of progenitor marker and Fgf pathway transcripts in tcf12; twist1b mutants.
(A) The number of gli1, grem1a, and prrx1a transcripts at the forming coronal and sagittal suture regions were quantified per region area (between the bone fronts in Figure 7A). Although the progenitor regions expressing these genes were reduced (Figure 7B), no significant difference in transcript levels were observed in equivalent areas of remaining progenitors between wild types (n = 4) and tcf12; twist1b mutants (n = 4, with the exception of n = 2 mutants for prrx1a transcripts). p values were determined by Student’s t-tests; error bars represent standard error of the mean. (B) RNAscope in situ hybridizations show fgfr2 and dusp6 transcripts (white dots) relative to all nuclei (DAPI, blue) at the forming coronal sutures of 10 mm standard length fish. Orange dotted lines indicate bones and magenta dotted lines the forming suture region in which fgfr2 and dusp6 transcripts were quantified. Although coronal progenitor regions expressing fgfr2 and dusp6 were reduced, these genes were expressed at similar levels per area of progenitor regions in wild types (n = 5) and tcf12; twist1b mutants (n = 5). p values were determined by Student’s t-tests; error bars represent standard error of the mean. Scale bar, 20 µm.
-
Figure 7—figure supplement 1—source data 1
Quantification of gli1,grem1a, and prrx1a transcripts in coronal suture region of mutant fish.
- https://doi.org/10.7554/eLife.37024.031
-
Figure 7—figure supplement 1—source data 2
Quantification of gli1,grem1a, and prrx1a transcripts in sagittal suture region of mutant fish.
- https://doi.org/10.7554/eLife.37024.032
-
Figure 7—figure supplement 1—source data 3
Quantification of fgfr2 and dusp6 transcripts in coronal suture region of mutant fish.
- https://doi.org/10.7554/eLife.37024.033
Figure 8
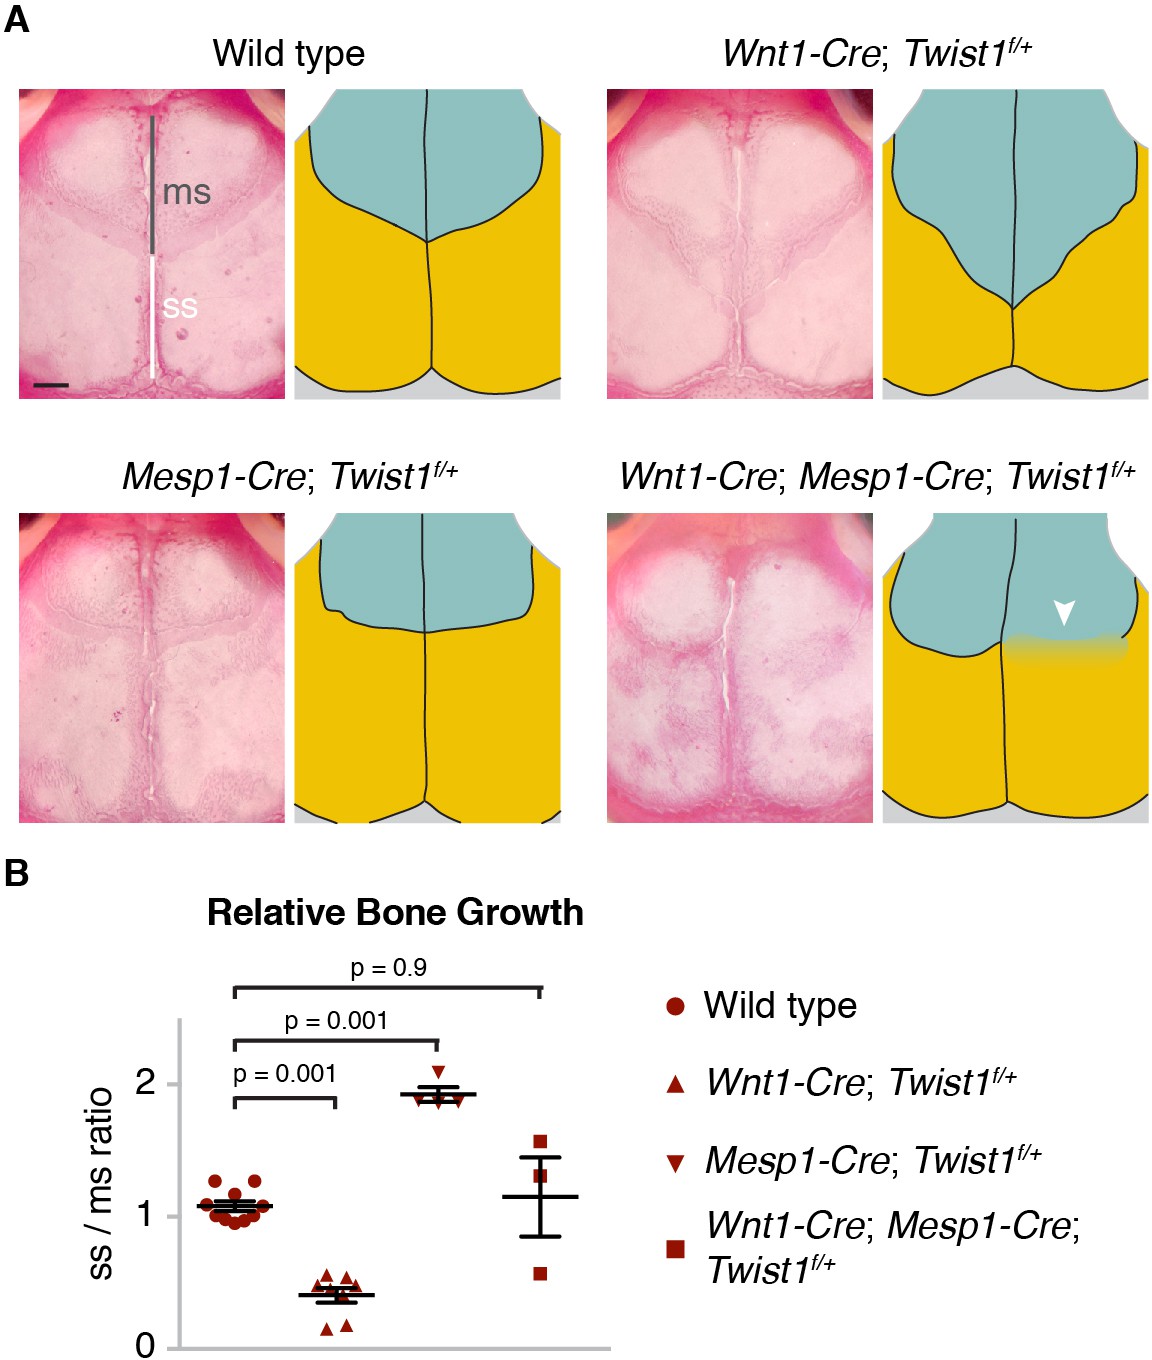
Tissue-autonomous bone overgrowth in Twist1 conditional mutants.
(A) Dorsal views of Alizarin-stained skulls of three-week-old mice. In the accompanying diagrams, turquoise indicates the neural-crest-derived frontal bones and gold the mesoderm-derived parietal bones. The relative lengths of the metopic suture (ms) and sagittal suture (ss) serve as a proxy for bone size. Compared to wild type (n = 0/10), Wnt1-Cre; Twist1flox/+ (n = 0/8), and Mesp1-Cre; Twist1flox/+ (n = 0/4); Wnt1-Cre; Mesp1-Cre; Twist1flox/+ mice (n = 2/3) displayed coronal synostosis (arrowhead, average craniosynostosis index of 2.33). Scale bar, 1 mm. (B) Quantification of the relative length of the sagittal over the metopic suture. p values were determined by a one-way ANOVA with post-hoc Tukey-Kramer HSD test; error bars represent standard error of the mean.
-
Figure 8—source data 1
Ratio of the sagittal to metopic suture length in mutant mice.
- https://doi.org/10.7554/eLife.37024.035
Tables
Key resources table
| Reagent type (species) or resource | Designation | Source or reference | Identifiers | Additional information |
|---|---|---|---|---|
| Genetic reagent (D. rerio) | sp7:EGFP | PMID: 20506187 | RRID: ZFIN_ZDB-GENO-100402-2 | Zebrafish International Resource Center |
| genetic reagent (D. rerio) | tcf12-/- | this paper | allele el548; see Supplementary file 2 | |
| Genetic reagent (D. rerio) | twist1a-/- | this paper | allele el571; see Supplementary file 2 | |
| Genetic reagent (D. rerio) | twist1b-/- | this paper | allele el570; see Supplementary file 2 | |
| Genetic reagent (M. musculus) | Tcf12-/- | PMID: 23354436 | Dr. Robert Maxson (University of Southern California) | |
| Genetic reagent (M. musculus) | Twist1-/- | PMID: 7729687 | RRID:IMSR_JAX:002221 | Dr. Richard Behringer (University of Texas, M. D. Anderson Cancer Center) |
| Genetic reagent (M. musculus) | Twist1flox | PMID: 19414008 | RRID:MMRRC_016842-UNC | Dr. Patrick Tam (Children's Medical Research Institute, The University of Sydney) |
| Genetic reagent (M. musculus) | Wnt1-Cre | PMID: 9843687 | RRID:IMSR_JAX:003829 | Dr. Henry Sucov (University of Southern California) |
| Genetic reagent (M. musculus) | Mesp1-Cre | PMID: 10393122 | Dr. Sachicko Iseki (Tokyo Medical and Dental University) | |
| Antibody | rabbit anti-Osx/Sp7 | Santa Cruz Biotechnology | cat.#: sc-22536-r; RRID: AB_831618 | (1:300) |
| Antibody | rat anti-BrdU | Bio-Rad Laboratories | cat.#: MCA2060 GA; RRID: AB_10545551 | (1:100–150) |
| Antibody | goat anti-Grem1 | Thermo Fisher Scientific | cat.#: PA5-47973; RRID: AB_2610125 | (1:40) |
| Antibody | goat anti-Gli1 | R and D Systems | cat.#: AF3455; RRID: AB_2247710 | (1:40) |
| Antibody | goat anti-rat FITC | Santa Cruz Biotechnology | cat.#: sc-2011; RRID: AB_631753 | (1:200) |
| Antibody | goat anti-rabbit Alexa Fluor 568 | Thermo Fisher Scientific | cat.#: A-11011; RRID: AB_143157 | (1:200–500) |
| Antibody | donkey anti-goat Alexa Fluor 488 | Abcam | cat.#: ab150129; RRID: AB_2687506 | (1:200) |
| Antibody | goat anti-rat Alexa Fluor 633 | Thermo Fisher Scientific | cat.#: A21094; RRID: AB_2535749 | (1:500) |
| Sequence-based reagent | RNAscope Probe - Dr-tcf12-C2 | Advanced Cell Diagnostics | cat.#: 517031-C2 | |
| Sequence-based reagent | RNAscope Probe - Dr-twist1b | Advanced Cell Diagnostics | cat.#: 413121 | |
| Sequence-based reagent | RNAscope Probe - Dr-gli1-C3 | Advanced Cell Diagnostics | (not yet in catalog) | |
| Sequence-based reagent | RNAscope Probe - Dr-grem1a | Advanced Cell Diagnostics | cat.#: 535291 | |
| Sequence-based reagent | RNAscope Probe - Dr-prrx1a | Advanced Cell Diagnostics | cat.#: 535321 | |
| Sequence-based reagent | RNAscope Probe - Dr-fgfr2 | Advanced Cell Diagnostics | cat.#: 420961 | |
| Sequence-based reagent | RNAscope Probe - Dr-dusp6-C3 | Advanced Cell Diagnostics | cat.#: 515021-C3 | |
| Commercial assay or kit | RNAscope 2.5 HD Assay – RED | Advanced Cell Diagnostics | cat.#: 322350 | |
| Commercial assay or kit | RNAscope Multiplex Fluorescent Kit v2 | Advanced Cell Diagnostics | cat.#: 323110 | |
| Chemical compound, drug | Alizarin Red S | Amresco | cat.#: 9436–25G | live staining: 1 mg / 30 mL |
| Chemical compound, drug | Calcein | Thermo Fisher Scientific | cat.#: C481 | live staining: 1 mg / 10 mL |
| Chemical compound, drug | Alcian Blue | Anatech LTD | cat.#: 862 |
Additional files
-
Supplementary file 1
Summary of phenotypes observed in combinatorial zebrafish mutants
- https://doi.org/10.7554/eLife.37024.036
-
Supplementary file 2
TALEN targeting and mutant genotyping
- https://doi.org/10.7554/eLife.37024.037
-
Transparent reporting form
- https://doi.org/10.7554/eLife.37024.038
Download links
A two-part list of links to download the article, or parts of the article, in various formats.
Downloads (link to download the article as PDF)
Open citations (links to open the citations from this article in various online reference manager services)
Cite this article (links to download the citations from this article in formats compatible with various reference manager tools)
Altered bone growth dynamics prefigure craniosynostosis in a zebrafish model of Saethre-Chotzen syndrome
eLife 7:e37024.
https://doi.org/10.7554/eLife.37024


