Context-enriched interactome powered by proteomics helps the identification of novel regulators of macrophage activation
- Channing Division of Network Medicine, Brigham and Women’s Hospital, Harvard Medical School, United States
- Center for Interdisciplinary Cardiovascular Sciences, Brigham and Women’s Hospital, Harvard Medical School, United States
Figures
Figure 1 with 1 supplement
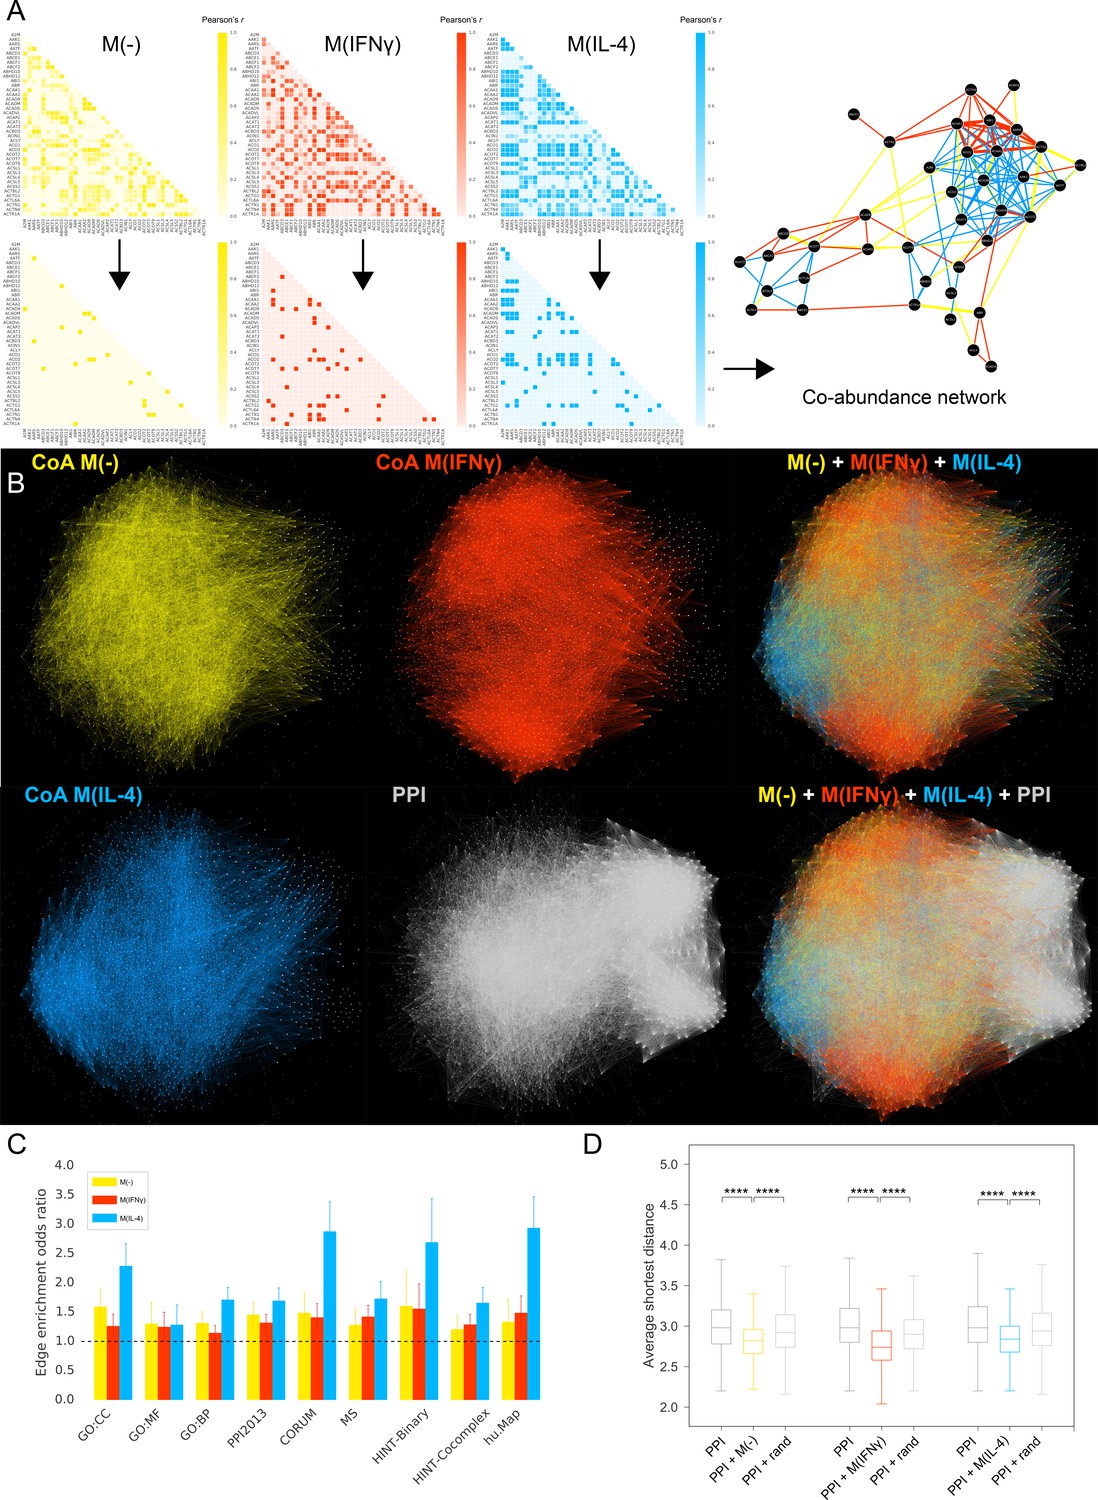
Co-abundance networks.
(A) Top row: Sample from the Pearson correlation matrix showing the top 40 proteins in alphabetical order. Pearson’s r values are calculated based on the protein abundance profiles for each condition. Bottom row: Correlation matrices after thresholding, where Pearson’s r values above the defined threshold are assigned the value 1 and r values below the threshold are assigned the value 0, resulting in the adjacency matrix for the co-abundance network. Right: The resulting co-abundance network. Yellow, red and blue edges correspond to co-abundance edges derived from proteomics data from the M(-), M(IFNγ) and M(IL-4) condition, respectively. (B) The global superimposition of co-abundance networks and the literature-derived PPI network, where the same force-directed network layout was used, preserving the spatial positions of nodes. The depicted PPI network was pruned to contain only the proteins in the co-abundance networks. (C) The enrichment of co-abundance edges in external validation datasets of functional, binary and co-complex interactions including shared GO terms for Cellular Component (GO:CC), Molecular Function (GO:MF) and Biological Process (GO:BP), binary interactions from the HINT database (HINT-Binary), the literature-curated PPI network used in the subsequent analysis (PPI2013), and co-complex interactions from large-scale databases (CORUM, HINT Co-complex, hu.Map) and mass-spectrometry-based curated co-complex association maps (MS). Enrichments were calculated using two-sided Fisher’s Exact test. Error bars correspond to 95% confidence intervals. All enrichments were significant with p-values<0.05. (D) Distributions of average shortest distances between the co-abundance network nodes and known CVD drug targets. Random edge addition was done for 100 realizations using degree-preserving randomization (see Materials and methods). ****p<0.0001, two-sided Mann-Whitney U test with Bonferroni correction for multiple testing.
-
Figure 1—source data 1
Source data for Figure 1A: Co-abundance networks in edgelist format (Columns: Protein A - Protein B).
Co-abundance network for M(-).
- https://cdn.elifesciences.org/articles/37059/elife-37059-fig1-data1-v2.csv
-
Figure 1—source data 2
Source data for Figure 1A: Co-abundance networks in edgelist format (Columns: Protein A - Protein B).
Co-abundance network for M(IFNg).
- https://cdn.elifesciences.org/articles/37059/elife-37059-fig1-data2-v2.csv
-
Figure 1—source data 3
Source data for Figure 1A: Co-abundance networks in edgelist format (Columns: Protein A - Protein B).
Co-abundance network for M(IL-4).
- https://cdn.elifesciences.org/articles/37059/elife-37059-fig1-data3-v2.csv
-
Figure 1—source data 4
Source data for Figure 1C: Odds ratios and confidence intervals, and p-values for the link validation sets shown in Figure 1C.
- https://cdn.elifesciences.org/articles/37059/elife-37059-fig1-data4-v2.xlsx
Figure 1—figure supplement 1
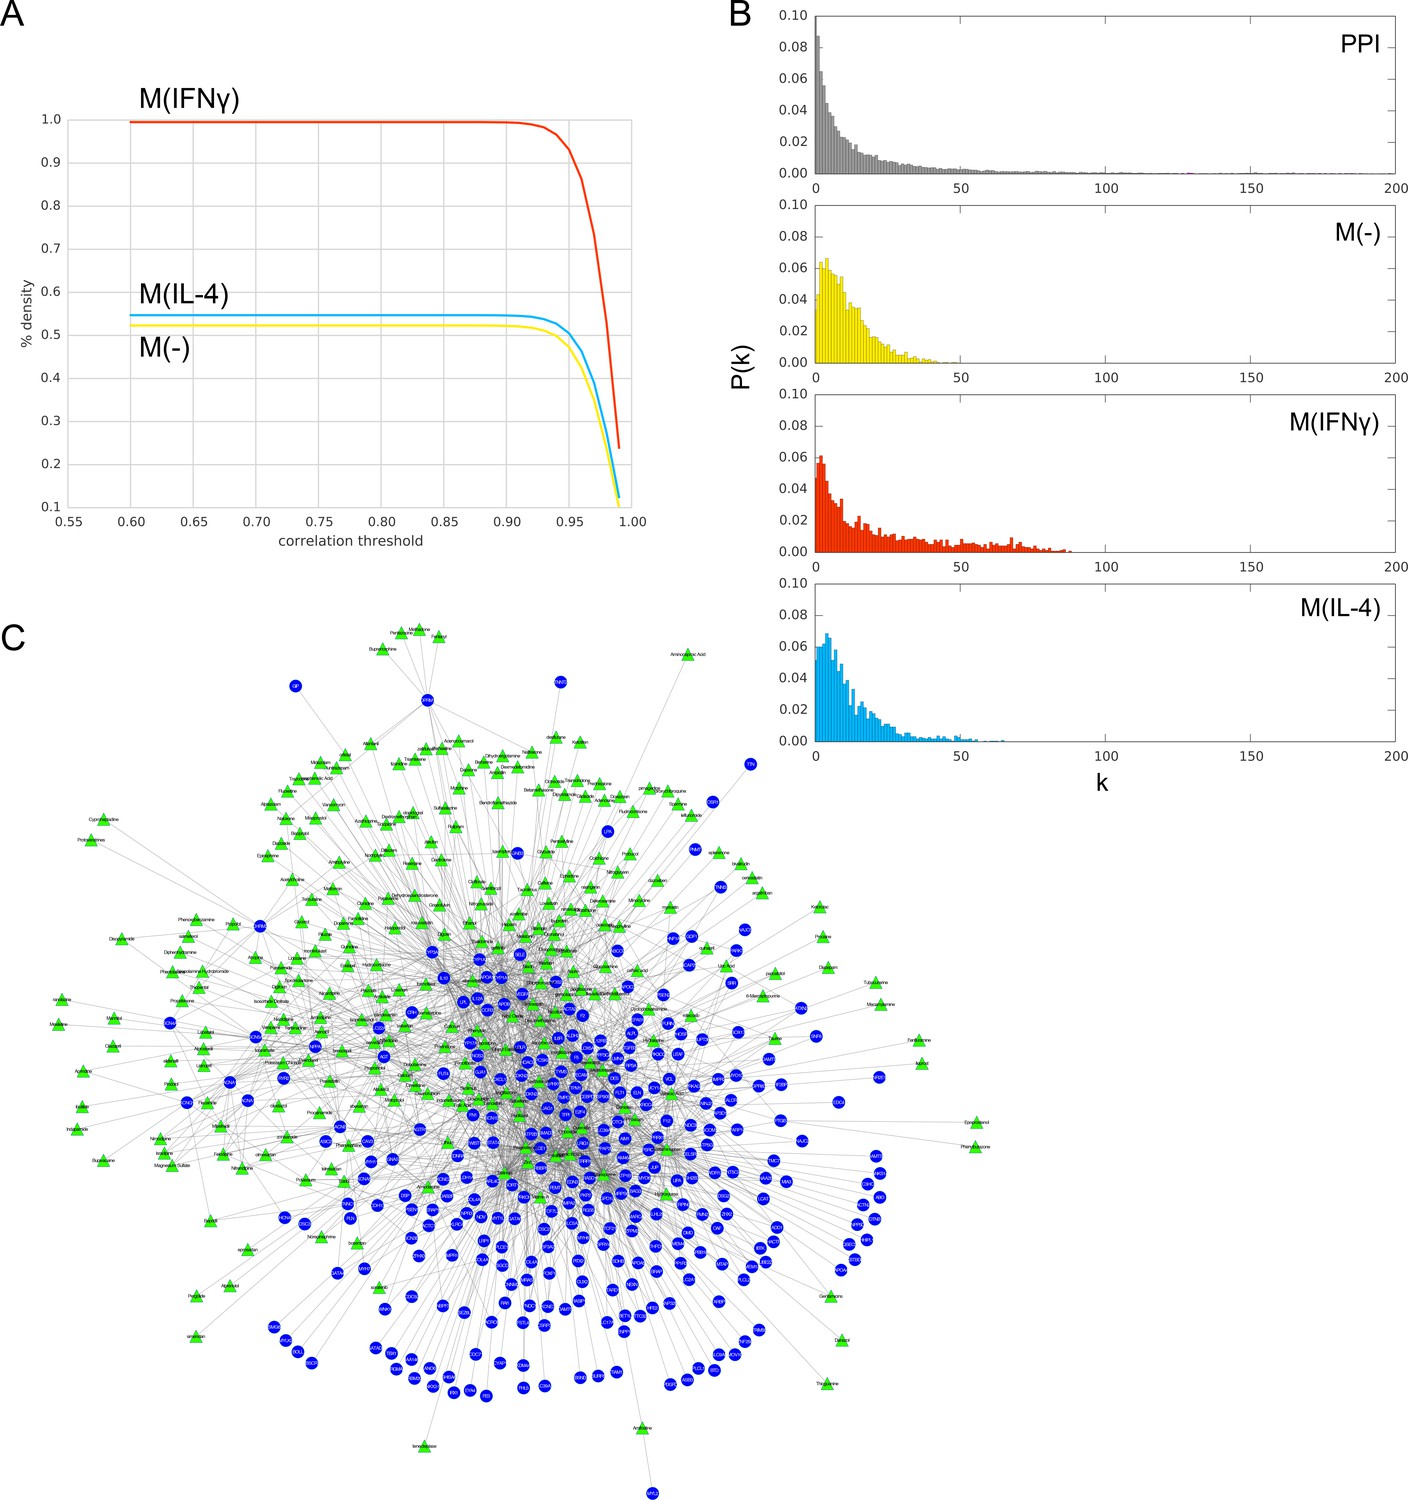
(A) Pearson’s r correlation threshold used in filtering co-abundance edges, as a function of the edge density of the resulting co-abundance network, at FDR = 0.01. (B) The degree distributions P(k) of the PPI network and co-abundance networks. (C) Bipartite network of 268 drugs (green triangles) and 283 targets (blue circles) obtained from iCTNet2 (see Materials and methods).
Figure 2 with 10 supplements
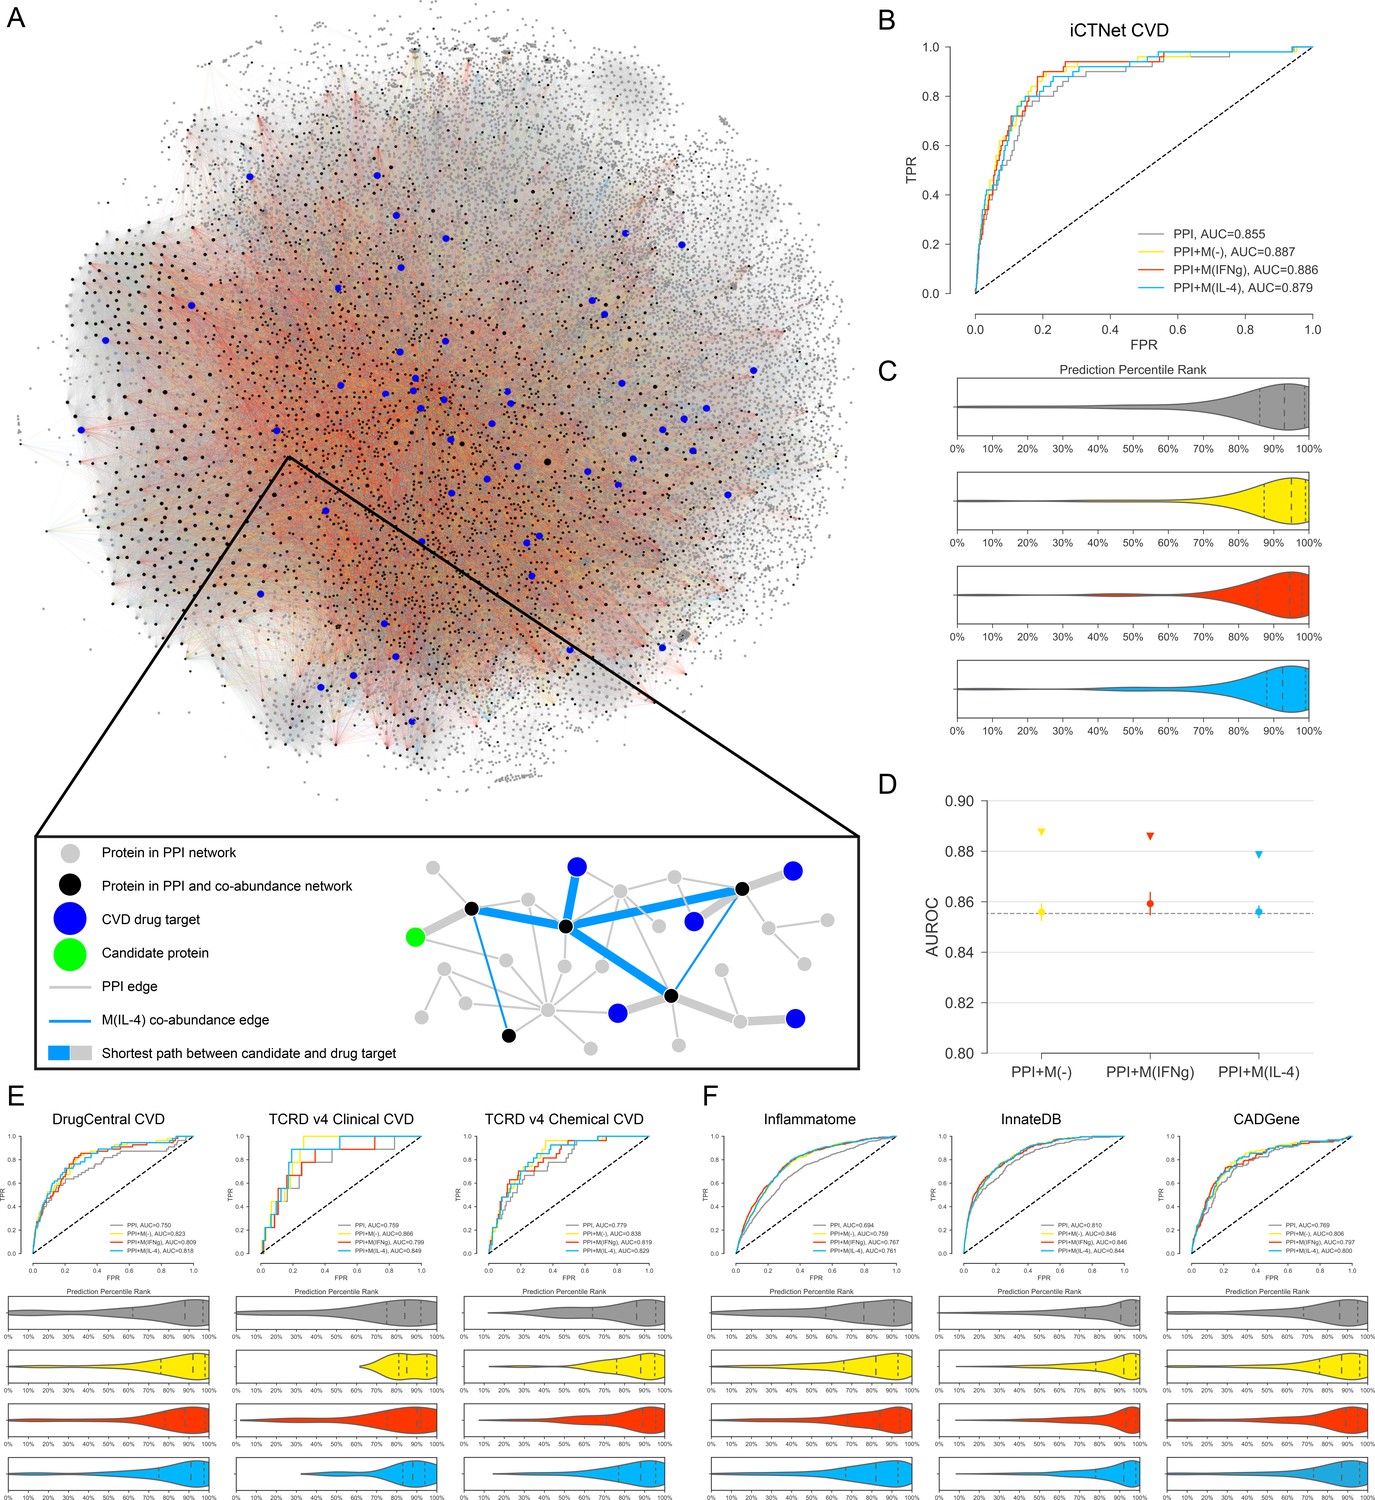
Target candidate prioritization and its performance assessment.
(A) The entire literature curated PPI network with co-abundance edges from all three stimulation conditions, providing a global view of the distribution and connectivity of co-abundance edges and drug targets (Figure 2—figure supplement 1 for a quantification of related degree distributions and largest connected component (LCC) sizes). A force-directed layout algorithm was used to visualize the networks. Edge colors follow the same convention as Figure 1. (Inset) Toy network depicting the drug target prioritization scheme: For each candidate protein (green node), the shortest path length to each CVD drug target (blue nodes) is calculated and the proximity score PS(c) is calculated (see Materials and methods). Shortest paths between the candidate and CVD drug targets are denoted with the thicker edges and may consist of both PPI and co-abundance edges. (B) The ROC curves for iCTNet CVD drug targets on PPI network only and PPI network with added co-abundance edges, with AUROCs shown in the legend. (C) Violin plots showing the distribution of percentile ranks of iCTNet CVD drug targets on PPI network only and PPI network with added co-abundance edges. Dashed lines indicate the 2nd quartiles (medians) and dotted lines indicate the 1st and 3rd quartiles. (D) AUROC value comparison between PPI and co-abundance edges (indicated by triangles) and PPI and the same number of randomly added edges as the co-abundance networks (circles with error bars). Randomization was repeated for 20 realizations using degree-preserving randomization (see Materials and methods). All empirical p-values between co-abundance and random case are less than 0.05. The AUROC of the PPI network is indicated by the grey dashed line. (E) ROC curves and prediction percentile rank violin plots for external drug target databases: DrugCentral, TCRD Clinical and TCRD Chemical. Violin plots show the distribution of percentile ranks of CVD drug targets from these databases for each case. Dashed lines indicate the 2nd quartiles (medians) and dotted lines indicate the 1st and 3rd quartiles. (F) ROC curves and prediction percentile rank violin plots for inflammation (Inflammatome), innate immune response (InnateDB) and coronary artery disease (CADGene) signatures. Violin plots show the distribution of percentile ranks of proteins implicated in these datasets for each case. Dashed lines indicate the 2nd quartiles (medians) and dotted lines indicate the 1st and 3rd quartiles.
Figure 2—figure supplement 1
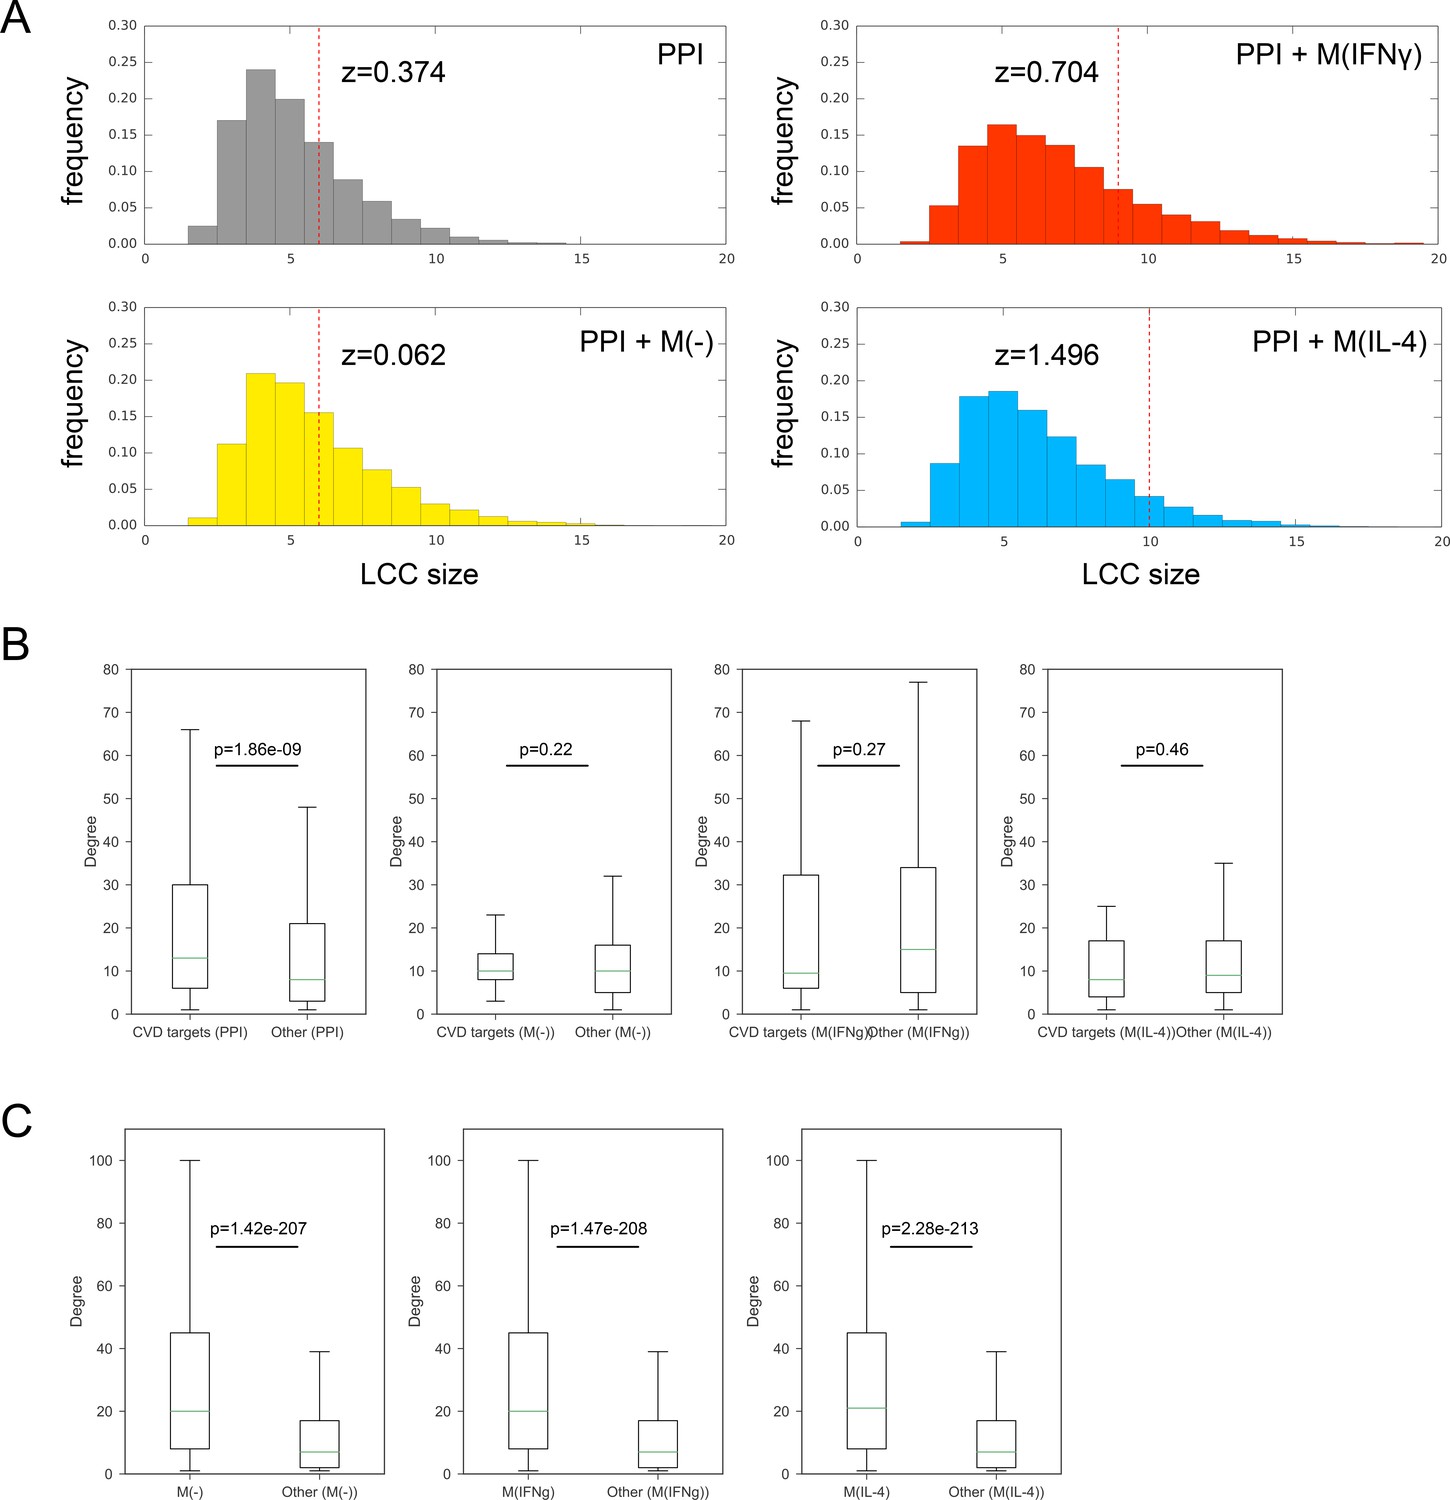
(A) Significance of the largest connected component (LCC) of CVD drug targets mapped onto the PPI network only and the respective combined networks. Z-scores are calculated based on 10,000 degree-preserving randomizations. (B) Boxplots comparing the degree distributions of CVD drug targets with the degree distributions of other proteins. The comparison was made for the PPI network, M(-) co-abundance network, M(IFNγ) co-abundance network, and M(IL-4) co-abundance network, respectively. The ‘de-noised’ PPI network with the low-throughput and co-complex edges removed was used. Mann-Whitney U test was performed to obtain two-sided p-values. (C) Boxplots comparing the degree distributions of proteins connected by CoA edges (i.e. CoA network nodes) in the PPI network to the degree distributions of other nodes in the PPI network. The comparison was made for the M(-) co-abundance network, M(IFNγ) co-abundance network, and M(IL-4) co-abundance network, respectively. The ‘de-noised’ PPI network with the low-throughput and co-complex edges removed was used. Mann-Whitney U test was performed to obtain two-sided p-values.
Figure 2—figure supplement 2
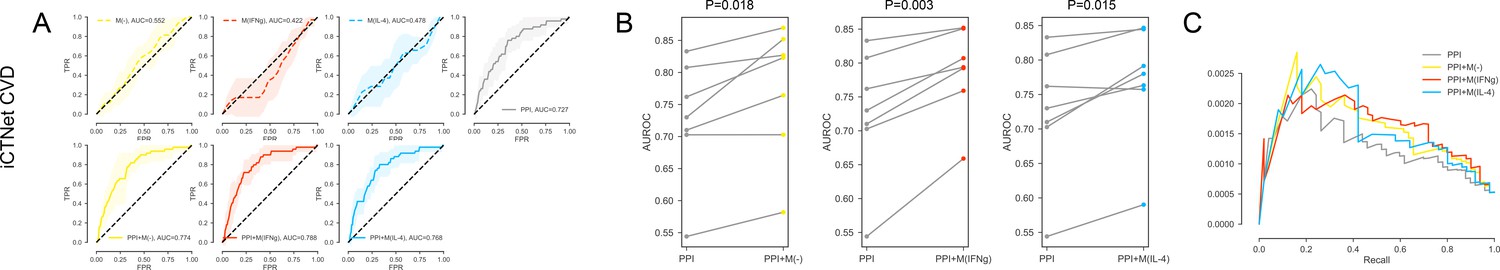
For the iCTNet CVD drug targets.
(A) The k-fold cross-validated (k = 7) ROC curves for M(-), M(IFNγ), M(IL-4), PPI, PPI + M(-), PPI + M(IFNγ) and PPI + M(IL-4), respectively. Shaded regions represent the standard deviation of the AUROC values from all folds. (B) The AUROC values of each individual fold from the cross-validation for PPI and PPI + M(-), PPI and PPI + M(IFNγ), PPI and PPI + M(IL-4), respectively. Paired t-test was performed to obtain two-sided p-values. (C) Precision-recall curves for PPI, PPI + M(-), PPI + M(IFNγ) and PPI + M(IL-4).
Figure 2—figure supplement 3
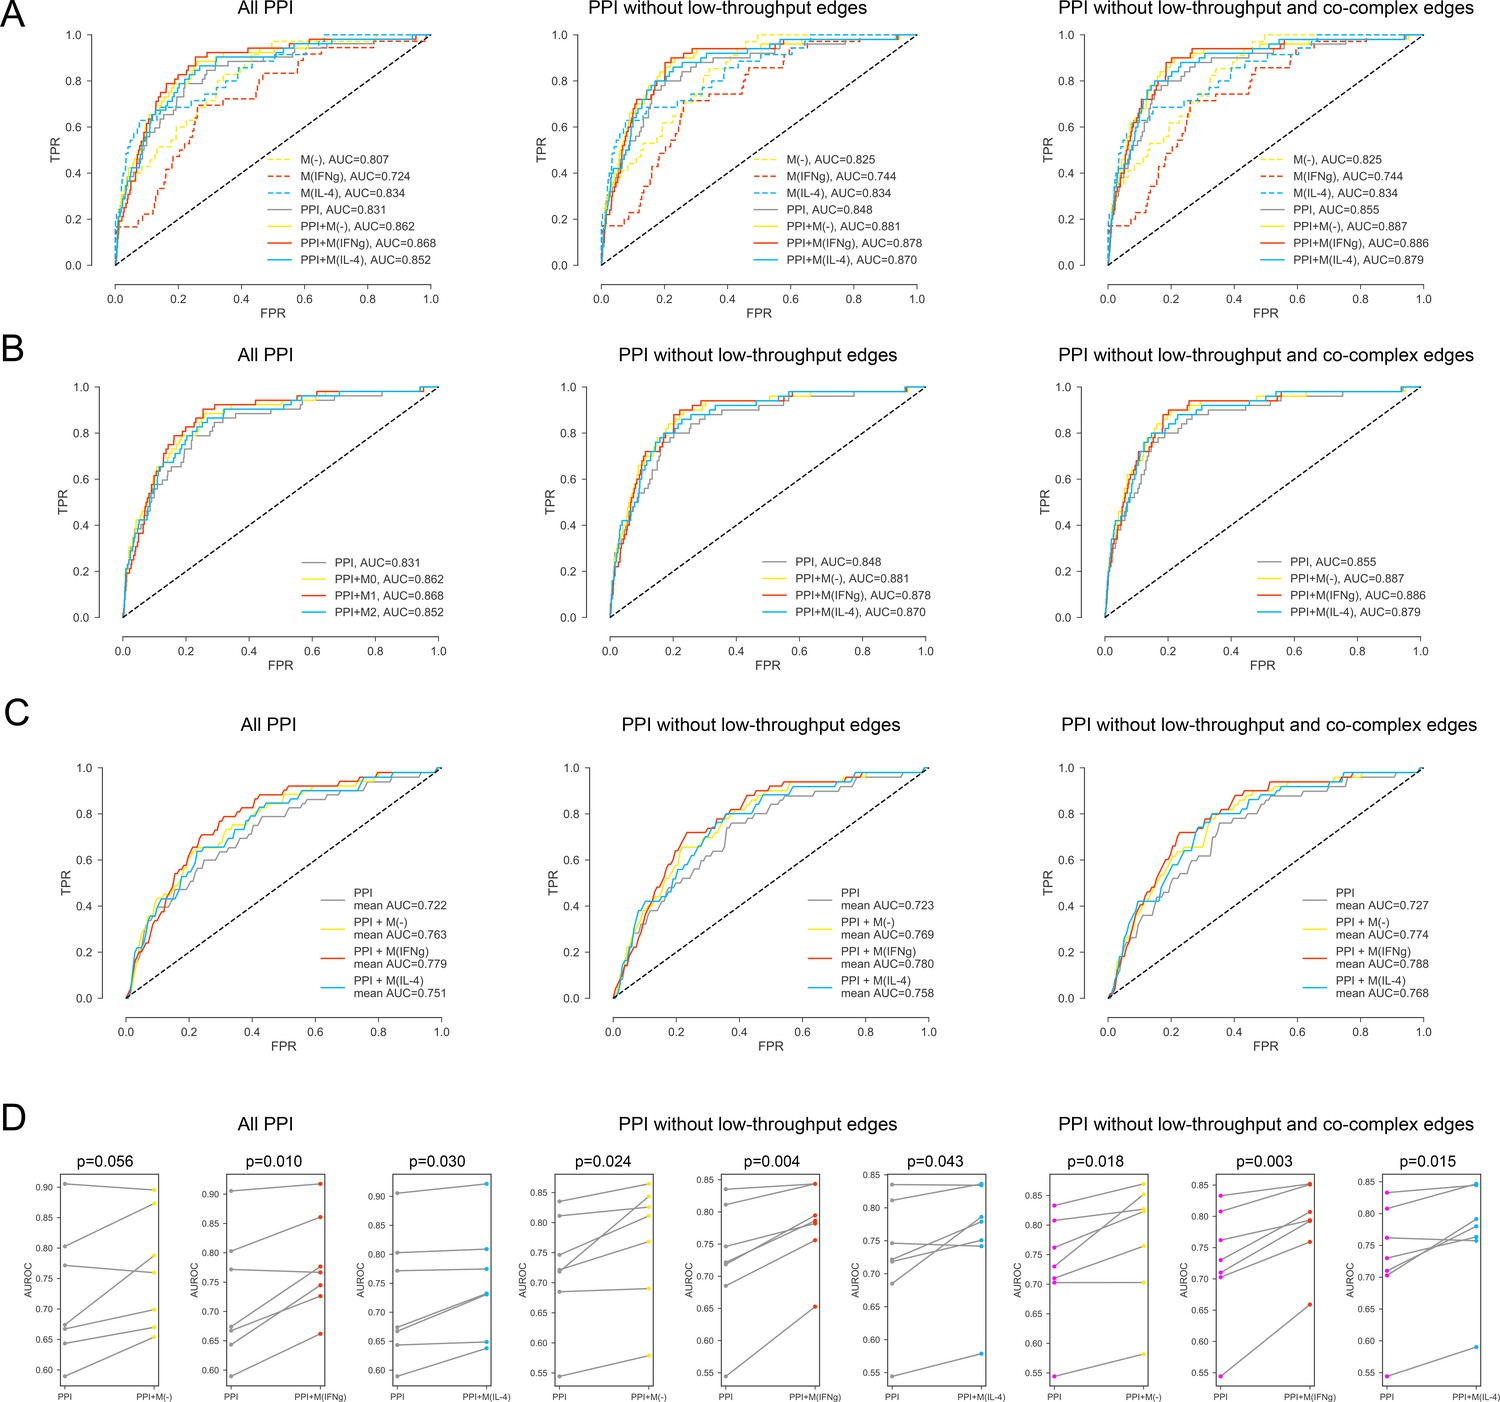
For the iCTNet CVD drug targets.
(A) ROC curves for M(-), M(IFNγ), M(IL-4), PPI, PPI + M(-), PPI + M(IFNγ) and PPI + M(IL-4), comparing the original PPI, PPI with low-throughput edges removed, and PPI with low-throughput and co-complex edges removed. (B) ROC curves for PPI, PPI + M(-), PPI + M(IFNγ) and PPI + M(IL-4), comparing the original PPI, PPI with low-throughput edges removed, and PPI with low-throughput and co-complex edges removed. (C) The k-fold cross-validated (k = 7) ROC curves for, PPI + M(-), PPI + M(IFNγ) and PPI + M(IL-4), comparing the original PPI, PPI with low-throughput edges removed, and PPI with low-throughput and co-complex edges removed. (D) The AUROC values of each individual fold from the cross-validation for PPI and PPI + M(-), PPI and PPI + M(IFNγ), PPI and PPI + M(IL-4), comparing the original PPI, PPI with low-throughput edges removed, and PPI with low-throughput and co-complex edges removed. Paired t-test was performed to obtain two-sided p-values.
Figure 2—figure supplement 4
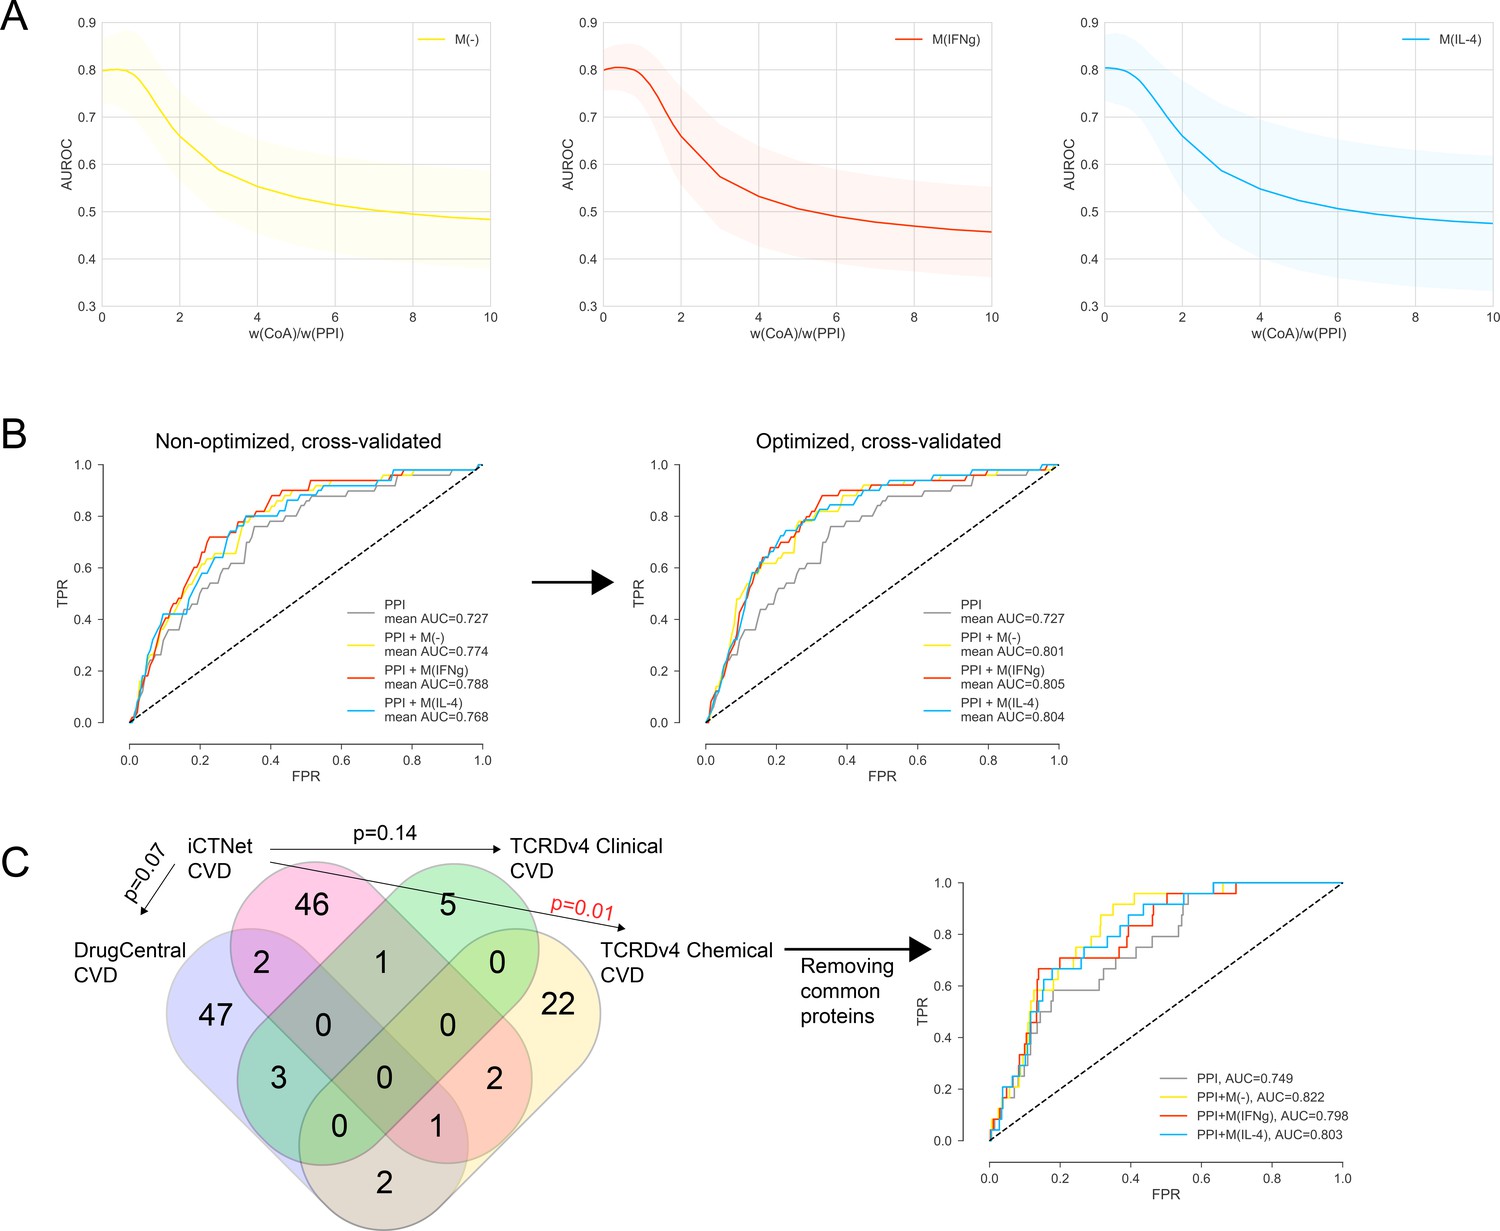
(A) The weight ratio between co-abundance and PPI edges, w(CoA)/w(PPI), as a function of the area under the ROC curve (AUROC) for PPI + M(-), PPI + M(IFNγ) and PPI + M(IL-4), respectively. Shaded regions represent the standard deviation of the AUROC values from all folds. The ‘de-noised’ PPI network with the low-throughput and co-complex edges removed was used. (B) The k-fold cross-validated (k = 7) ROC curves for, PPI + M(-), PPI + M(IFNγ) and PPI + M(IL-4), comparing the non-optimized and optimized case. w(CoA)/w(PPI) was 0.4, 0.4, and 0.1 for PPI + M(-), PPI + M(IFNγ) and PPI + M(IL-4), respectively. (C) Overlap between CVD drug target sets used in the prioritization and external validation. Fisher’s exact test was used and two-sided p-values were reported. In the case of the one significant overlap between iCTNet and TCRDv4 Clinical CVD drug targets, the ROC curve was re-plotted.
Figure 2—figure supplement 5
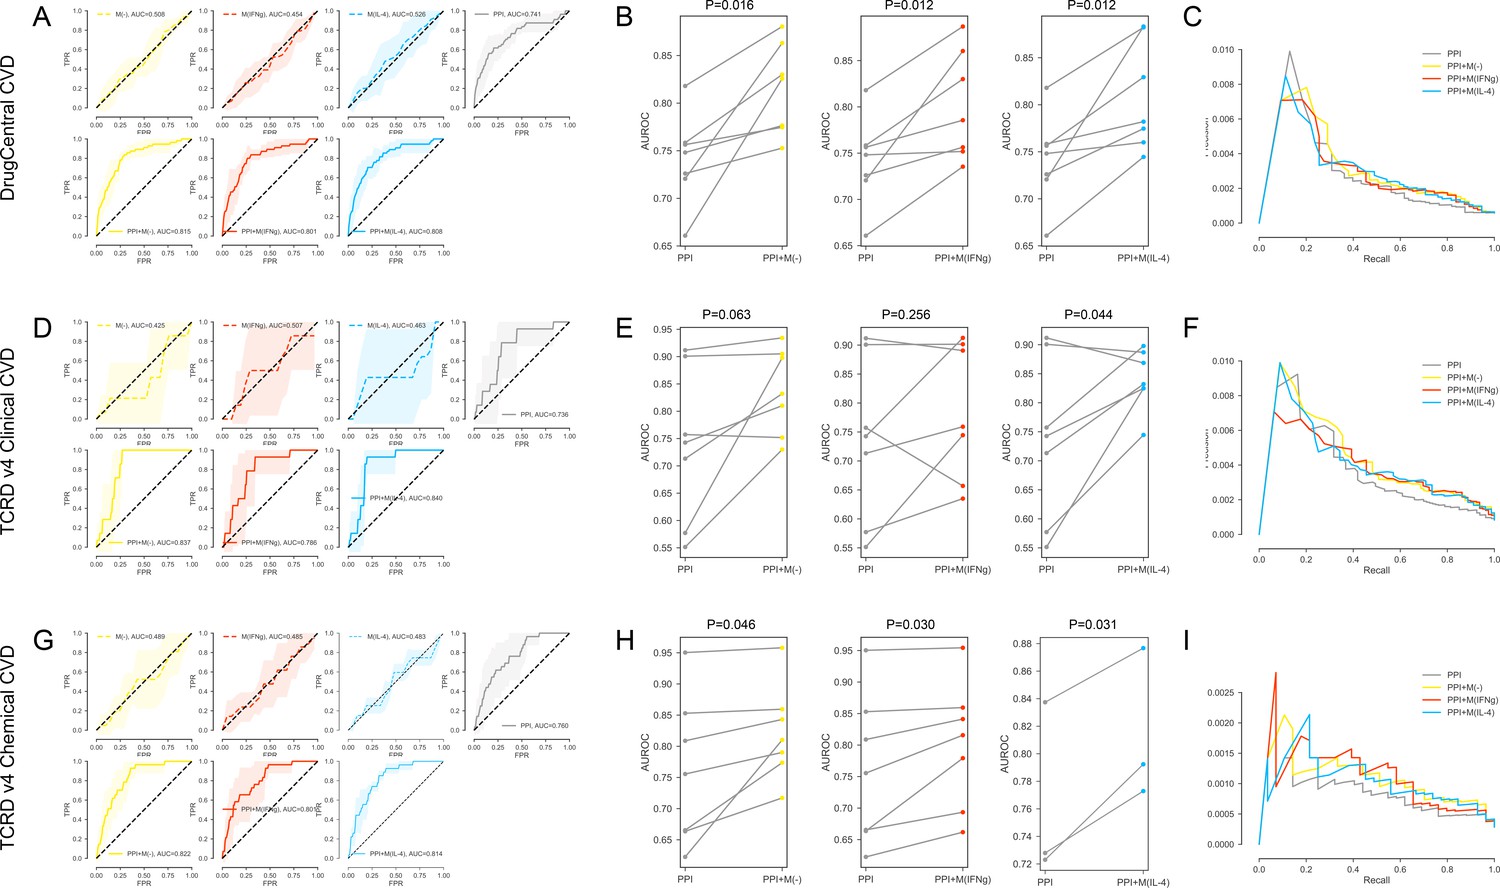
(A-C) For the DrugCentral CVD drug targets. (A) The k-fold cross-validated (k = 7) ROC curves for M(-), M(IFNγ), M(IL-4), PPI, PPI + M(-), PPI + M(IFNγ) and PPI + M(IL-4), respectively.Shaded regions represent the standard deviation of the AUROC values from all folds. (B) The AUROC values of each individual fold from the cross-validation for PPI and PPI + M(-), PPI and PPI + M(IFNγ), PPI and PPI + M(IL-4), respectively. Paired t-test was performed to obtain two-sided p-values. (C) Precision-recall curves for PPI, PPI + M(-), PPI + M(IFNγ) and PPI + M(IL-4). (D–F) For the TCRDv4 Clinical CVD drug targets: (D) The k-fold cross-validated (k = 7) ROC curves for M(-), M(IFNγ), M(IL-4), PPI, PPI + M(-), PPI + M(IFNγ) and PPI + M(IL-4), respectively. Shaded regions represent the standard deviation of the AUROC values from all folds. (E) The AUROC values of each individual fold from the cross-validation for PPI and PPI + M(-), PPI and PPI + M(IFNγ), PPI and PPI + M(IL-4), respectively. Paired t-test was performed to obtain two-sided p-values. (F) Precision-recall curves for PPI, PPI + M(-), PPI + M(IFNγ) and PPI + M(IL-4). (G–I) For the TCRDv4 Chemical CVD drug targets: (G) The k-fold cross-validated (k = 7 for M(-) and M(IFNγ), k = 3 for M(IL-4)) ROC curves for M(-), M(IFNγ), M(IL-4), PPI, PPI + M(-), PPI + M(IFNγ) and PPI + M(IL-4), respectively. Shaded regions represent the standard deviation of the AUROC values from all folds. (H) The AUROC values of each individual fold from the cross-validation for PPI and PPI + M(-), PPI and PPI + M(IFNγ), PPI and PPI + M(IL-4), respectively. Paired t-test was performed to obtain two-sided p-values. (I) Precision-recall curves for PPI, PPI + M(-), PPI + M(IFNγ) and PPI + M(IL-4).
Figure 2—figure supplement 6

(A-C) For DrugCentral all drug targets. (A) ROC curves for, PPI, PPI + M(-), PPI + M(IFNγ) and PPI + M(IL-4), respectively.(B) Violin plots showing the distribution of percentile ranks of drug targets on PPI network only and PPI network with added co-abundance edges. Dashed lines indicate the 2nd quartiles (medians) and dotted lines indicate the 1st and 3rd quartiles. (C) Precision-recall curves for PPI, PPI + M(-), PPI + M(IFNγ) and PPI + M(IL-4). (D–F) For TCRDv4 clinical all drug targets: (D) ROC curves for, PPI, PPI + M(-), PPI + M(IFNγ) and PPI + M(IL-4), respectively. (E) Violin plots showing the distribution of percentile ranks of drug targets on PPI network only and PPI network with added co-abundance edges. Dashed lines indicate the 2nd quartiles (medians) and dotted lines indicate the 1 st and 3rd quartiles. (F) Precision-recall curves for PPI, PPI + M(-), PPI + M(IFNγ) and PPI + M(IL-4). (G–I:) For TCRDv4 chemical all drug targets: (G) ROC curves for, PPI, PPI + M(-), PPI + M(IFNγ) and PPI + M(IL-4), respectively. (H) Violin plots showing the distribution of percentile ranks of drug targets on PPI network only and PPI network with added co-abundance edges. Dashed lines indicate the 2nd quartiles (medians) and dotted lines indicate the 1st and 3rd quartiles. (I) Precision-recall curves for PPI, PPI + M(-), PPI + M(IFNγ) and PPI + M(IL-4). (J–L) For T_clin all drug targets: (J) ROC curves for, PPI, PPI + M(-), PPI + M(IFNγ) and PPI + M(IL-4), respectively. (K) Violin plots showing the distribution of percentile ranks of drug targets on PPI network only and PPI network with added co-abundance edges. Dashed lines indicate the 2nd quartiles (medians) and dotted lines indicate the 1st and 3rd quartiles. (L) Precision-recall curves for PPI, PPI + M(-), PPI + M(IFNγ) and PPI + M(IL-4).
Figure 2—figure supplement 7

(A-C) For the DrugCentral all drug targets. (A) The k-fold cross-validated (k = 7) ROC curves for M(-), M(IFNγ), M(IL-4), PPI, PPI + M(-), PPI + M(IFNγ) and PPI + M(IL-4), respectively.Shaded regions represent the standard deviation of the AUROC values from all folds.(B) The AUROC values of each individual fold from the cross-validation for PPI and PPI + M(-), PPI and PPI + M(IFNγ), PPI and PPI + M(IL-4), respectively. Paired t-test was performed to obtain two-sided p-values. (C) Precision-recall curves for PPI, PPI + M(-), PPI + M(IFNγ) and PPI + M(IL-4). (D–F) For the TCRDv4 Clinical all drug targets: (D) The k-fold cross-validated (k = 7) ROC curves for M(-), M(IFNγ), M(IL-4), PPI, PPI + M(-), PPI + M(IFNγ) and PPI + M(IL-4), respectively. Shaded regions represent the standard deviation of the AUROC values from all folds. (E) The AUROC values of each individual fold from the cross-validation for PPI and PPI + M(-), PPI and PPI + M(IFNγ), PPI and PPI + M(IL-4), respectively. Paired t-test was performed to obtain two-sided p-values. (F) Precision-recall curves for PPI, PPI + M(-), PPI + M(IFNγ) and PPI + M(IL-4). (G–I) For the TCRDv4 Chemical all drug targets: (G) The k-fold cross-validated (k = 7 for M(-) and M(IFNγ), k = 3 for M(IL-4)) ROC curves for M(-), M(IFNγ), M(IL-4), PPI, PPI + M(-), PPI + M(IFNγ) and PPI + M(IL-4), respectively. Shaded regions represent the standard deviation of the AUROC values from all folds. (H) The AUROC values of each individual fold from the cross-validation for PPI and PPI + M(-), PPI and PPI + M(IFNγ), PPI and PPI + M(IL-4), respectively. Paired t-test was performed to obtain two-sided p-values. (I) Precision-recall curves for PPI, PPI + M(-), PPI + M(IFNγ) and PPI + M(IL-4). (J–L) For the T_clin all drug targets: (J) The k-fold cross-validated (k = 7 for M(-) and M(IFNγ), k = 3 for M(IL-4)) ROC curves for M(-), M(IFNγ), M(IL-4), PPI, PPI + M(-), PPI + M(IFNγ) and PPI + M(IL-4), respectively. Shaded regions represent the standard deviation of the AUROC values from all folds. (K) The AUROC values of each individual fold from the cross-validation for PPI and PPI + M(-), PPI and PPI + M(IFNγ), PPI and PPI + M(IL-4), respectively. Paired t-test was performed to obtain two-sided p-values. (L) Precision-recall curves for PPI, PPI + M(-), PPI + M(IFNγ) and PPI + M(IL-4).
Figure 2—figure supplement 8
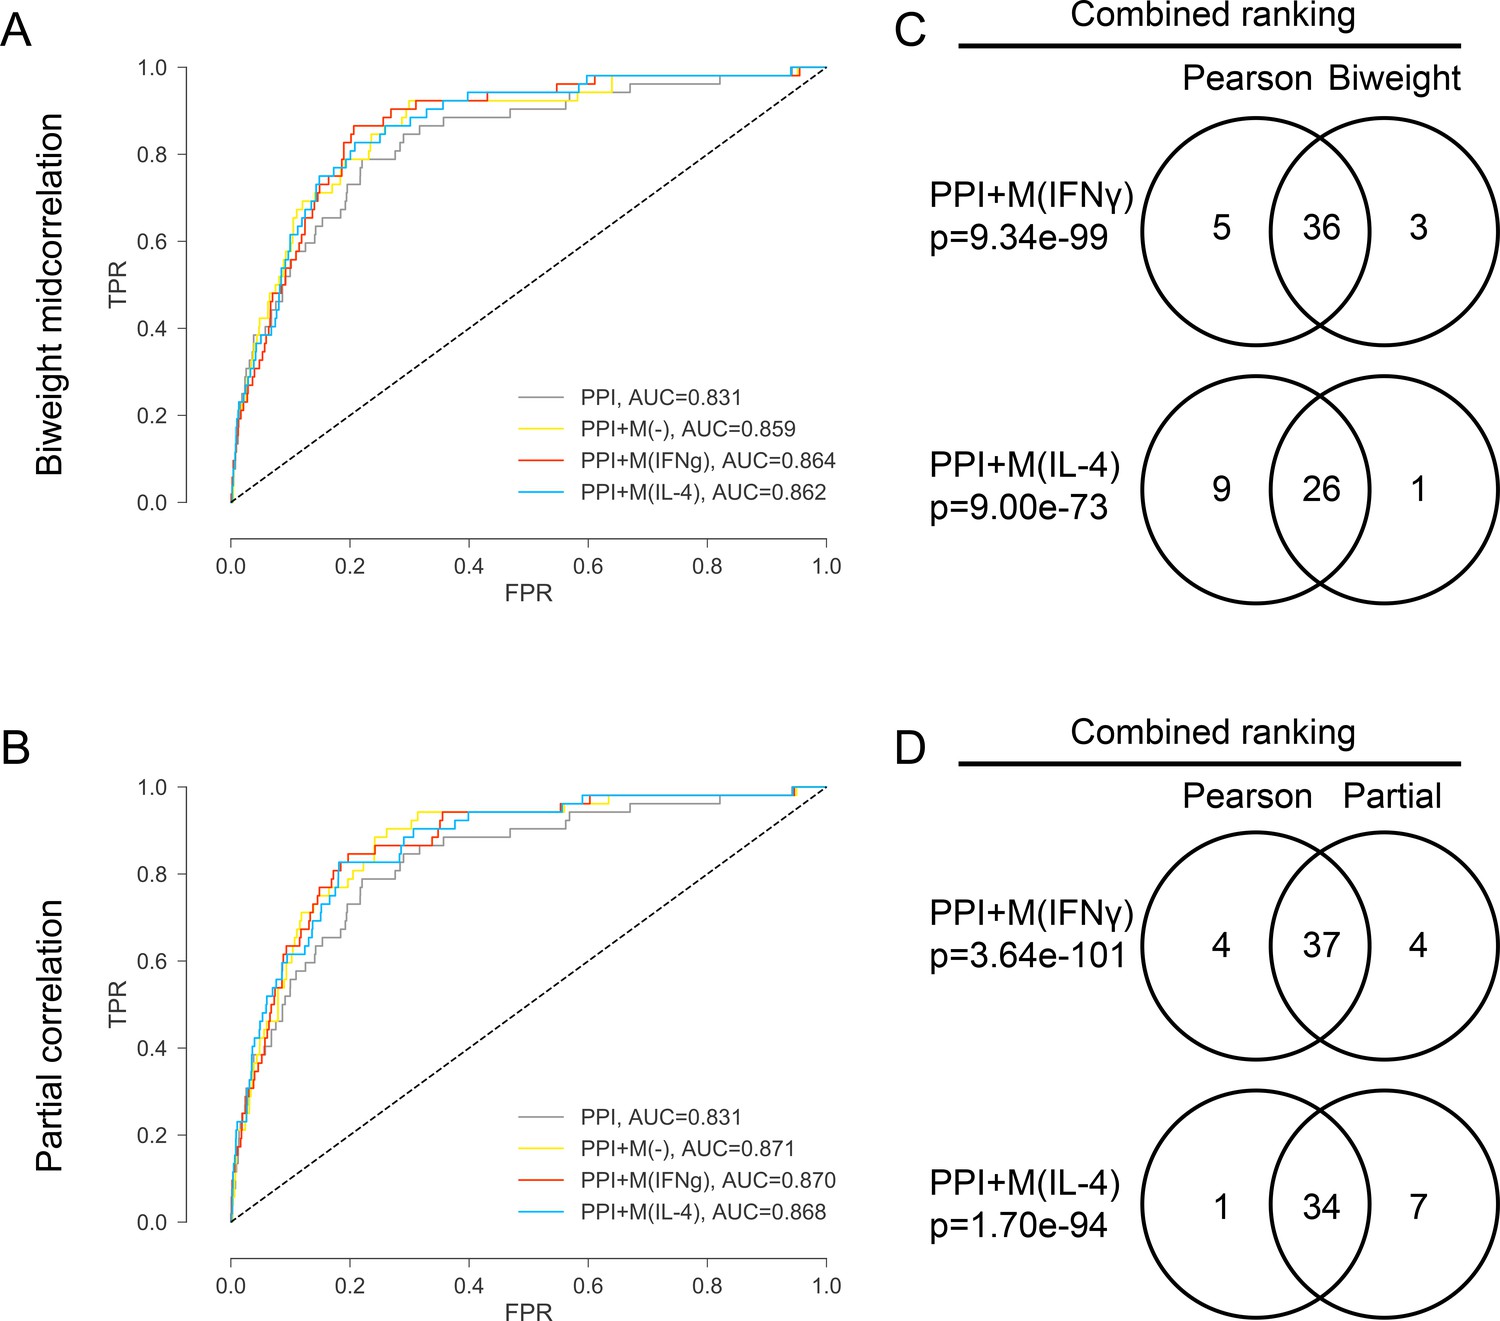
(A) ROC curves for PPI, PPI + M(-), PPI + M(IFNγ) and PPI + M(IL-4) where the co-abundance networks M(-), M(IFNγ) and M(IL-4) were built using biweight midcorrelation as the correlation measure. (B) ROC curves for PPI, PPI + M(-), PPI + M(IFNγ) and PPI + M(IL-4) where the co-abundance networks M(-), M(IFNγ) and M(IL-4) were built using partial correlation as the correlation measure, controlling for baseline abundances M(-). (C) Venn diagrams showing the overlap in terms of the final combined ranking between the two cases where Pearson’s correlation and biweight midcorrelation were used to build the co-abundance networks. Results are shown for the non-optimized case. Fisher’s exact test was used and two-sided p-values were reported. (D) Venn diagrams showing the overlap in terms of the final combined ranking between the two cases where Pearson’s correlation and partial correlation were used to build the co-abundance networks. Results are shown for the non-optimized case. Fisher’s exact test was used and two-sided p-values were reported.
Figure 2—figure supplement 9
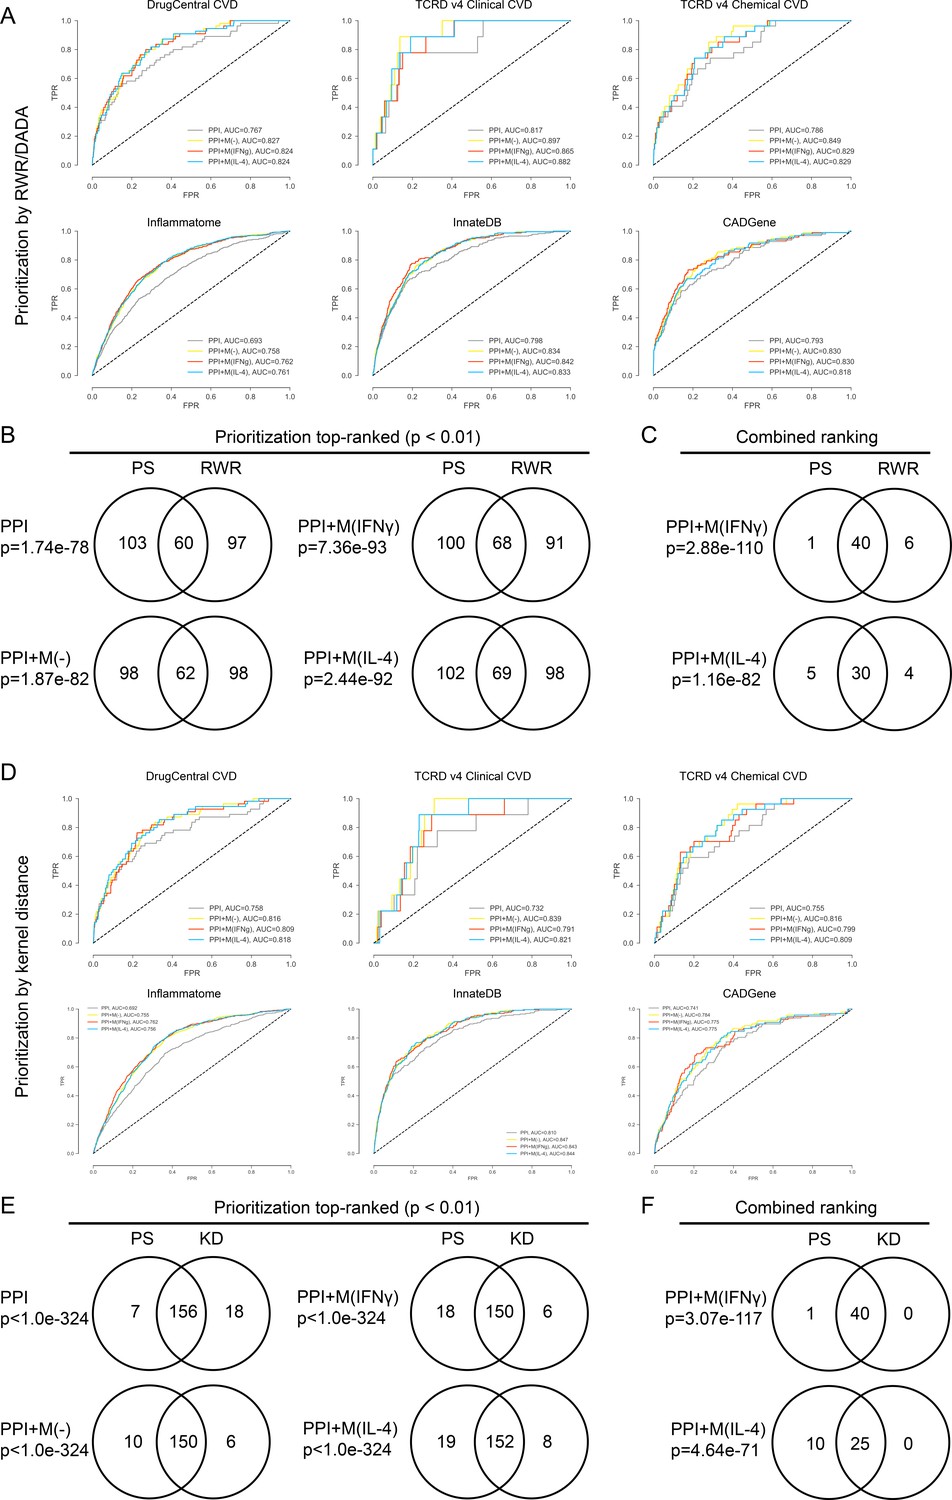
(A) ROC curves for PPI, PPI + M(-), PPI + M(IFNγ) and PPI + M(IL-4) for the validations sets, where random walk with restarts (RWR) was used as the prioritization method. (B) Venn diagrams showing the overlap in terms of the top-ranked candidates between the two cases where RWR and PS (shortest distance based proximity score used in this study) were used as the prioritization method to rank candidates. Results are shown for the non-optimized case. Fisher’s exact test was used and two-sided p-values were reported. (C) Venn diagrams showing the overlap in terms of the final combined ranking between the two cases where RWR and PS were used as the prioritization method to rank candidates. Results are shown for the non-optimized case. Fisher’s exact test was used and two-sided p-values were reported. (D) ROC curves for PPI, PPI + M(-), PPI + M(IFNγ) and PPI + M(IL-4) for the validations sets, where random walk with restarts (RWR) was used as the prioritization method. (E) Venn diagrams showing the overlap in terms of the top-ranked candidates between the two cases where KD (kernel distance) and PS (shortest distance measure used in this study) were used as the prioritization method to rank candidates. Results are shown for the non-optimized case. Fisher’s exact test was used and two-sided p-values were reported. (F) Venn diagrams showing the overlap in terms of the final combined ranking between the two cases where KD and PS were used as the prioritization method to rank candidates. Results are shown for the non-optimized case. Fisher’s exact test was used and two-sided p-values were reported.
Figure 2—figure supplement 10
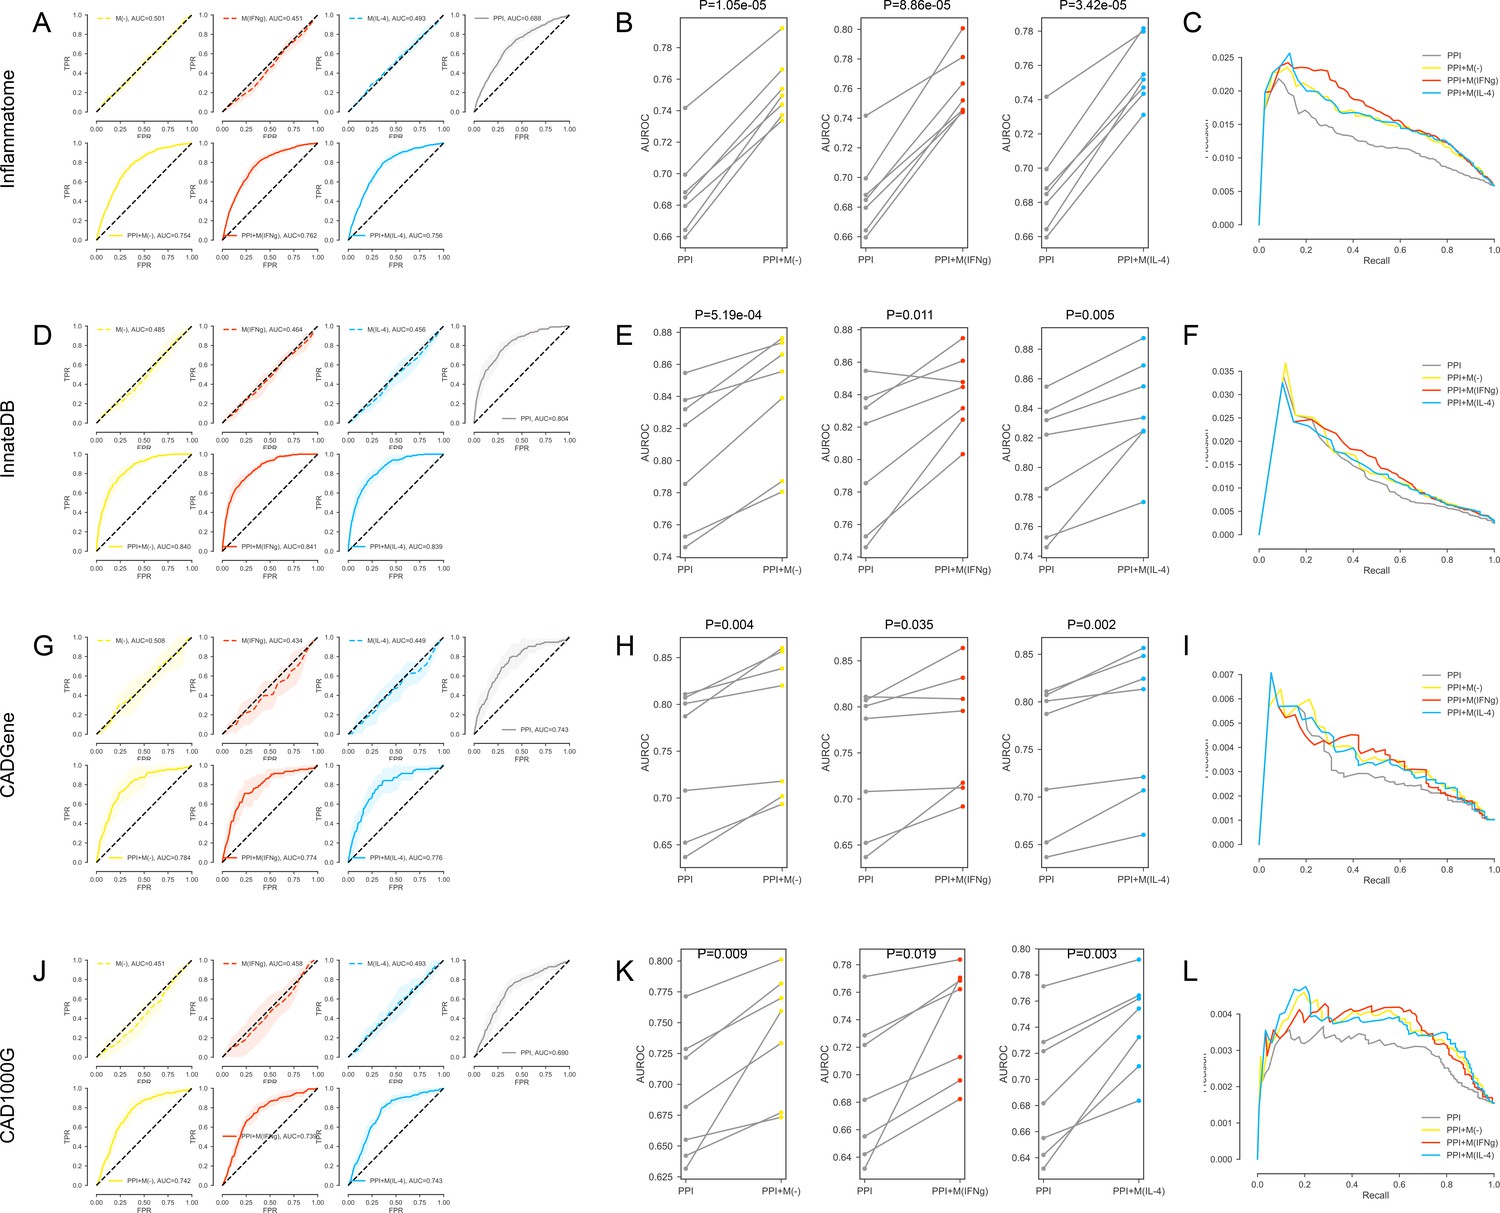
(A-C) For the inflammation (Inflammatome) signatures. (A) The k-fold cross-validated (k = 7) ROC curves for M(-), M(IFNγ), M(IL-4), PPI, PPI + M(-), PPI + M(IFNγ) and PPI + M(IL-4), respectively.Shaded regions represent the standard deviation of the AUROC values from all folds.(B) The AUROC values of each individual fold from the cross-validation for PPI and PPI + M(-), PPI and PPI + M(IFNγ), PPI and PPI + M(IL-4), respectively. Paired t-test was performed to obtain two-sided p-values. (C) Precision-recall curves for PPI, PPI + M(-), PPI + M(IFNγ) and PPI + M(IL-4). (D–F) For the innate immune response (InnateDB) signatures: (D) The k-fold cross-validated (k = 7) ROC curves for M(-), M(IFNγ), M(IL-4), PPI, PPI + M(-), PPI + M(IFNγ) and PPI + M(IL-4), respectively. Shaded regions represent the standard deviation of the AUROC values from all folds. (E) The AUROC values of each individual fold from the cross-validation for PPI and PPI + M(-), PPI and PPI + M(IFNγ), PPI and PPI + M(IL-4), respectively. Paired t-test was performed to obtain two-sided p-values. (F) Precision-recall curves for PPI, PPI + M(-), PPI + M(IFNγ) and PPI + M(IL-4). (G–I) For the coronary artery disease (CADGene) signatures: (G) The k-fold cross-validated (k = 7 for M(-) and M(IFNγ), k = 3 for M(IL-4)) ROC curves for M(-), M(IFNγ), M(IL-4), PPI, PPI + M(-), PPI + M(IFNγ) and PPI + M(IL-4), respectively. Shaded regions represent the standard deviation of the AUROC values from all folds. (H) The AUROC values of each individual fold from the cross-validation for PPI and PPI + M(-), PPI and PPI + M(IFNγ), PPI and PPI + M(IL-4), respectively. Paired t-test was performed to obtain two-sided p-values. (I) Precision-recall curves for PPI, PPI + M(-), PPI + M(IFNγ) and PPI + M(IL-4). (J–L) For the coronary artery disease (CAD1000G Extend) signatures: (J) The k-fold cross-validated (k = 7 for M(-) and M(IFNγ), k = 3 for M(IL-4)) ROC curves for M(-), M(IFNγ), M(IL-4), PPI, PPI + M(-), PPI + M(IFNγ) and PPI + M(IL-4), respectively. Shaded regions represent the standard deviation of the AUROC values from all folds. (K) The AUROC values of each individual fold from the cross-validation for PPI and PPI + M(-), PPI and PPI + M(IFNγ), PPI and PPI + M(IL-4), respectively. Paired t-test was performed to obtain two-sided p-values. (L) Precision-recall curves for PPI, PPI + M(-), PPI + M(IFNγ) and PPI + M(IL-4).
Figure 3 with 3 supplements
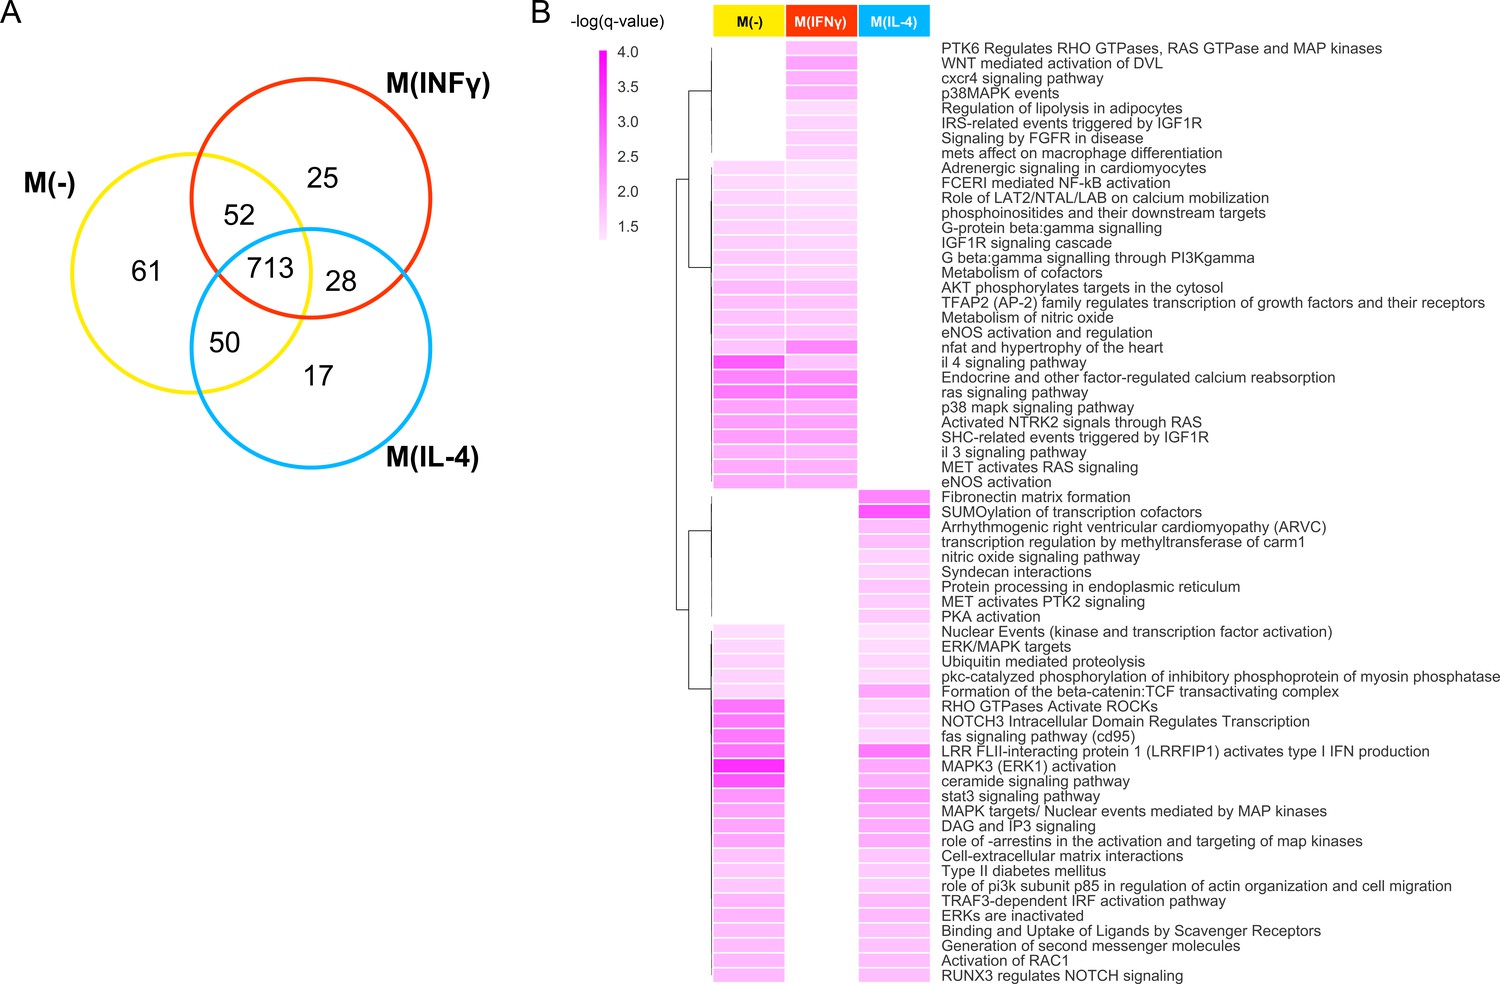
Pathways of top prioritized proteins.
(A) The Venn diagram showing the shared pathways between the significantly enriched (q-value <0.05) pathways of the top candidates (empirical p-value<0.01) prioritized by the addition of the M(-), M(IFNγ) and M(IL-4) co-abundance networks to the PPI network. (B) The hierarchically clustered condition-specific pathways (see Figure 3—figure supplement 1 for a full list). Darker shades of colors indicate a higher enrichment in terms of the negative logarithm of q-value.
-
Figure 3—source data 1
Source data for Figure 3: All enriched pathways of the top N (p<0.01) prioritized proteins.
- https://cdn.elifesciences.org/articles/37059/elife-37059-fig3-data1-v2.xlsx
Figure 3—figure supplement 1
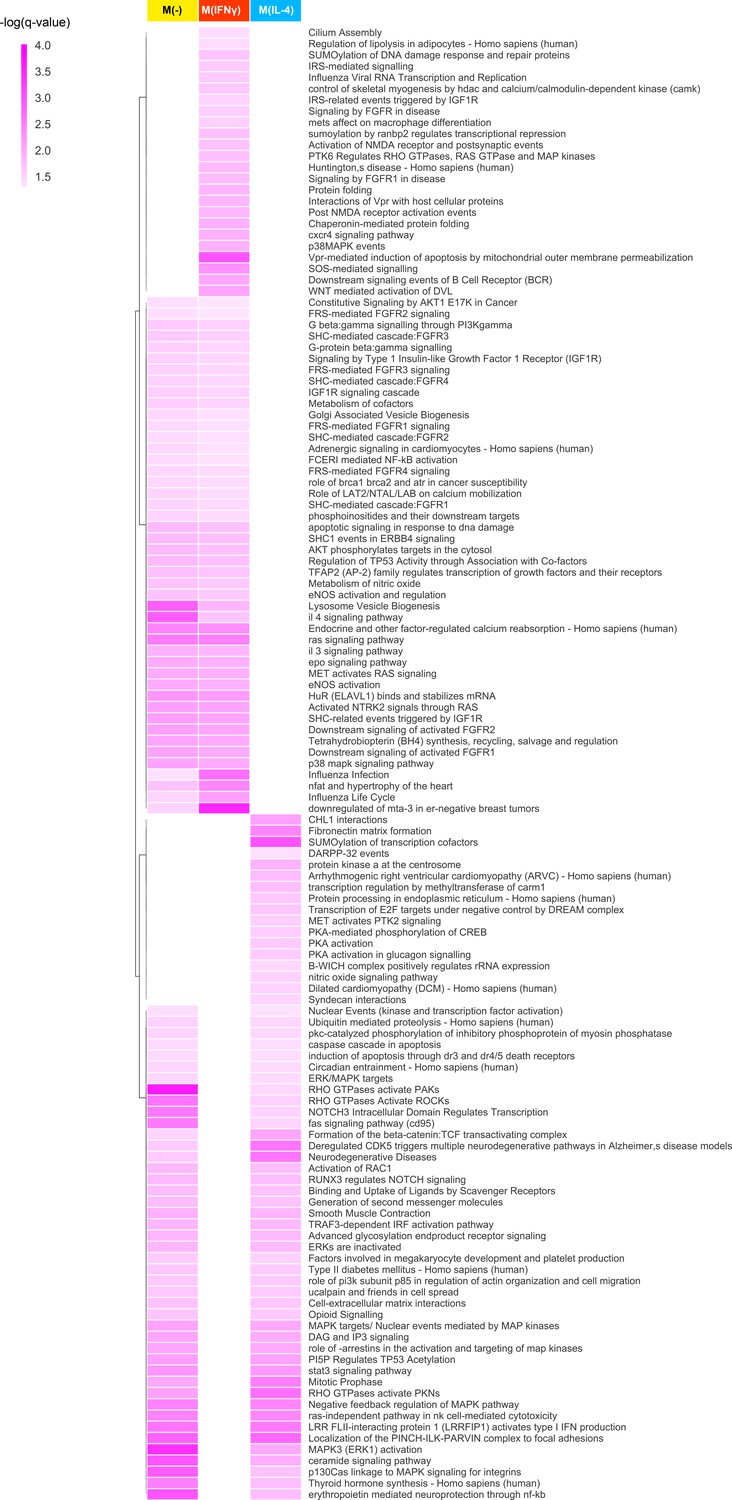
The full list of hierarchically clustered condition-specific pathways.
Darker shades of colors indicate a higher enrichment in terms of the negative logarithm of q-value.
-
Figure 3—figure supplement 1—source data 1
The enrichment p-values of the condition-specific pathways shown in the clustered heatmap of Figure 3—figure supplement 1.
- https://cdn.elifesciences.org/articles/37059/elife-37059-fig3-figsupp1-data1-v2.xlsx
Figure 3—figure supplement 2
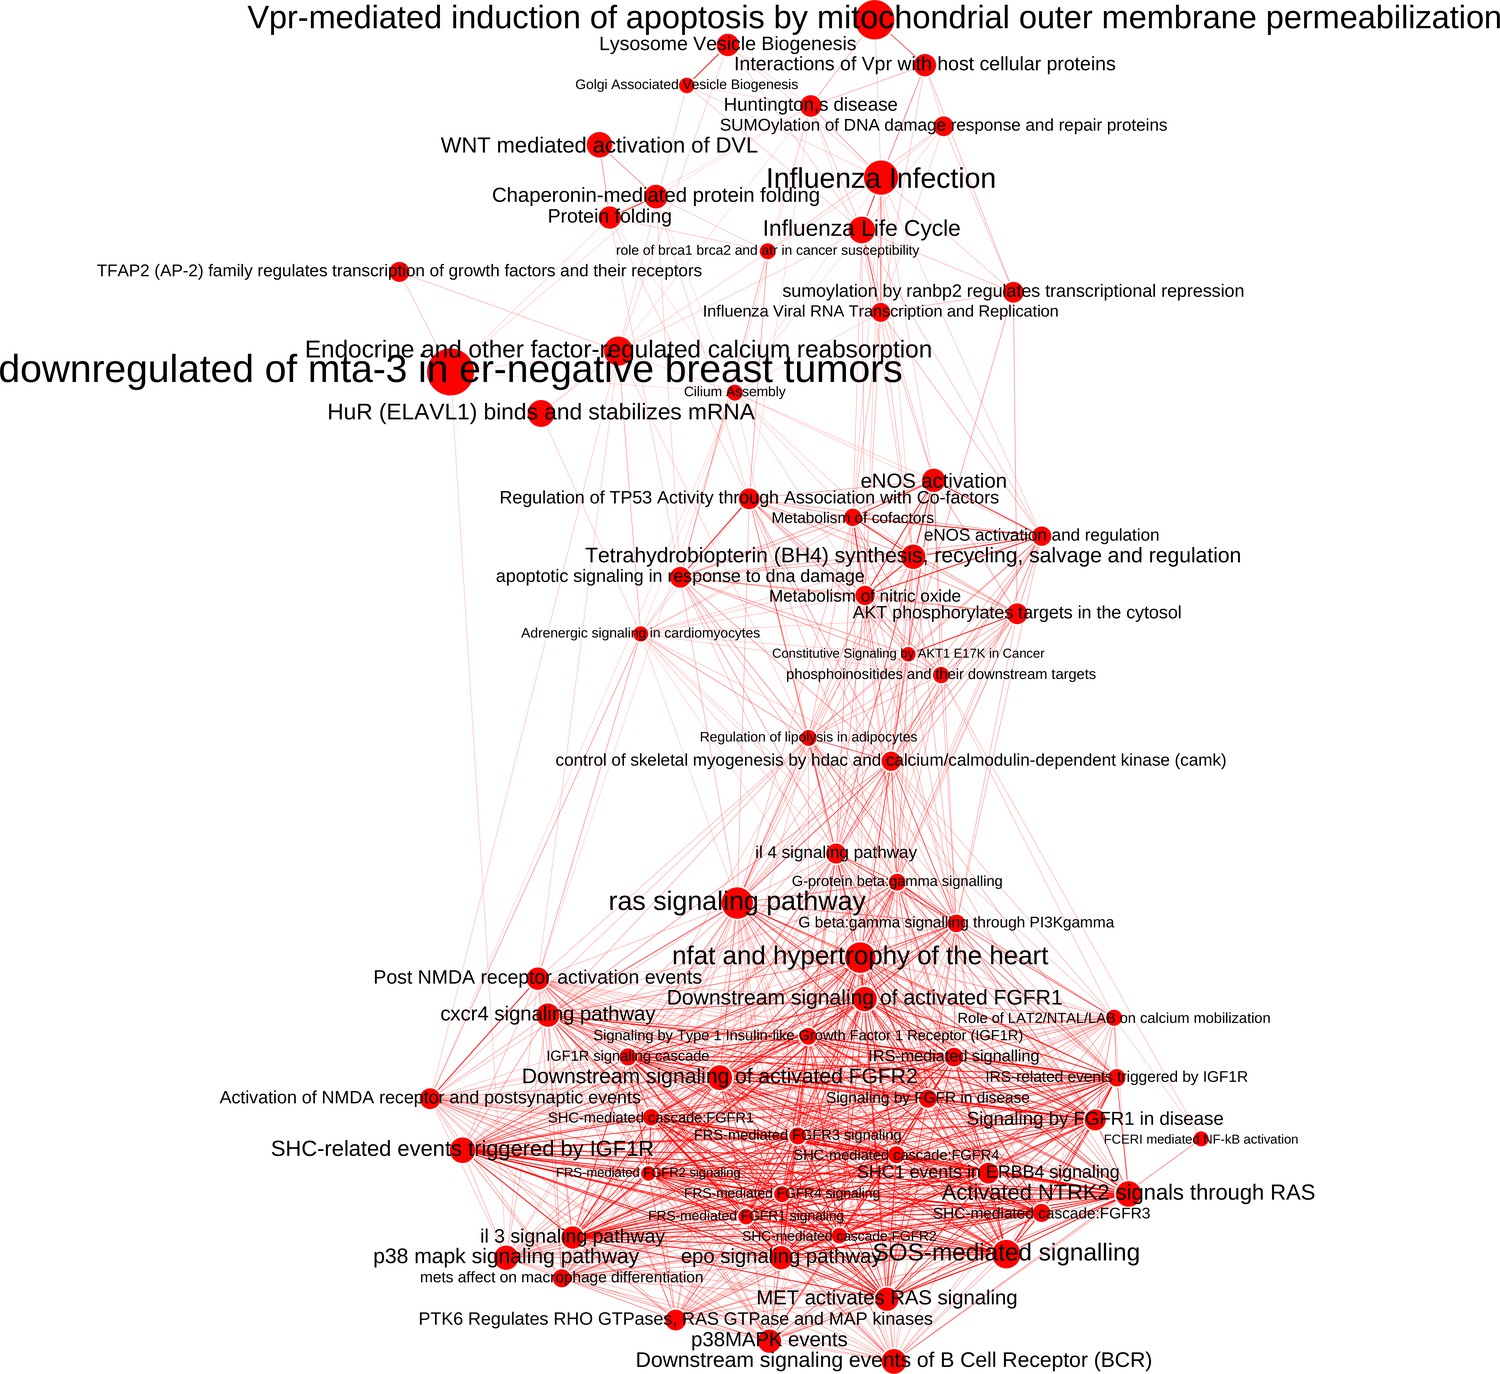
The network of significantly enriched pathways of the top-ranked (empirical p-value<0.01) candidates prioritized by the addition of the M(IFNγ) co-abundance network to the PPI network.
Node size indicates the significance of each pathway in –log(q-value) and edge thickness represents the overlap between the genes of the two pathways they connect, measured in terms of the Jaccard index.
Figure 3—figure supplement 3
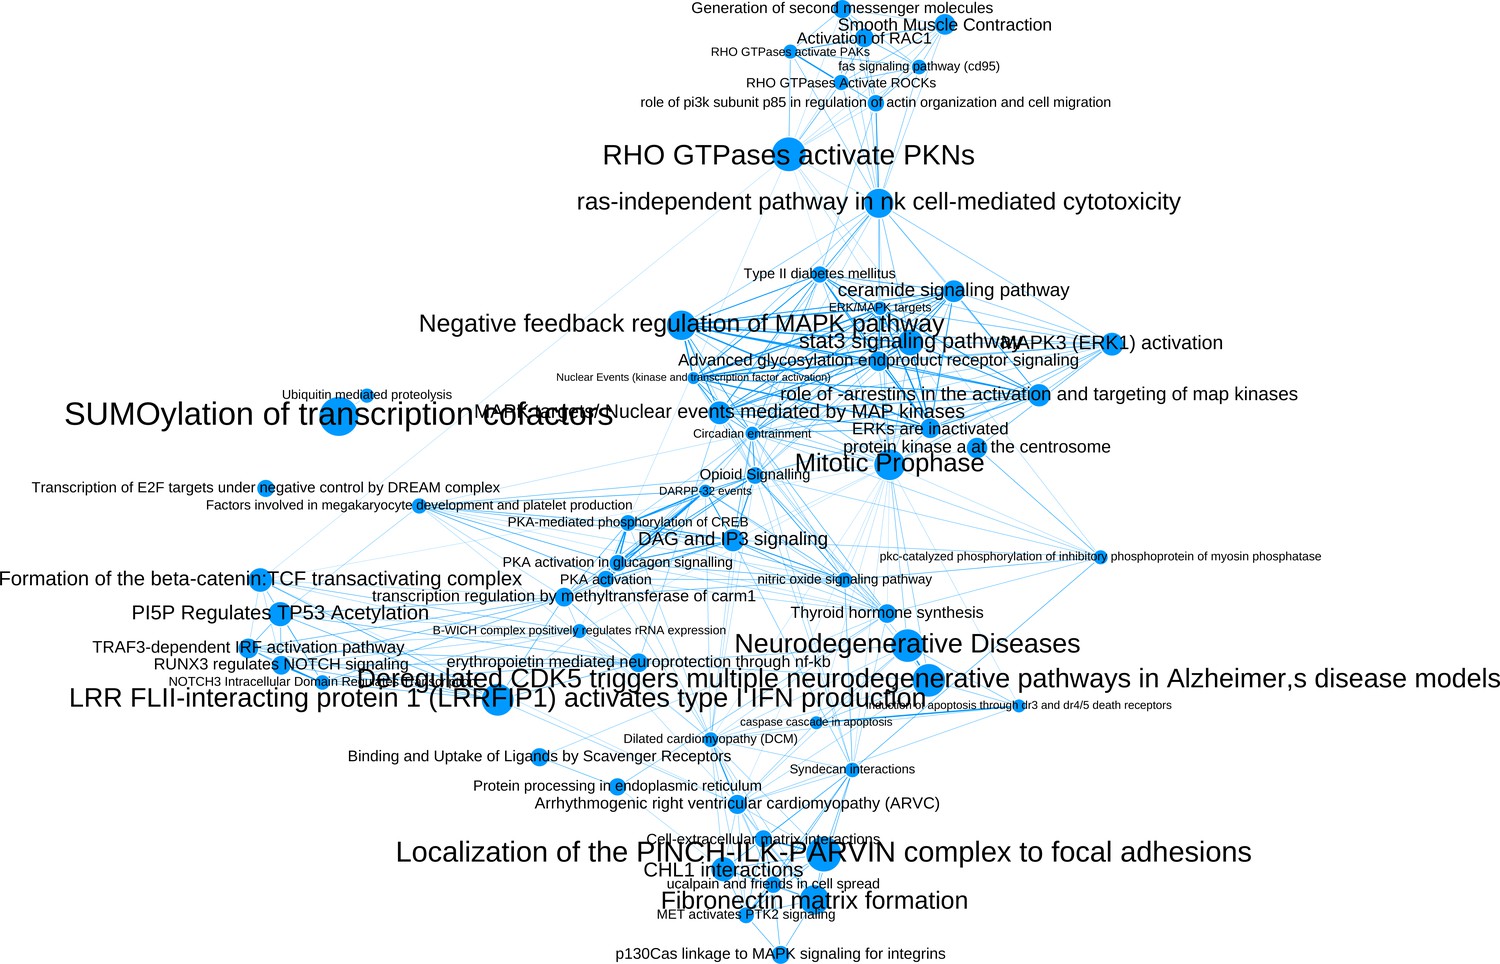
The network of significantly enriched pathways of the top-ranked (empirical p-value<0.01) candidates prioritized by the addition of the M(IL-4) co-abundance network to the PPI network.
Node size indicates the significance of each pathway in –log(q-value) and edge thickness represents the overlap between the genes of the two pathways they connect, measured in terms of the Jaccard index.
Figure 4 with 3 supplements
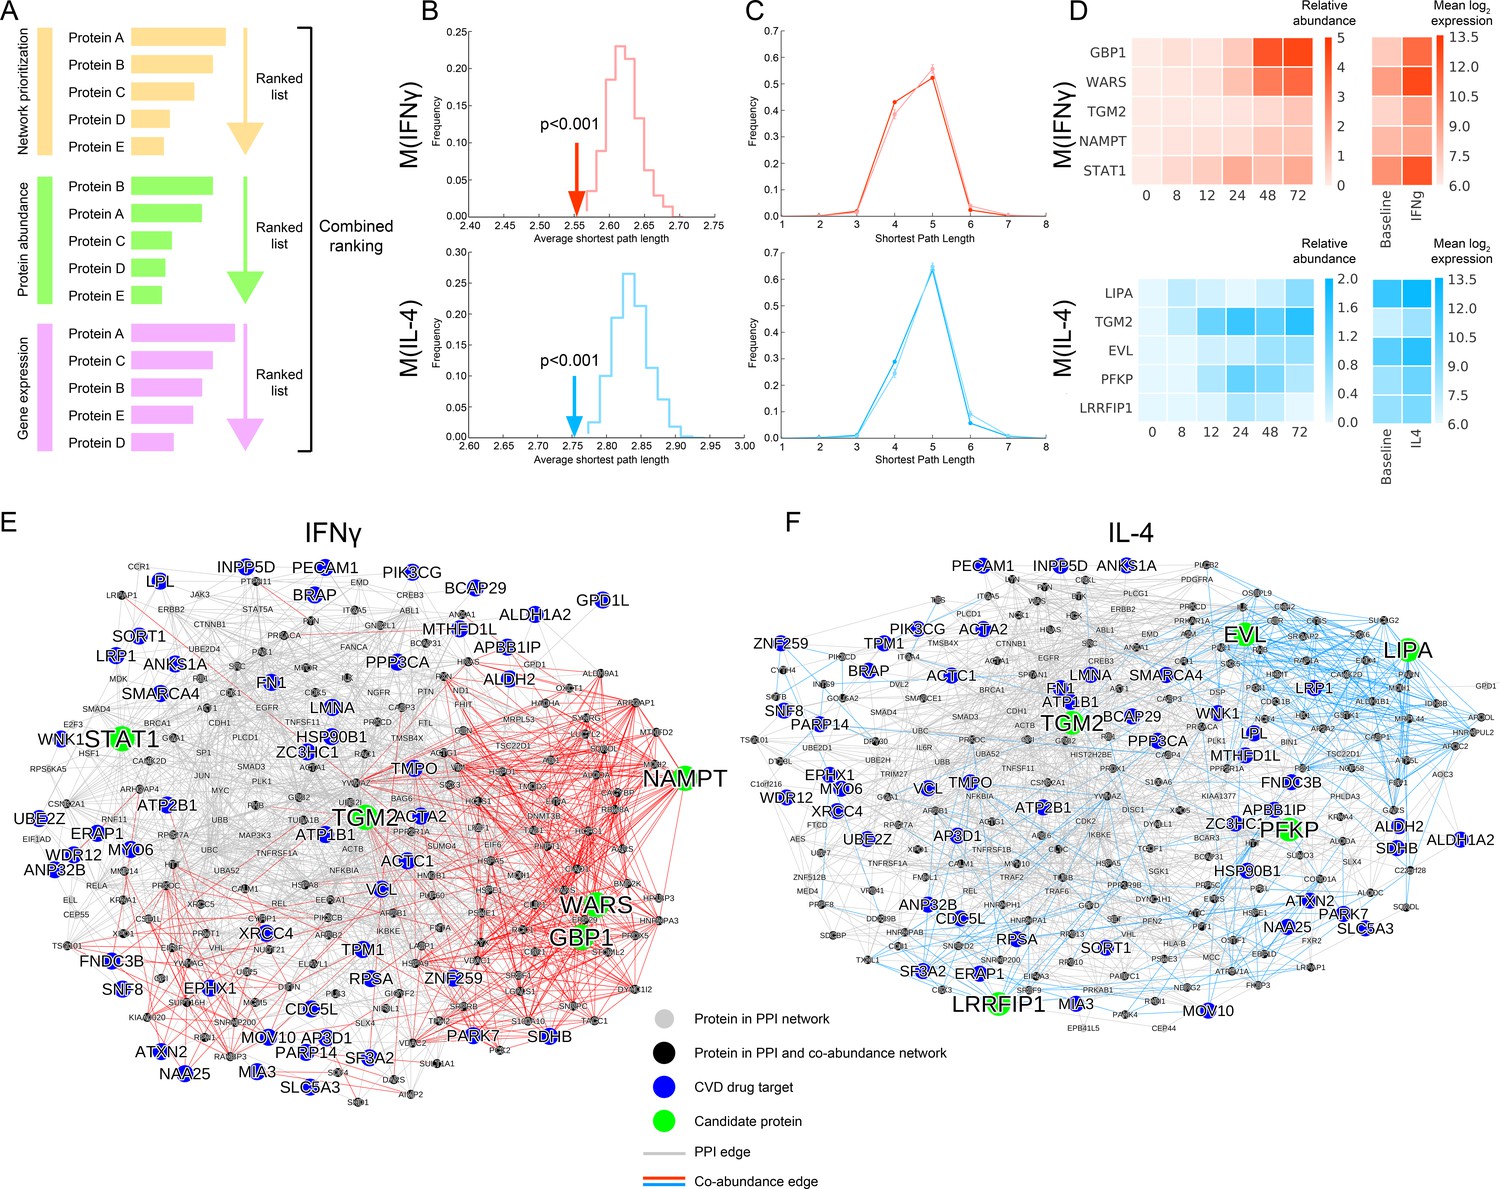
Selection of top target candidates by incorporating expression and abundance data.
(A) Overview of the filtering/combined ranking scheme. Three rankings were performed according to: (i) the network prioritization, (ii) the relative protein abundance difference with respect to baseline M(-) over all time points, and (iii) the gene expression fold change with respect to baseline M(-) from human macrophage transcriptome data (Xue et al., 2014) (see Mateials and methods). (B) The average shortest path length between the filtered candidates and CVD drug targets (shown with arrows) compared to random expectation (shown as the distribution), with red indicating M(IFNγ) and blue indicating M(IL-4). Degree-preserving node randomization was performed for 1000 realizations. (C) The shortest path length distributions between the filtered candidates and CVD drug targets. Darker shades indicate the real shortest path length distribution and the lighter shades with error bars indicate random expectation. Degree-preserving node randomization was performed for 1000 realizations. Shorter path lengths (such as four steps) are significantly over-represented in the real case compared to random, whereas longer path lengths (such as six steps) are significantly under-represented in the real case compared to random (empirical p-values<0.001). (D) Relative protein abundance and gene expression (mean log 2 transformed) values of the top five ranked candidates. The relative protein abundance was calculated by subtracting the baseline M(-) for all time points between and including 0 and 72 hr. (E) Subnetwork showing the paths between the top five ranked candidates from M(IFNγ) and CVD drug targets. Grey edges indicate PPI network edges and red edges indicate M(IFNγ) co-abundance edges. (F) Subnetwork showing the paths between the top five ranked candidates from M(IL-4) and CVD drug targets. Grey edges indicate PPI network edges and blue edges indicate M(IL-4) co-abundance edges. In (E) and (F), the networks were constructed by calculating all shortest paths between every (top candidate, CVD target) pair. Node size corresponds to node degree.
Figure 4—figure supplement 1
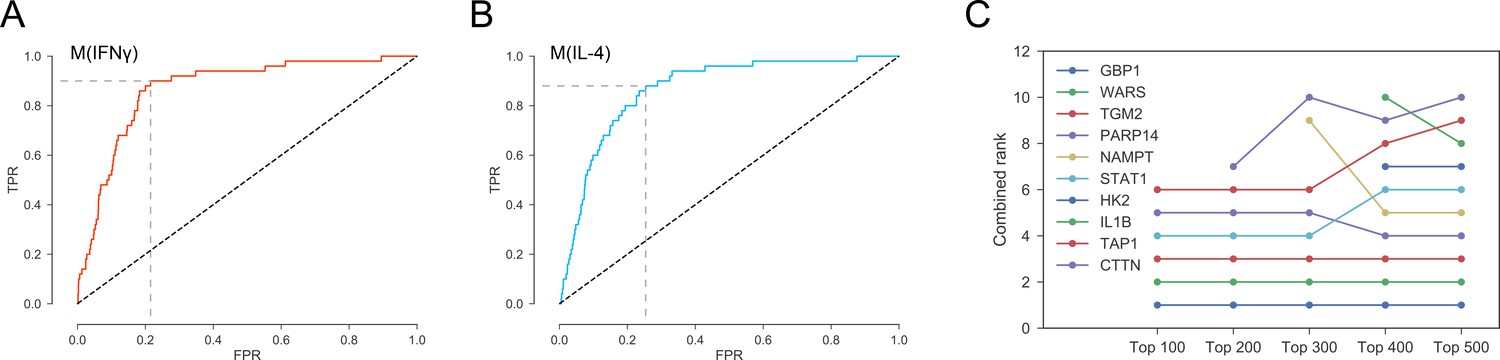
(A) Optimal threshold on the network-based prioritization ranking maximizing the sum of sensitivity and specificity. The optimal threshold value was the top 2971 candidates for M(IFNγ).(B) Optimal threshold on the network-based prioritization ranking maximizing the sum of sensitivity and specificity. The optimal threshold value was the top 3496 candidates for M(IL-4). (C) The sensitivity of the combined ranks to the filtering based on expression and abundance. ‘Top 100’ indicates proteins filtered by choosing the top 100 in gene expression and protein abundance, and so on.
Figure 4—figure supplement 2
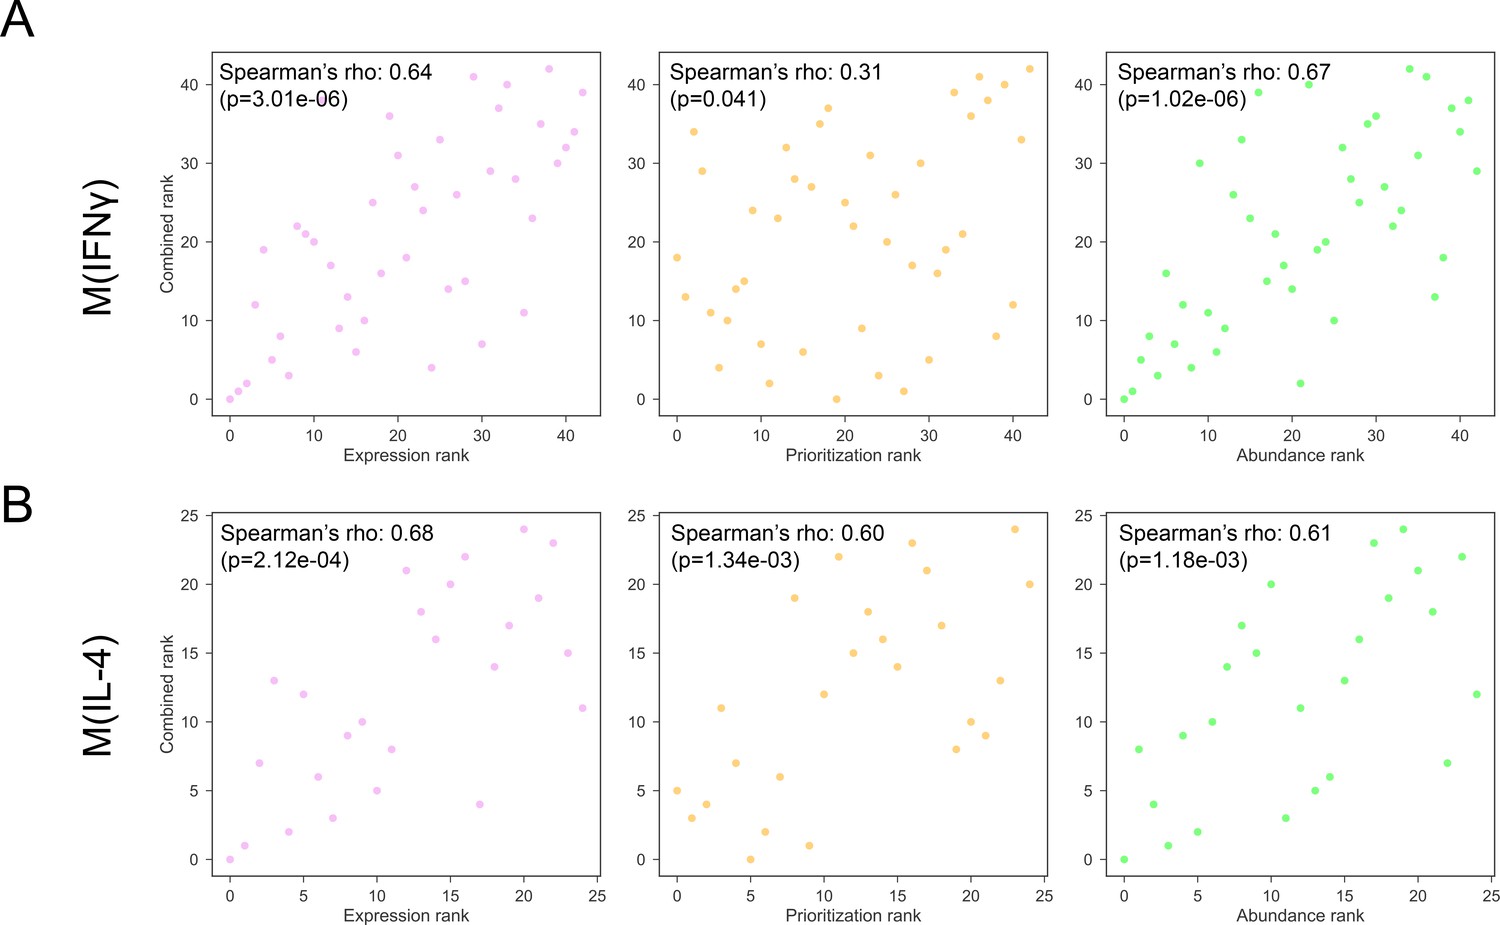
(A) The Spearman’s correlation of combined ranking with each constituent ranking, that is gene expression, network prioritization, and protein abundance, respectively, for M(IFNγ). (B) The Spearman’s correlation of combined ranking with each constituent ranking, that is gene expression, network prioritization, and protein abundance, respectively, for M(IL-4).
Figure 4—figure supplement 3
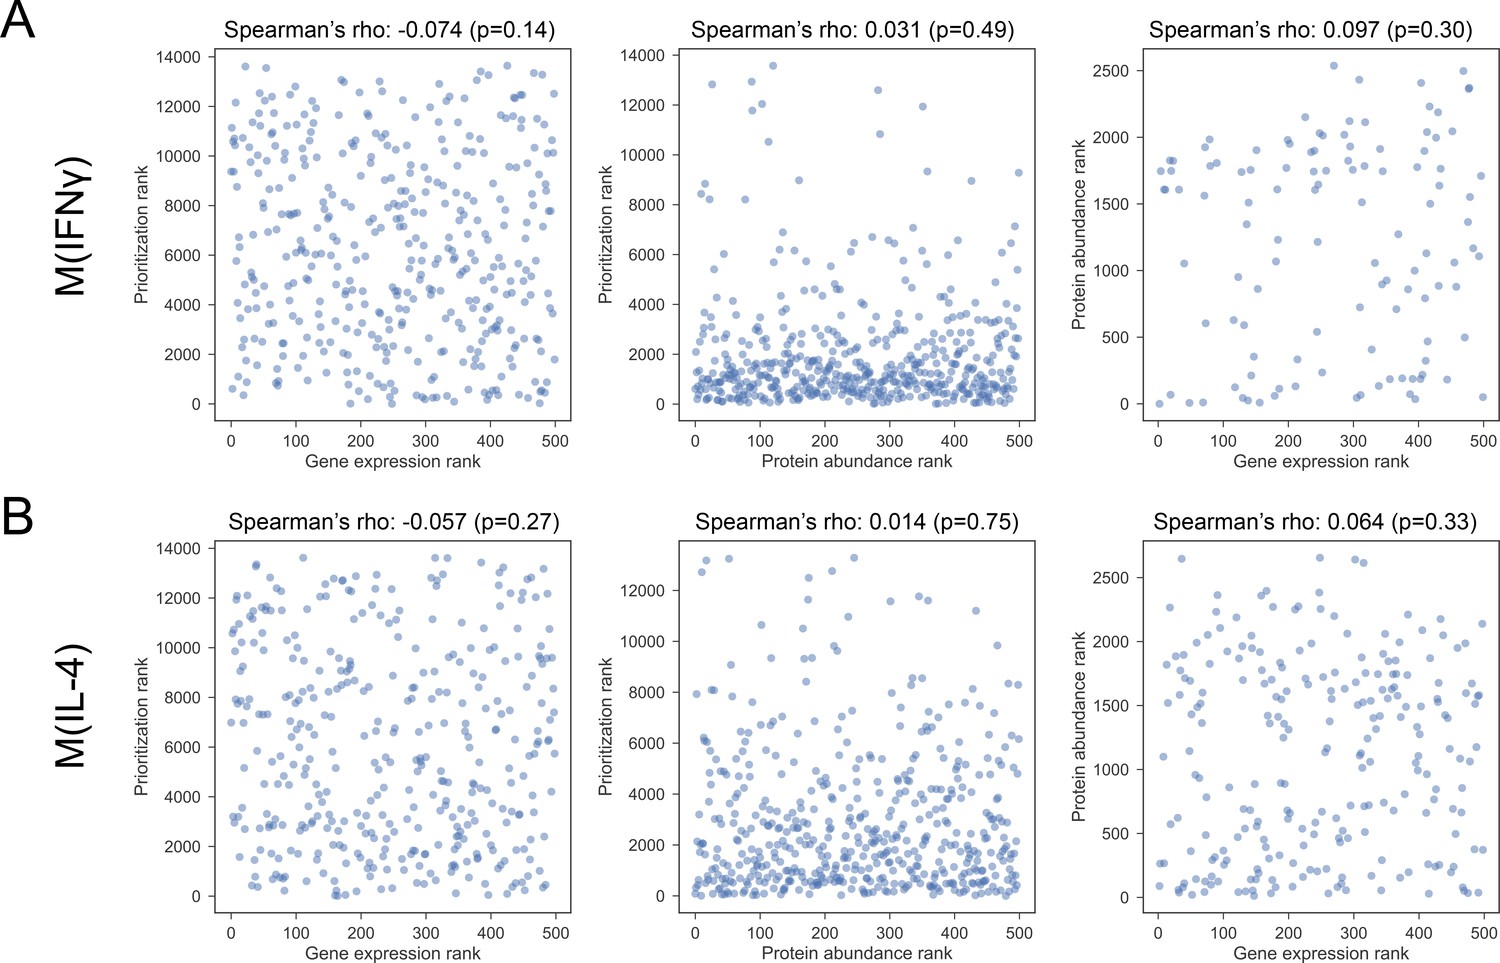
(A) The Spearman’s correlation between pairs of constituent rankings for M(IFNγ). (B) The Spearman’s correlation between pairs of constituent rankings for M(IL-4).
Figure 5 with 3 supplements
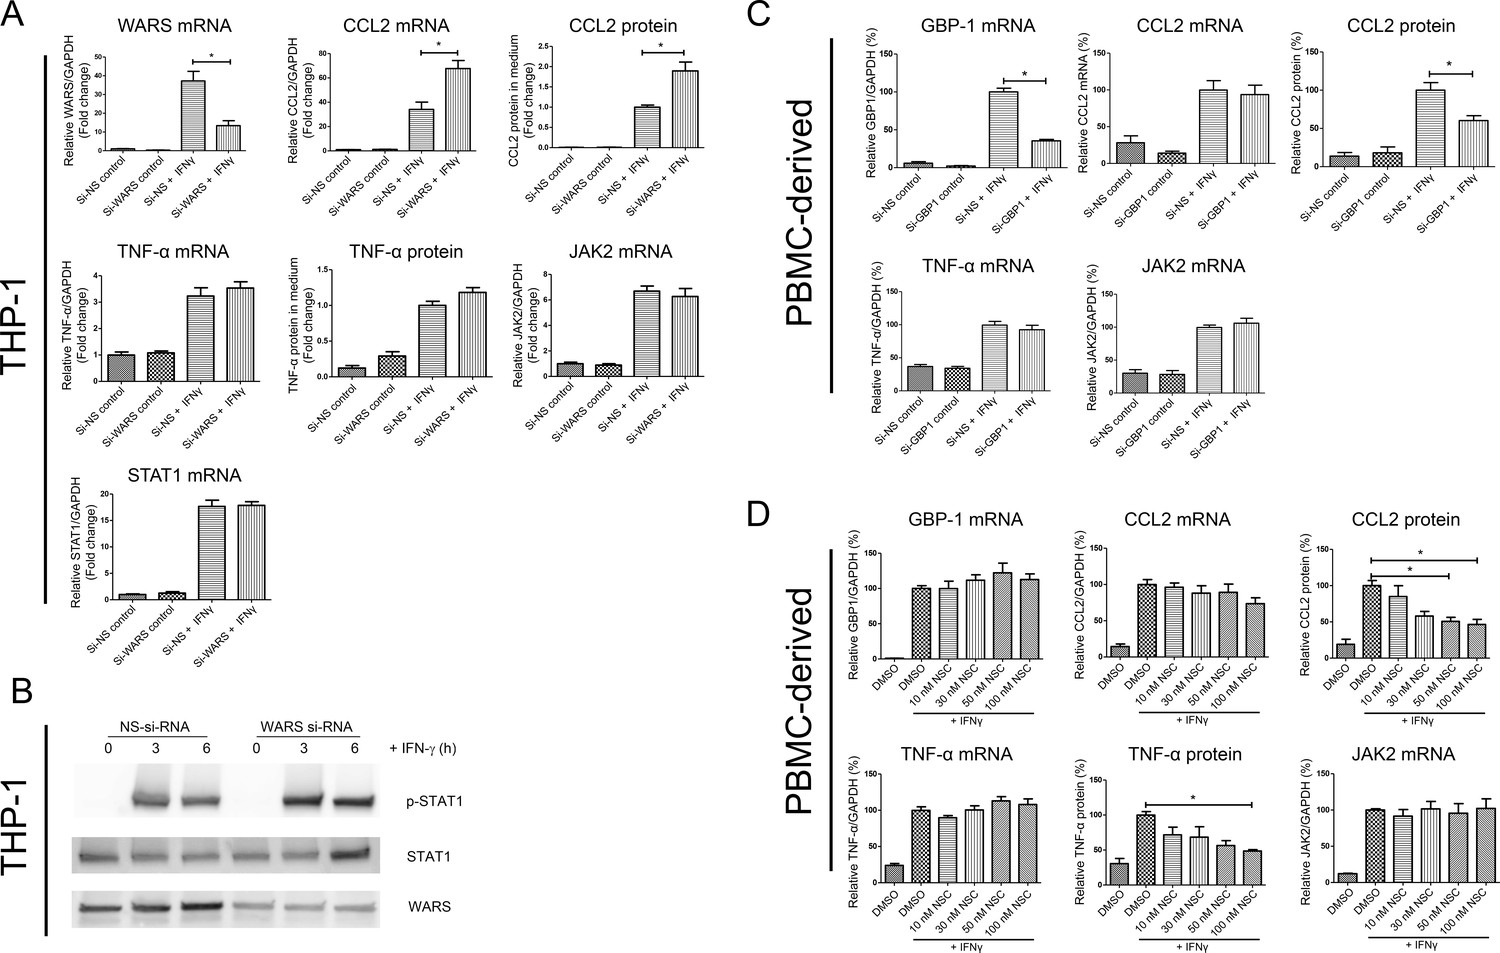
In vitro loss-of-function experiments for GBP1 and WARS.
(A) Relative mRNA and protein expression levels for CCL2, TNFα, JAK2 and STAT1 and with WARS silencing under control and IFNγ stimulation conditions, performed on THP-1-differentiated macrophage-like cells.(n = 8–12 samples from three to four experiments) (B) Western blot showing protein expression levels of pSTAT1 with WARS silencing under control and IFNγ stimulation conditions, performed on THP-1-differentiated macrophage-like cells. Data shown as representative image from three experiments (C) Relative mRNA and protein expression levels of CCL2, TNFα and JAK2 with GBP1 silencing under control and IFNγ stimulation conditions, performed on human primary PBMC-derived macrophages (n = 9–12 samples from four human donors). (D) Relative mRNA and protein expression levels for CCL2, TNFα, and JAK2 under treatment with NSC756093, a GBP1-PIM1 inhibitor, in human PBMC-derived macrophages (n = 7–10 samples from four human donors) stimulated with IFNγ for 24 hr. mRNA expression levels were measured by RT-PCR and normalized by GAPDH expression. Protein in culture media was detected by ELISA. In all figures, *p<0.05, one-way ANOVA unless otherwise noted.
Figure 5—figure supplement 1

(A) Protein expression level of CCL2 with WARS silencing under control and IFNγ stimulation conditions, performed on human primary PBMC-derived macrophages. *p<0.05, Student’s t-test. (B) Western blot analysis showing the protein levels of phosphorylation of STAT1 with WARS silencing under control and IFNγ stimulation conditions, performed on human primary PBMC-derived macrophages. (C) Relative mRNA and protein expression levels for CCL2, TNFα, STAT1, JAK2 and CD36 with GBP1 silencing under control and IFNγ stimulation conditions, performed on THP-1-differentiated macrophage-like cells. (D) Western blot analysis showing the protein levels of JAK2 and phospho-STAT1 with GBP1 silencing in THP-1 macrophage-like cells at 3 and 6 hr after IFNγ stimulation.
Figure 5—figure supplement 2
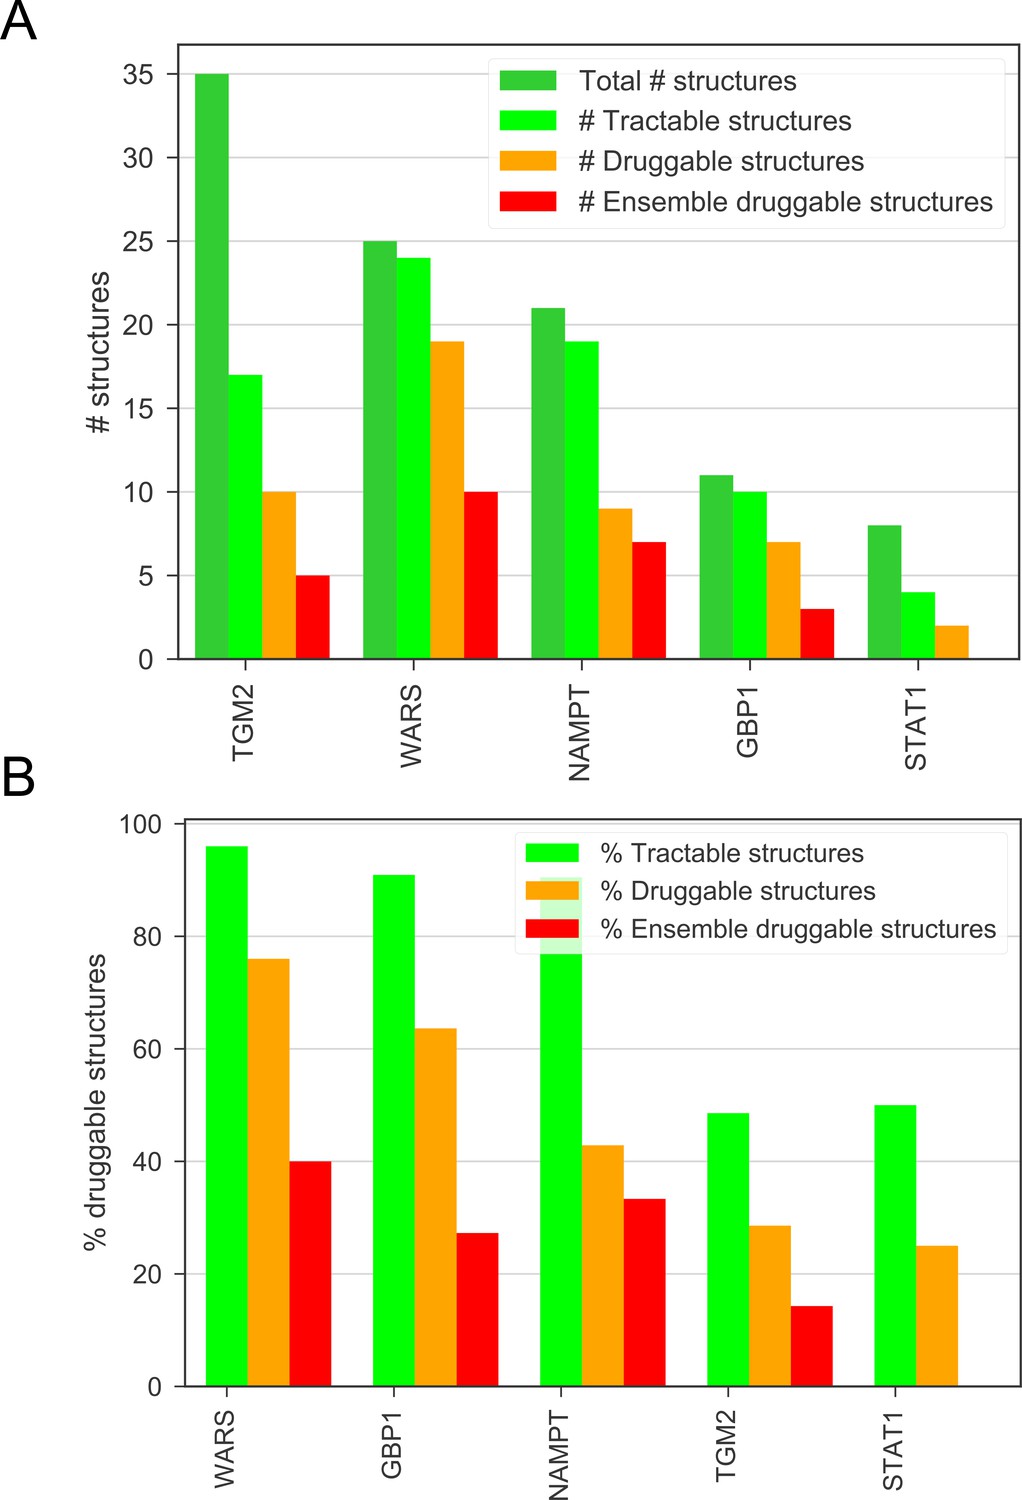
(A) The number of total, tractable, druggable and ensemble druggable structures in the top candidates, given by the DrugEBIlity database. (B) The percentage of tractable, druggable and ensemble druggable structures in the top candidates compared to the total number of structures, given by the DrugEBIlity database.
Figure 5—figure supplement 3
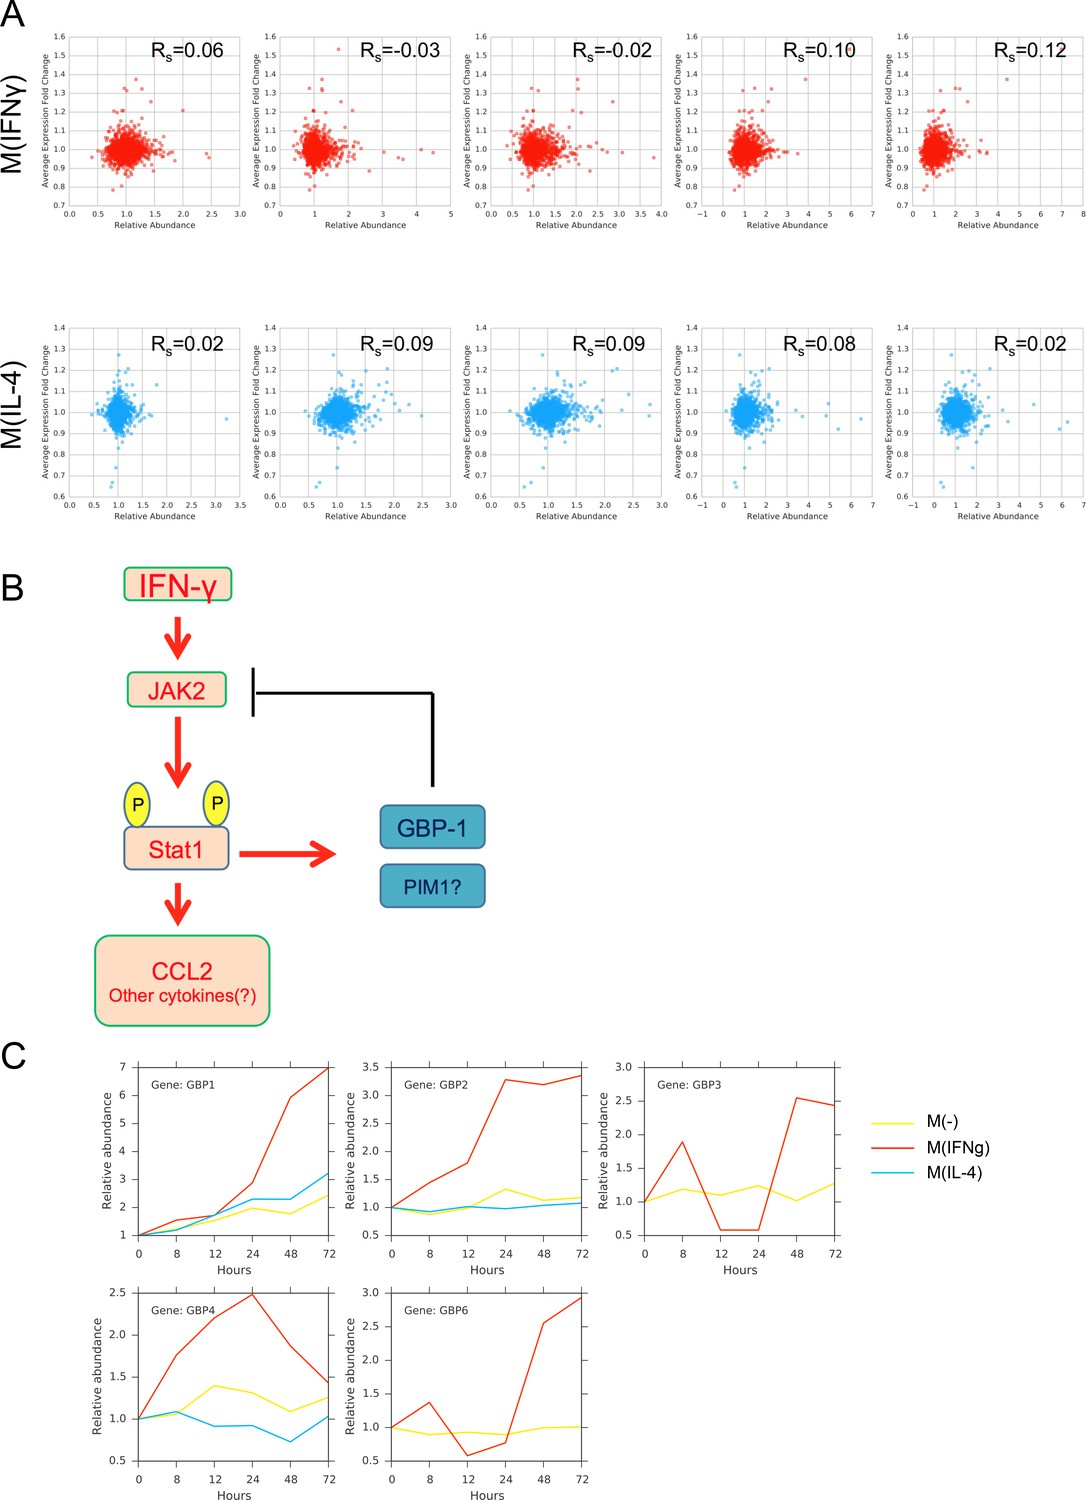
(A) Spearman correlation values between the gene expression and protein abundance for the top 2826 candidates for M(IFNγ) and the top 4109 candidates for M(IL-4), based on maximizing the sum of sensitivity and specificity. (B) Putative feedback regulation of GBP1 on the JAK2-STAT1-CCL2 signaling pathway. (C) Abundance profiles of GBP family of genes found in the proteomics measurements.
Additional files
-
Supplementary file 1
Topological properties of the PPI network and co-abundance networks.
- https://cdn.elifesciences.org/articles/37059/elife-37059-supp1-v2.docx
-
Supplementary file 2
Overlap of co-abundance networks with large-scale binary and affinity-purification-mass spectrometry (AP-MS) based interactomes (Fisher's exact test, two-sided p-values).
- https://cdn.elifesciences.org/articles/37059/elife-37059-supp2-v2.docx
-
Supplementary file 3
Overlap of the top prioritized (p<0.01) proteins with inflammation, innate immune response, and coronary artery disease signatures (Fisher's exact test, two-sided p-values).
- https://cdn.elifesciences.org/articles/37059/elife-37059-supp3-v2.docx
-
Transparent reporting form
- https://cdn.elifesciences.org/articles/37059/elife-37059-transrepform-v2.docx
Download links
A two-part list of links to download the article, or parts of the article, in various formats.
Downloads (link to download the article as PDF)
Open citations (links to open the citations from this article in various online reference manager services)
Cite this article (links to download the citations from this article in formats compatible with various reference manager tools)
Context-enriched interactome powered by proteomics helps the identification of novel regulators of macrophage activation
eLife 7:e37059.
https://doi.org/10.7554/eLife.37059


