Integrated culturing, modeling and transcriptomics uncovers complex interactions and emergent behavior in a three-species synthetic gut community
- Rega Institute, Belgium
- VIB-KU Leuven Center for Microbiology, Belgium
- Vrije Universiteit Brussel, Belgium
- Université Libre de Bruxelles, Belgium
- Interuniversity Institute of Bioinformatics in Brussels, Belgium
- KU Leuven, Belgium
Figures
Figure 1
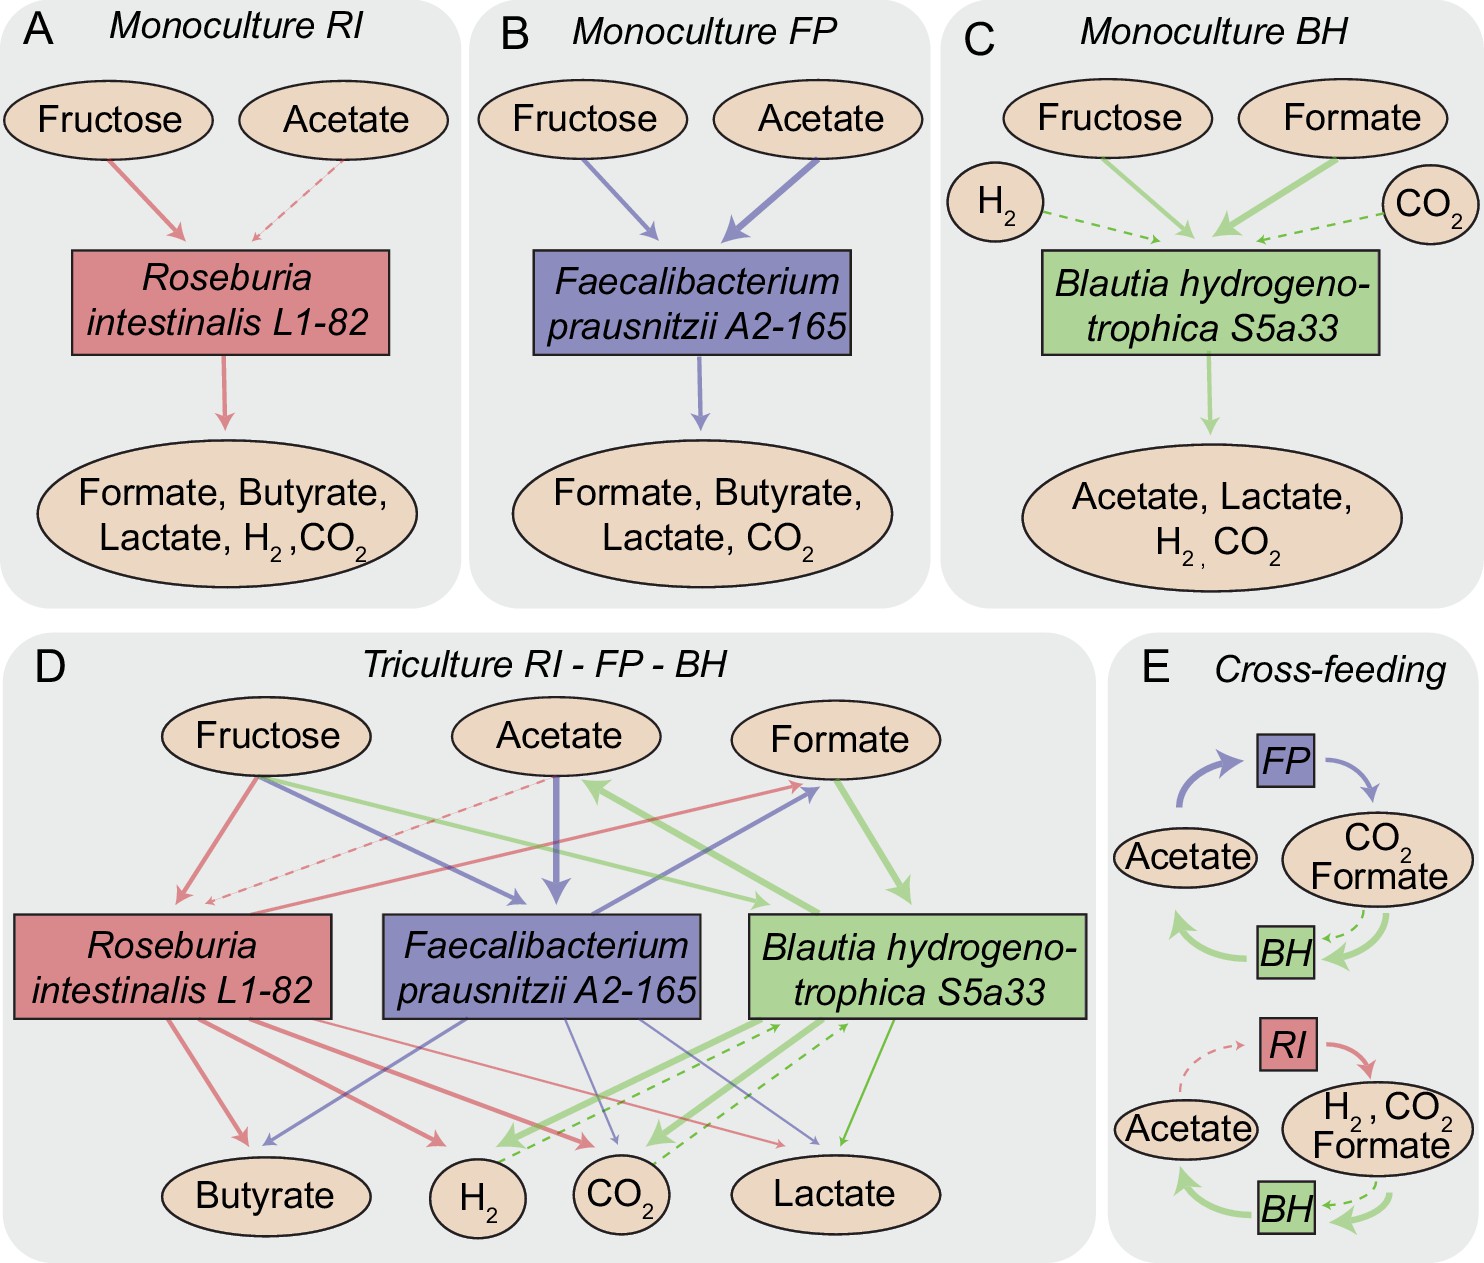
Overview of metabolite-mediated strain interactions.
(A–C) Strain-specific metabolite consumption and production. (D) Metabolite-mediated interactions present in the tri-culture. (E) Cross-feeding interactions between Faecalibacterium prausnitzii A2-165 (FP) and Blautia hydrogenotrophica S5a33 (BH) as well as between Roseburia intestinalis L1-82 (RI) and BH. The dashed arrow from acetate to RI denotes net acetate consumption. The dashed arrows from hydrogen and CO2 to BH indicate the potential of this bacterium to grow autotrophically on these gasses.
Figure 2
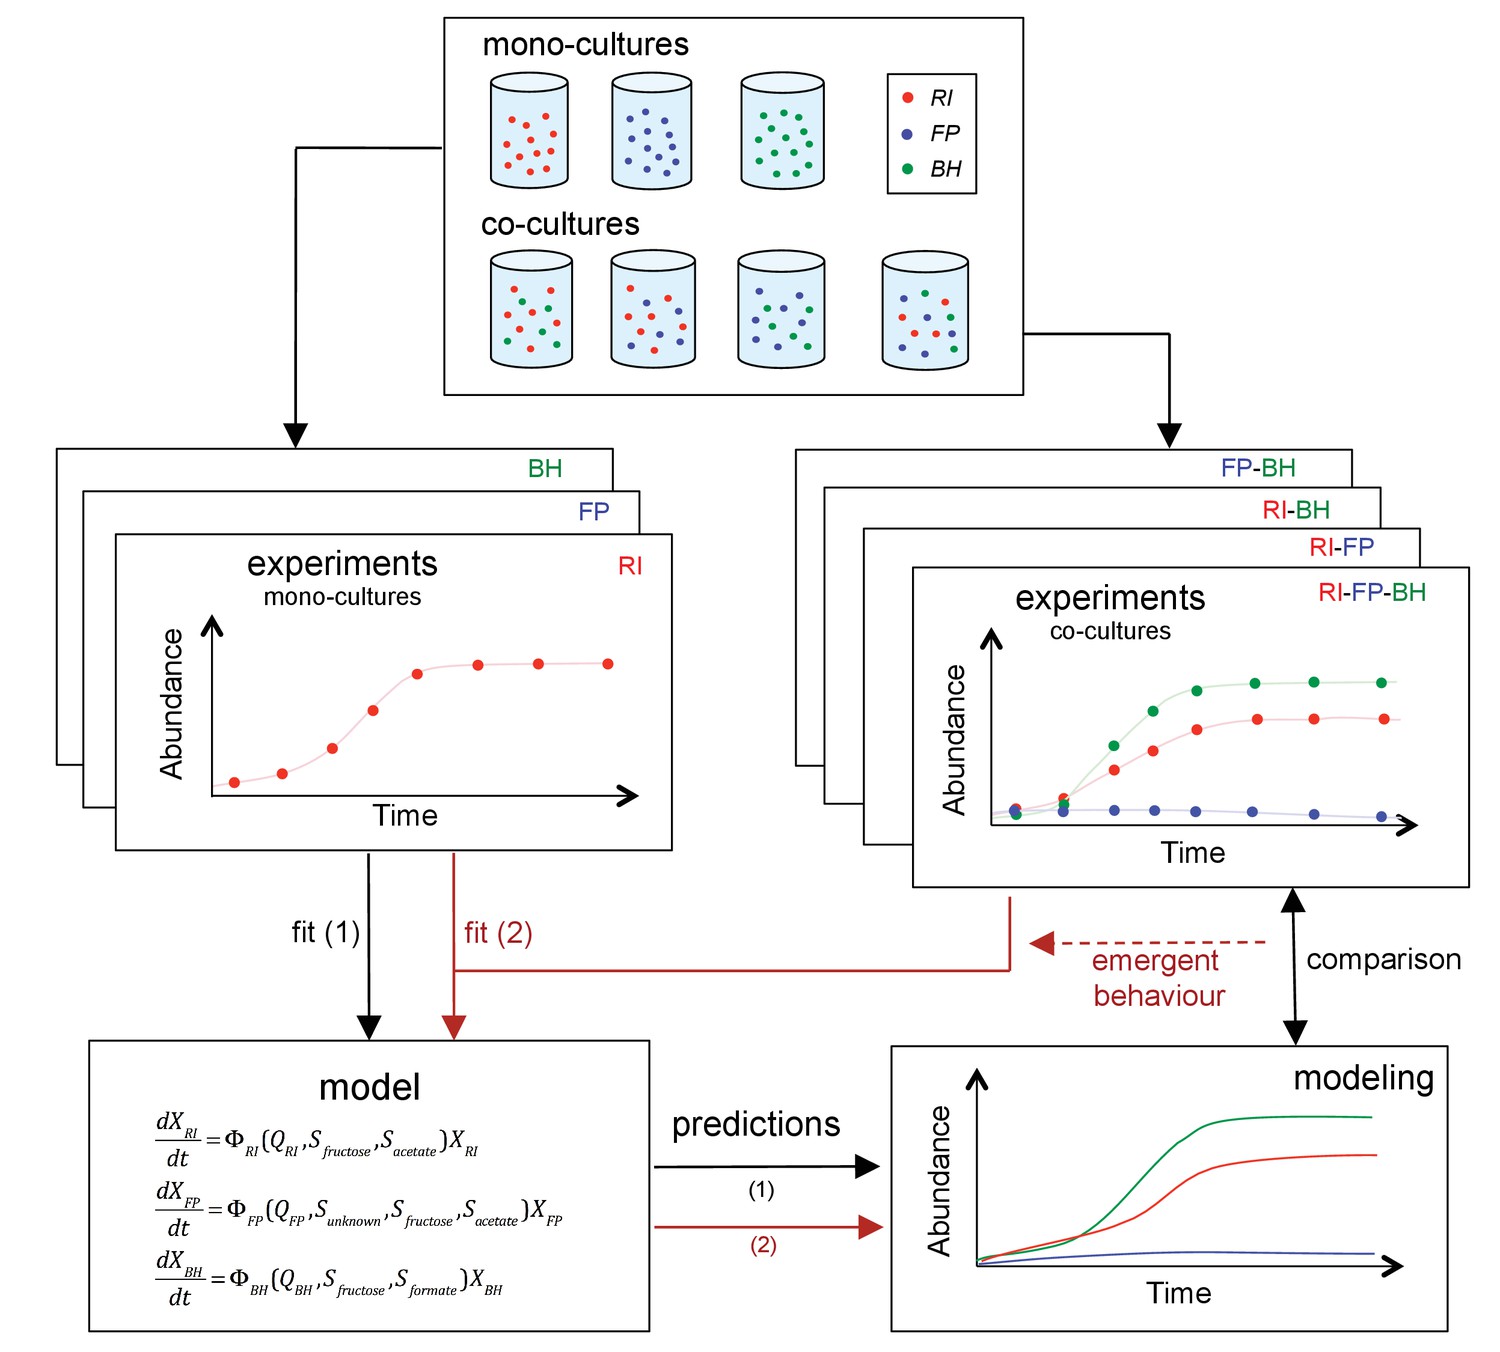
Scheme summarizing the experimental set-up and modeling approach.
A mechanistic model of a three-strain community consisting of Roseburia intestinalis L1-82 (RI), Faecalibacterium prausnitzii A2-165 (FP) and Blautia hydrogenotrophica S5a33 (BH) is parameterized on mono-cultures, but does not describe tri-culture dynamics well. Data from bi-cultures are taken into account to improve the goodness of fit to the tri-culture data, thereby indicating emergent behavior.
Figure 3 with 2 supplements

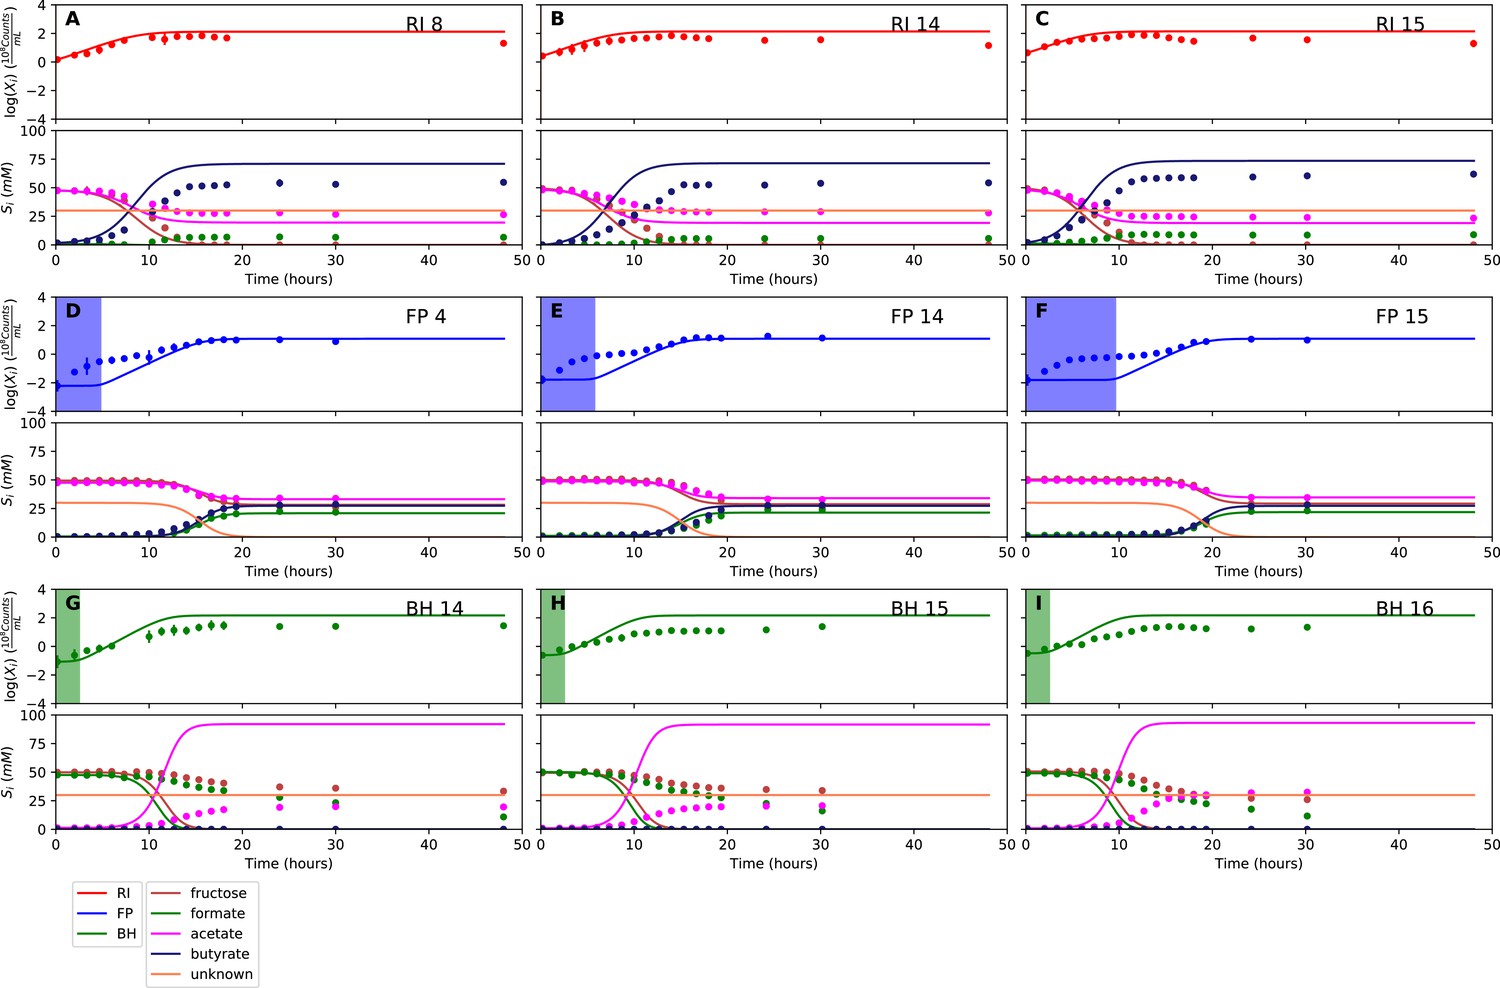
Summary of fermentation data.
Biological replicates are plotted together in one panel, with their mean shown in bold. For each set of experiments, species abundances quantified by qPCR are plotted in the top half of the panel and metabolite concentrations in the bottom half. (A–C) Monocultures of Roseburia intestinalis L1-82 (RI), Faecalibacterium prausnitzii A2-165 (FP) and Blautia hydrogenotrophica S5a33 (BH). (D–F) The three co-culture combinations of RI, FP and BH with initial acetate. (G–H) Co-cultures of RI versus BH and FP versus BH without initial acetate. (I–J) The tri-culture replicates are separated into those dominated by RI and BH (I) and those dominated by FP and BH (J).
-
Figure 3—source data 1
The qPCR data and HPLC measurements are reported as the mean across three technical replicates for each of the fermentation experiments shown in Figure 3.
The gas measurements are also included.
- https://doi.org/10.7554/eLife.37090.009
Figure 3—figure supplement 1
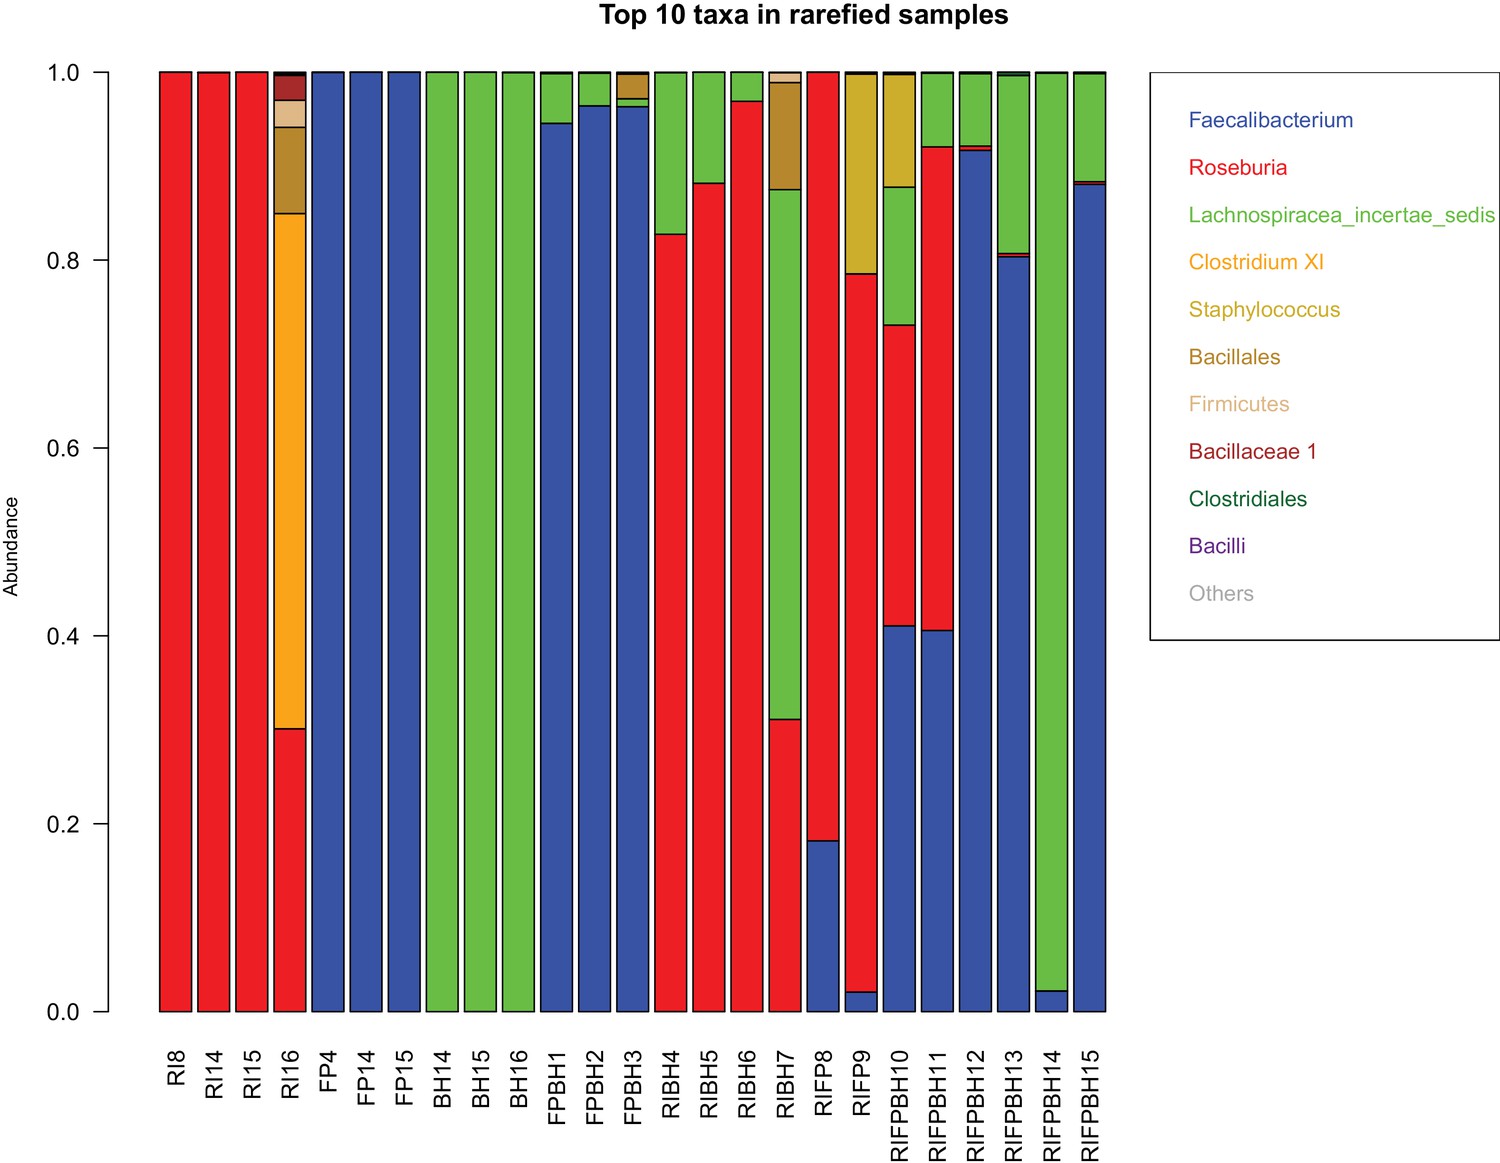
Test for prokaryotic contamination with 16S rRNA gene sequencing.
For samples taken at the last time point, DNA was extracted and the V4 region of the 16S rRNA gene was amplified and sequenced. Raw reads are rarefied to 15,339 counts per sample and then converted into relative abundances. The top 10 taxa in each sample are shown. The abbreviations RI, FP and BH in sample identifiers stand for Roseburia intestinalis L1-82, Faecalibacterium prausnitzii A2-165 and Blautia hydrogenotrophica S5a33, respectively. The taxon Lachnospiraceae incertae sedis contains B. hydrogenotrophica S5a33. High relative abundances of potential contaminants (>10%) were found in one R. intestinalis L1-82 mono-culture (RI_16), one R. intestinalis L1-82/F. prausnitzii A2-165 co-culture (RI_FP_9) and one tri-culture (RI_FP_BH_10).
Figure 3—figure supplement 2
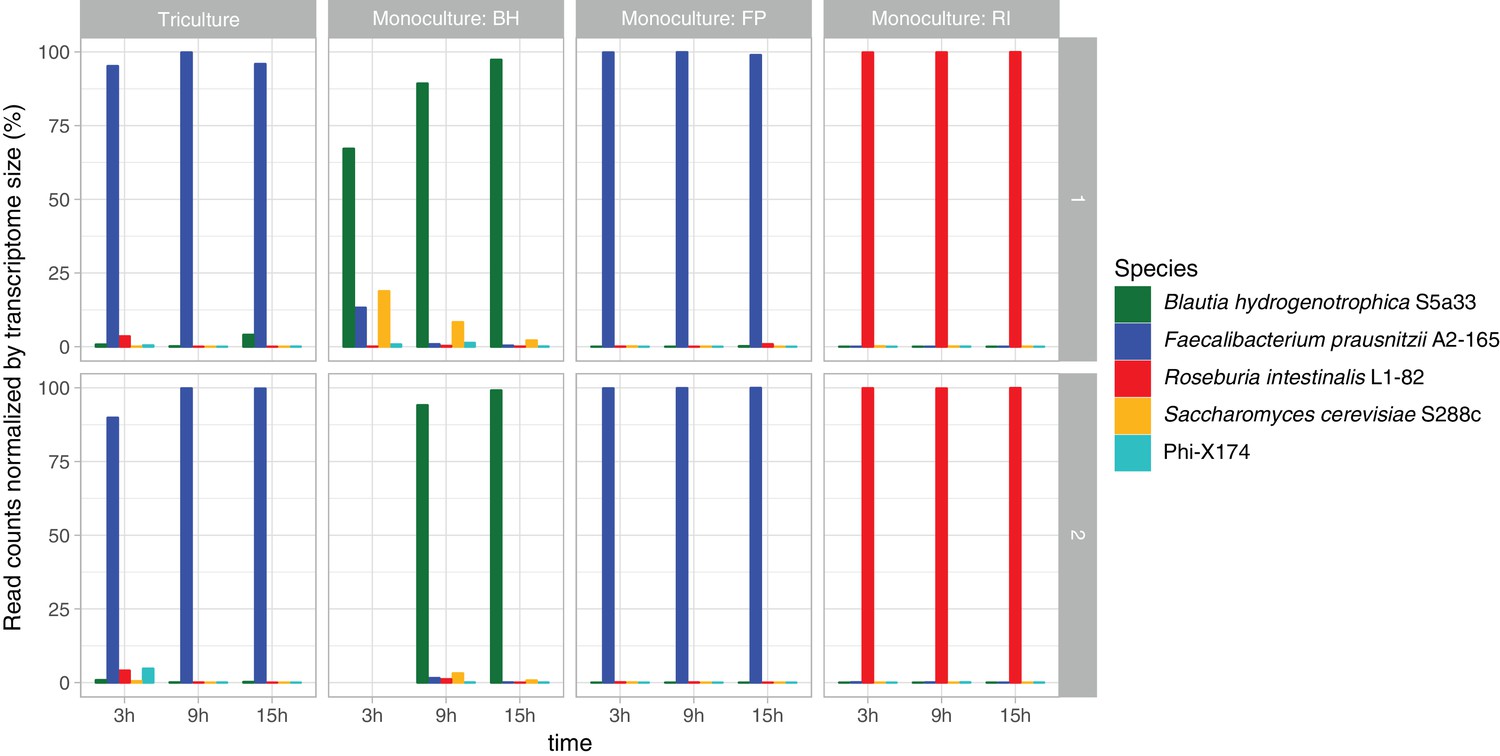
Test for viral, prokaryotic and eukaryotic contamination in RNA-seq data.
The RNA of two non-prokaryotic organisms reached noticeable abundances: the bacteriophage phiX174, which is used as a control in Illumina sequencing, and the yeast S. cerevisiae S288c, which probably came from the yeast extract employed in the medium. In most of the samples, these potential contaminants have transcriptome-size-corrected abundances below 5%, but in one sample (Blautia hydrogenotrophica S5a33 at 3 hr) the yeast RNA abundance reached 18%. Taxonomic assignment was carried out with MetaPhlAn2 and mash screen against the complete RefSeq genomes and plasmids database. Total read counts were corrected for transcriptome size (genome size in the case of the bacteriophage). The bacterial contamination observed in the Roseburia intestinalis L1-82 monoculture with 16S rRNA gene sequencing was not confirmed with RNA-seq. Row one refers to experiments RI_FP_BH_14, BH_16, FP_14 and RI_16, whereas row two refers to experiments RI_FP_BH_15, BH_15, FP_15 and RI_15.
Figure 4 with 3 supplements
Model parameterized on monocultures does not fit co-culture data well.
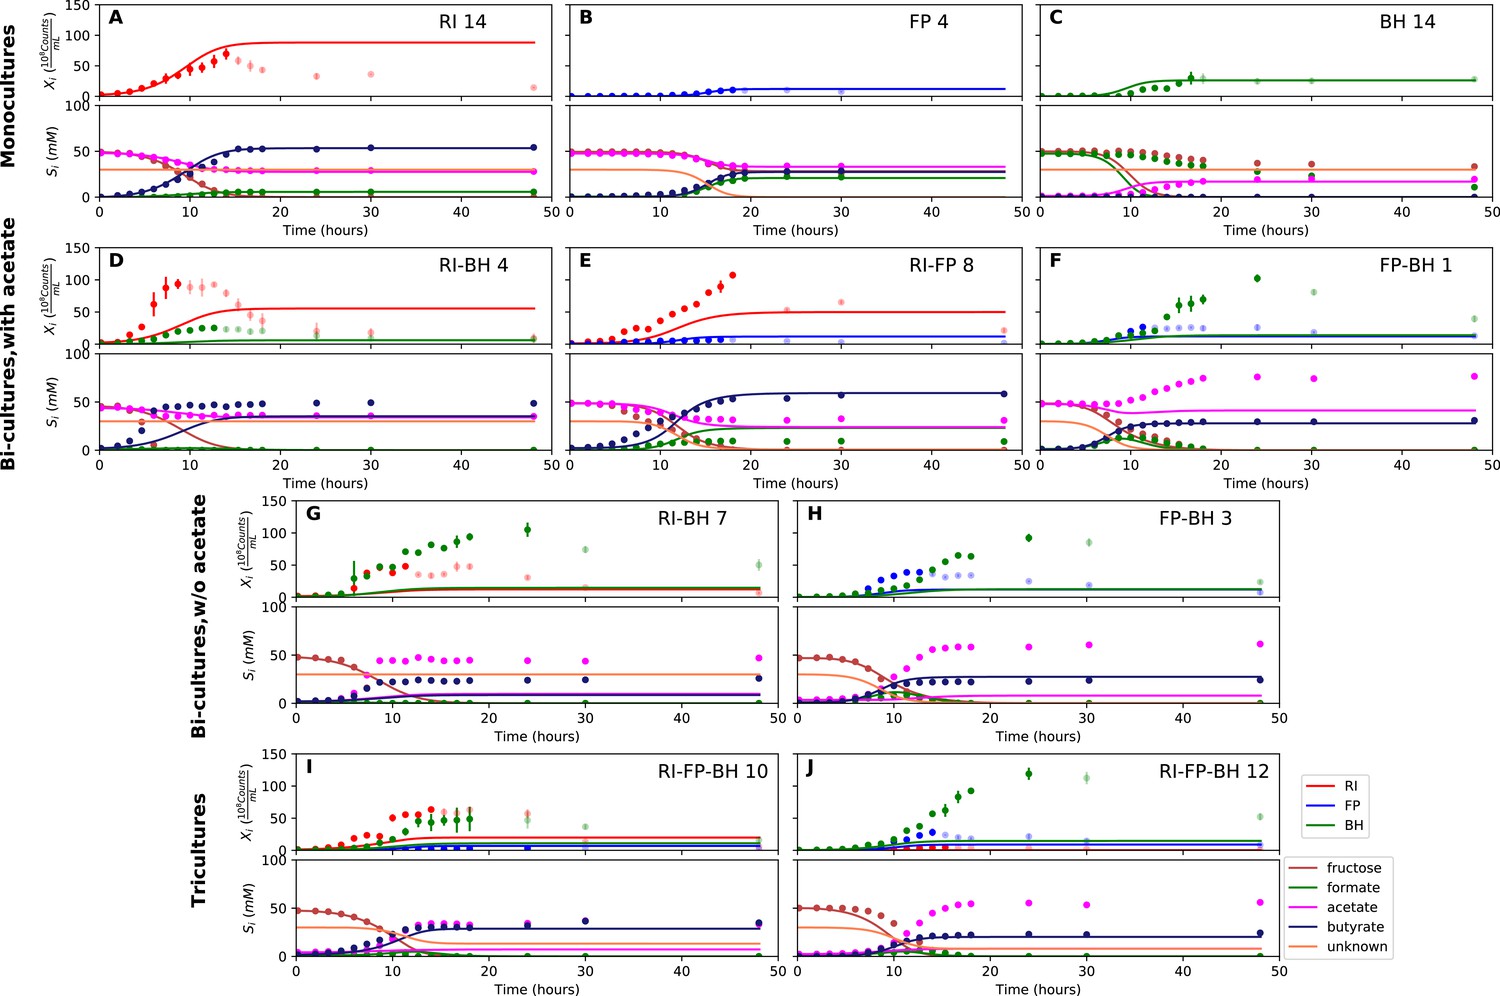
(A–C) Fit to monoculture experiments selected for parameterization. (D–F) Fit to selected co-culture experiments with initial acetate. (G–H) Fit to selected co-culture experiments without initial acetate. (I–J) Fit to tri-cultures dominated by Roseburia intestinalis L1-82 (RI) and Blautia hydrogenotrophica S5a33 (BH) versus Faecalibacterium prausnitzii A2-165 (FP) and BH, respectively. Lines represent model predictions and dots represent observations. The whiskers represent technical variation across triplicates. Transparent points indicate declining cell numbers; corresponding samples were not taken into account for model fitting. The unknown compound represents an unspecified co-substrate assumed to be required by FP. Metabolites not included in the model are omitted from the plot. Experiment identifiers indicate which of the biological replicates is displayed. The model was parameterized on experiments RI_8, RI_14, FP_4, FP_15 and BH_14.
-
Figure 4—source data 1
The results of the simulations with the kinetic model using parameterization 1 are provided for each of the fermentation experiments shown in Figure 4.
- https://doi.org/10.7554/eLife.37090.014
Figure 4—figure supplement 1
Fit to monoculture experiments for the model parameterized on monocultures only.
(A–C) Fit to Roseburia intestinalis L1-82 (RI) monoculture experiments. (D–F) Fit to Faecalibacterium prausnitzii A2-165 (FP) monoculture experiments. (G–I) Fit to Blautia hydrogenotrophica S5a33 (BH) monoculture experiments. Lines represent model predictions and dots represent observations. The whiskers represent technical variation across triplicates. The shaded regions indicate the length of the estimated strain-specific lag phases. The unknown compound represents an unspecified co-substrate assumed to be required by Faecalibacterium prausnitzii A2-165. Metabolites not included in the model are omitted from the plot. Experiment identifiers indicate which of the biological replicates is displayed. The model was parameterized on experiments RI_8, RI_14, FP_4, FP_15 and BH_14.
Figure 4—figure supplement 2
Fit to bi-culture experiments for the model parameterized on monocultures only.
(A–B) Fit to Roseburia intestinalis L1-82 (RI) and Faecalibacterium prausnitzii A2-165 (FP) bi-culture experiments. (C–F) Fit to RI and Blautia hydrogenotrophica S5a33 (BH) bi-culture experiments. (G–I) Fit to FP and BH bi-culture experiments. Lines represent model predictions and dots represent observations. The whiskers represent technical variation across triplicates. The shaded regions indicate the length of the estimated strain-specific lag phases. The unknown compound represents an unspecified co-substrate assumed to be required by FP. Metabolites not included in the model are omitted from the plot. Experiment identifiers indicate which of the biological replicates is displayed. The model was parameterized on experiments RI_8, RI_14, FP_4, FP_15 and BH_14.
Figure 4—figure supplement 3

Fit to tri-culture experiments for the model parameterized on monocultures only.
(A–B) Fit to tri-culture experiments dominated by Roseburia intestinalis L1-82 (RI) and Blautia hydrogenotrophica S5a33 (BH). (C–F) Fit to tri-culture experiments dominated by Faecalibacterium prausnitzii A2-165 (FP) and BH. Lines represent model predictions and dots represent observations. The whiskers represent technical variation across triplicates. The shaded regions indicate the length of the estimated strain-specific lag phases. The unknown compound represents an unspecified co-substrate assumed to be required by FP. Metabolites not included in the model are omitted from the plot. Experiment identifiers indicate which of the biological replicates is displayed. The model was parameterized on experiments RI_8, RI_14, FP_4, FP_15 and BH_14.
Figure 5 with 3 supplements
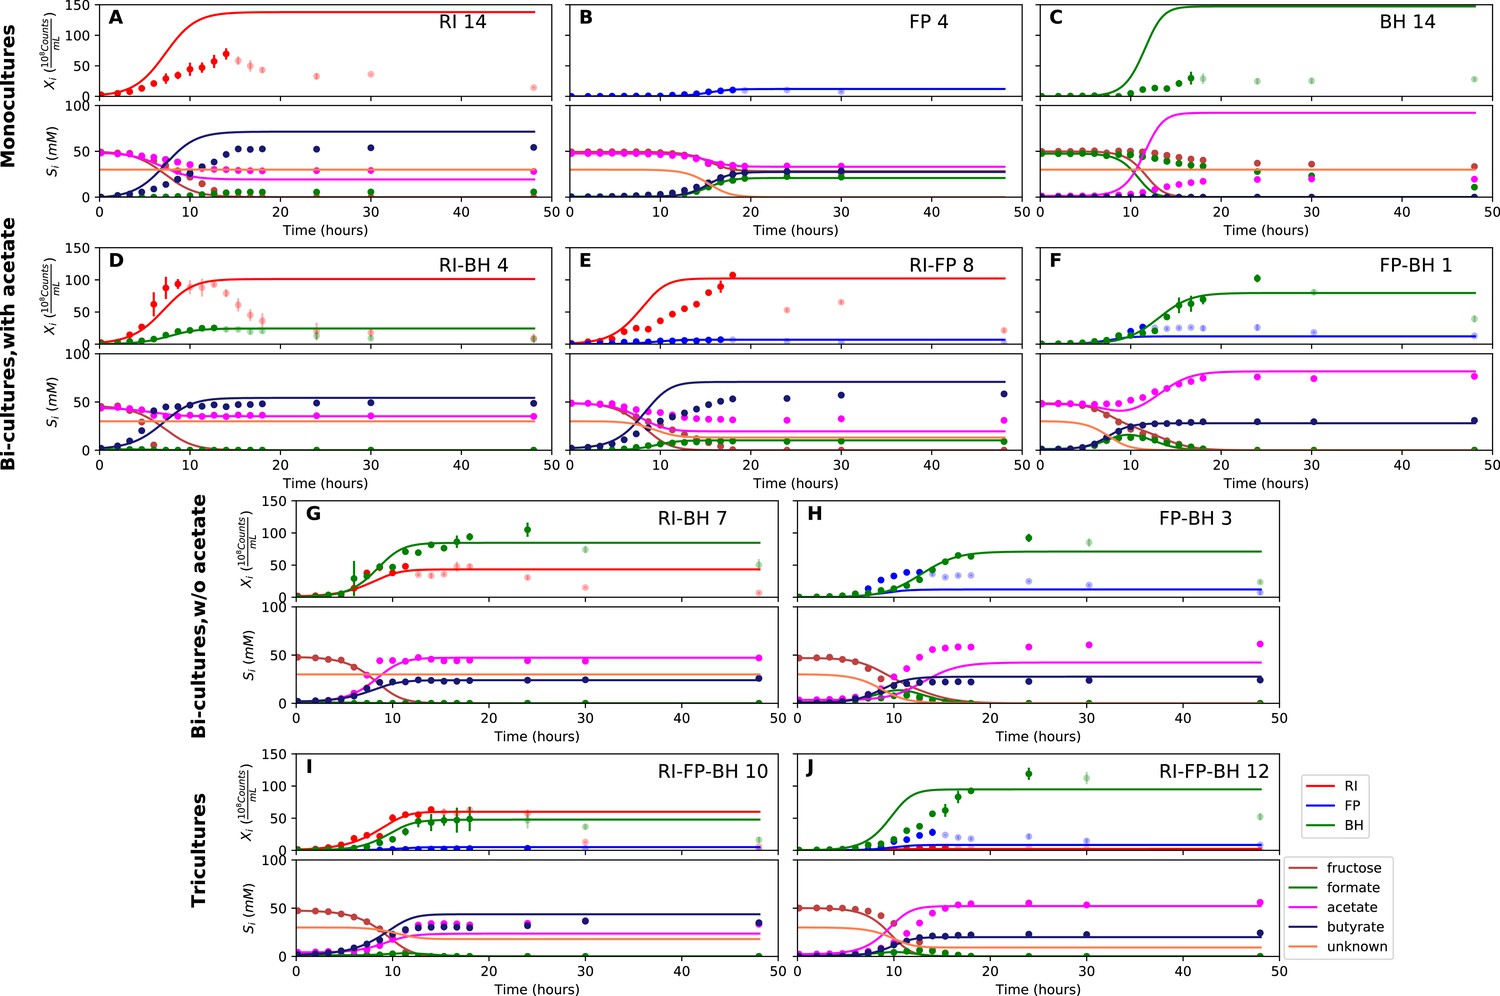
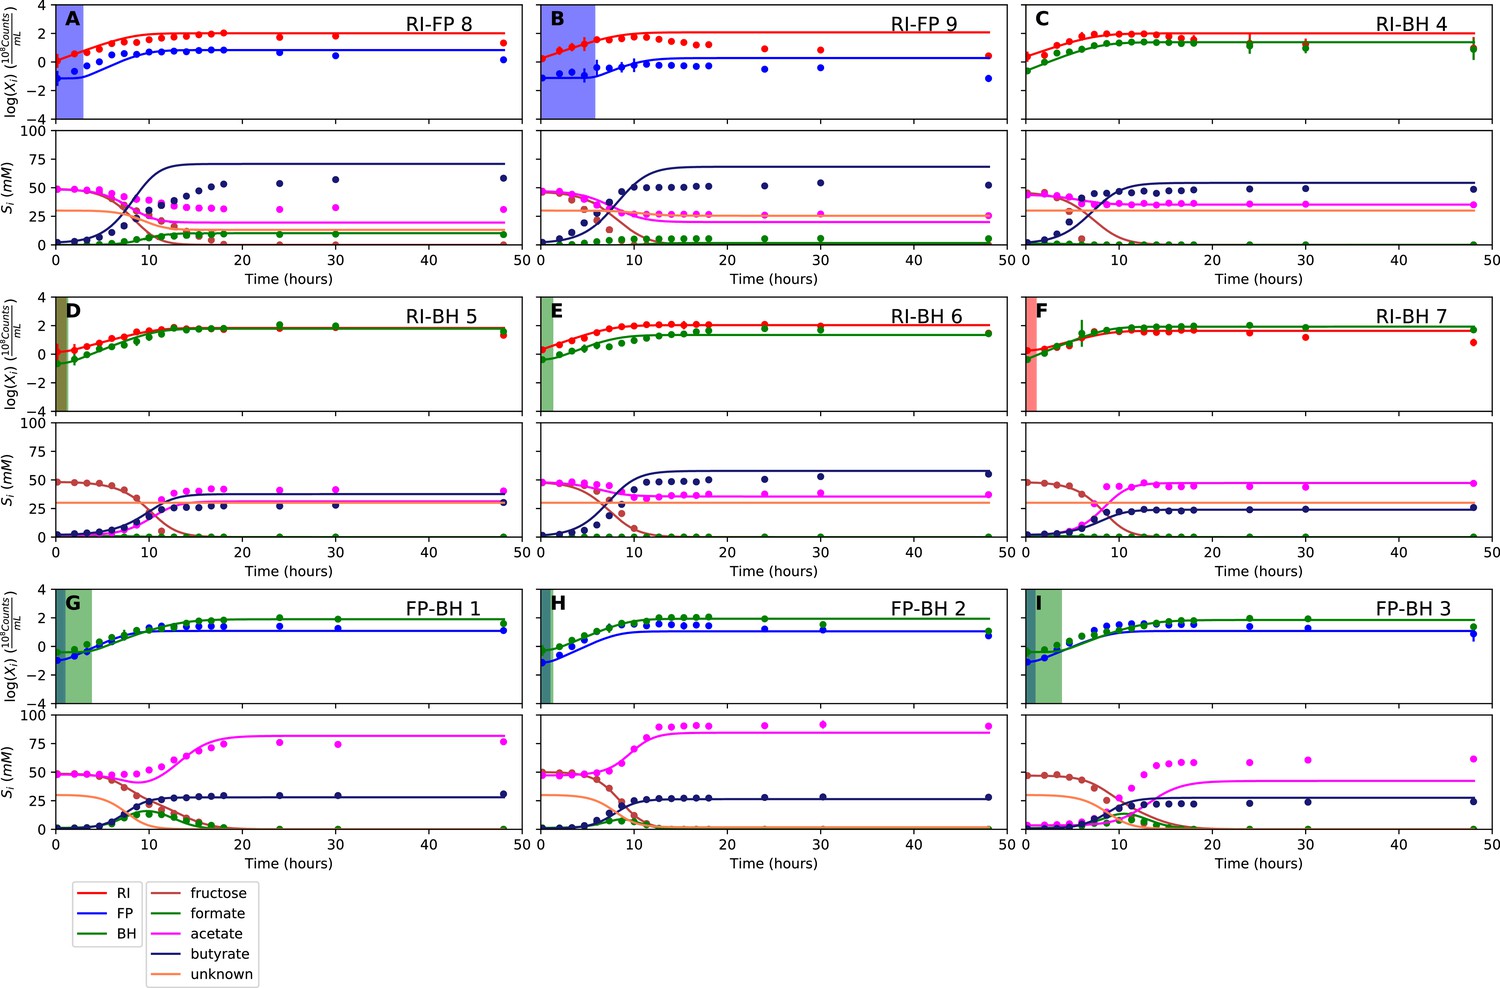
Model parameterized on mono- and bi-cultures improves fit to co-culture data as compared to parameterization on monocultures alone.
(A–C) Fit to selected monoculture experiments. (D–F) Fit to selected co-culture experiments with initial acetate (D and F were included in parameterization). (G–H) Fit to selected co-culture experiments without initial acetate, which were not part of the parameterization. (I–J) Fit to tri-cultures dominated by Roseburia intestinalis L1-82 (RI) and Blautia hydrogenotrophica S5a33 (BH) versus Faecalibacterium prausnitzii A2-165 (FP) and BH, respectively. Lines represent model predictions and dots represent observations. The whiskers represent technical variation across triplicates. Transparent points indicate declining cell numbers; corresponding samples were not taken into account for model fitting. The unknown compound represents an unspecified co-substrate assumed to be required by FP. Metabolites not included in the model are omitted from the plot. Experiment identifiers indicate which of the biological replicates is displayed. The model was parameterized on experiments FP_4, FP_15, FP_BH_1, FP_BH_2 and RI_BH_4.
-
Figure 5—source data 1
The results of the simulations with the kinetic model using parameterization 2 are provided for each of the fermentation experiments shown in Figure 5.
- https://doi.org/10.7554/eLife.37090.019
Figure 5—figure supplement 1
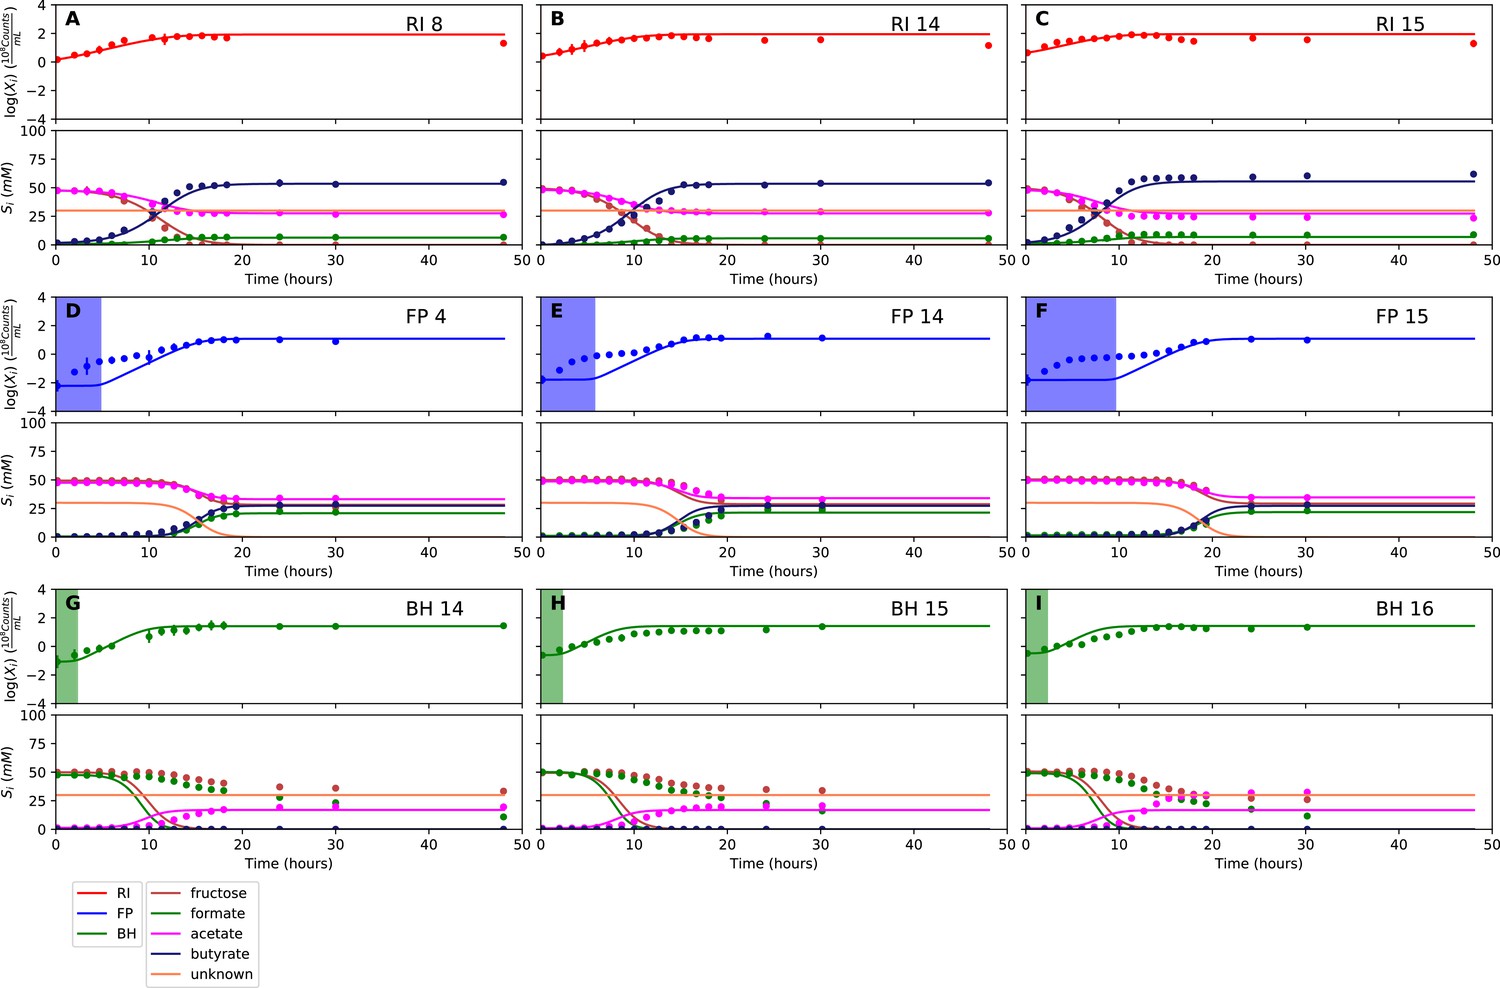
Fit to monoculture experiments for the model parameterized on selected monocultures and bi-cultures.
(A–C) Fit to Roseburia intestinalis L1-82 (RI) monoculture experiments. (D–F) Fit to Faecalibacterium prausnitzii A2-165 (FP) monoculture experiments. (G–I) Fit to Blautia hydrogenotrophica S5a33 (BH) monoculture experiments. Lines represent model predictions and dots represent observations. The whiskers represent technical variation across triplicates. The shaded regions indicate the length of the estimated strain-specific lag phases. The unknown compound represents an unspecified co-substrate assumed to be required by FP. Metabolites not included in the model are omitted from the plot. Experiment identifiers indicate which of the biological replicates is displayed. The model was parameterized on experiments FP_4, FP_15, FP_BH_1, FP_BH_2 and RI_BH_4.
Figure 5—figure supplement 2
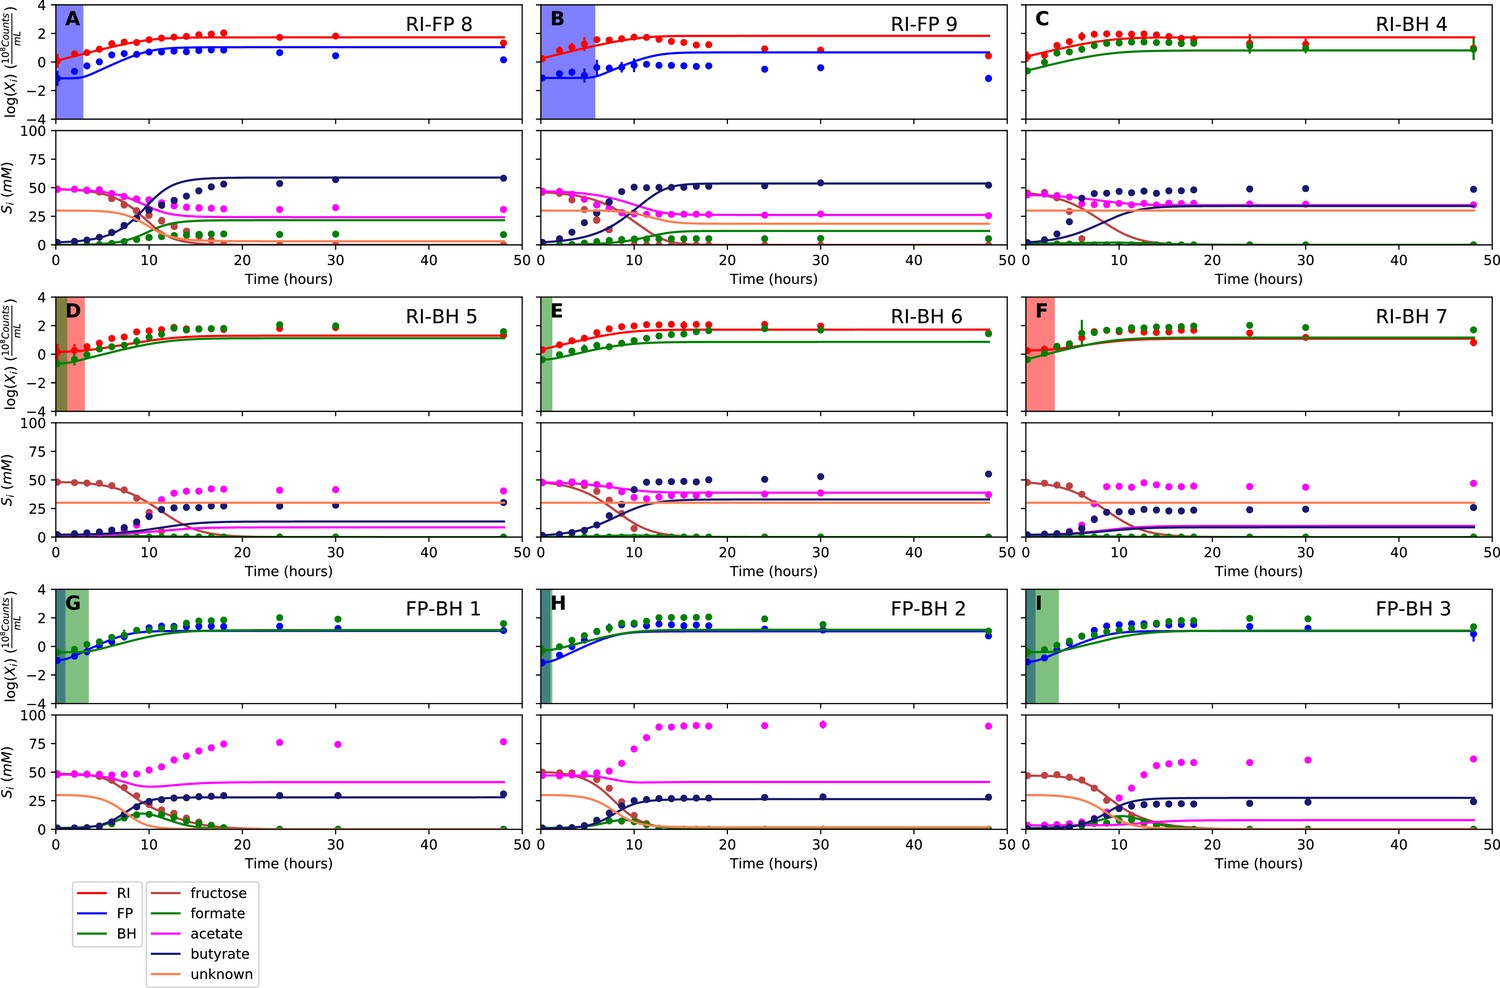
Fit to bi-culture experiments for the model parameterized on selected monocultures and bi-cultures.
(A–B) Fit to Roseburia intestinalis L1-82 (RI) and Faecalibacterium prausnitzii A2-165 (FP) bi-culture experiments. (C–F) Fit to Roseburia intestinalis L1-82 and Blautia hydrogenotrophica S5a33 (BH) bi-culture experiments. (G–I) Fit to FP and BH bi-culture experiments. Lines represent model predictions and dots represent observations. The shaded regions indicate the length of the estimated strain-specific lag phases. The whiskers represent technical variation across triplicates. The unknown compound represents an unspecified co-substrate assumed to be required by FP. Metabolites not included in the model are omitted from the plot. Experiment identifiers indicate which of the biological replicates is displayed. The model was parameterized on experiments FP_4, FP_15, FP_BH_1, FP_BH_2 and RI_BH_4.
Figure 5—figure supplement 3
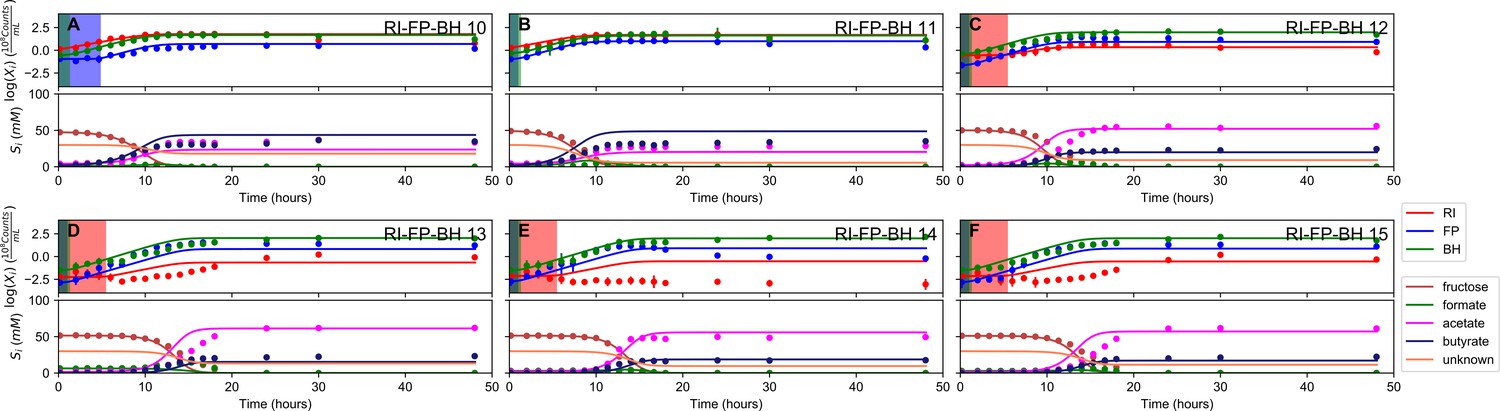
Fit to tri-culture experiments for the model parameterized on selected monocultures and bi-cultures.
(A–B) Fit to tri-culture experiments dominated by Roseburia intestinalis L1-82 (RI) and Blautia hydrogenotrophica S5a33 (BH). (C–F) Fit to tri-culture experiments dominated by Faecalibacterium prausnitzii A2-165 (FP) and BH. Lines represent model predictions and dots represent observations. The shaded regions indicate the length of the estimated strain-specific lag phases. The whiskers represent technical variation across triplicates. The unknown compound represents an unspecified co-substrate assumed to be required by FP. Metabolites not included in the model are omitted from the plot. Experiment identifiers indicate which of the biological replicates is displayed. The model was parameterized on experiments FP_4, FP_15, FP_BH_1, FP_BH_2 and RI_BH_4.
Figure 6 with 1 supplement

Initial abundance and lag phase determine the order of abundance in the final time point of the tri-culture.
(A) The tri-culture dynamics is simulated with different lag-phase values for Faecalibacterium prausnitzii A2-165 (FP) and Roseburia intestinalis L1-82 (RI) and the resulting end point abundance ratio of FP and RI is plotted in a heat map that is colored in blue for FP dominance and in red for RI dominance. The observed tri-culture data (black circles) are plotted according to the estimated experimental lag phases for RI and FP. The predicted RI or FP dominance agrees with the observed dominance in all six cases. (B, C) Simulations illustrate the dependency of the end point abundances (Xi(te)) of the three strains on the lag phase of RI and FP. (D) The tri-culture dynamics is simulated for varying initial abundances (init. abund.) of FP and RI and their resulting end point abundance ratio is visualized in a heat map. Three of the four FP-dominated experiments (13–15) and both RI-dominated experiments (10 and 11) are situated within their predicted region of dominance. (E, F) The end point abundance Xi(te) of the three strains is non-linearly dependent on the initial abundance of RI and FP in simulations, illustrating that dominance in batch is sensitive to initial conditions. All simulations were carried out with the model parameterized on mono- and bi-culture data (parameterization 2). Initial abundances are plotted in logarithmic scale. For the simulations in (A–C), the initial abundances of RI, FP and Blautia hydrogenotrophica S5a33 (BH) were set to 0.58, 0.04 and 0.21 108 counts/mL, respectively, whereas for the simulations in (D–F), the lag phase for RI, FP and BH were set to 0.33, 0.08 and 0.1 h, respectively. These initial abundance and lag-phase values represent the averages of observed initial abundances and estimated lag phases across all tri-culture experiments.
-
Figure 6—source data 1
Predictions for the final abundances of the three strains are provided for different lag-phase values and initial abundances using the kinetic model with parameterization 2.
- https://doi.org/10.7554/eLife.37090.022
Figure 6—figure supplement 1
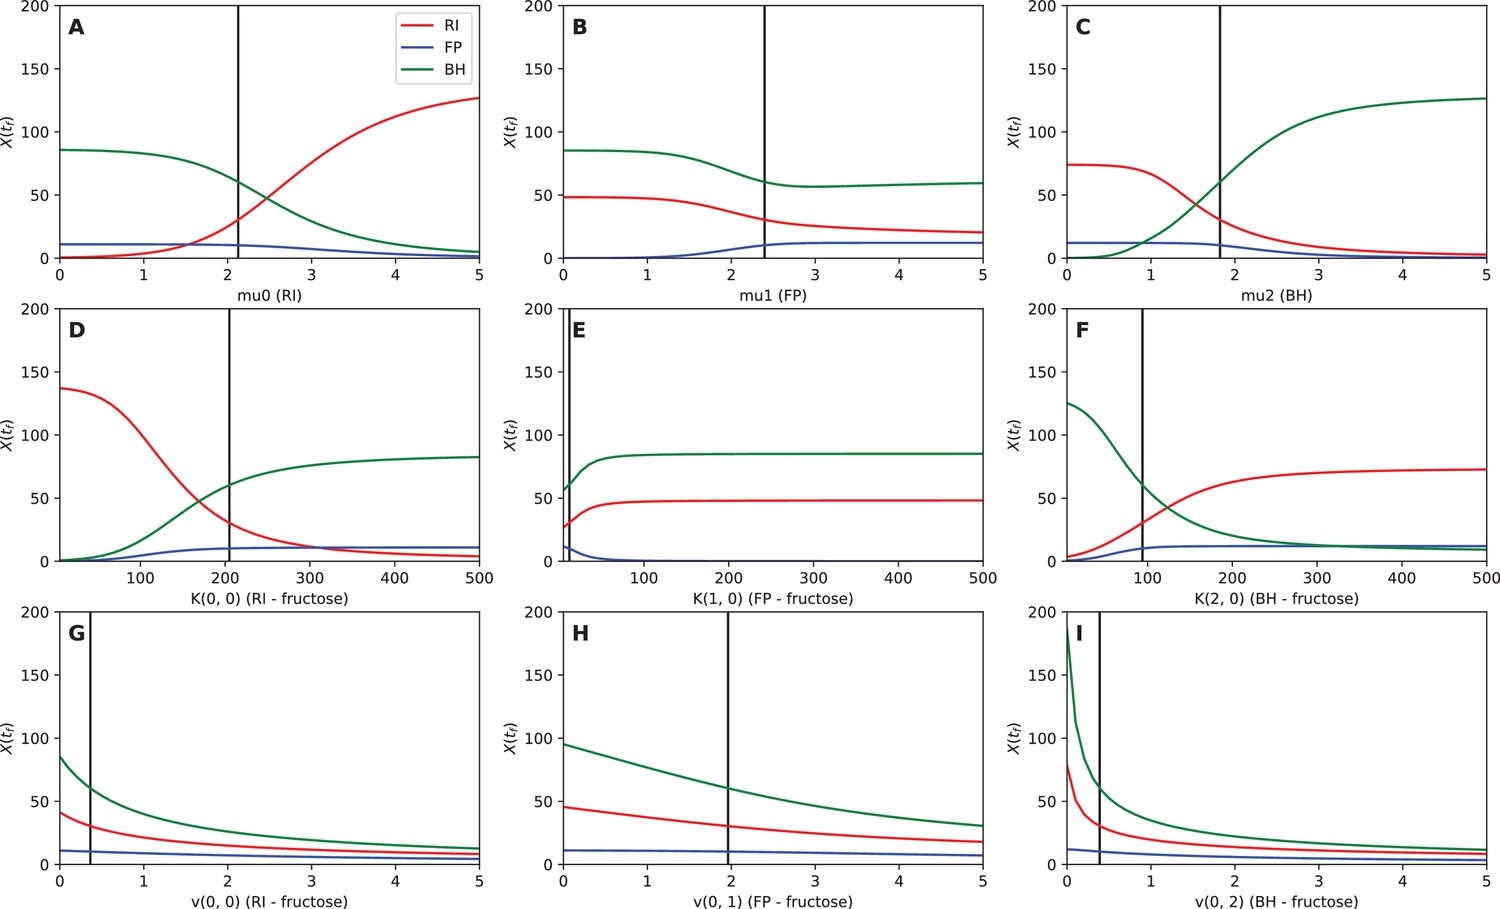
Sensitivity analysis.
The abundance of Roseburia intestinalis L1-82 (RI), Faecalibacterium prausnitzii A2-165 (FP) and Blautia hydrogenotrophica S5a33 (BH) at the final time point is plotted, depending on the values of the maximal specific growth rate μ (A–C), the fructose half-saturation constant K (D–F) and the fructose uptake rate v (G–I).
Tables
Table 1
Overview of fermentation experiments and model fitting results (RMSE: root mean square error).
Means and standard deviations are reported across biological replicates.
| Strains | Number of biological replicates | Added energy source and/or co-substrate | Consumption (-)/production (+) of metabolites in mM | Carbon recovery (%) | O/R balance | Selected for parame-terization 1 | RMSE parame-terization 1 | Selected for parame-terization 2 | RMSE parame-terization 2 | ||||||
|---|---|---|---|---|---|---|---|---|---|---|---|---|---|---|---|
| Fructose | Acetate | Butyrate | Formate | Lactate | H2 | CO2 | |||||||||
| Monoculture fermentations | |||||||||||||||
| R. intestinalis L1-82 | 4 | Fructose/acetate | −48.8 ± 0.9 | −20.6 ± 2.4 | 58.5 ± 3.9 | 6.8 ± 1.2 | 3.9 ± 1.1 | 72.2 ± 4.9 | 84.0 ± 0.8 | 105 ± 14.3 | 0.86 ± 0.2 | Yes | 0.17 ± 0.04 | No | 0.83 ± 0.13 |
| F. prausnitzii A2-165 | 3 | Fructose/acetate | −23.1 ± 1.1 | −13.5 ± 0.8 | 29.8 ± 0.2 | 22.7 ± 0.9 | 1.8 ± 0.2 | 0.2 ± 0.2 | 19.3 ± 1.6 | 100.9 ± 3.4 | 1.05 ± 0.09 | Yes | 0.15 ± 0.08 | Yes | 0.15 ± 0.08 |
| B. hydrogenotrophica S5a33 | 3 | Fructose/formate | −19.0 ± 5.6 | 23.0 ± 6.6 | 0.0 ± 0.0 | −36.1 ± 1.8 | 6.0 ± 1.2 | 31.5 ± 7.7 | 26.0 ± 5.3 | 60.0 ± 2.1 | 0.76 ± 0.07 | Yes | 1.43 ± 0.27 | No | 3.53 ± 1.04 |
| Bi-culture fermentations | |||||||||||||||
| R. intestinalis L1−82/F. prausnitzii A2-165 | 2 | Fructose/acetate | −47.7 ± 2.2 | −18.1 ± 2.7 | 56.3 ± 4.5 | 7.6 ± 2.7 | 4.3 ± 3.3 | 114 ± 16 | 85.7 ± 4.1 | 102.8 ± 0.3 | 0.79 ± 0 | No | 0.77 ± 0.06 | No | 0.68 ± 0.03 |
| R. intestinalis L1−82/B. hydrogenotrophica S5a33 | 2 | Fructose/acetate | −46.5 ± 1.5 | −7.5 ± 1.9 | 53.5 ± 4.7 | −0.5 ± 0.8 | 2.2 ± 0.3 | 53.0 ± 3.0 | 74.9 ± 4.1 | 100.2 ± 0.6 | 0.94 ± 0.12 | No | 0.78 ± 0.36 | Yes | 0.3 ± 0.04 |
| R. intestinalis L1−82/B. hydrogenotrophica S5a33 | 2 | Fructose | −48.0 ± 0.2 | 44.9 ± 5.4 | 27.9 ± 3.0 | −1.0 ± 0.0 | 5.4 ± 2.4 | 33.1 ± 3.2 | 47.4 ± 3.9 | 91.6 ± 1.1 | 1.05 ± 0.06 | No | 0.9 ± 0.17 | No | 0.32 ± 0.04 |
| F. prausnitzii A2−165/B. hydrogenotrophica S5a33 | 2 | Fructose/acetate | −49.3 ± 1.0 | 41.4 ± 11.7 | 30.7 ± 1.8 | −1.2 ± 0.0 | 3.9 ± 1.6 | 56.2 ± 37.1 | 54.8 ± 33.3 | 91.6 ± 9.4 | 0.88 ± 0.25 | No | 0.6 ± 0.14 | Yes | 0.26 ± 0.13 |
| F. prausnitzii A2−165/B. hydrogenotrophica S5a33 | 1 | Fructose | −47.0 | 62.5 | 25.5 | −1.1 | 4.5 | 62.9 | 63.6 | 107.4 | 1.11 | No | 0.63 | No | 0.46 |
| Tri-culture fermentations | |||||||||||||||
| R. intestinalis L1−82/F. prausnitzii A2−165/B. hydrogenotrophica S5a33 | 6 | Fructose | −48.9 ± 1.3 | 38.4 ± 16.9 | 32.5 ± 5.5 | −1.2 ± 0.1 | 7.4 ± 1.7 | 61.9 ± 3.2 | 57.1 ± 9.2 | 97.0 ± 3.1 | 0.84 ± 0.09 | No | 0.78 ± 0.27 | No | 0.58 ± 0.11 |
Key resources table
| Reagent type (species) or resource | Designation | Source or reference | Identifiers | Additional information |
|---|---|---|---|---|
| Strain (Roseburia intestinalis), strain background (human feces) | Roseburia intestinalis L1-82 | Deutsche Sammlung von Mikroorganismen und Zellkulturen (DSMZ) | DSM_14610 | |
| Strain (Faecalibacterium prausnitzii), strain background (human feces) | Faecalibacterium prausnitzii A2-165 | Deutsche Sammlung von Mikroorganismen und Zellkulturen (DSMZ) | DSM_17677 | |
| Strain (Blautia hydrogenotrophica), strain background (human feces) | Blautia hydrogenotrophica S5a33 | Deutsche Sammlung von Mikroorganismen und Zellkulturen (DSMZ) | DSM_10507 | |
| Sequence-based reagent | TaqMan primer and probe for Roseburia intestinalis L1-82 | This paper | Sequences provided in Supplementary file 5 | |
| Sequence-based reagent | TaqMan primer and probe for Faecalibacterium prausnitzii A2-165 | This paper | Sequences provided in Supplementary file 5 | |
| Sequence- based reagent | TaqMan primer and probe for Blautia hydrogenotrophica S5a33 | This paper | Sequences provided in Supplementary file 5 | |
| Commercial assay or kit | Phenol-Free Total RNA Purification Kit | VWR International | N788-KIT | Coupled with DNase I treatment |
| Commercial assay or kit | TURBO DNA-free KitTURBO DNase Treatment and Removal Reagents | Ambion (ThermoFisher Scientific) | AM1907 | |
| Commercial assay or kit | RNA Clean and Concentrator (RCC)−25 Kit | Zymo Research | R1017 | |
| Commercial assay or kit | Qubit dsDNA HS Assay Kit | ThermoFisher Scientific | Q32854 | |
| Commercial assay or kit | Agilent RNA 6000 Pico Kit | Agilent Technologies | 5067–1513 | |
| Commercial assay or kit | Agilent RNA 6000 Nano Kit | Agilent Technologies | 5067–1511 | |
| Commercial assay or kit | Ribozero rRNA removal for Gram-positive bacteria | Illumina | MRZGP126 | |
| Commercial assay or kit | Illumina TruSeq stranded mRNA library preparation kit | Illumina | RS-122–2101 | Library preparation was performed without the mRNA purification step |
Additional files
-
Supplementary file 1
A summary of all fermentation experiments is provided, including experiment identifiers, carbon recoveries and O/R balances.
Fermentation experiments selected for RNA-seq or model parameterization are marked accordingly.
- https://doi.org/10.7554/eLife.37090.023
-
Supplementary file 2
The table provides parameter values after model parameterization on monocultures only and on mono- and bi-cultures (sheet 1), lag phases estimated from experiments (sheet 2), predicted maximal abundances for the two parameterizations (sheet 3) and experiment-specific RMSE and MAE values (sheet 4).
- https://doi.org/10.7554/eLife.37090.024
-
Supplementary file 3
This table lists genes that are significantly up-regulated (green) or downregulated (red) in tri-culture as compared to monoculture for all three strains across all time points.
- https://doi.org/10.7554/eLife.37090.025
-
Supplementary file 4
The flow cytometry counts obtained for Faecalibacterium prausnitzii A2-165 grown with different concentrations of vitamin B12.
- https://doi.org/10.7554/eLife.37090.026
-
Supplementary file 5
Sequences for strain-specific primers and probes as well as their specificities.
- https://doi.org/10.7554/eLife.37090.027
-
Source code 1
Definition of the kinetic model.
- https://doi.org/10.7554/eLife.37090.028
-
Transparent reporting form
- https://doi.org/10.7554/eLife.37090.029
Download links
A two-part list of links to download the article, or parts of the article, in various formats.
Downloads (link to download the article as PDF)
Open citations (links to open the citations from this article in various online reference manager services)
Cite this article (links to download the citations from this article in formats compatible with various reference manager tools)
Integrated culturing, modeling and transcriptomics uncovers complex interactions and emergent behavior in a three-species synthetic gut community
eLife 7:e37090.
https://doi.org/10.7554/eLife.37090


