Identification of a critical sulfation in chondroitin that inhibits axonal regeneration
- National Institutes of Health, United States
- University of Cambridge, United Kingdom
Figures
Figure 1 with 1 supplement
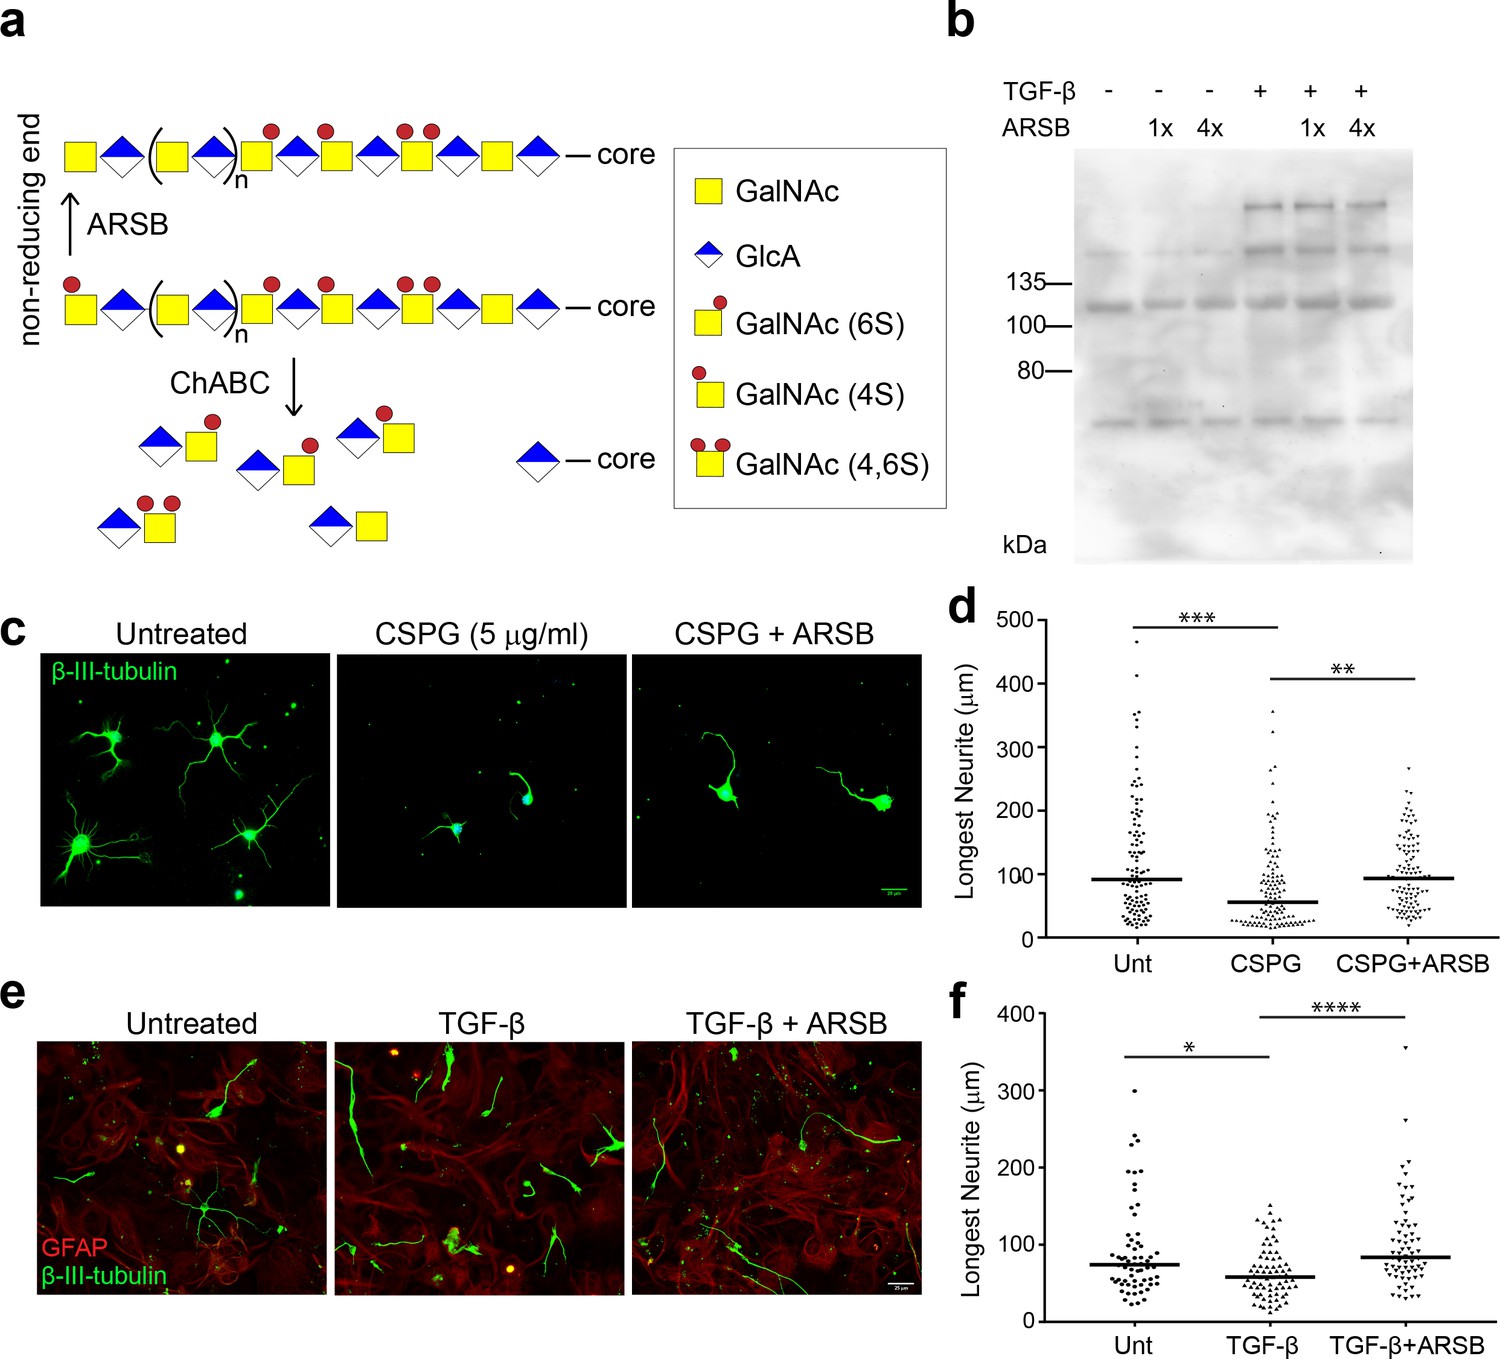
ARSB reverses neurite outgrowth inhibition caused by 4-sulfated CSPGs.
(a) Schematic diagram showing actions of ARSB and ChABC on GAG chains. (b) Western blot showing CS-56 signal in conditioned medium. (c) Micrographs showing hippocampal neurons treated with no treatment, CSPG (5 µg/ml), or CSPG +ARSB. Scale bar = 25 µm. (d) Plot showing lengths of longest neurite measured from β-III-tubulin stained neurons. Statistical significance was determined by one-way ANOVA, **p<0.005, ***p<0.001. (e) Micrographs showing co-cultures of CGNs grown on astrocytes and treated with TGF-β, TGF-β and ARSB, or no treatment. Scale bar = 25 µm. (f) Plot showing lengths of longest neurite measured from β-III-tubulin stained neurons. Statistical significance was determined by one-way ANOVA, *p<0.05, **p<0.005, ***p<0.001, ****p<0.0001.
Figure 1—figure supplement 1
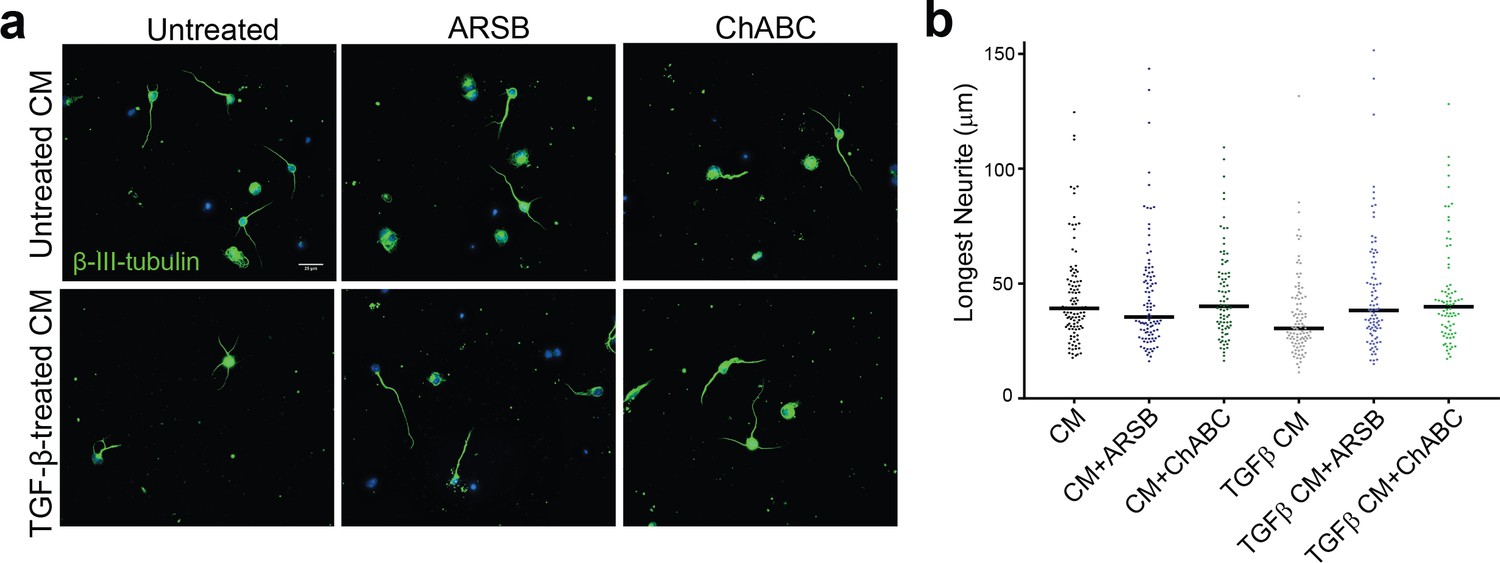
ARSB reverses neurite outgrowth inhibition caused by 4-sulfated CSPGs.
(a) Micrographs showing CGNs treated with astrocyte conditioned medium containing TGF-β and either ARSB, ChABC, or no enzyme. Scale bar = 25 µm. (b) Plot showing length of longest neurite measured from β-III-tubulin stained neurons, displayed as median. Statistical significance was determined by two-way ANOVA with Tukey post-hoc test for multiple comparisons.
Figure 2 with 2 supplements
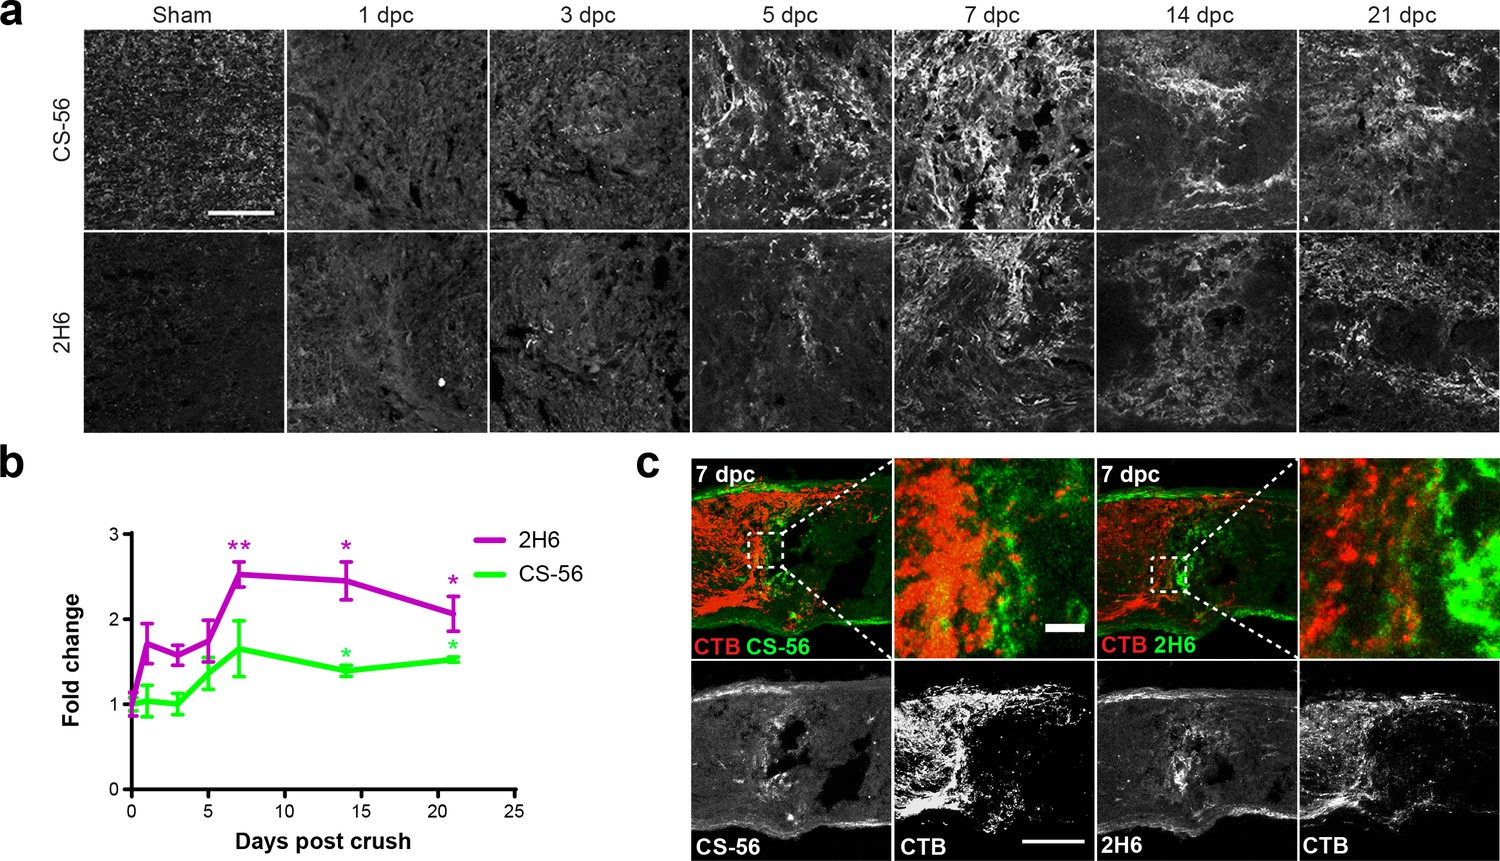
Optic nerve crush stimulates glial scar formation and sustained elevation of chondroitin sulfate proteoglycans.
(a) Micrographs show lesioned optic nerve tissue collected at 1, 3, 5, 7, 14 and 21 dpc and stained for CSPGs (CS-56), 4S GAGs (2H6), reactive astrocytes (GFAP), and microglia and macrophages (Iba1). Scale bar = 50 µm. (b) Fluorescence intensity of CS-56 and 2H6 immunostaining expressed as fold change vs. non-lesioned sham controls. Statistical significance versus sham was determined by Student’s t-test. *p<0.05, **p<0.005. Colored asterisks indicate significance for different groups (CS-56 = green, 2H6 = magenta). (c) Micrographs showing lesioned mouse optic nerve tissue at 7 dpc. Axons are visualized with CTB and form dystrophic endbulbs in areas of high CSPG and 4S GAG immunoreactivity. Scale bar = 100 µm, inset = 10 µm.
Figure 2—figure supplement 1
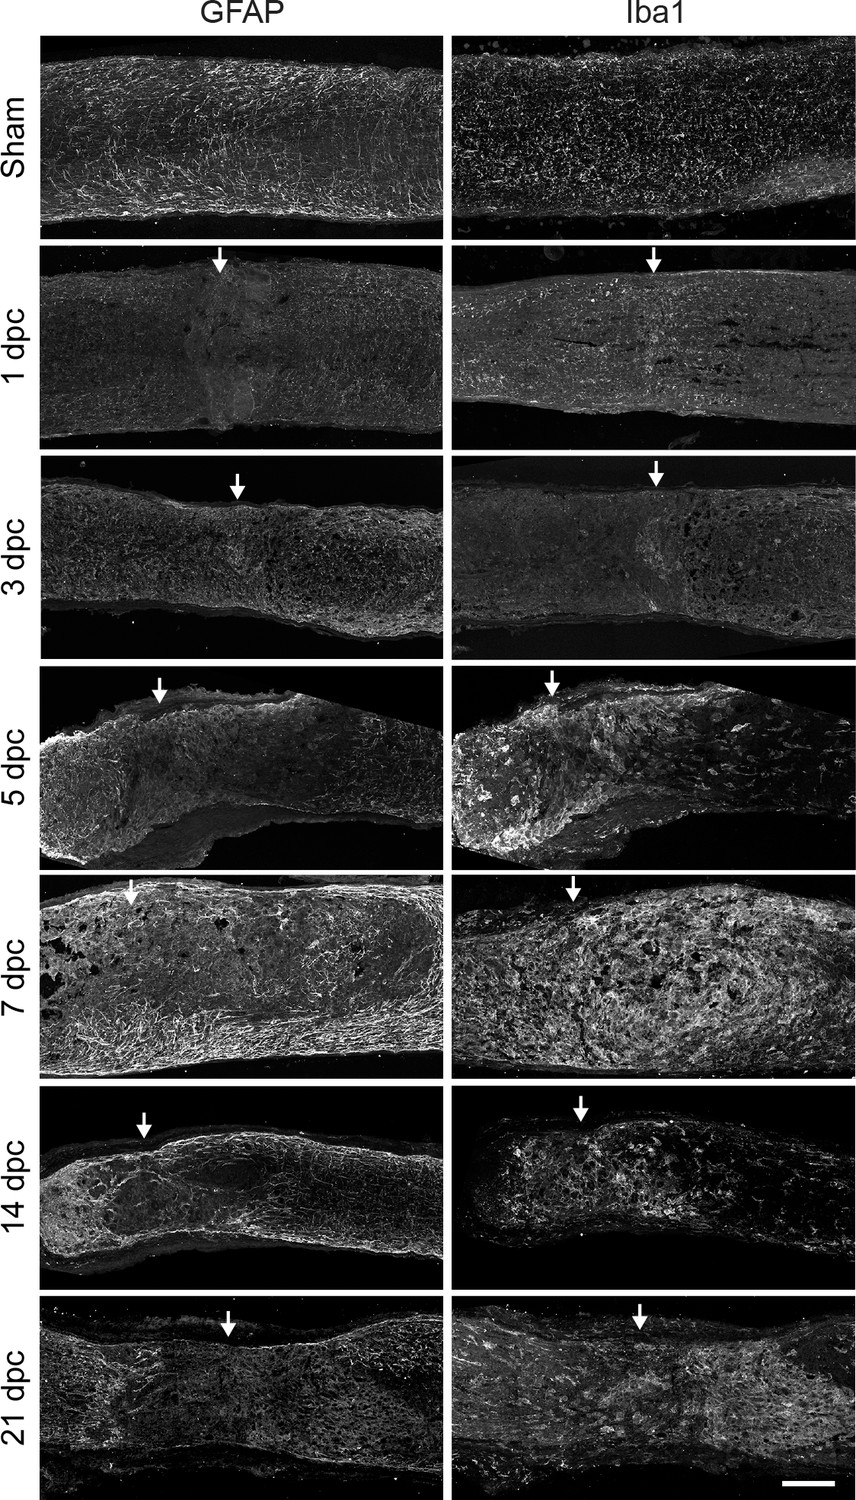
Reactive astrocytes and activated microglia form glial scar after optic nerve crush.
Micrographs showing mouse optic nerve tissue analyzed by immunohistochemistry with GFAP and Iba1 at several time points. Arrows indicate lesion site. Scale bar = 100 µm.
Figure 2—figure supplement 2
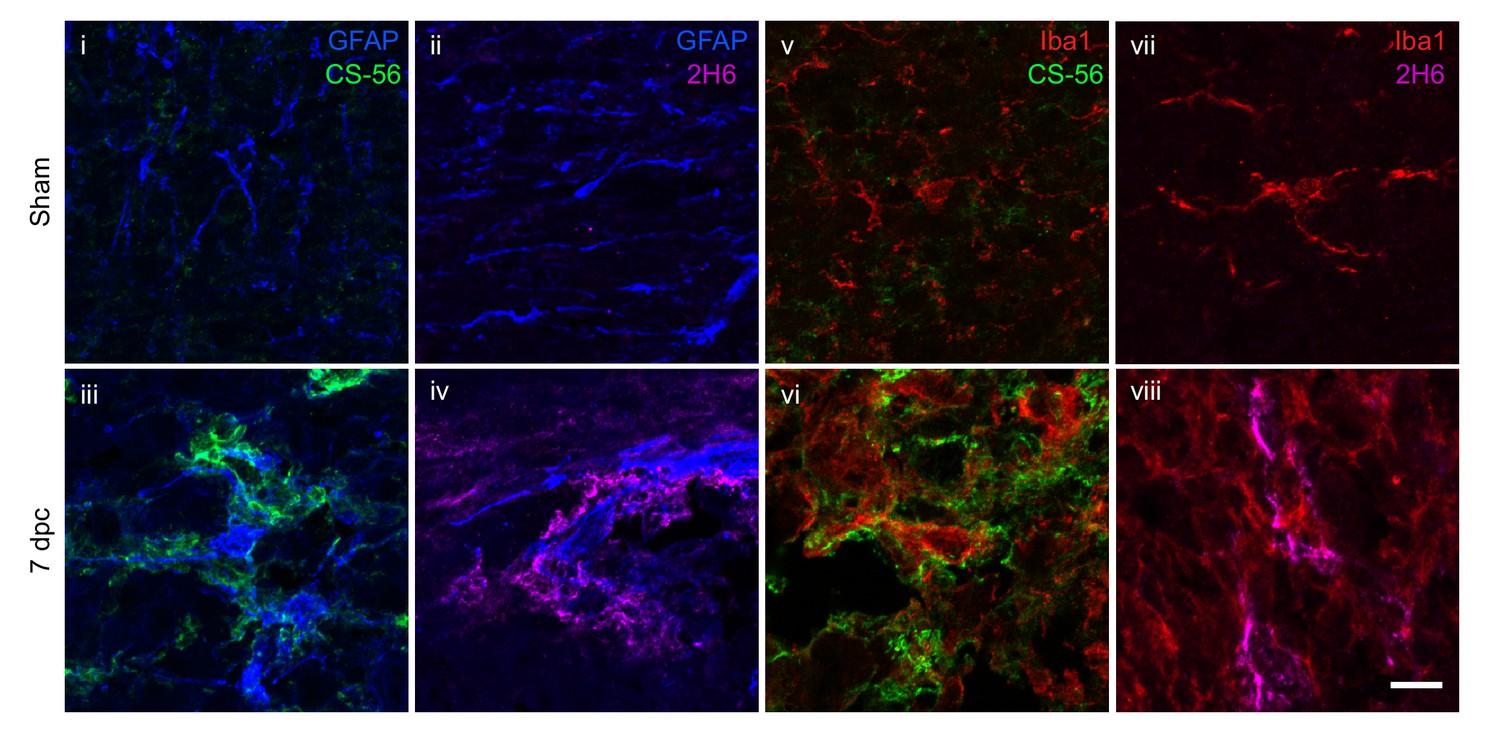
Optic nerve CSPGs associate with glial cells.
Micrographs show sham and lesioned optic nerve tissue collected at 7 dpc and stained for CSPGs (CS-56), 4S GAGs (2H6), reactive astrocytes (GFAP), and microglia and macrophages (Iba1). Images show association of CS-56 and 2H6 with GFAP (i – iv) and Iba1 (v – viii). Scale bar = 10 µm.
Figure 3 with 5 supplements
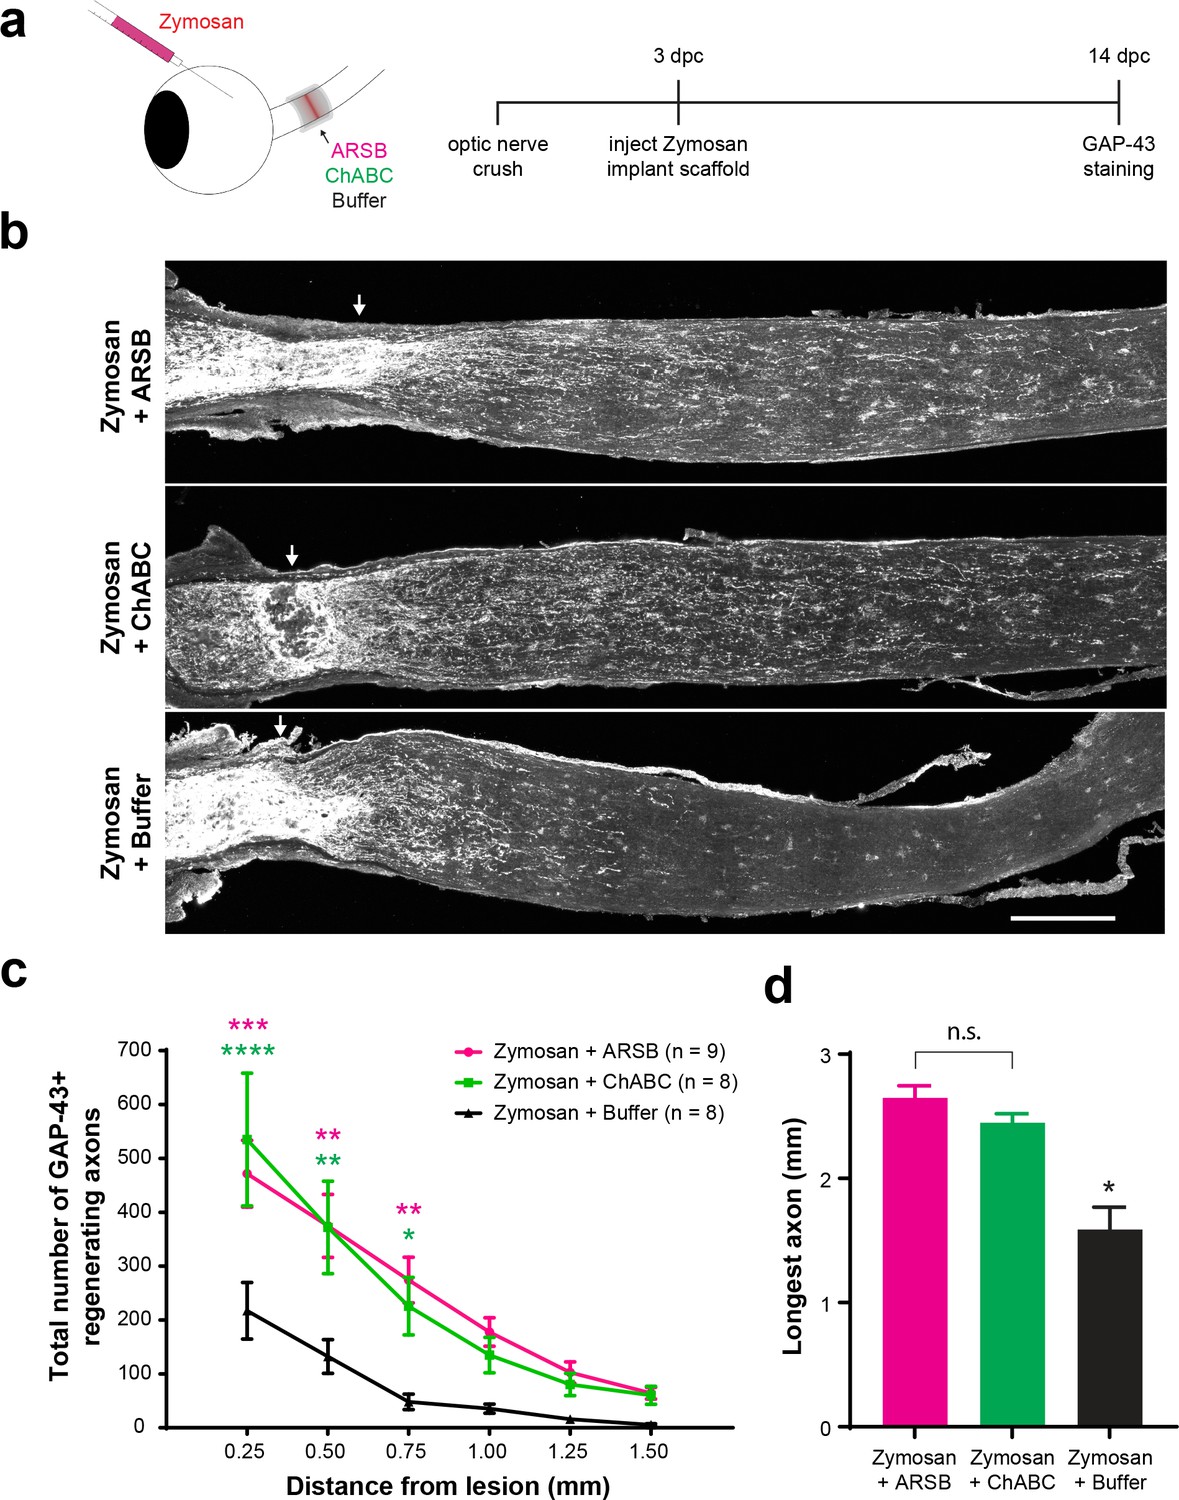
Selectively targeting inhibitory CSPGs enhances retinal ganglion cell axon regeneration.
(a) Experiment timeline and schematic diagram showing intravitreal injection of Zymosan/CPT-cAMP and implantation of gelfoam scaffolds containing ARSB, ChABC, or control buffer. (b) Micrographs showing GAP-43-labeled optic nerves from mice treated with Zymosan/CPT-cAMP and gelfoam scaffolds loaded with ARSB, ChABC, or control buffer. Arrows indicate lesion site. Scale bar = 200 µm. (c) Graph showing the number of regenerating axons at distances distal to the lesion site, displayed as mean ± SEM. Statistical significance was determined by two-way ANOVA with Bonferroni post-hoc test for multiple comparisons. *p<0.05, **p<0.005, ***p<0.001, ****p<0.0001. Colored asterisks indicate statistical significance for different groups (ARSB = magenta, ChABC = green). (d) Graph showing average length of longest GAP-43+ regenerating axon. Statistical significance was determined by Student’s t-test. *p<0.05.
Figure 3—figure supplement 1
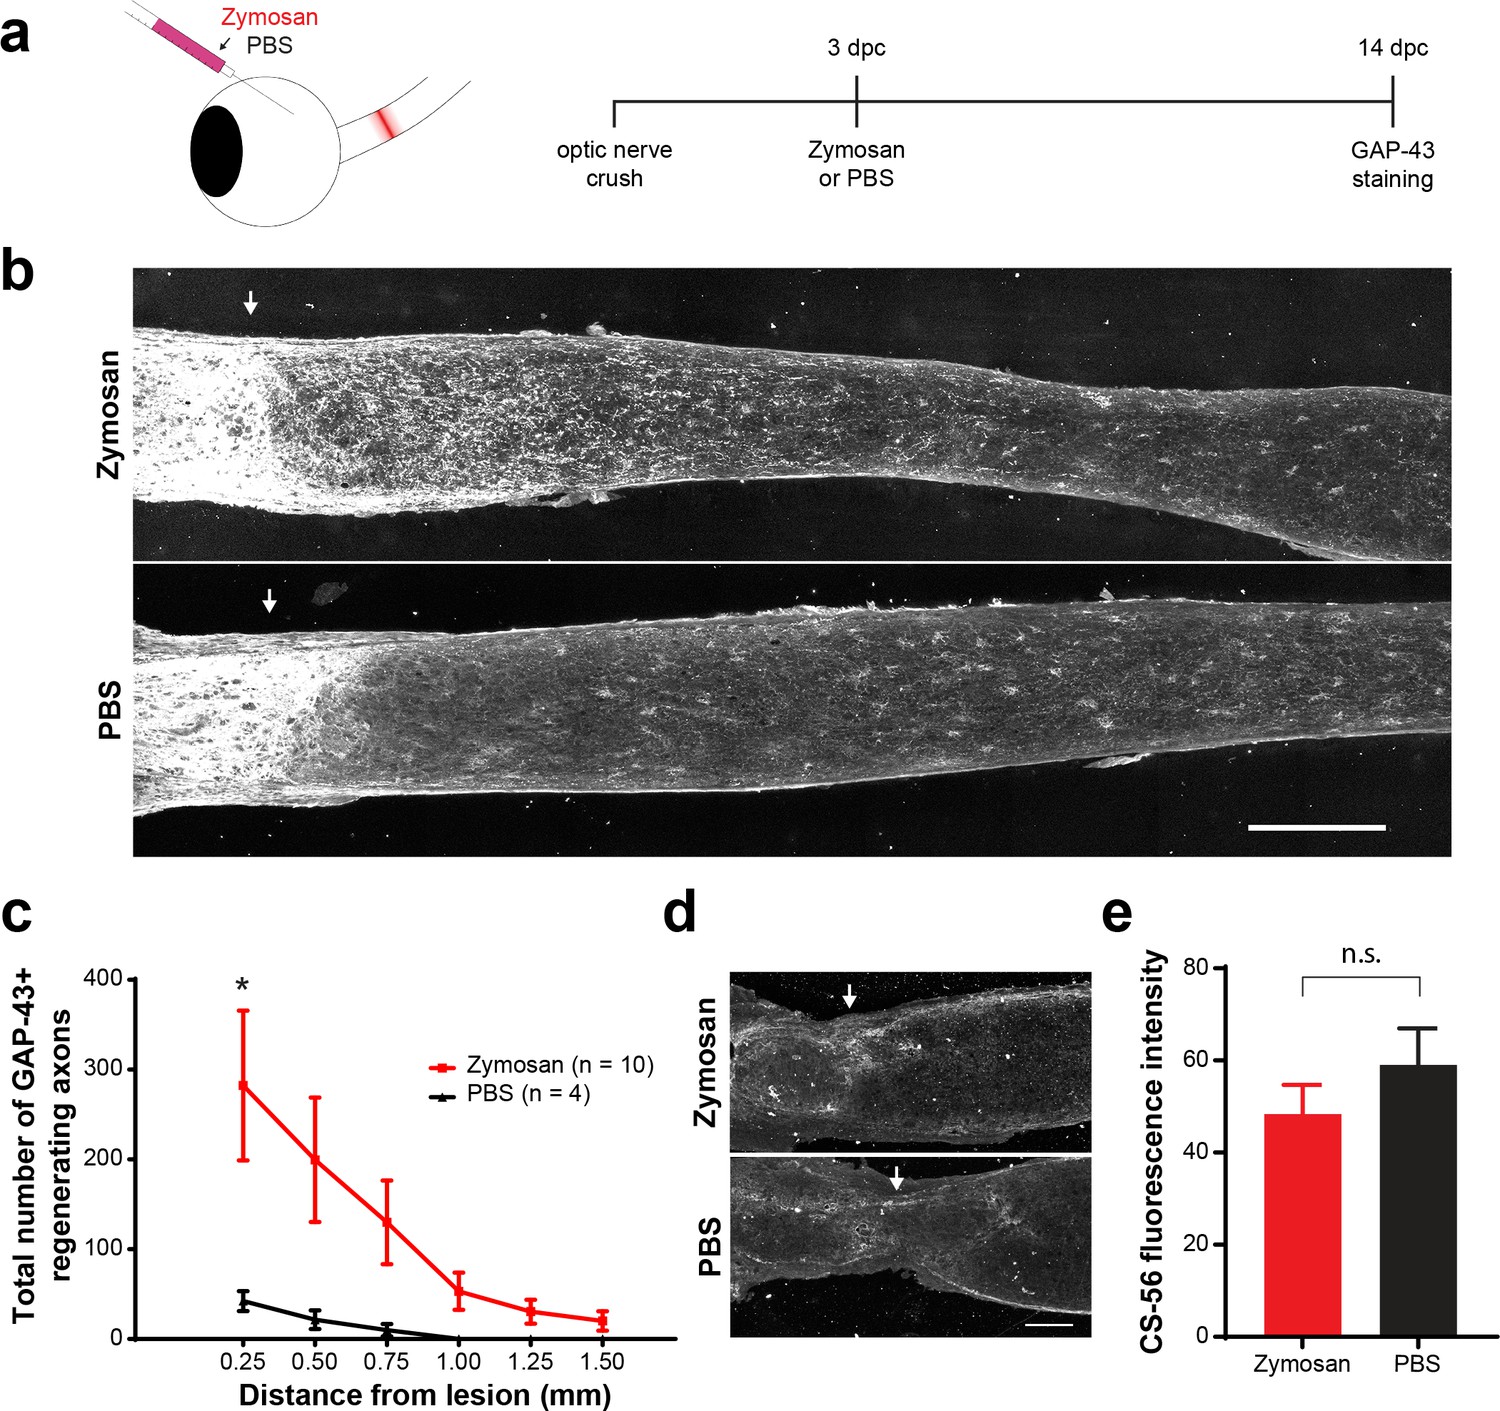
Zymosan and CPT-cAMP stimulate axon regeneration.
(a) Experiment timeline and schematic diagram showing intravitreal injection of Zymosan/CPT-cAMP or PBS. (b) Micrographs showing GAP-43-labeled optic nerves from mice treated with Zymosan or PBS. Arrows indicate lesion site. Scale bar = 200 µm. (c) Graph showing the number of regenerating axons at distances distal to the lesion site, displayed as mean ± SEM. Statistical significance was determined by two-way ANOVA with Bonferroni post-hoc test for multiple comparisons. *p<0.05. (d) Micrographs showing CS-56 immunostaining at the lesion site of optic nerves from animals treated with Zymosan or PBS. Arrows indicate lesion site. Scale bar = 100 µm. (e) Graph showing quantification of CS-56 fluorescence intensity (arbitrary units) measured from 150 × 150 µm insets centered at ONC lesion site. Statistical significance was determined by Student’s t-test. *p<0.05.
Figure 3—figure supplement 2
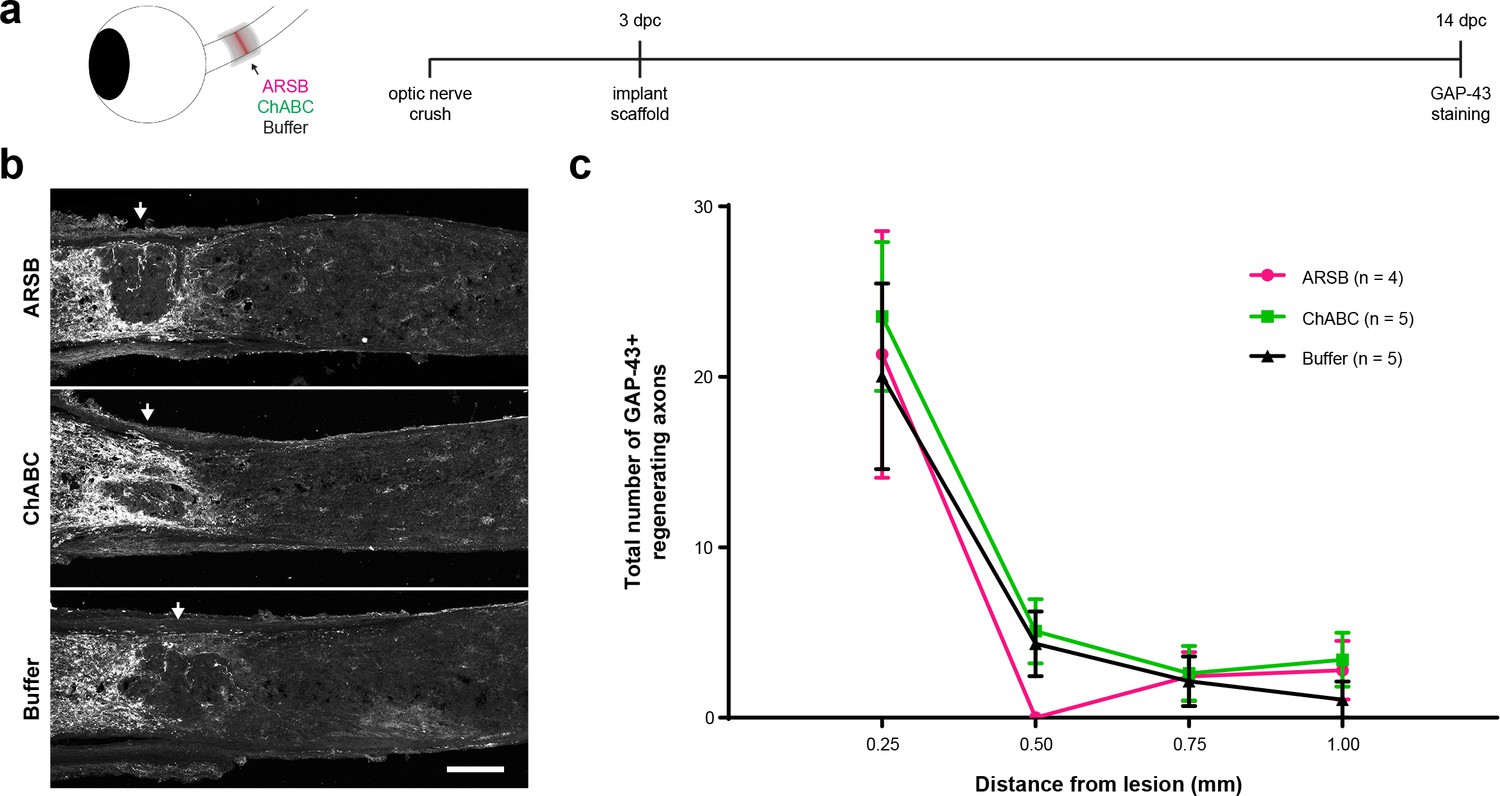
CSPG-targeting enzymes alone do not induce axon regeneration.
(a) Experiment timeline and schematic diagram showing delivery of ARSB, ChABC, and control buffer to the lesioned optic nerve via implanted gelfoam scaffold. (b) Micrographs showing GAP-43-labeled optic nerves from mice treated with ARSB, ChABC, and control buffer. Arrows indicate lesion site. Scale bar = 100 µm. (c) Graph showing the number of regenerating axons at distances distal to the lesion site, displayed as mean ± SEM.
Figure 3—figure supplement 3
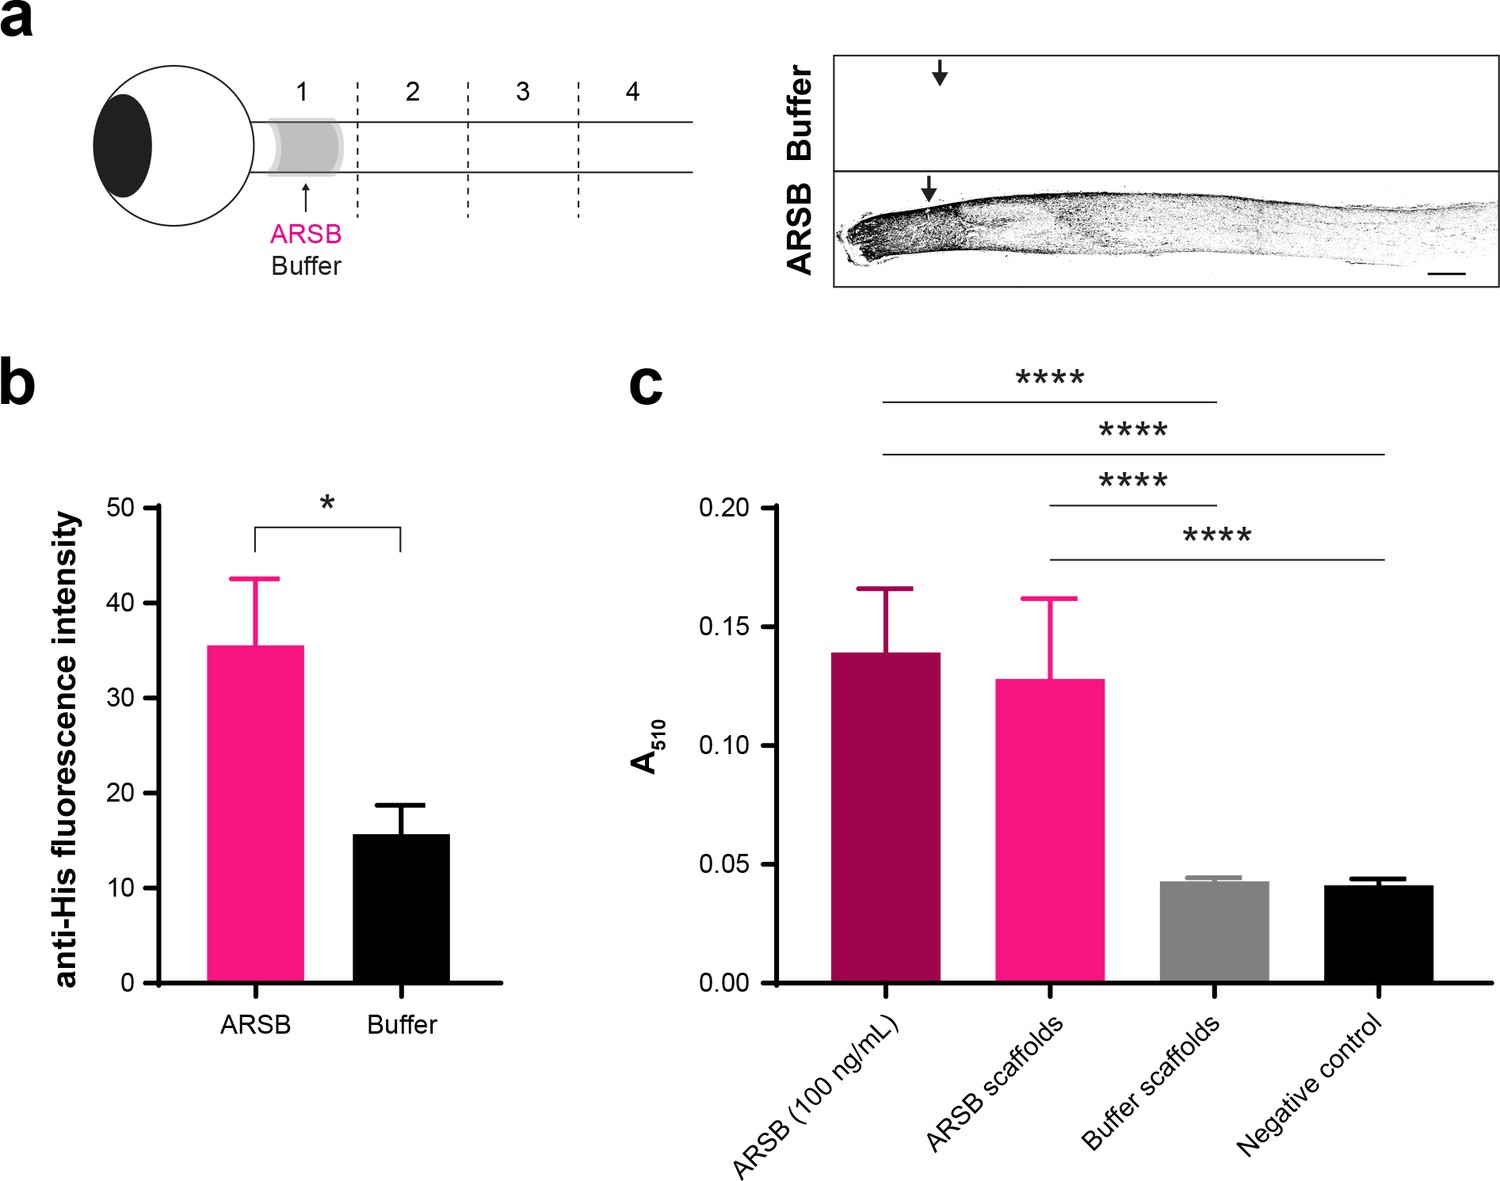
Tagged ARSB penetrates the optic nerve.
(a) Schematic diagram showing delivery of ARSB or control buffer to lesioned optics nerve via implanted gelfoam scaffold. Optic nerves were dissected at 1 dpi and divided into four segments (#1–4). Micrographs showing thresholded images of lesioned optic nerves treated with ARSB-His or buffer and stained with anti-His antibody. Arrows indicate lesion site. Scale bar = 200 µm. (b) Graph showing quantification of anti-His fluorescence intensity measured from insets centered at the lesion site. Statistical significance was determined by Student’s t-test. *p<0.05. (c) Graph showing ARSB activity of recovered gelfoam scaffolds compared with 100 ng/mL stock control. Statistical significance was determined by Student’s t-test. ****p<0.0001.
Figure 3—figure supplement 4
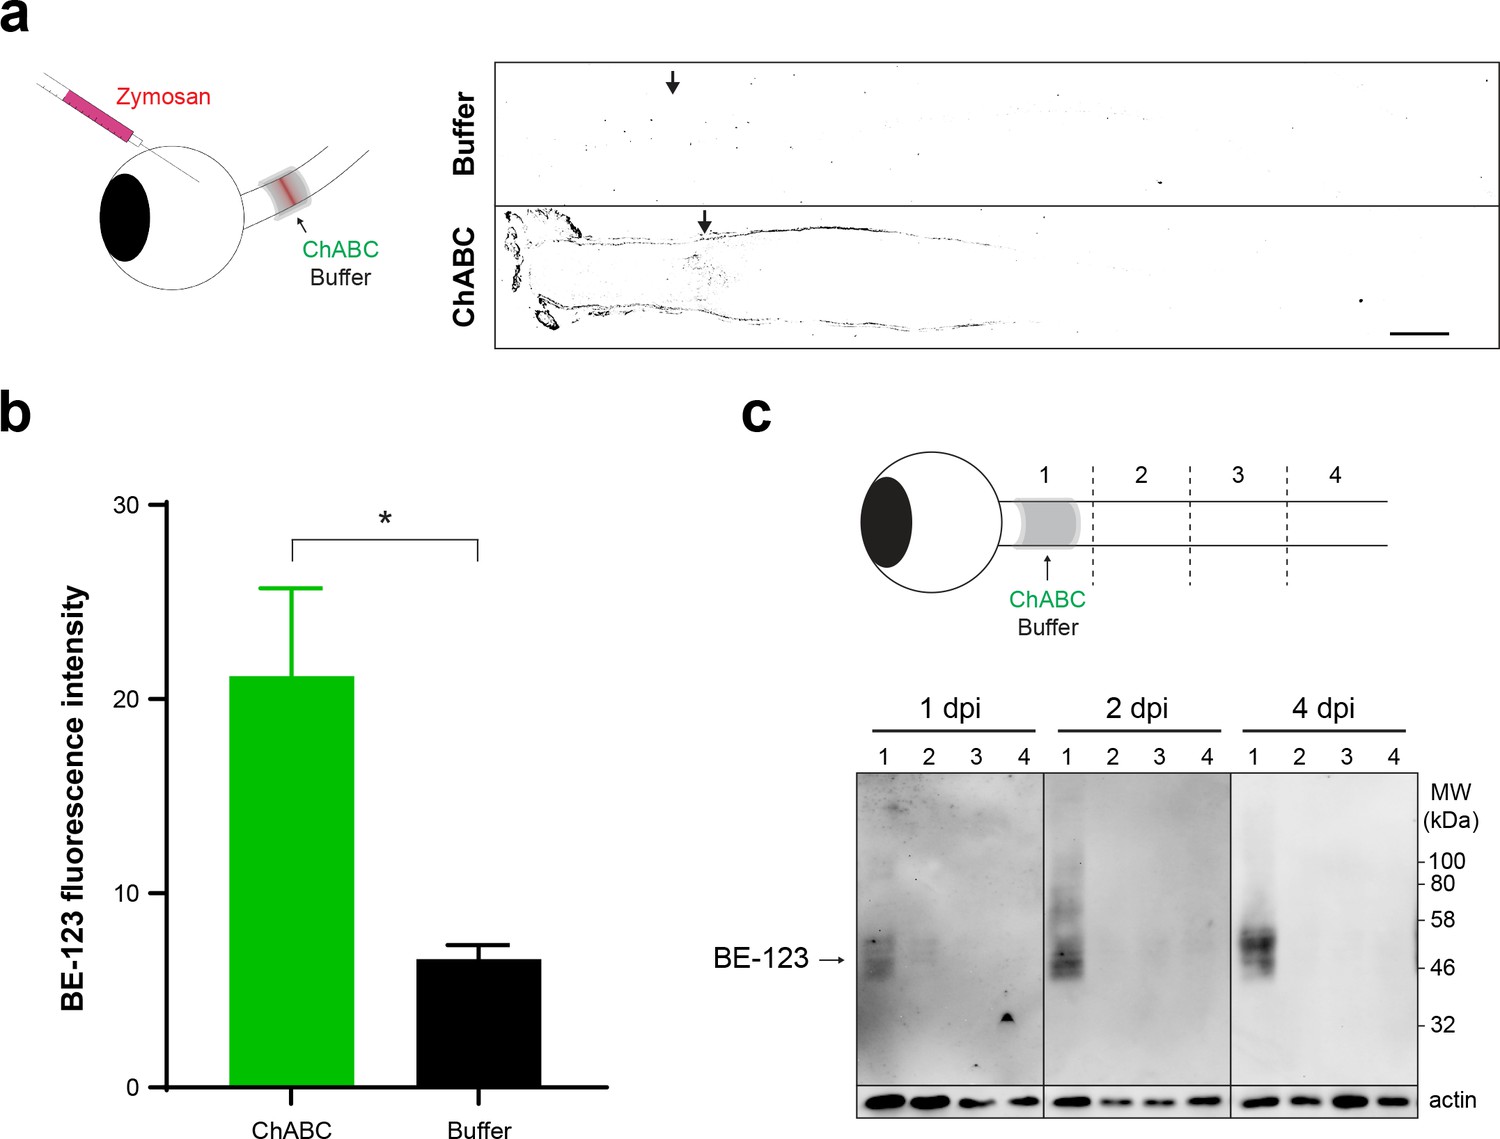
Implanted enzymes penetrate the optic nerve and modify GAG chains.
Zymosan was delivered to the retina via intravitreal injection and ARSB, ChABC, and control buffer were delivered to the lesioned optic nerve via implanted gelfoam scaffolds. (a) Schematic diagram showing delivery of ARSB, ChABC, or buffer to lesioned optic nerves via implanted gelfoam scaffold. Micrographs showing thresholded images of lesioned optic nerves treated with ChABC or buffer and stained with BE-123. Arrows indicate lesion site. Scale bar = 200 µm. (b) Graph showing quantification of BE-123 fluorescence intensity measured from insets centered at the lesion site. Statistical significance was determined by Student’s t-test. *p<0.05. (c) Schematic diagram showing delivery of ChABC to non-lesioned optics nerve via implanted gelfoam scaffold. Optic nerves were dissected at 1, 2, and 4 dpi and divided into four segments (#1–4). Western blot analysis shows enzyme-treated optic nerve segments stained with anti-BE-123 ‘stub’ antibody.
Figure 3—figure supplement 5
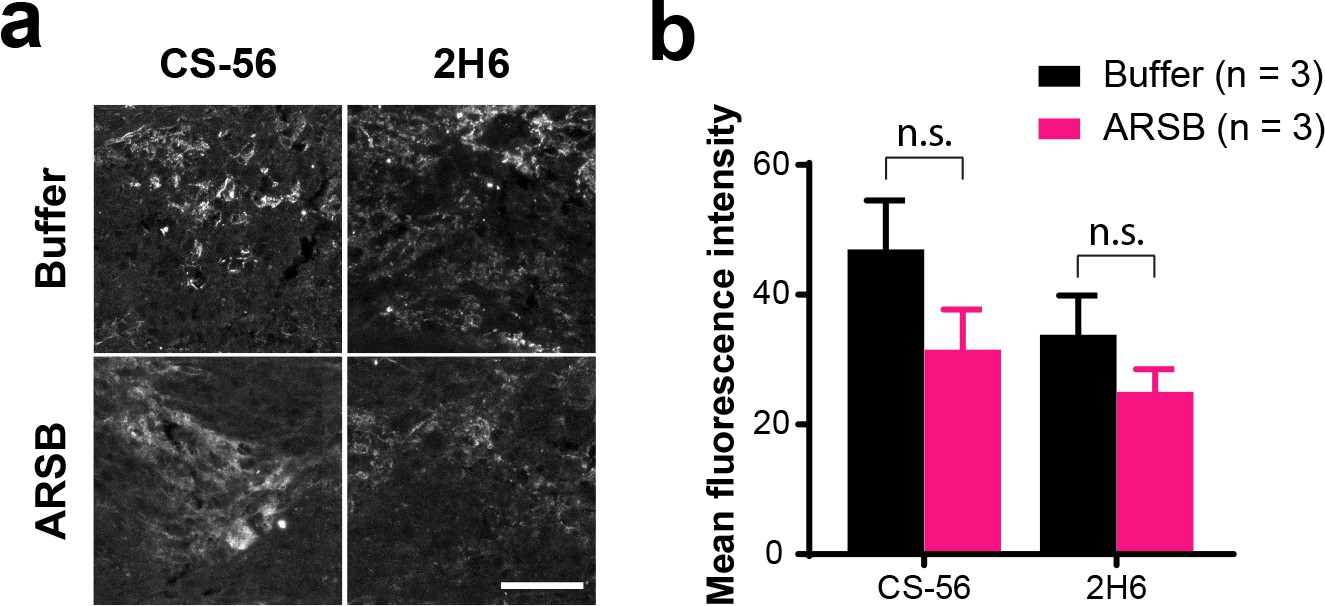
ARSB does not alter CS-56 or 2H6 immunoreactivity.
(a) Micrographs showing insets from lesioned mouse optic nerve tissue analyzed by immunohistochemistry with CS-56 or 2H6. Mice received implants of carrying either ARSB or a control buffer at 3 dpc, and tissue was collected at 7 dpc. Scale bar = 50 µm. (b) Graph showing quantification of CS-56 and 2H6 fluorescence intensity measured from insets centered at the lesion site. Statistical significance was determined by Student’s t-test.
Figure 4 with 1 supplement
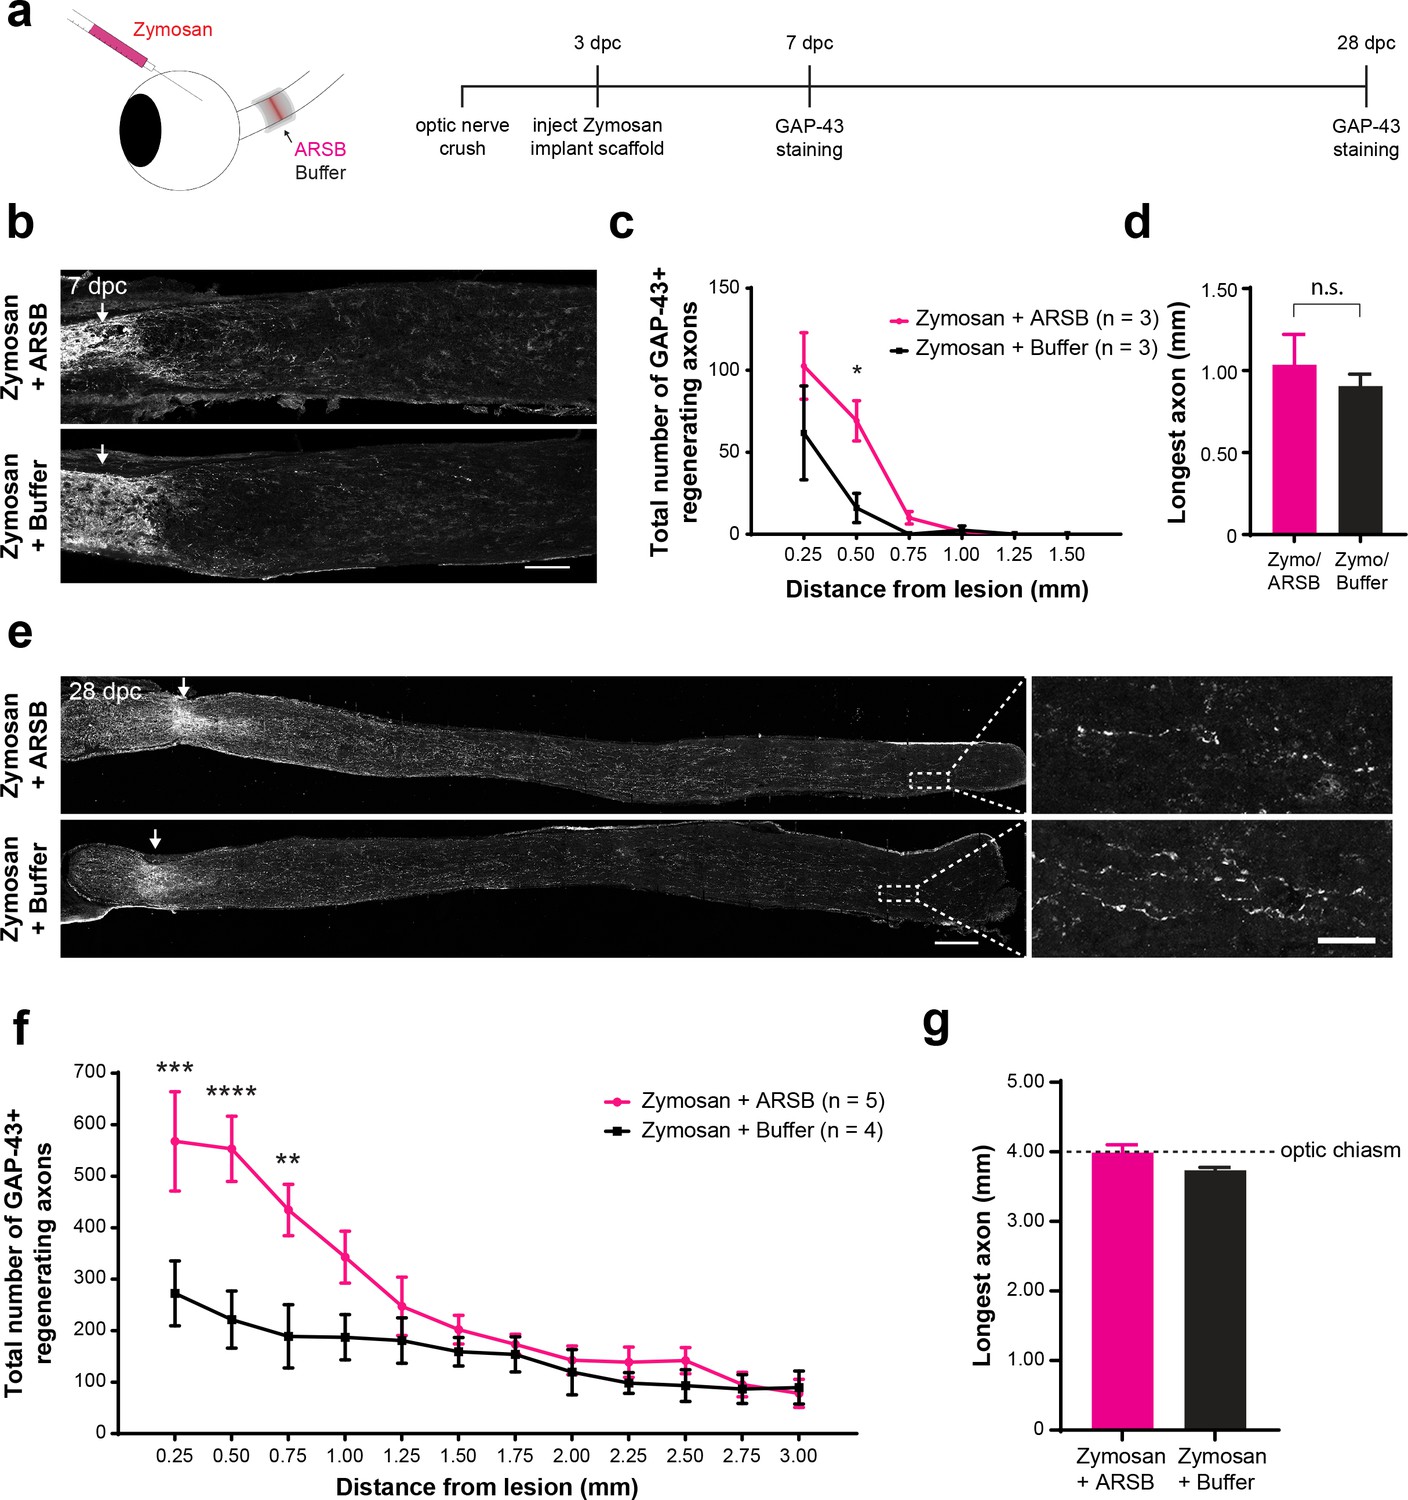
ARSB enhances axon regeneration over an extended therapeutic window.
(a) Experiment timeline and schematic diagram showing intravitreal injection of Zymosan and CPT-cAMP and delivery of ARSB and control buffer to the lesioned optic nerve via implanted gelfoam scaffold. (b) Micrographs showing GAP-43-labeled optic nerves from mice treated with Zymosan/CPT-cAMP and gelfoam scaffolds loaded with ARSB or a control buffer. Arrows indicate lesion site. Scale bar = 200 µm. (c) Graph showing the number of regenerating axons at distances distal to the lesion site, displayed as mean ± SEM. Statistical significance was determined by two-way ANOVA with Bonferroni post-hoc test for multiple comparisons. *p<0.05. (d) Graph showing length of the longest regenerating axon, displayed as mean ± SEM. Statistical significance was determined by Student’s t-test. (e) Micrographs showing GAP-43-labeled optic nerves from mice treated with intravitreal injections of Zymosan and gelfoam scaffold loaded with ARSB or a control buffer. Arrows indicate lesion site. Scale bar = 200 µm. (f) Graph showing the number of regenerating axons at distances distal to the lesion site, displayed as mean ± SEM. Statistical significance was determined by two-way ANOVA with Bonferroni post-hoc test for multiple comparisons. **p<0.005, ***p<0.001, ****p<0.0001. (g) Graph showing length of the longest regenerating axon, displayed as mean ± SEM. Statistical significance was determined by Student’s t-test.
Figure 4—figure supplement 1
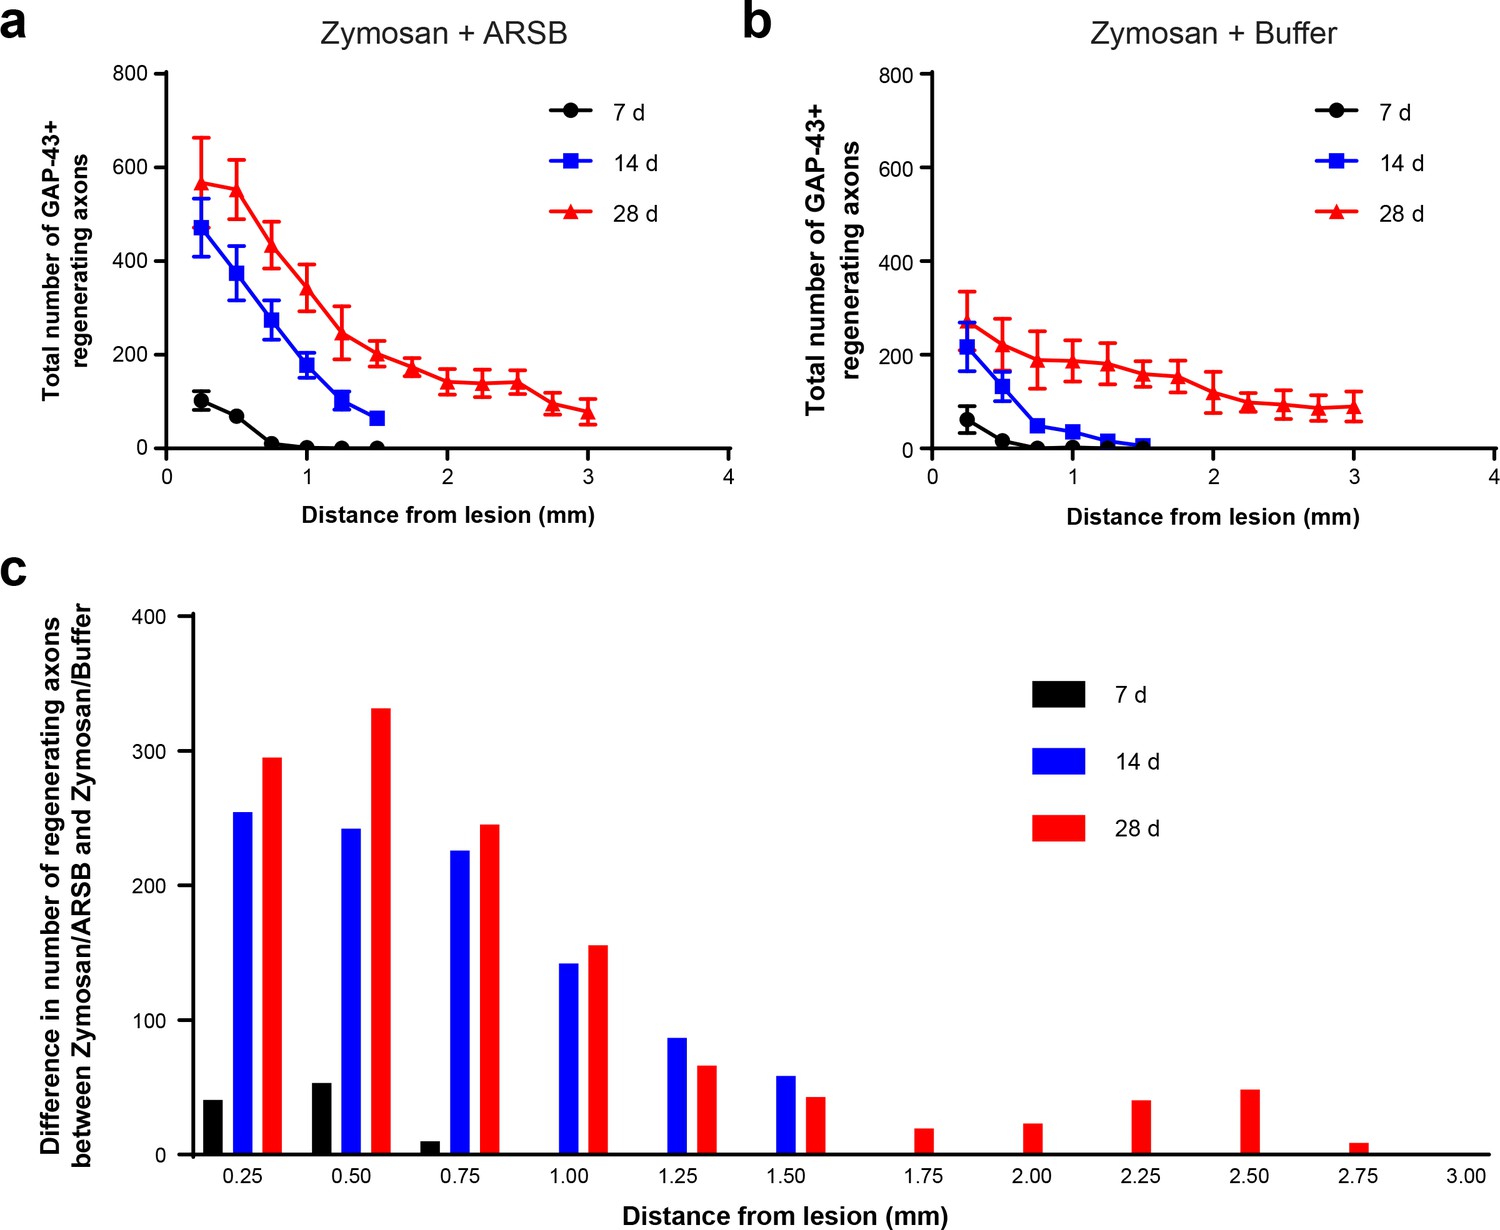
ARSB strongly enhances axon regeneration proximal to the lesion site.
(a–b) Graphs showing the number of regenerating axons at distances distal to the lesion site, displayed as mean ± SEM. Data were collected from separate cohorts of mice where regeneration was quantified at 7, 14, and 28 days following ONC. (c) Graph showing the average increase in regenerating axons for each measured distance and time point, calculated by subtracting the number of axons in the buffer-treated group from the number of axons in the ARSB-treated group.
Figure 5 with 1 supplement
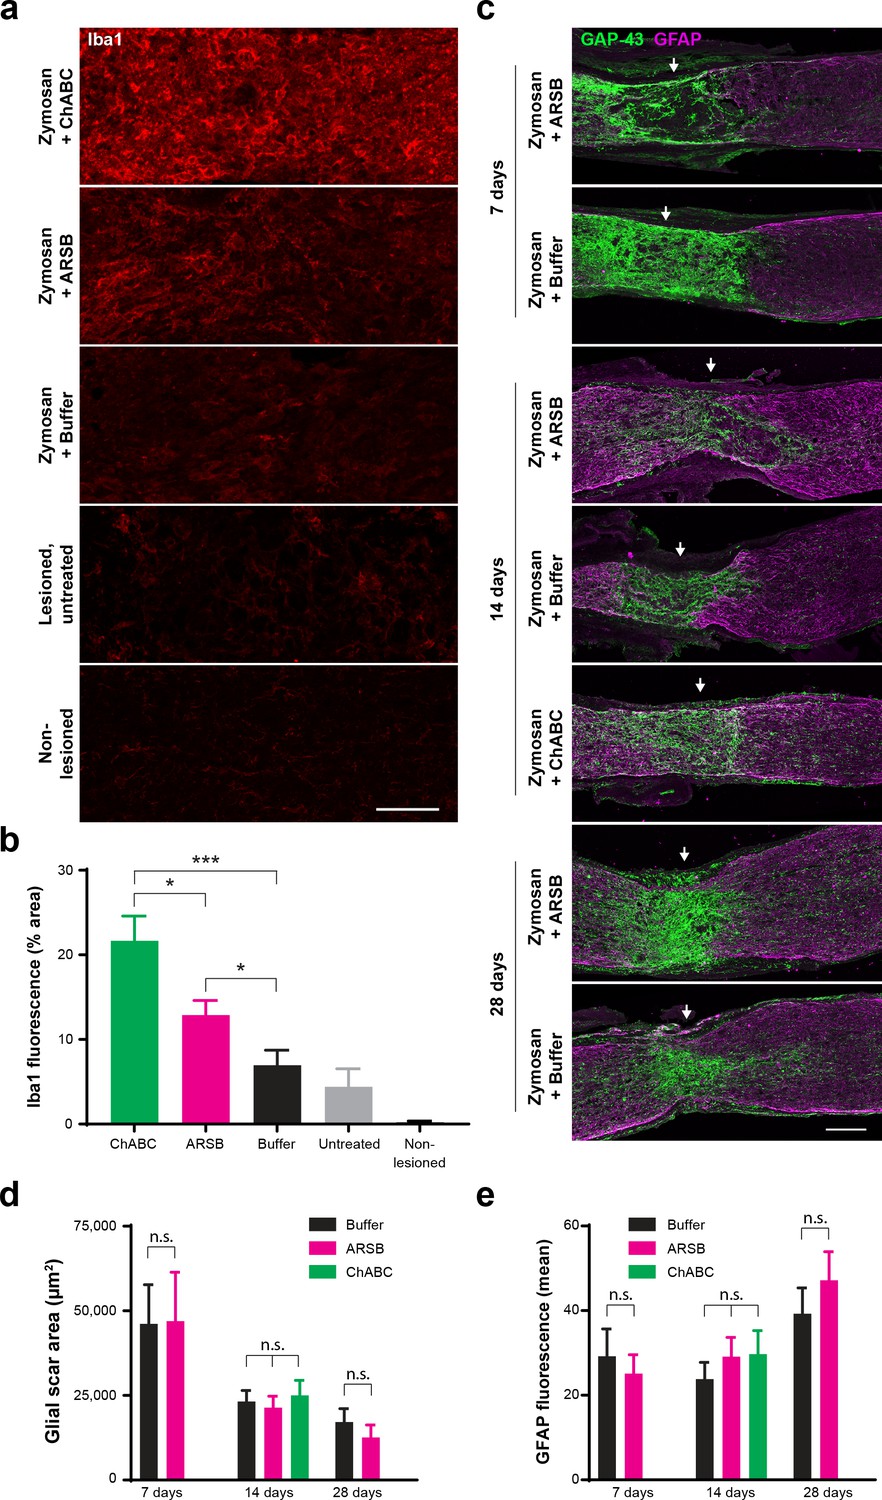
ARSB provokes muted immune response but does not alter astrocyte reactivity, glial scar size, or association of regenerating axons with astrocyte processes.
(a) Micrographs showing Iba1 immunostaining at the optic nerve crush site for samples treated with Zymosan/CPT-cAMP and ChABC, Zymosan/CPT-cAMP and ARSB, Zymosan/CPT-cAMP and a control buffer, no treatment, and non-lesioned controls. Scale bar = 50 µm. (b) Graph showing quantification of Iba1 fluorescence intensity measured as % area of thresholded insets centered at the lesion site. Statistical significance was determined by Student’s t-test. *p<0.05, ***p<0.001. (c) Micrographs showing GFAP and GAP-43 immunostaining at the optic nerve crush site for samples treated with Zymosan/CPT-cAMP and either ARSB, ChABC, or a control buffer and analyzed at 7, 14, and 28 dpc. Arrows indicate lesion site. Scale bar = 100 µm. (d) Graph showing quantification of glial scar size measured as the area delineated by GFAP+ astrocytes at the optic nerve crush site. Statistical significance was determined by Student’s t-test. (e) Graph showing quantification of GFAP immunoreactivity at the optic nerve crush site. Statistical significance was determined by Student’s t-test.
Figure 5—figure supplement 1
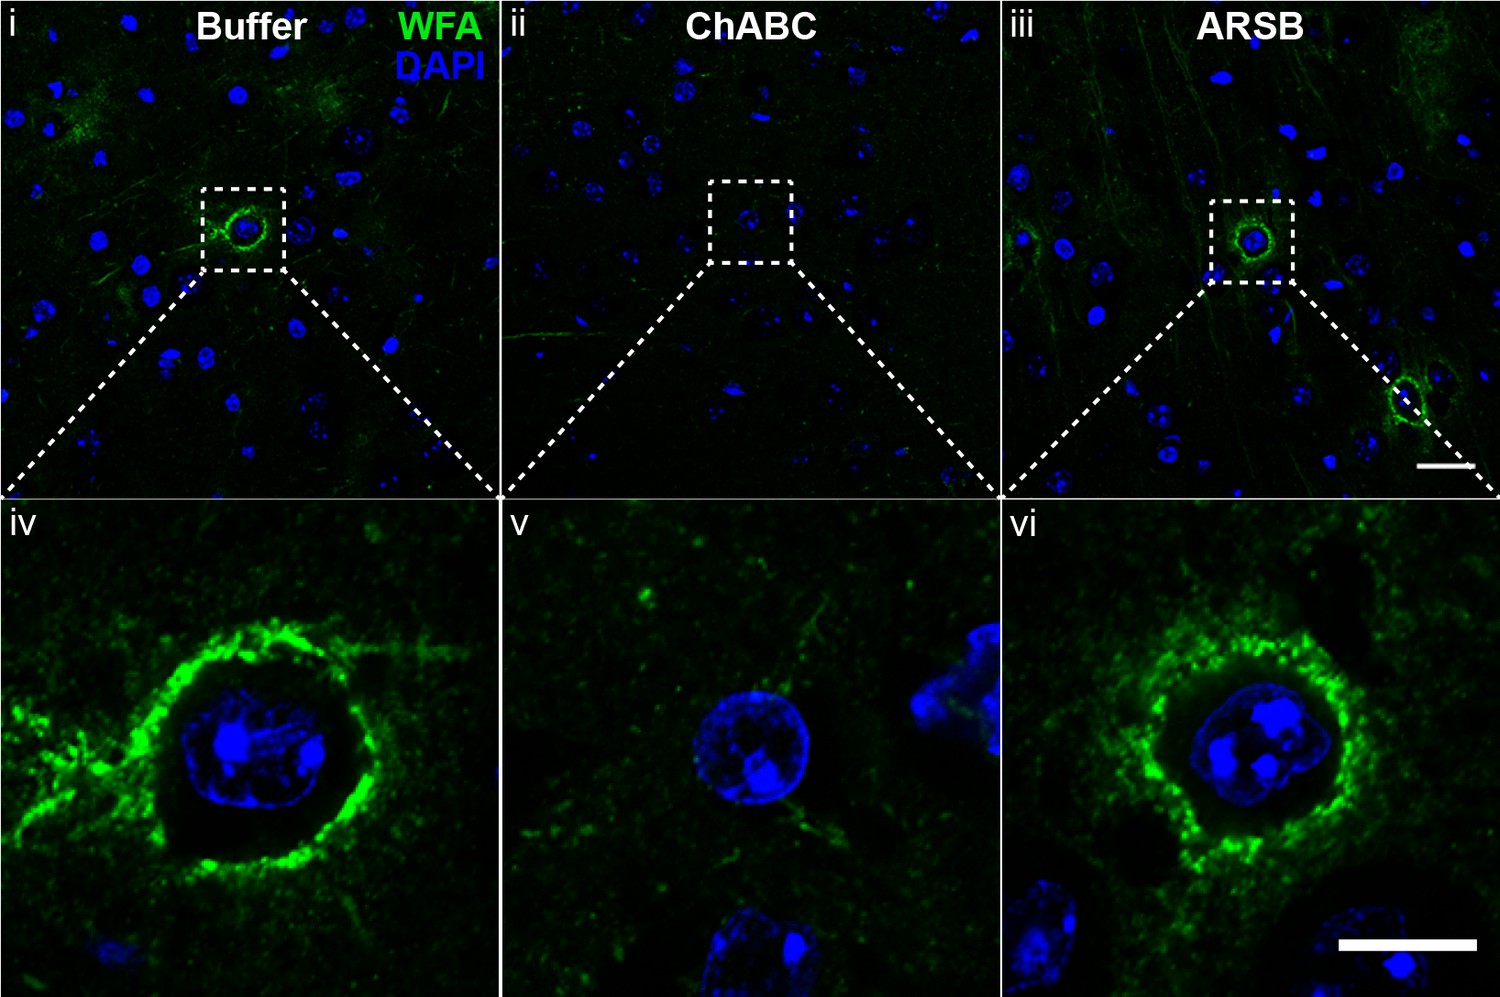
ARSB preserves CSPG-rich perineuronal net structure.
Micrographs showing mouse cortex from tissue incubated with control buffer, ChABC, or ARSB for 8 hr at 37°C and stained with WFA to detect perineuronal nets. Images (iv), (v), and (vi) are insets of (i), (ii), and (iii), respectively. Scale bar = 25 µm, insets 10 µm.
Tables
Key resources table
| Reagent type (species) or resource | Designation | Source or reference | Identifiers | Additional information |
|---|---|---|---|---|
| Antibody | DAPI | ThermoFisher Scientific | D3751; RRID: AB_2307445 | 1/10,000 |
| Antibody | anti-GAP-43 (Sheep) | Benowitz et al., 1988; PMID: 3339416 | 1/50,000; Gift from Benowitz lab | |
| Antibody | anti-GAP43 (Rabbit, polyclonal) | Abcam | ab7462; RRID: AB_305932 | 1/500 |
| Antibody | CS-56 (Mouse, monoclonal) | Millipore Sigma | C8035; RRID: AB_476879 | 1/500 |
| Antibody | 2H6 (Mouse, monoclonal) | Amsbio | 370710-IEC | 1/500 |
| Antibody | BE-123 (Mouse, monoclonal) | Millipore Sigma | MAB2030; RRID: AB_94510 | 1/500 |
| Antibody | Iba1 (Rabbit, polyclonal) | FUJIFILM Wako Chemicals USA | 019–19741; RRID: AB_839504 | 1/500 |
| Antibody | GFAP (Rabbit, polyclonal) | Agilent (Dako) | Z0334; RRID: AB_10013382 | 1/500 |
| Antibody | GFAP (Chicken, polyclonal) | Abcam | ab74674; RRID: AB_304558 | 1/500 |
| Antibody | β-III-tubulin (Mouse, monoclonal) | Millipore Sigma | T8660; RRID: AB_477590 | 1/1000 |
| Antibody | 6x His tag | Abcam | ab137839 | 1/500 |
| Antibody | WFA | Millipore Sigma | L1516; RRID: AB_2620171 | 1/500 |
| Antibody | Donkey anti-sheep, Alexa 488 (secondary) | ThermoFisher Scientific | A-11015; RRID: AB_2534082 | 1/1000 |
| Antibody | Donkey anti-sheep, Alexa 568 (secondary) | ThermoFisher Scientific | A-21099; RRID: AB_2535753 | 1/1000 |
| Antibody | Goat anti-rabbit, Oregon Green 488 (secondary) | ThermoFisher Scientific | O-6381; RRID: AB_2539800 | 1/1000 |
| Antibody | Goat anti-rabbit, Alexa 633 (secondary) | ThermoFisher Scientific | A-21070; RRID: AB_2535731 | 1/1000 |
| Antibody | Goat anti-chicken, Alexa 488 (secondary) | ThermoFisher Scientific | A-11039; RRID: AB_2534096 | 1/1000 |
| Antibody | Goat anti-mouse, Alexa 568 (secondary) | ThermoFisher Scientific | A-11004; RRID: AB_2534072 | 1/1000 |
| Antibody | Goat anti-mouse IgM mu chain, Dylight 650 (secondary) | Abcam | ab98749; RRID: AB_10672799 | 1/500 |
| Antibody | TRITC-conjugated streptavidin (secondary) | Jackson ImmunoResearch | 016-020-08 | 1/1000 |
| Recombinant Protein | TGF-β (human) | PeproTech | 100–21C | |
| Recombinant Protein | ARSB (human) | BioMarin Pharmaceuticals | Naglazyme, Provided by BioMarin | |
| Recombinant Protein | ARSB (human) | R and D Systems | 4415-SU-010 | |
| Recombinant Protein | Cholera Toxin Subunit B, Alexa 555 | ThermoFisher Scientific | CC22843 | |
| Protein | ChABC | Millipore Sigma | C3667 | |
| Protein | CSPG (Chicken Extracellular Chondroitin Sulfate Proteoglycans) | Millipore Sigma | CC117 | |
| Chemical compound, drug | Zymosan A | Millipore Sigma | Z4250 | |
| Chemical compound, drug | CPT-cAMP | Millipore Sigma | C3912 | |
| Chemical compound, drug | PNCS | Alfa Aesar | B23325 | |
| Chemical compound, other | Can Get Signal (Immunoenhancer) | CosmoBio | TYB-NKB-101 | |
| Software, algorithm | GraphPad Prism 7 | RRID:SCR_002798 | ||
| Software, algorithm | Adobe Illustrator CC 2017 | RRID:SCR_010279 | ||
| Software, algorithm | Fiji | RRID:SCR_002285 | ||
| Other | Gelfoam | Ethicon- Johnson and Johnson | 1972 |
Additional files
-
Transparent reporting form
- https://doi.org/10.7554/eLife.37139.017
Download links
A two-part list of links to download the article, or parts of the article, in various formats.
Downloads (link to download the article as PDF)
Open citations (links to open the citations from this article in various online reference manager services)
Cite this article (links to download the citations from this article in formats compatible with various reference manager tools)
Identification of a critical sulfation in chondroitin that inhibits axonal regeneration
eLife 7:e37139.
https://doi.org/10.7554/eLife.37139


