Decoupled maternal and zygotic genetic effects shape the evolution of development
- New York University, United States
Figures
Figure 1
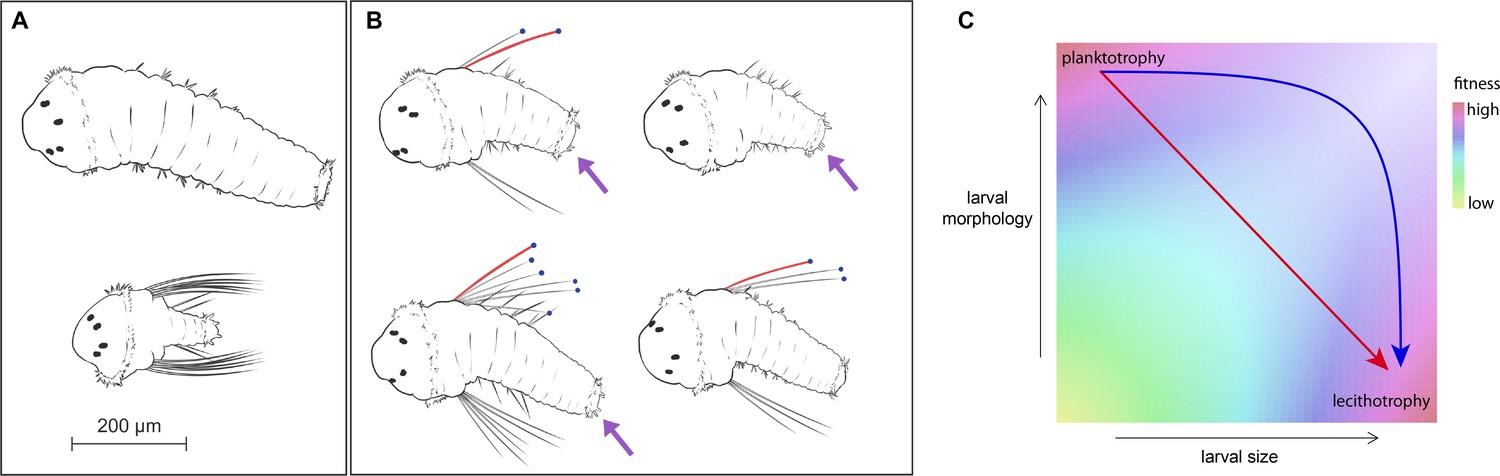
S. benedicti larval morphology.
(A) Wild populations occupy two extremes of larval size and form: planktotrophic larvae (bottom) carry larva-specific chaetae and anal cirri, while lecithotrophic larvae (top) lack these traits and are capable of adopting a benthic habit without feeding. (B) G2 animals (right panel) are intermediate in size and variable in their larval morphologies. We measured larval area, chaetae length (red), presence of anal cirri (purple arrows) and number of chaetae per side, when present (blue dots). (C) Evolutionary theory and the absence of intermediates in the wild suggest a hypothetical fitness landscape, in which planktotrophs and lecithotrophs occupy fitness peaks separated by a valley in size-shape-fitness space (Christiansen and Fenchel, 1979; Havenhand, 1995; Strathmann, 1985; Vance, 1973). Transitions from planktotrophy to lecithotrophy may involve single-step pleiotropic transformations (red arrow) or independent evolution of size and form (blue arrow).
Figure 2 with 1 supplement
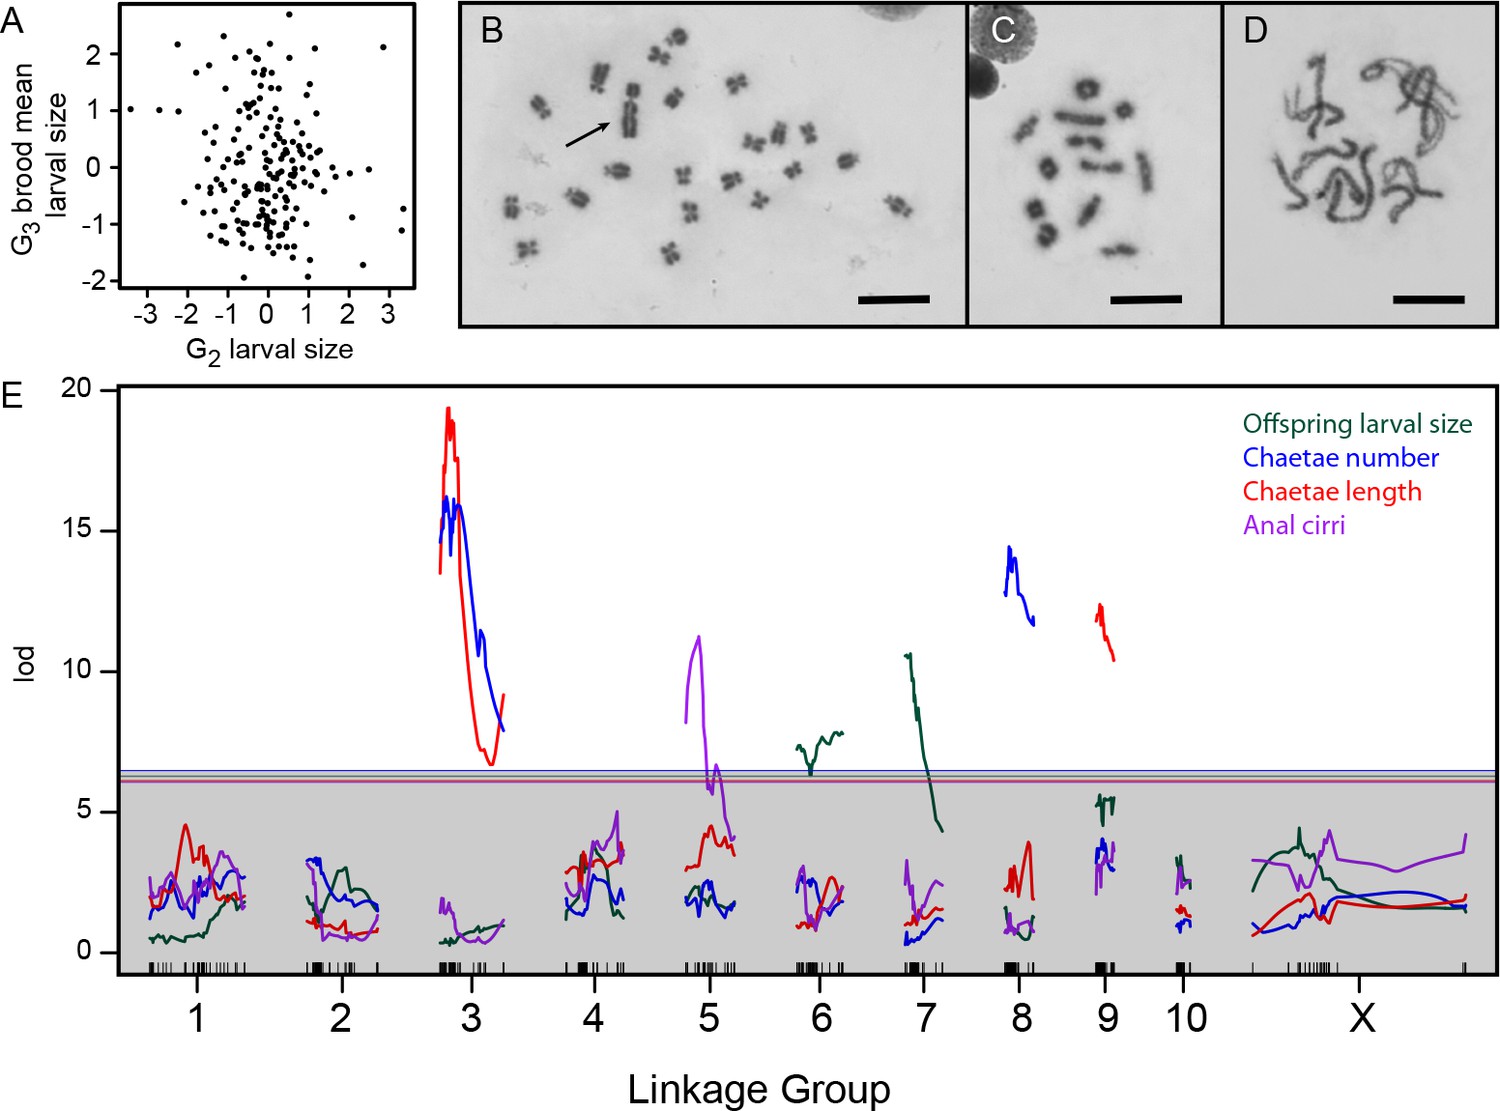
Genetics of developmental mode.
(A) Larval size is uncorrelated between the G2 and G3 generations (r = –0.1, p=0.16), consistent with maternal inheritance. (B) The 22 chromosomes of a male from the Bayonne population include a large Y (arrow). Scale bar is 10 µm in panels B-D. (C) Meiotic chromosomes at diakinesis in the same animal show 12 objects, putatively 10 autosomal bivalents and two sex-chromosome univalents. (D) Zygotene in a Bayonne female shows 11 bivalents. (E) Interval mapping of four traits in the G2 population identifies seven linkages on six chromosomes. Thresholds for genome-wide significance at p=0.05 are indicated for each trait by horizontal lines, determined by 1000 structured permutations that account for G2 family structure.
Figure 2—figure supplement 1

Karyotypes.
Here we show representative images of mitotic and meiotic chromosomes from Bayonne and Long Beach males and females. The large Y chromosome (arrow) is visible in the male but not in female mitotic spreads; both sexes show 22 chromosomes. In males from both populations, diakinesis shows 12 objects, a mixture of ring and rod bivalents and putative unpaired sex chromosomes. Female zygotene shows 11 bivalents.
Figure 3
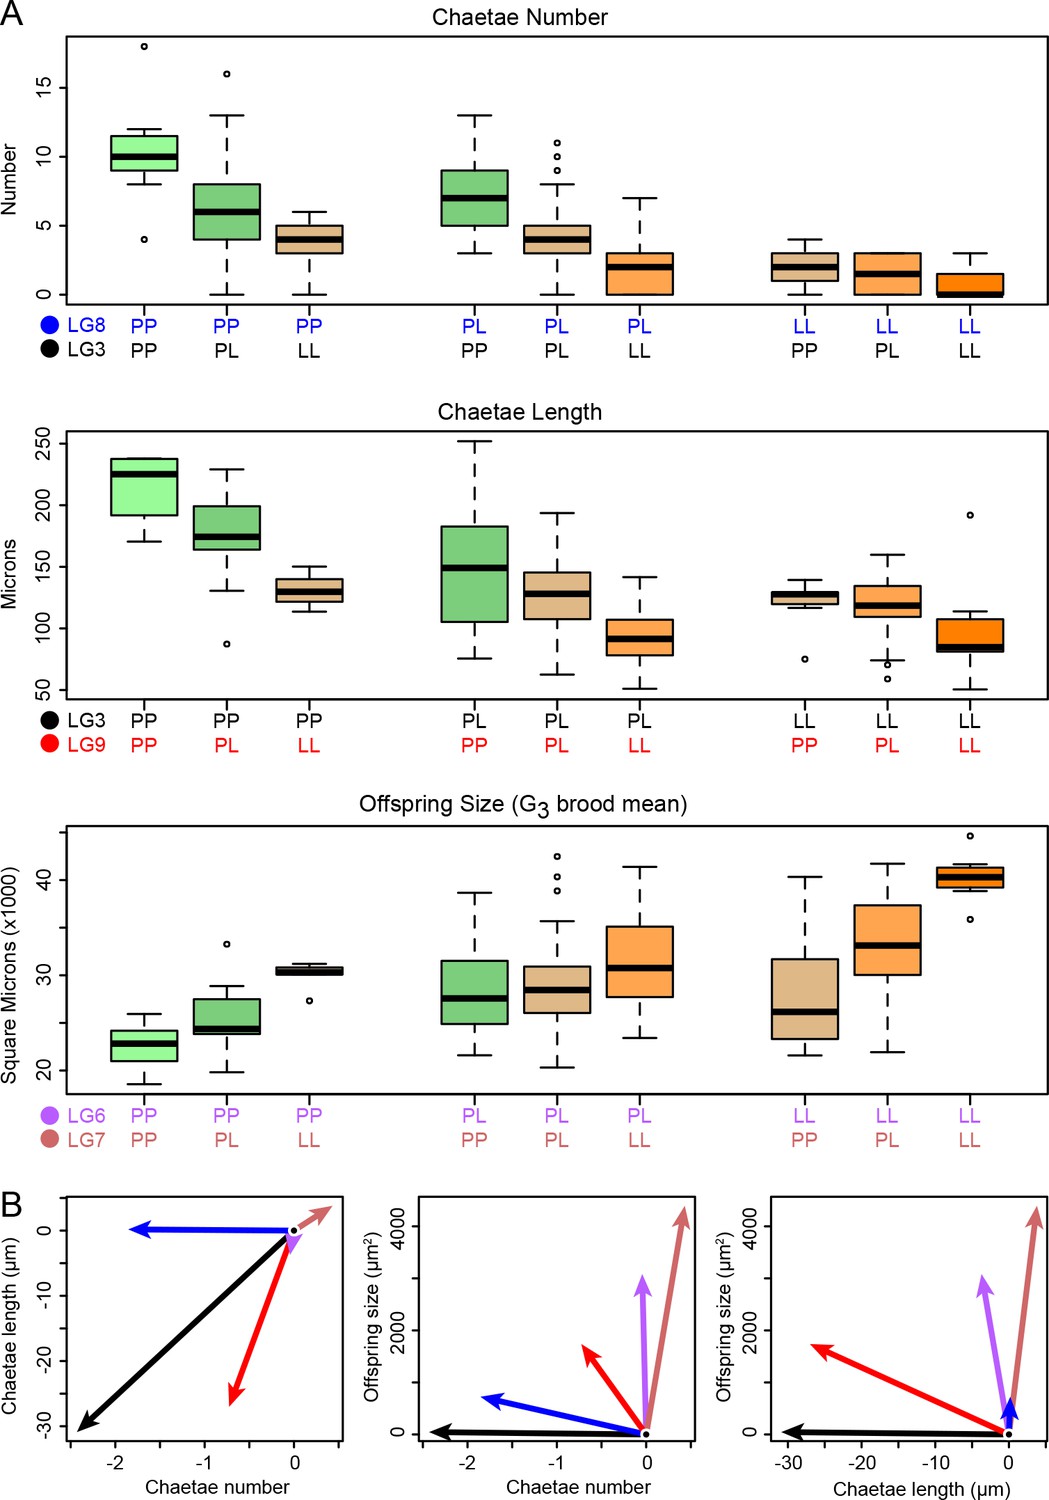
Phenotype distributions for each genotype.
(A) Loci have substantial and largely additive effects. Each boxplot shows the phenotype distribution as a function of the specified G2 two-locus genotype, and each box is colored according to the number of planktotroph (P) and lecithotroph (L) alleles it carries. The horizontal bar shows the median, the box spans the interquartile range, the whiskers encompass all data within 1.5 times the interquartile range, and points beyond this range are shown individually. (B) Multivariate analysis shows that the effects of the five loci in panel A are largely restricted to maternal or zygotic traits. The additive-effect vectors for lecithotrophic alleles in three-trait space are here projected onto two dimensions. Arrow color corresponds to the locus colors in panel A. The major maternal-effect loci are strikingly nearly orthogonal to the major zygotic effects (LG3 and LG8), while the locus on LG9 is mildly pleiotropic, with major effects on chaetae length and minor effects on number and offspring size (all in the aligned direction: shorter chaetae, fewer chaetae, larger offspring).
Figure 4
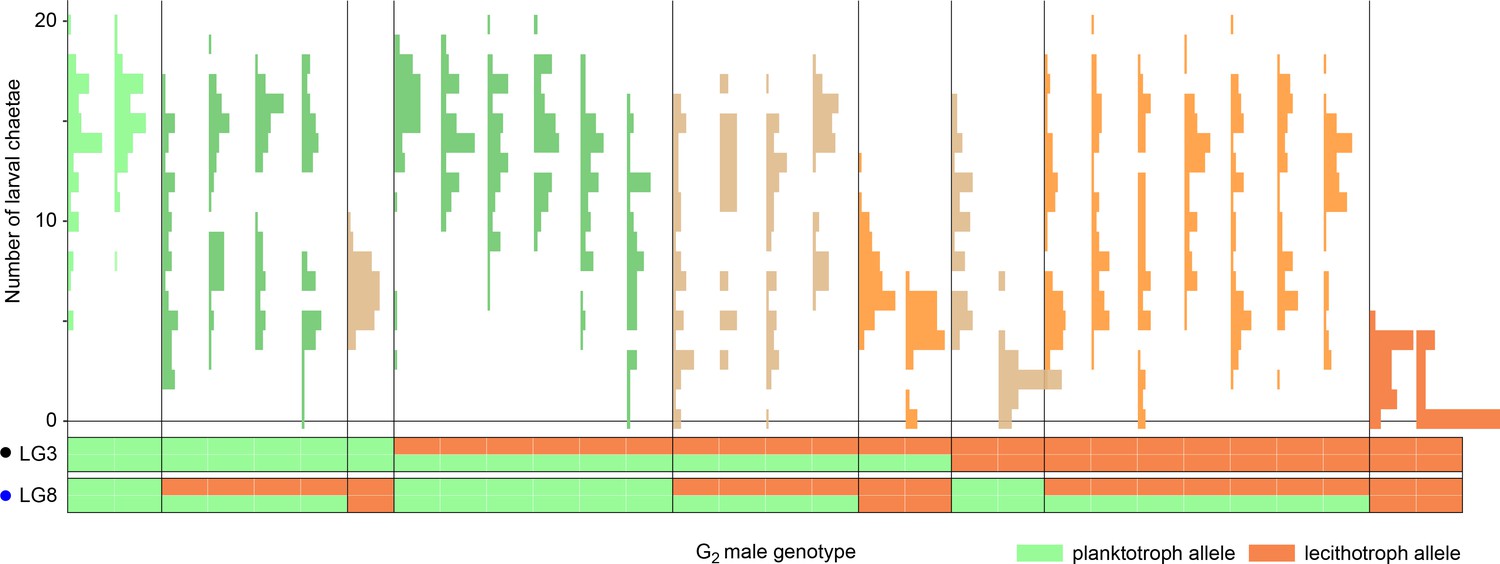
Zygotic alleles are penetrant in a planktotrophic maternal-effect background.
Each histogram is the distribution of the number of chaetae in the offspring of one G2 male and a planktotrophic female from the Bayonne population. Approximately 45 offspring per family were measured. Each section of the plot bounded by vertical lines represents a class of G2 male genotypes at the two chaetae-number QTL. Genotypes are shown below, from doubly homozygous planktotrophic genotypes (left) to doubly homozygous lecithotrophic genotypes (right). Note that the progeny of most heterozygous G2 males have multimodal distributions, demonstrating segregation of large-effect alleles. Some offspring of the males homozygous for lecithotrophic alleles completely lack chaetae, despite their planktotrophic maternal background.
Tables
Table 1
G2 phenotypic variance explained by significant loci and interactions.
https://doi.org/10.7554/eLife.37143.005| Trait | Locus | Variance explained* |
|---|---|---|
| Number of chaetae | LG3 | 21.8% |
| LG8 | 18.2% | |
| Length of chaetae | LG3 | 25.8% |
| LG9 | 13.5% | |
| G3 mean larval size | LG6 | 18.8% |
| LG7 | 25.4% | |
| LG6 x LG7 | 5.2% | |
| Presence of anal cirri | LG5 | 18.9% |
-
*Percent variance explained is estimated by dropping the specified locus or interaction from the best-fitting genetic model for the phenotype (File S4). In the case of anal cirri, the reported number is the percent deviance explained in a logistic regression.
Table 2
Effect sizes for significant QTL for each trait.
https://doi.org/10.7554/eLife.37143.006| Locus | Effect | Effect size | SE |
|---|---|---|---|
| Chaetae Number | number | ||
| Intercept | 4.29 | 0.18 | |
| LG3 2.5 cM | Additive | −2.53 | 0.27 |
| LG3 2.5 cM | Dominance | −0.58 | 0.35 |
| LG8 1.7 cM | Additive | −2.30 | 0.27 |
| LG8 1.7 cM | Dominance | 0.31 | 0.35 |
| Chaetae Length* | µm | ||
| Intercept | 140.02 | 5.02 | |
| Family A | 2.60 | 6.53 | |
| Family C | 0.01 | 6.09 | |
| Family H | −19.72 | 6.04 | |
| LG3 3.6 cM | Additive | −29.59 | 3.17 |
| LG3 3.6 cM | Dominance | −20.26 | 4.06 |
| LG9 1.5 cM | Additive | −25.07 | 3.61 |
| LG9 1.5 cM | Dominance | 4.11 | 4.33 |
| G3 Offspring Area | µm2 | ||
| Intercept | 29516.79 | 352.34 | |
| LG6 17.9 cM | Additive | 3356.14 | 498.74 |
| LG6 17.9 cM | Dominance | −908.67 | 704.69 |
| LG7 2.1 cM | Additive | 4020.69 | 546.01 |
| LG7 2.1 cM | Dominance | −228.43 | 704.69 |
| LG6 x LG7 | AxA | 1254.06 | 821.20 |
| LG6 x LG7 | DxA | 232.10 | 1092.04 |
| LG6 x LG7 | AxD | −3297.03 | 997.48 |
| LG6 x LG7 | DxD | 62.26 | 1409.39 |
| Anal Cirri | logistic | ||
| Intercept | 3.85 | 26.57 | |
| LG5 5.1 cM | Additive | −6.68 | 53.14 |
| LG5 5.1 cM | Dominance | −6.07 | 53.14 |
-
*This model includes a family effect, coded with Family F as the reference family
Table 3
Number of individuals from each family used in mapping crosses.
https://doi.org/10.7554/eLife.37143.009| Generation | Mother | Father | Males | Females |
|---|---|---|---|---|
| F1 | P0 Bayonne | P0 Long Beach | 24 | 23 |
| G2 | F1 Female A | F1 Male Z | 12 | 39 |
| G2 | F1 Female C | F1 Male Z | 15 | 63 |
| G2 | F1 Female F | F1 Male Z | 9 | 28 |
| G2 | F1 Female H | F1 Male Z | 22 | 57 |
Table 4
Log10 likelihood ratio in favor of founder genotype assignments.
https://doi.org/10.7554/eLife.37143.010| Autosome | Log10 (L(H1)/L(H2)) |
|---|---|
| 1 | 9.4 |
| 2 | 23.3 |
| 3 | 2.6 |
| 4 | 13.3 |
| 5 | 9.2 |
| 6 | 22.9 |
| 7 | 11.0 |
| 8 | 10.8 |
| 9 | 26.3 |
| 10 | 4.4 |
Table 5
Estimated effects from reduced multivariate model QTL scan (in units of G2 phenotypic standard deviations).
https://doi.org/10.7554/eLife.37143.011| Chaetae number | Chaetae length | Offspring size | |
|---|---|---|---|
| Intercept | 0.18 | 0.33 | 0.13 |
| QTL3 Additive | 0.74 | 0.78 | −0.01 |
| QTL3 Dominance | −0.17 | −0.60 | −0.04 |
| QTL6 Additive | −0.01 | −0.09 | 0.55 |
| QTL6 Dominance | −0.05 | −0.19 | −0.27 |
| QTL7 Additive | 0.13 | 0.10 | 0.78 |
| QTL8 Additive | 0.57 | 0.00 | −0.13 |
| QTL9 Additive | 0.22 | 0.68 | −0.31 |
| Family C | 0.01 | −0.03 | −0.17 |
| Family F | 0.13 | −0.15 | 0.03 |
| Family H | −0.14 | −0.59 | −0.08 |
-
(Family A is present in the model as the reference family)
Additional files
-
Supplementary file 1
R workspace file containing S. benedicti genetic maps and G2 phenotype data.
The data are stored as rqtl (Broman et al., 2003) cross objects.
- https://doi.org/10.7554/eLife.37143.012
-
Supplementary file 2
csv file containing phenotype and genotype data for Bayonne backcross larvae.
- https://doi.org/10.7554/eLife.37143.013
-
Supplementary file 3
Compressed directory containing data and scripts used to generate the S. benedicti genetic maps presented in Supplementary file 1.
The directory includes R scripts for each of the four steps of map construction detailed in the Materials and Methods, and a perl script required for step 2. The directory also includes data files called by the R scripts.
- https://doi.org/10.7554/eLife.37143.014
-
Source code 1
R script file containing the annotated workflow underlying all genetic mapping and phenotypic analyses presented in the manuscript.
This script makes use of the data in Supplementary file 1 and Supplementary file 2.
- https://doi.org/10.7554/eLife.37143.015
-
Transparent reporting form
- https://doi.org/10.7554/eLife.37143.016
Download links
A two-part list of links to download the article, or parts of the article, in various formats.
Downloads (link to download the article as PDF)
Open citations (links to open the citations from this article in various online reference manager services)
Cite this article (links to download the citations from this article in formats compatible with various reference manager tools)
Decoupled maternal and zygotic genetic effects shape the evolution of development
eLife 7:e37143.
https://doi.org/10.7554/eLife.37143


