The SERM/SERD bazedoxifene disrupts ESR1 helix 12 to overcome acquired hormone resistance in breast cancer cells
- University of Chicago, United States
- Dana-Farber Cancer Institute, United States
- The Scripps Research Institute, United States
- University of Illinois at Urbana-Champaign, United States
- Texas A&M University, United States
- PamGene International BV, The Netherlands
- Memorial Sloan Kettering Cancer Center, United States
Figures
Figure 1
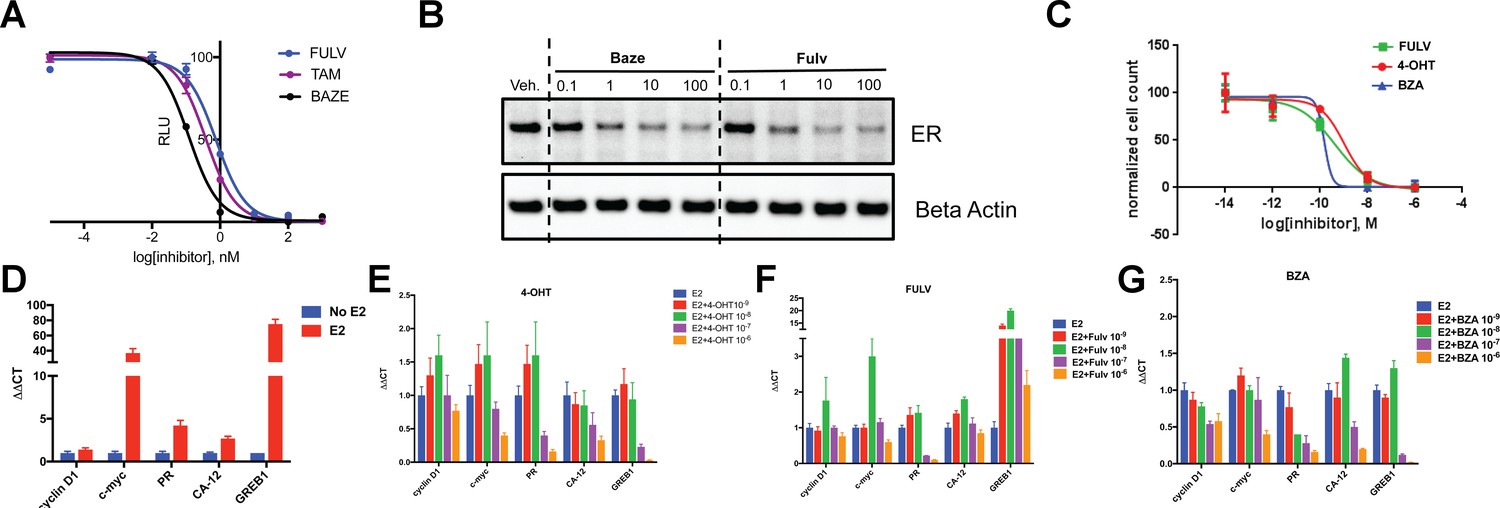
The inhibitory potency of BZA in MCF-7 cells.
(A) ERα transcriptional reporter gene assay in cells treated with BZA, FULV, and 4-OHT. (B) Relative cyclin D1 mRNA levels of in MCF-7 cells treated with E2 plus 4-OHT, FULV, or BZA vehicle and normalized to E2. (C) Relative c-myc mRNA levelsMCF-7 cells treated with E2 plus 4-OHT, FULV, or BZA vehicle and normalized to E2. (D) Relative GREB1 mRNA levels in MCF-7 cells treated with E2 plus 4-OHT, FULV, or BZA vehicle and normalized to E2. (E) Relative CA12 mRNA levels of MCF-7 cells treated with E2 plus 4-OHT, FULV, or BZA vehicle and normalized to E2. (F) ERα degradation in MCF-7 cells with increasing doses of BZA or FULV normalized to β-actin. (G) Inhibition of cell growth with increasing concentrations of BZA, FULV, or 4-OHT.
Figure 2 with 2 supplements
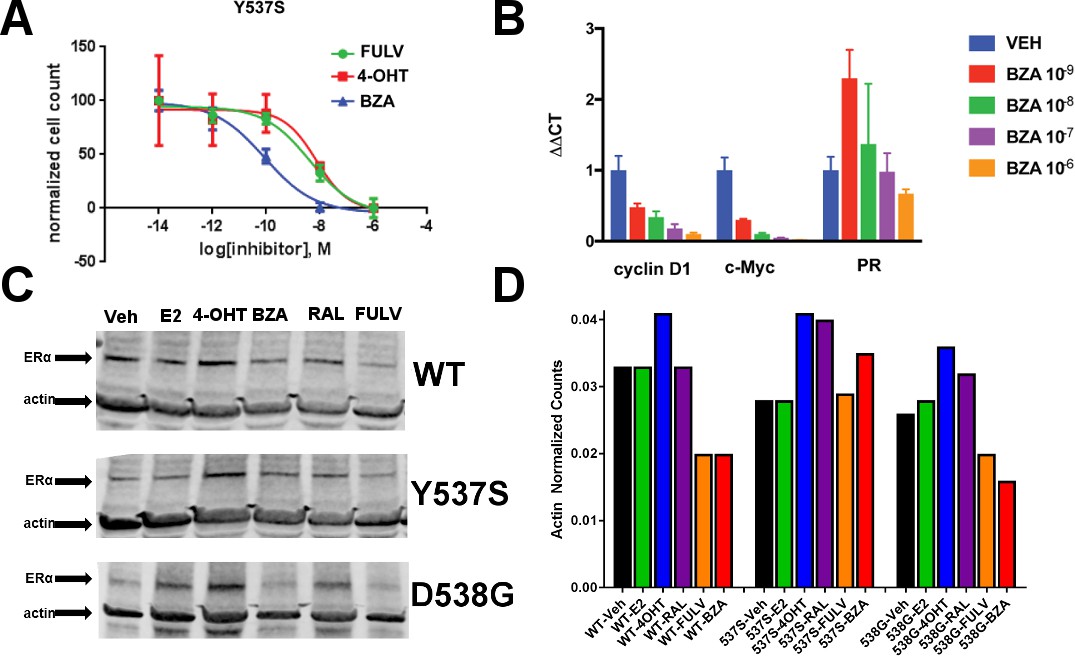
The ability of BZA to disrupt Y537S and D538G ERα activity.
(A) Cell growth in MCF-7 cells with DOX-induced Y537S ERα expression. (B) Inhibition of ERα target genes in DOX-induced Y537S ERα expressed MCF-7 cells with increasing doses of BZA. (C) Representative immunoblot of HA-ERα WT, 537S, or D538G treated with E2, 4-OHT, BZA, RAL, or FULV for 24 hr. (D) Representative counts of HA-ERα from the immunoblot normalized to actin.
Figure 2—figure supplement 1
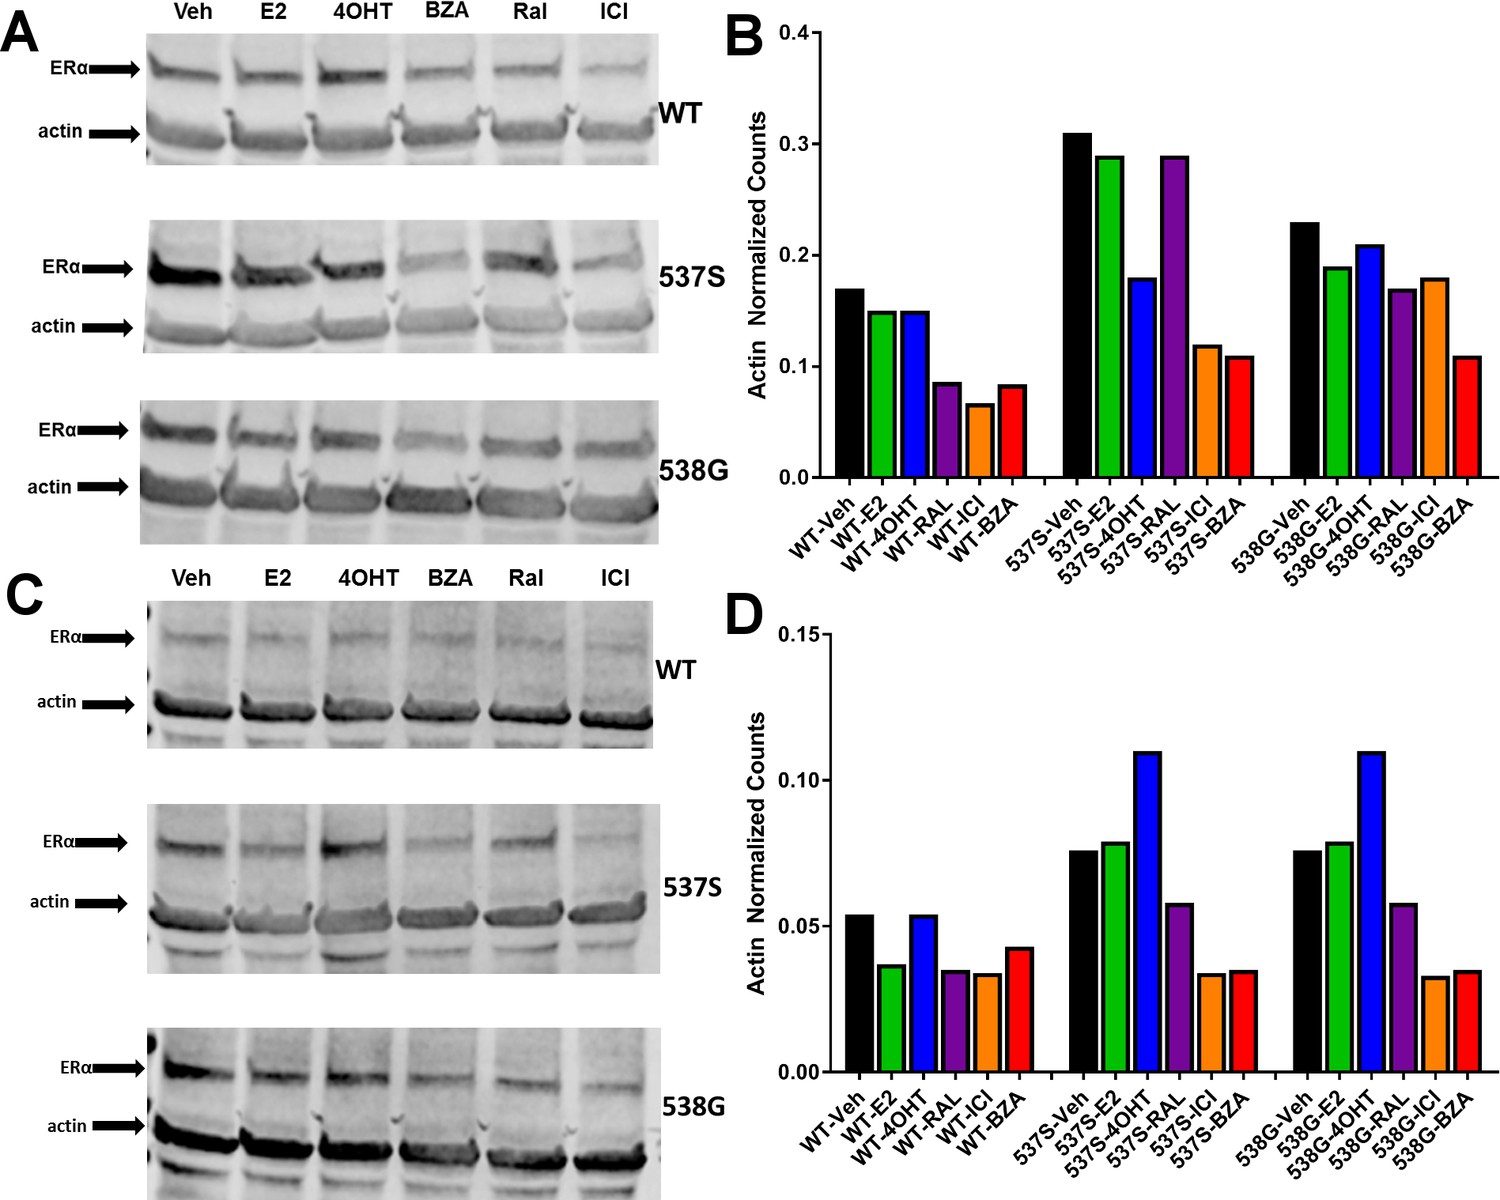
Replicate experiments of HA-ERα levels in MCF-7 cells upon treatment with E2, 4-OHT, RAL, fulvestrant (FULV), or BZA for 24 hr.
(A) Replicate immunoblot to that shown in Figure 1 probing for HA-ERα and actin in MCF-7 cells upon treatment. (B) Counts from immunoblot A normalized to actin. (C) Third replicate immunoblot to that shown in Figure 1 probing for HA-ERα and actin in MCF-7 cells upon treatment. (D) Counts from immunoblot C normalized to actin.
Figure 2—figure supplement 2
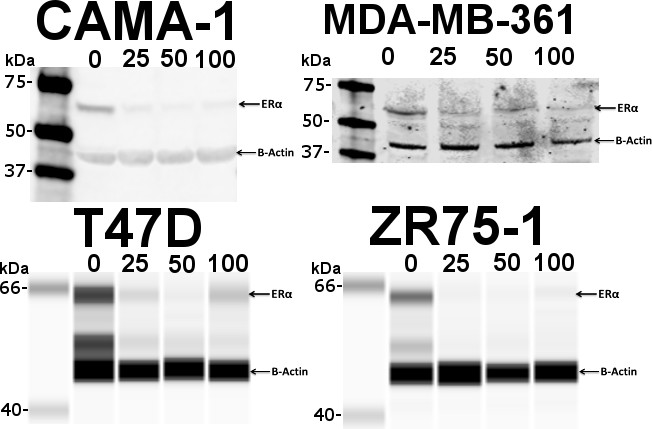
BZA-induced degradation of ERα in CAMA-1, MDA-MB-361, T47D, and ZR75-1 breast cancer cell lines.
Numbers along the top indicate concentrations of BZA in nM.
Figure 3
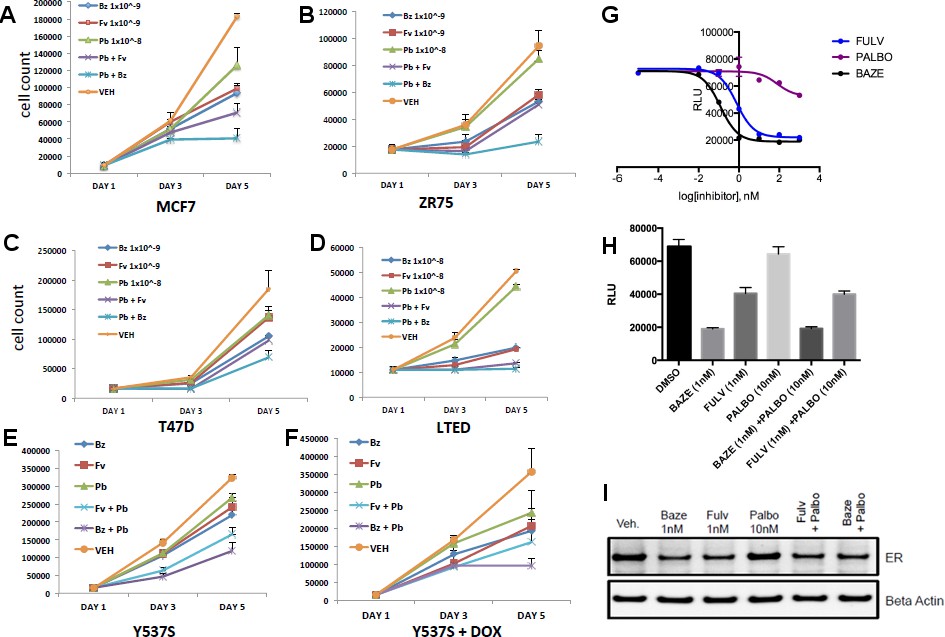
Combination treatment with CDK4/6 inhibitor and BZA.
(A) Cell growth inhibit with MCF7 breast cancer cells. (B) ZR75 breast cancer cells. (C) T47D breast cancer cells. (D) LTED breast cancer cells. (E) Non-induced MCF7 breast cancer cells with a dox-inducible ERα Y537S mutant. (F) MCF7 cells expressing ERα Y537S. (G) Dose-response curves for inhibition of ERα transcriptional activity in the presence of BZA, PALBO, and FULV in MCF7 cells. (H) ERα transcriptional reporter gene assays for combination treatments. (I) ERα stability resulting from combination treatments.
Figure 4
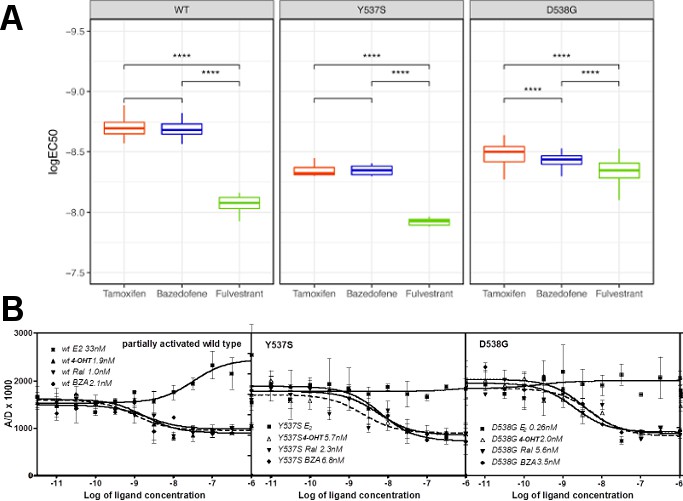
Coactivator recruitment and inhibition of WT, Y537S, and D538G ERα LBD.
(A) EC50 quartiles for cells treated with 4-OHT (red), BZA (blue), or FULV (green). (B) In vitro quantification of the effect of ligands on promoting (E2) or inhibiting (4-OHT, RAL, BZA) the binding of SRC3-NRD to recombinant expressed WT, Y537S, or D538G ERα LBD. To be able to measure a signal from all three receptors, they were first primed with 20 nME2 before adding ligand. IC50 values (nM) are shown next to the legend for each protein.
Figure 5 with 1 supplement

Structural basis for the SERD properties exhibited by BZA.
(A) Overlay of BZA (cyan) with RAL (grey) X-ray crystal structures showing differences in H11-12 loop and H12 orientation. (B) Hydrogen bonds (dashed lines) formed by BZA and RAL in the binding pocket and highlighting differences in H11-12 loop and H12 conformation. PDBs: 1ERR and 4XI3.
Figure 5—figure supplement 1
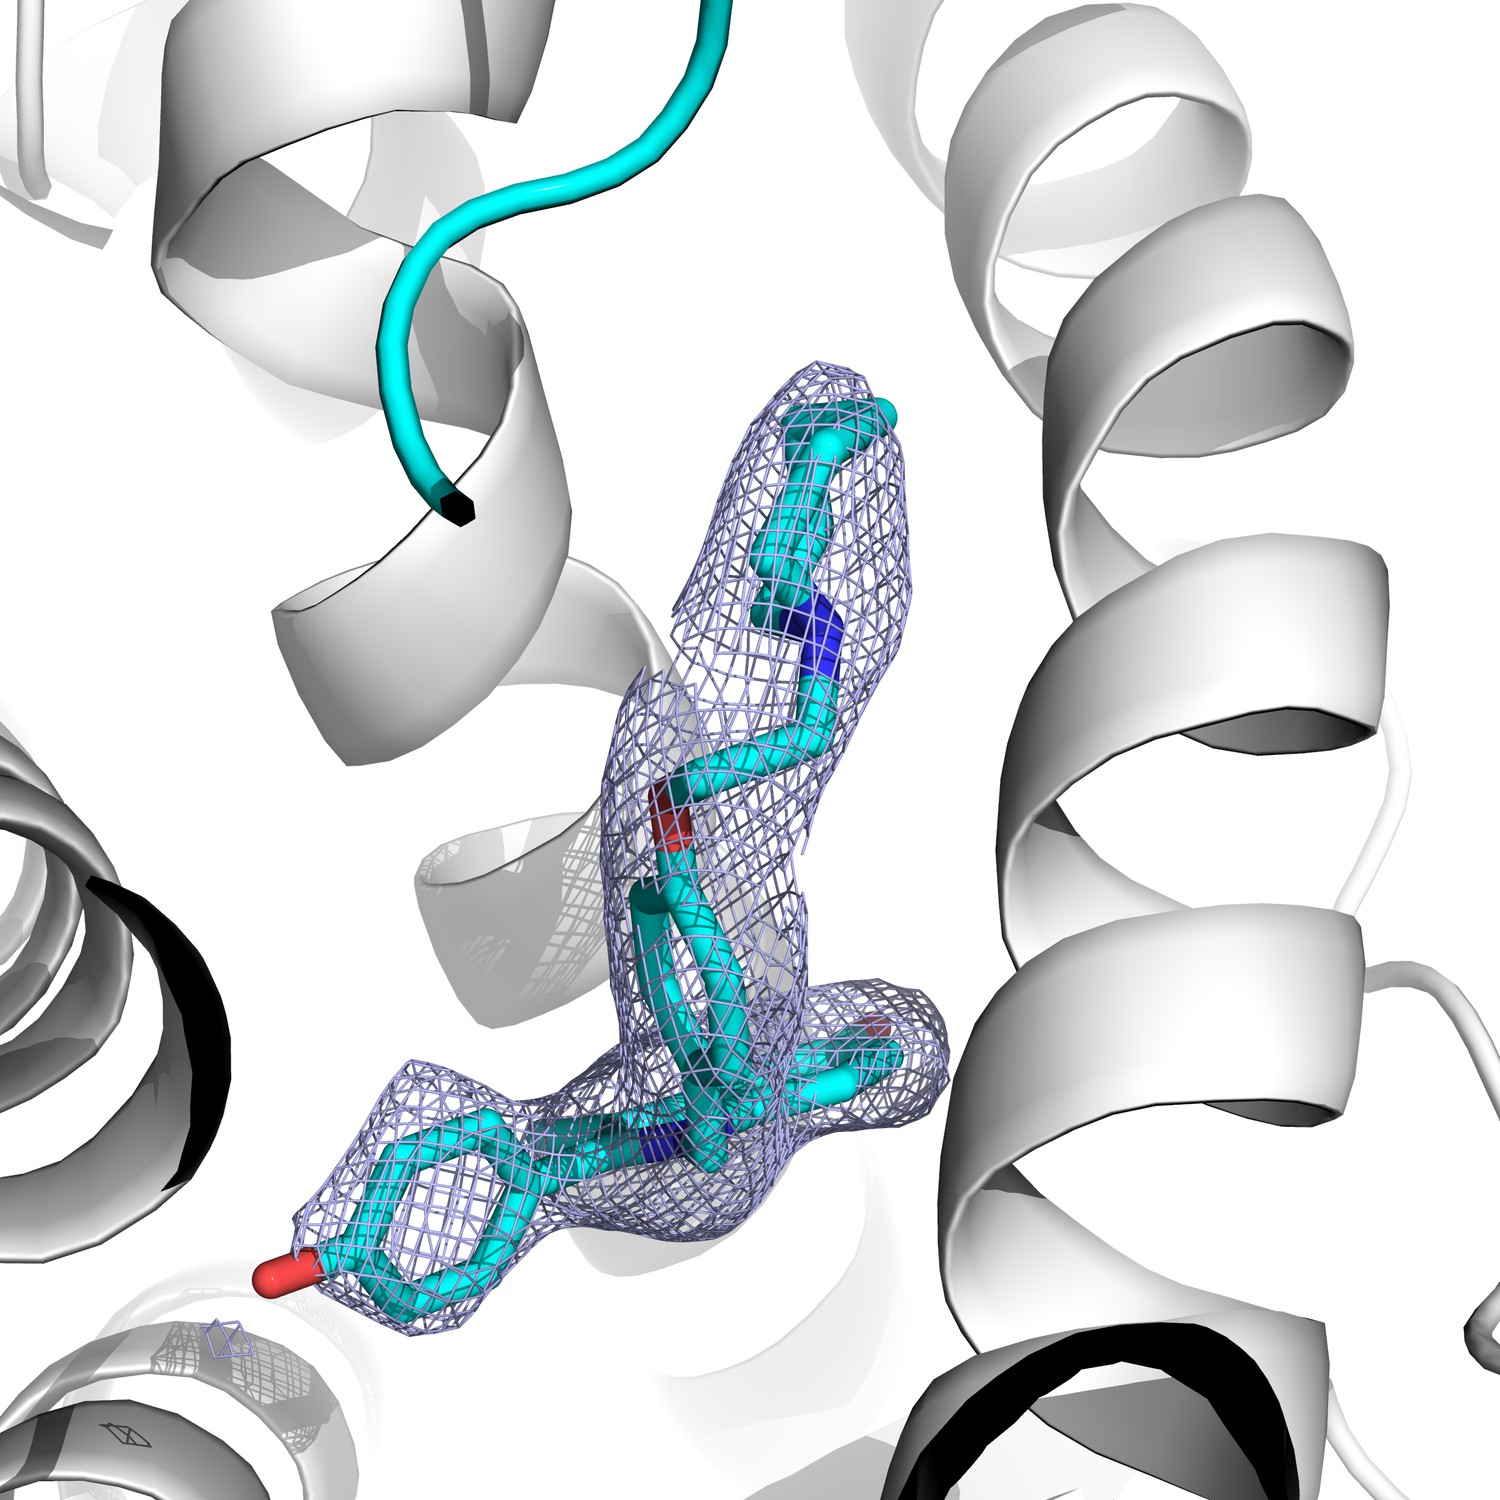
2│Fo-Fc│difference map of BZA in the ERα ligand binding pocket contoured to 1.5σ.
https://doi.org/10.7554/eLife.37161.010
Figure 6 with 3 supplements
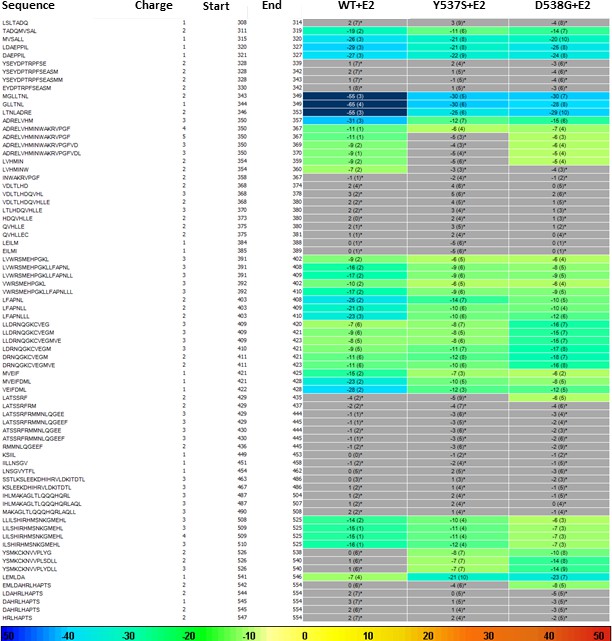
HDX MS for WT, Y537S, and D538G ERα LBD in complex with E2.
Deuterium uptake for each peptide is calculated as the average of % D for the 6 time points (10 s, 30 s, 60 s, 300 s, 900 s and 3600 s), and the difference in average % D values between the Apo-ERα and ERα-E2 bound samples is shown as a heat map with a color code given at the bottom of the figure (warm colors for deprotection and cool colors for protection). Peptides are colored only if they show a > 5% difference (less or more protection) in average deuterium uptake between the two states, and the software employs a paired two-tailed student’s t-test-based coloring scheme (p-value < 0.05 for two consecutive time points or a p-value < 0.01 for a single time point) to distinguish real protection differences from inherent variation in the data. Grey color represents no significant change (0–5%) between the two states.
Figure 6—figure supplement 1
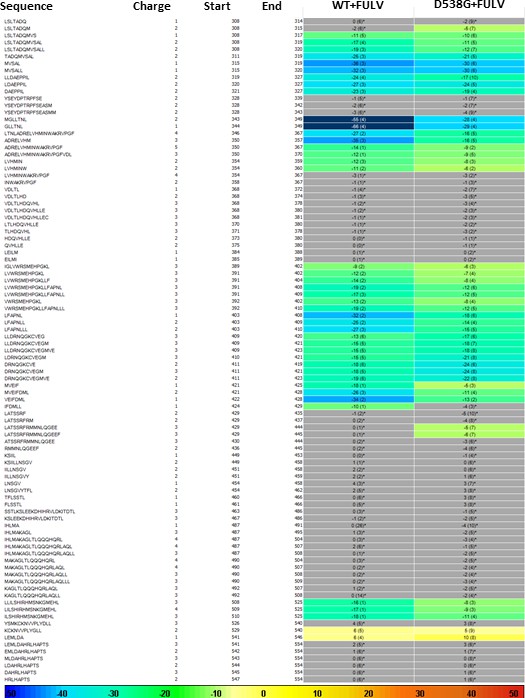
HDX MS for WT and D538G ERα LBD in complex with FULV.
Deuterium uptake for each peptide is calculated as the average of % D for the 6 time points (10 s, 30 s, 60 s, 300 s, 900 s and 3600 s) and the difference in average % D values between the Apo-ERα and ERα-FULV bound samples is shown as a heat map with a color code given at the bottom of the figure (warm colors for deprotection and cool colors for protection). Peptides are colored only if they show a > 5% difference (less or more protection) in average deuterium uptake between the two states and the software employs a paired two-tailed student’s t-test-based coloring scheme (p-value < 0.05 for two consecutive time points or a p-value < 0.01 for a single time point) to distinguish real protection differences from inherent variation in the data. Grey color represents no significant change (0–5%) between the two states.
Figure 6—figure supplement 2

HDX MS for WT, Y537S, and D538G ERα LBD in complex with 4-OHT.
Deuterium uptake for each peptide is calculated as the average of % D for the 6 time points (10 s, 30 s, 60 s, 300 s, 900 s and 3600 s) and the difference in average % D values between the Apo-ERα and ERα-FULV bound samples is shown as a heat map with a color code given at the bottom of the figure (warm colors for deprotection and cool colors for protection). Peptides are colored only if they show a > 5% difference (less or more protection) in average deuterium uptake between the two states and the software employs a paired two-tailed student’s t-test-based coloring scheme (p-value < 0.05 for two consecutive time points or a p-value < 0.01 for a single time point) to distinguish real protection differences from inherent variation in the data. Grey color represents no significant change (0–5%) between the two states.
Figure 6—figure supplement 3
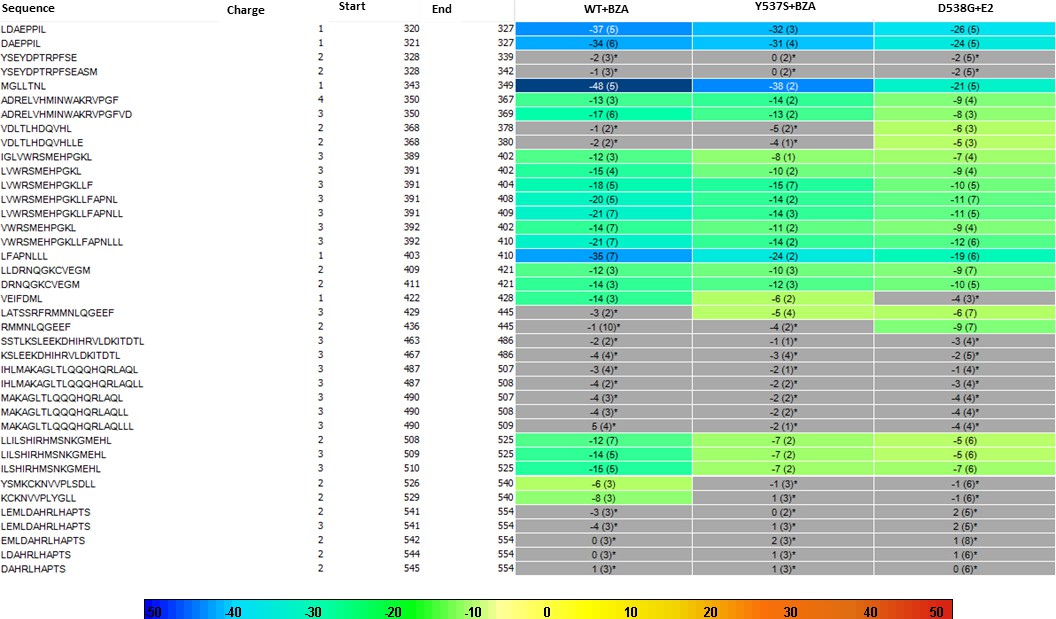
HDX MS for WT, Y537S, and D538G ERα LBD in complex with BZA.
Deuterium uptake for each peptide is calculated as the average of % D for the 6 time points (10 s, 30 s, 60 s, 300 s, 900 s and 3600 s) and the difference in average % D values between the Apo-ERα and ERα-FULV-bound samples is shown as a heat map with a color code given at the bottom of the figure (warm colors for deprotection and cool colors for protection). Peptides are colored only if they show a > 5% difference (less or more protection) in average deuterium uptake between the two states and the software employs a paired two-tailed student’s t-test-based coloring scheme (p-value < 0.05 for two consecutive time points or a p-value < 0.01 for a single time point) to distinguish real protection differences from inherent variation in the data. Grey color represents no significant change (0–5%) between the two states.
Figure 7
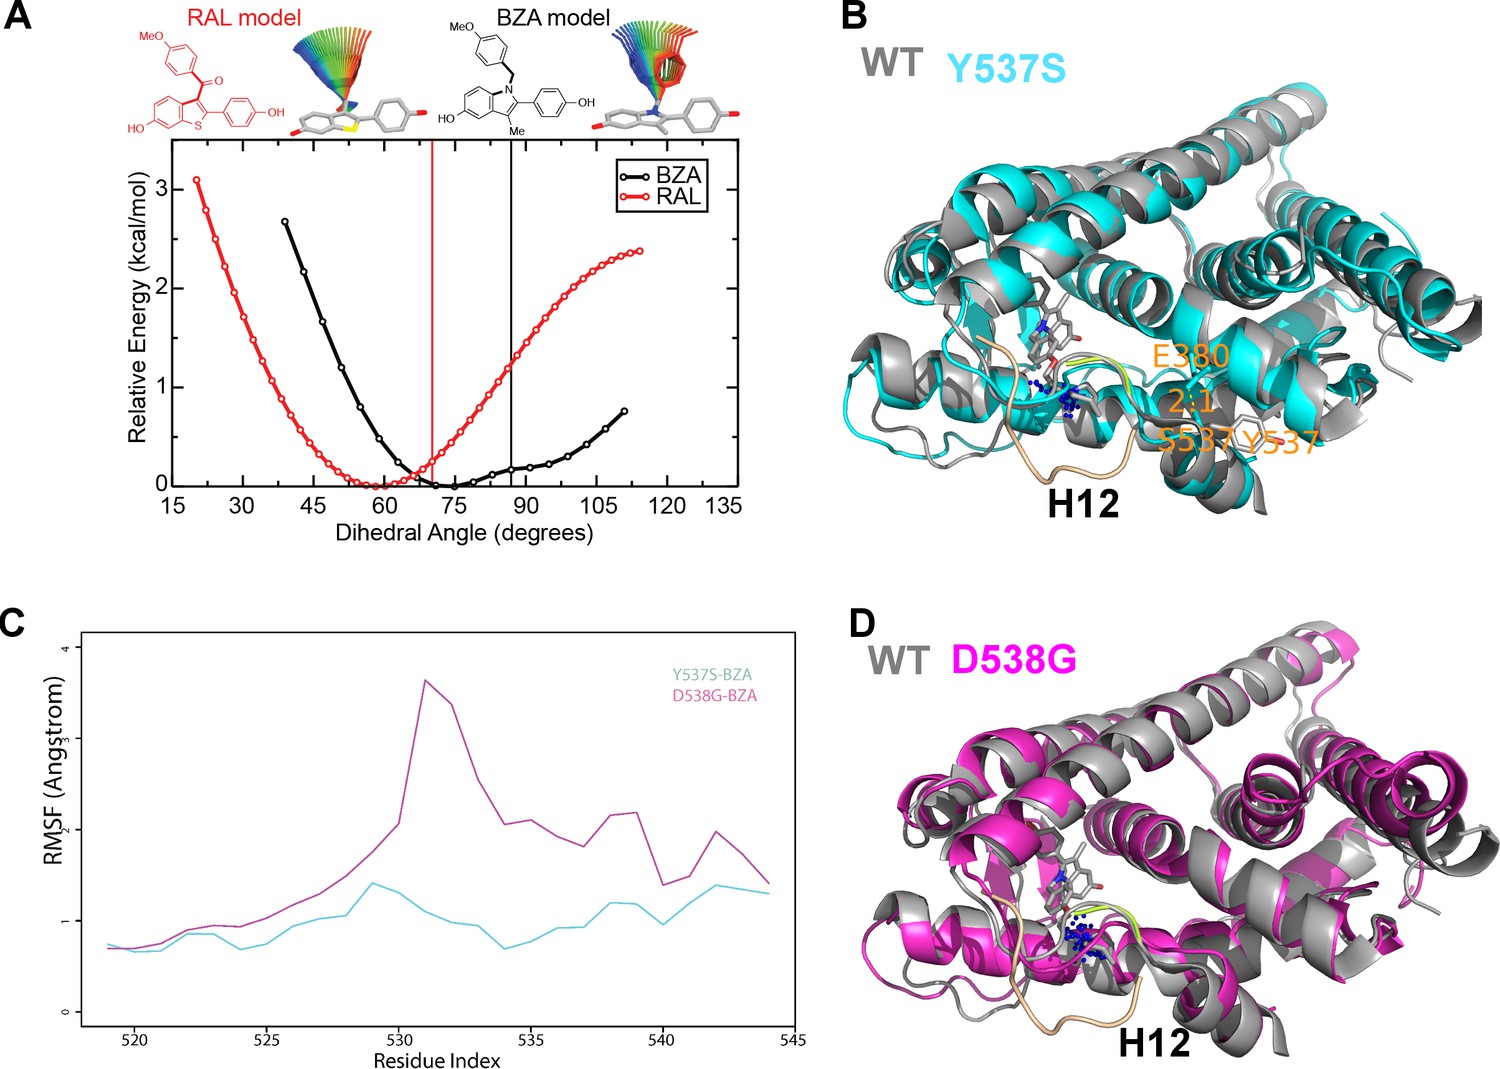
(A) QM scan of RAL and BZA arm torsion angle energetics.
(B) Overlaid representative calculated structure of Y537S-BZA (cyan) closest to the last 50-ns average from molecular dynamics (MD) simulation and the WT-BZA structure, vertical lines represent the ligand binding conformation in the X-ray crystal structure. Nitrogen atoms of the azepane part of BZA for the last 50-ns MD ensemble are shown in blue spheres near H12. Loop H11-12 is also shown for crystal structures of WT-4-OHT (wheat; PDB: 3ERT) and D538G-4-OHT (yellow; PDB: 4Q50). (C) Root mean squared fluctuations of ERα LBD residues, including the C-end of H11 (resi. 519–527), the loop H11-12 (resi. 528–535), and H12 (resi. 536–544), in the last 50-ns MD simulations for Y537S-BZA (cyan) and D538G-BZA (magenta). (D) Overlay of a representative structure of D538G-BZA (magenta) from MD simulations and the same WT-BZA structure (gray) as in (B).
Figure 8
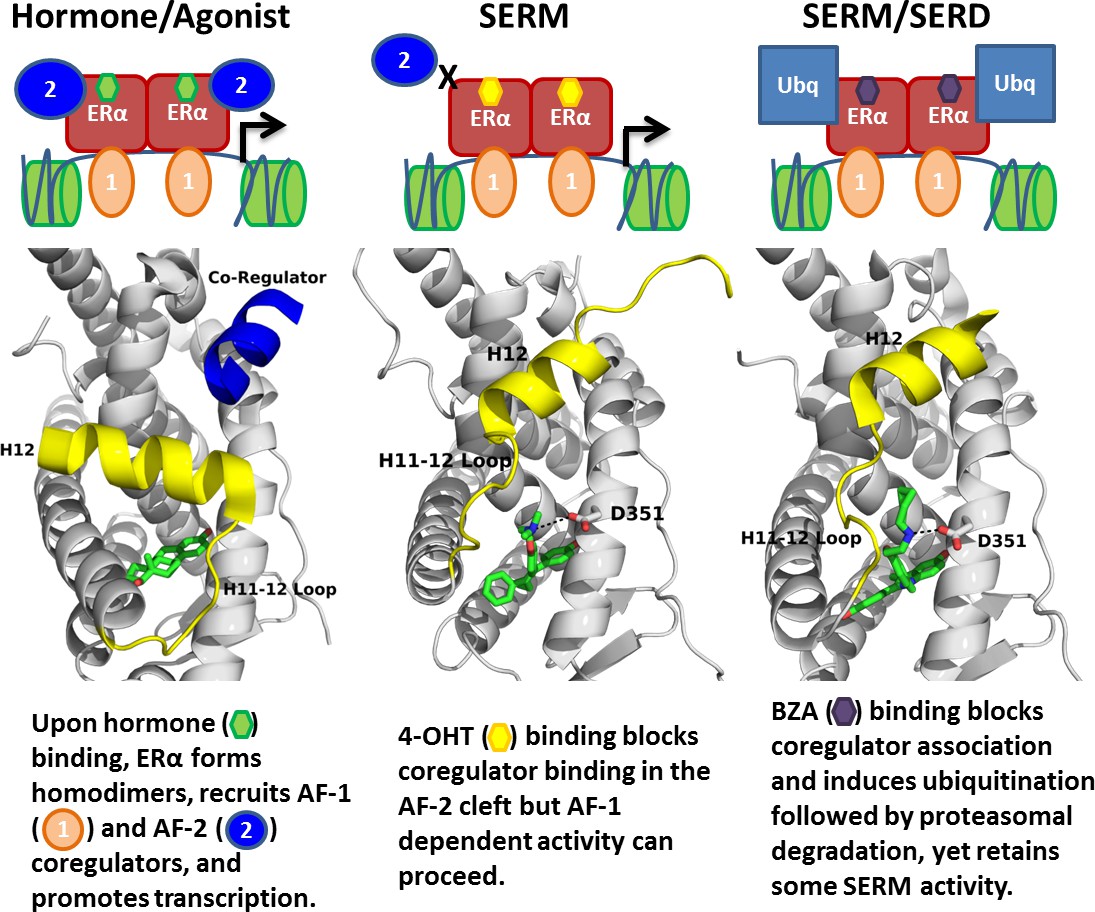
Summary of BZA’s SERM/SERD activity compared to SERMs and agonist compounds.
https://doi.org/10.7554/eLife.37161.016Tables
Table 1
Competitive inhibitors of estrogen receptor alpha.
https://doi.org/10.7554/eLife.37161.002| Antiestrogen | Class | Approved clinical indications |
|---|---|---|
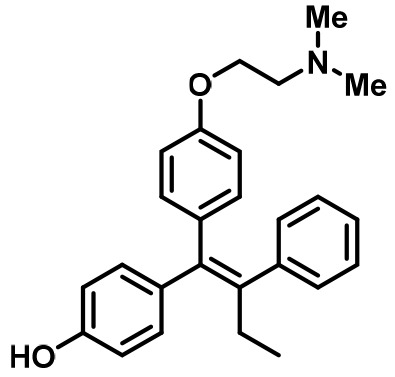 4-Hydroxytamoxifen (4-OHT) | SERM | • Adjuvant treatment for ER + breast cancers (Early Breast Cancer Trialists' Collaborative Group., 1998). • Metastatic Breast Cancer (Lipton, 1982). • Ductal Carcinoma in Situ (Allred et al., 2012). • Reduction in Breast Cancer Incidence in High Risk Women (Visvanathan, 2009). |
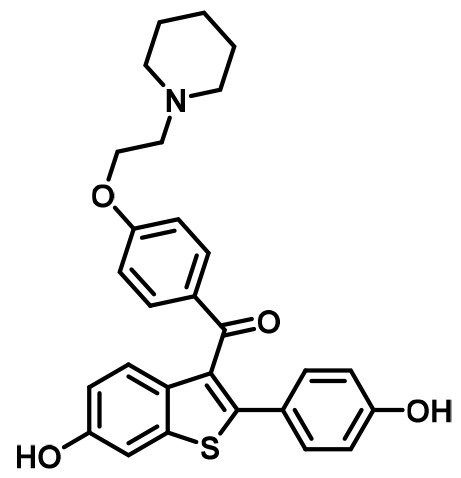 Raloxifene (RAL) | SERM | • Osteoporosis in postmenopausal women (Messalli and Scaffa, 2010). • Reduction in Breast Cancer Incidence in High Risk Women(Cauley et al., 2001). |
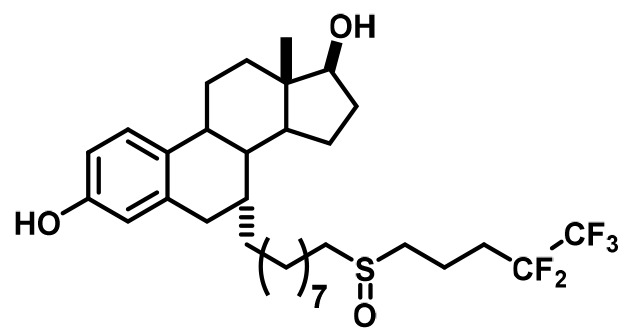 Fulvestrant (FULV) | SERD | • First-line therapy for metastatic breast cancer (Howell et al., 2004). • Postmenopausal women with progressive breast cancer following other antiestrogen therapy (Osborne et al., 2002; Howell et al., 2002). |
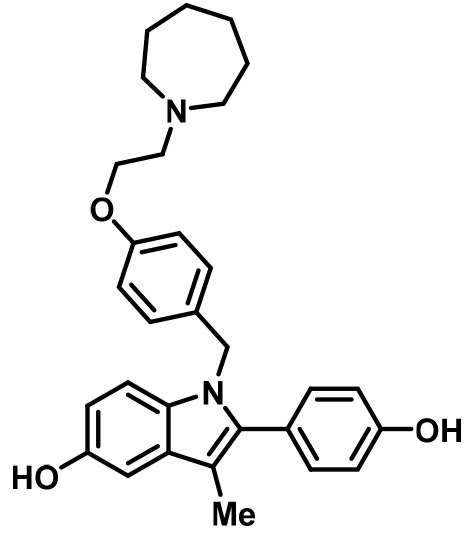 Bazedoxifene (BZA) | SERM/SERD | • In combination with conjugated equine estrogens (DUAVEE) to prevent postmenopausal osteoporosis (Tikoo and Gupta, 2015). |
Table 2
Ligand-binding affinities for WT, Y537S, and D538G mutant ERα LBD.
https://doi.org/10.7554/eLife.37161.018| Ligand/Mutant | Kd (nM)* | ||
|---|---|---|---|
| WT | Y537S | D538G | |
| E2‡ | 0.22 ± 0.11 | 1.40 ± 0.54 | 1.77 ± 0.66 |
| Ki (nM)† | |||
| 4-OHT‡ | 0.12 ± 0.003 | 2.64 ± 0.4 | 3.28 ± 0.7 |
| RAL | 0.30 ± 0.05 | 3.59 ± 1.0 | 3.77 ± 1.0 |
| BZA | 0.37 ± 0.01 | 3.50 ± 0.6 | 5.53 ± 0.7 |
| Fulvestrant‡ | 0.13 ± 0.03 | 3.68 ± 0.8 | 5.06 ± 1.2 |
-
* Measured directly by Scatchard Analysis using [3H]E2.
† Calculated using the Cheng-Prusoff equation from the IC50 values determined in a competitive radiometric binding analysis using [3H]E2 as a tracer.
-
‡Indicates previously published data (Fanning et al., 2016; Zhao et al., 2017).
Key resources table
| Reagent type (species) or resource | Designation | Source or reference | Identifier | RRID |
|---|---|---|---|---|
| Recombinant DNA reagent | Estrogen Receptor Alpha Ligand Binding Domain WT or Y537S | Fanning SW, Mayne CG, Dharmarajan V, Carlson KE, Martin TA, Novick SJ, Toy W, Green B, Panchamukhi S, Katzenellenbogen BS, Tajkhorshid E, Griffin PR, Shen Y, Chandarlapaty S, Katzenellenbogen JA, Greene GL. Estrogen receptor alpha somatic mutations Y537S and D538G confer breast cancer endocrine resistance by stabilizing the activating function-2 binding conformation. eLife. 2016;5:e12792. doi: 10.7554/eLife.12792. | ||
| Strain, strain background (Protein Expression) | E.coli BL21(DE3) | https://www.neb.com/products/c2527-bl21de3-competent-e-coli#Product%20Information | ||
| Cell line (Mammary Cells) | MCF7, MCF7 HA-Y537S, MCF7 HA-D538G, T47D, CAMA-1, ZR75-1, MDA-MB-361 | ATCC; this paper; this paper; ATCC; ATCC; ATCC; ATCC | ATCC HTB-22, ATCC HTB-23, ATCC HTB-21, ATCC CRL-1500, ATCC HTB-27 | CVCL_0031, CVCL_0553, CVCL_1115, CVCL_0588, CVCL_0620 |
| Antibody | anti-ERα antibody F10 | Santa Cruz Biotechnology | sc-8002 | AB_627558 |
| Antibody | anti-actin antibody | Santa Cruz Biotechnology | sc-69879 | AB_1119529 |
| Antibody | anti-HA antibody | Cell Signaling | C29F4 | AB_1549585 |
| Software | CCP4i | https://www.ccp4.ac.uk/ccp4i_main.php | SCR_007255 | |
| Software | VMD | https://www.ks.uiuc.edu/Research/vmd/ | SCR_004905 | |
| Software | Gaussion G09 | http://gaussian.com/ | SCR_014897 | |
| Software | GaussView | http://gaussian.com/ | SCR_014897 | |
| Software | HDX Workbench | http://hdxworkbench.com/ | ||
| Software | Bionavigator | PamGene | ||
| Commercial assay or kit | PamStation96 | PamGene | ||
| Commercial assay or kit | MycoAlert Mycoplasma Detection Kit | Lonza | LT07-518 | |
| Chemical compound, drug | protease inhibitor cocktail solution III | CalBiochem | 539134 | |
| Chemical compound, drug | 4-hydroxytamoxifen | Tocris | 3412 | |
| Chemical compound, drug | ICI 182–780 (fulvestrant) | Tocris | 1047/1 | |
| Chemical compound, drug | Raloxifene | Sigma- Aldrich | R1402 | |
| Chemical compound, drug | Estradiol | Sigma- Aldrich | E8875 |
Table 3
Crystallographic data collection and refinement statistics.
https://doi.org/10.7554/eLife.37161.017| ERα LBD-BZA | |
|---|---|
| Data Collection | |
| Space Group | P1 |
| a, b, c (Å) | 53.57, 59.17, 94.14 |
| α, β, γ (°) | 86.76, 75.36, 63.03 |
| Resolution Range | 50–2.49 |
| Number of Reflections | |
| (all/unique) | 63,978/29,080 |
| I/σ (highest resolution) | 1.35 |
| Rmerge | 8.0 |
| Completeness (%) | 97.6 |
| Redundancy | 2.2 |
| Refinement | |
| Rwork/Rfree | 21.1/29.3 |
| No. Residues/Chain | |
| ERα LBD D538G | 241 |
| GRIP Peptide | 0 |
| Water | 5 |
| Ligand | 1 |
| RMSD | |
| Bond lengths (Å) | 0.010 |
| Bond angles (°) | 1.575 |
| Chiral volume | 0.1016 |
| Ramachandran plot statistics | |
| Preferred number (%) | 837 (97.44%) |
| Additional allowed (%) | 18 (2.10%) |
| Outliers (%) | 4 (0.47%) |
Additional files
-
Transparent reporting form
- https://doi.org/10.7554/eLife.37161.019
Download links
A two-part list of links to download the article, or parts of the article, in various formats.
Downloads (link to download the article as PDF)
Open citations (links to open the citations from this article in various online reference manager services)
Cite this article (links to download the citations from this article in formats compatible with various reference manager tools)
The SERM/SERD bazedoxifene disrupts ESR1 helix 12 to overcome acquired hormone resistance in breast cancer cells
eLife 7:e37161.
https://doi.org/10.7554/eLife.37161


