MAPLE (modular automated platform for large-scale experiments), a robot for integrated organism-handling and phenotyping
- Harvard University, United States
- FlySorter LLC, United States
Figures
Figure 1 with 3 supplements
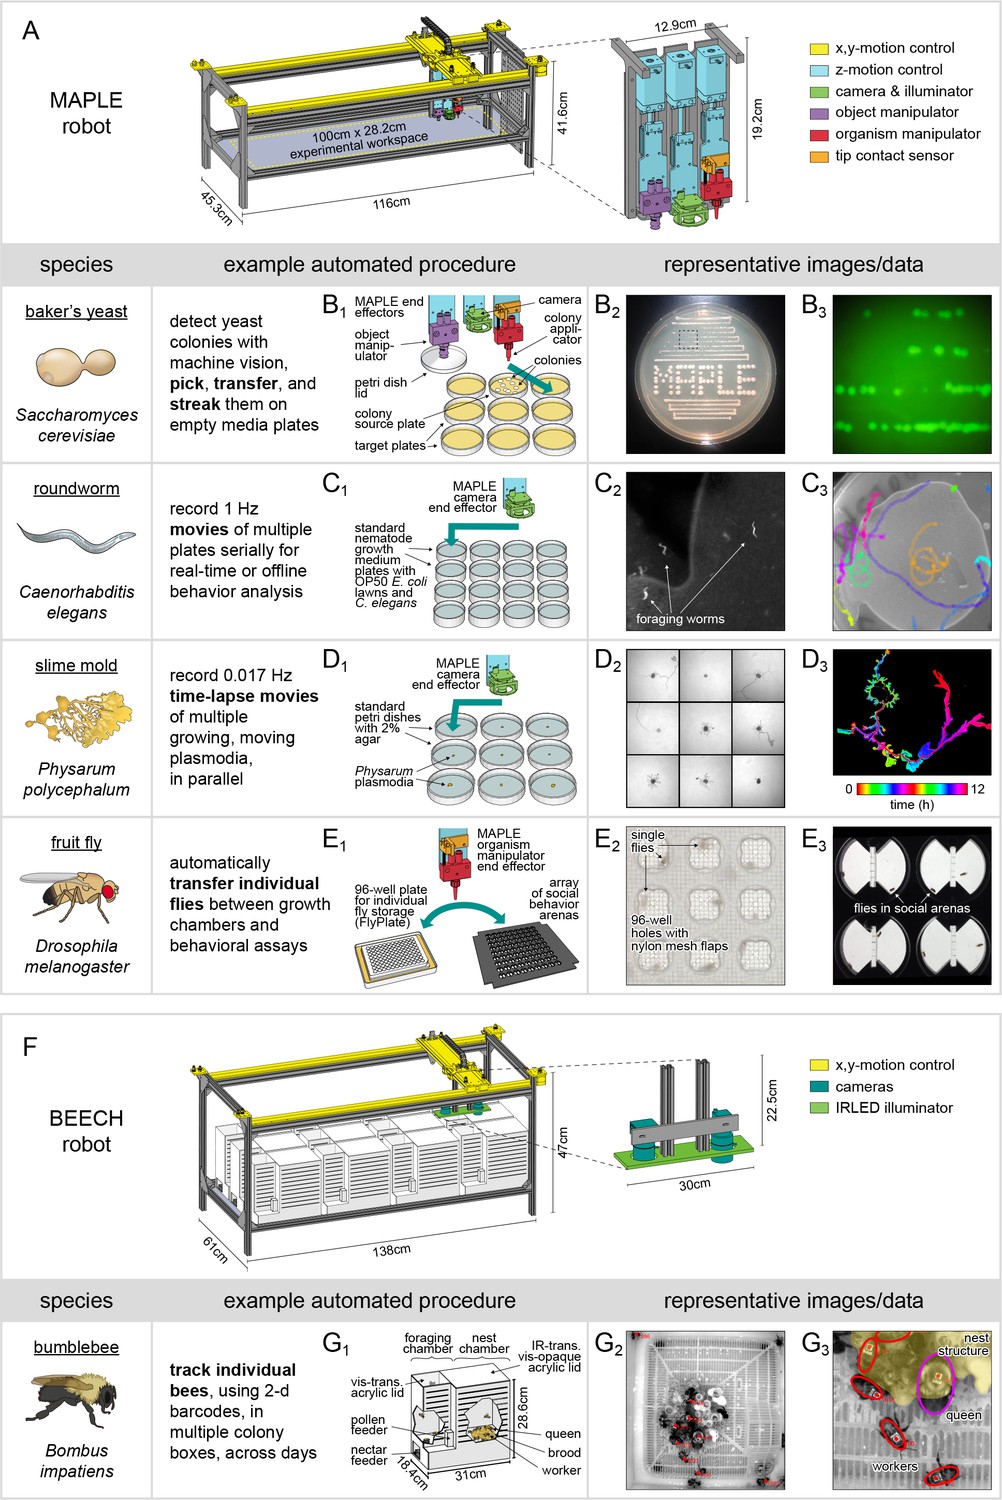
MAPLE, a robotic platform for conducting experiments with many species.
(A) Schematic of MAPLE with workspace dimensions indicated and an expanded schematic of the end effectors. Colors indicate different robotic systems. (B–F) Demonstrations of MAPLE experiments in yeast, C. elegans, Physarum polycephalum and fruit flies. (B1) Yeast colonies were automatically picked and transferred to fresh media plates in a pattern (B2), and then streaked to grow colonies from single cells (B2, B3). B3 is an image of GFP fluorescence in the colonies demarcated by the inset box of B2. (C1) Worm locomotion on standard culture plates with OP50 bacterial lawns was captured at 1 Hz using MAPLE’s camera effector. (C2) Cropped view of one such image showing individual worms. (C3) Tracks of multiple worm motion across a plate over 8.5 min, showing the field of view MAPLE’s camera and potential for motion phenotyping. (D1) Time-lapse movies of the movement of Physarum plasmodia were recorded in parallel for nine cultures at imaging rates of 0.017 Hz (one image/min) for 12 hr. (D2) Composite of plasmodia morphologies approximately 9.6 hr into the 12 hr recording. (D3) Time-coded image of the growth of a single plasmodium, overlaying images of the plasmodium over time in colors cycling over hues. (E1) Representative MAPLE procedure for moving fruit flies between a growth/storage module (left) and a phenotyping module (right) using the organism manipulator. (E2) Photo of flies in a FlyPlate single-housing storage module. See description below. (E3) Photo of flies in a social arena phenotyping module. See description below. (F) Bee Experimental Ethology Colony Hardware (BEECH): a MAPLE-derived robotic platform for imaging bumblebee behavior. BEECH was used to record bumblebee behavior in multiple colonies over long periods of time (up to 7 days). The end effectors of this robot were IR-sensitive cameras (right) for recording digital video of bees behaving. Bees were housed in acrylic colony boxes (G1) with a dark nest compartment and circadian-lit foraging compartment where they, respectively, reared developing young and collected nectar and pollen from feeders. (G2) Image acquired from the BEECH IR camera showing automatically tracked bees in the nest chamber. Inset box expanded in (G3) to illustrate workers (red ellipses), the queen (magenta ellipse), and nest structure (yellow overlay), all of which are tracked in BEECH data sets. This figure is also a target for an augmented reality view of MAPLE. Print the figure in portrait orientation on letter paper, place the printout on a horizontal surface like a bench or desk, and view it in scan mode in the ‘Augment’ mobile app to interact with a to-scale rendering of MAPLE.
Figure 1—figure supplement 1
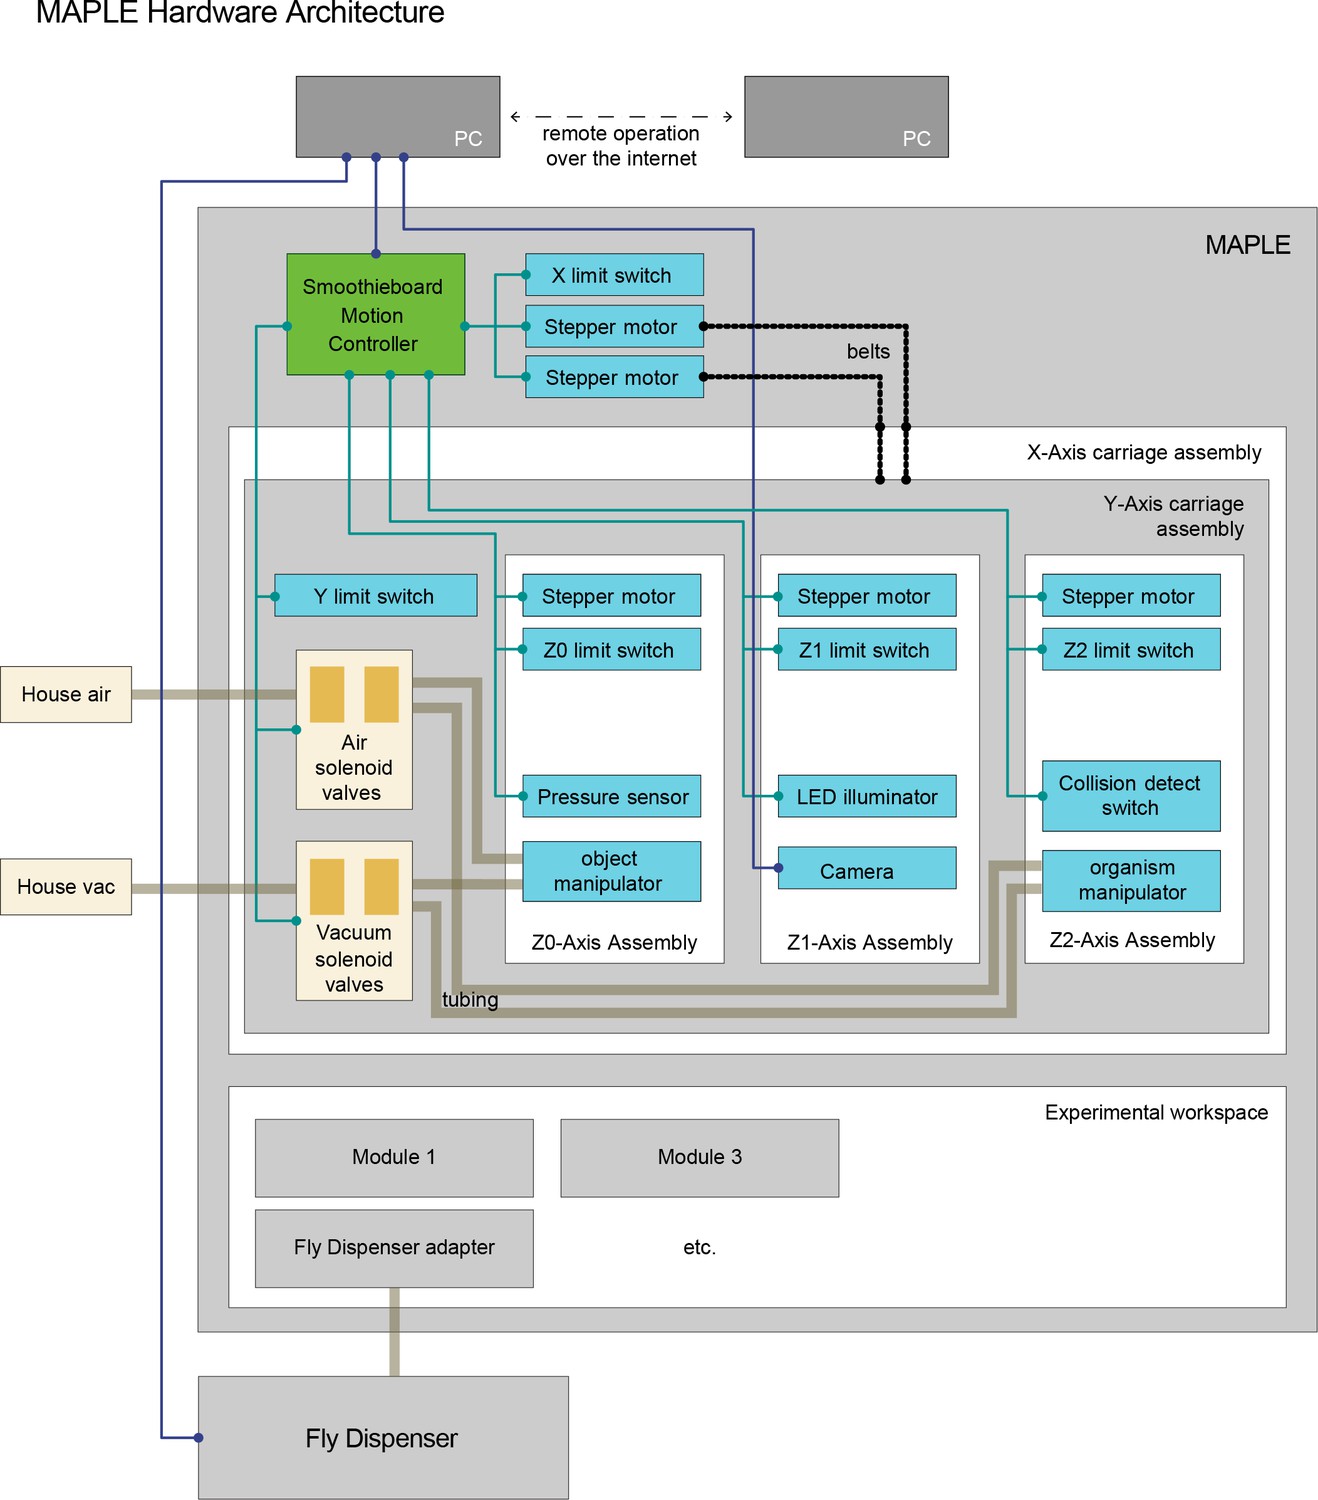
MAPLE hardware architecture.
MAPLE has two major components. First, animal-handling is mediated by a five-axis Cartesian robot with three end effectors on independent z-axes. Two of these, the object manipulator and the organism manipulator use pneumatics to manipulate module components like lids and individual flies, respectively. Secondly, handled animals move through an experimental workspace which contains reconfigurable experimental modules, and can interface with devices outside of MAPLE, e.g., the Fly Dispenser, using adapter modules.
Figure 1—figure supplement 2
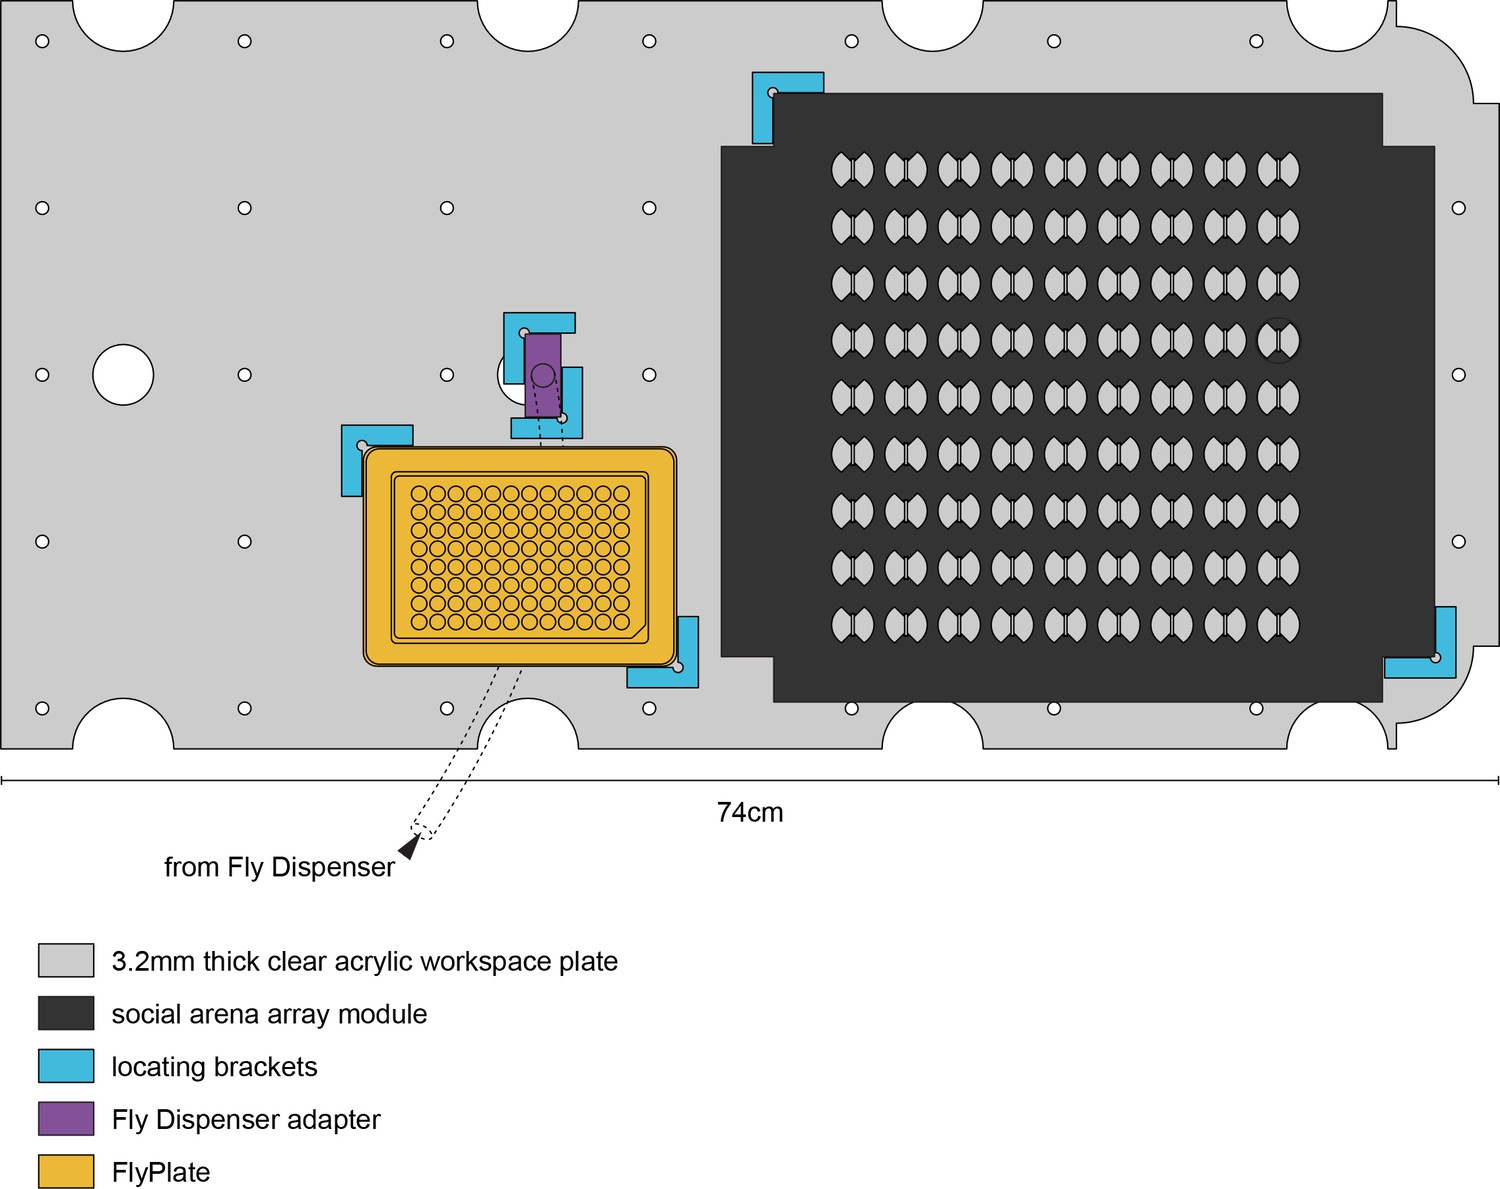
MAPLE experimental workspace.
To-scale illustration of the MAPLE experimental workspace.The workspace plate contains cable pass-throughs (large circular cutouts) and evenly spaced peg holes for registering it with the MAPLE floor and frame. This example workspace is configured for a social arena array experiment, wherein flies can be brought into MAPLE from the Fly Dispenser, through the Fly Dispenser adapter, into the FlyPlate, into the social arena array for behavioral phenotyping, and then potentially back into the FlyPlate, as we did in the longitudinal social interaction network persistence experiments (Figure 5G–J).
Figure 1—figure supplement 3
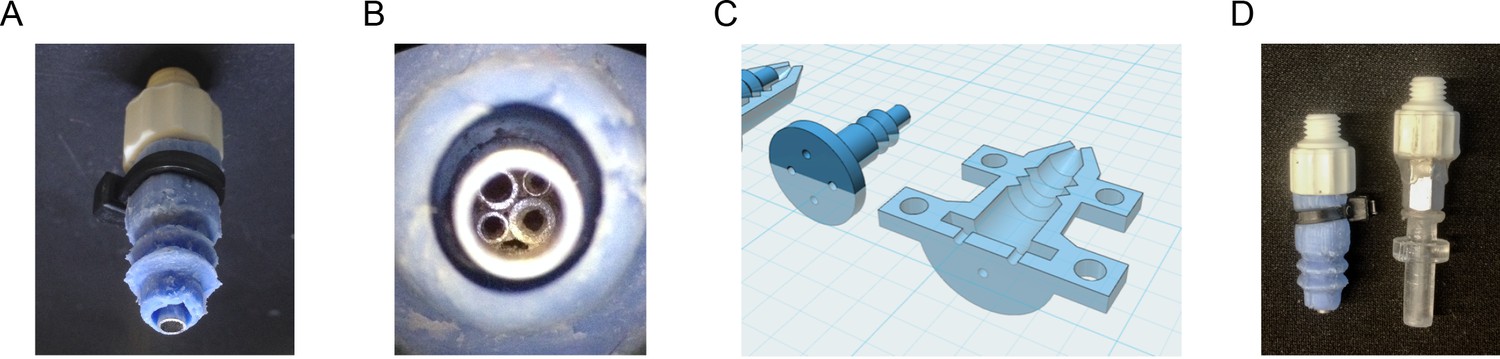
Details of the fly vacuum tip for the organism manipulator.
(A) Close-up photograph of the fly tip for the organism manipulator end effector, showing the luer socket fitting (white), pneumatic opening (steel, bottom) and bellows-style silicone cuff, which provides a better seal against multi-position loading ports or FlyPlate well tops for more effective removal of flies in compartments (blue). (B) Macro view of the pneumatic opening, showing small diameter tubes inserted into the fly tip to provide a surface against which flies being sucked into the tip are caught, without greatly impeding airflow. (C) CAD models of the 3D-printed mold that was used to make the silicone cuff. (D) Photo of the fly vacuum tip and the yeast wooden applicator vacuum tip used to hold applicators for transferring yeast colonies.
Figure 2 with 1 supplement
Behavior of flies manipulated by MAPLE is similar to manual controls.
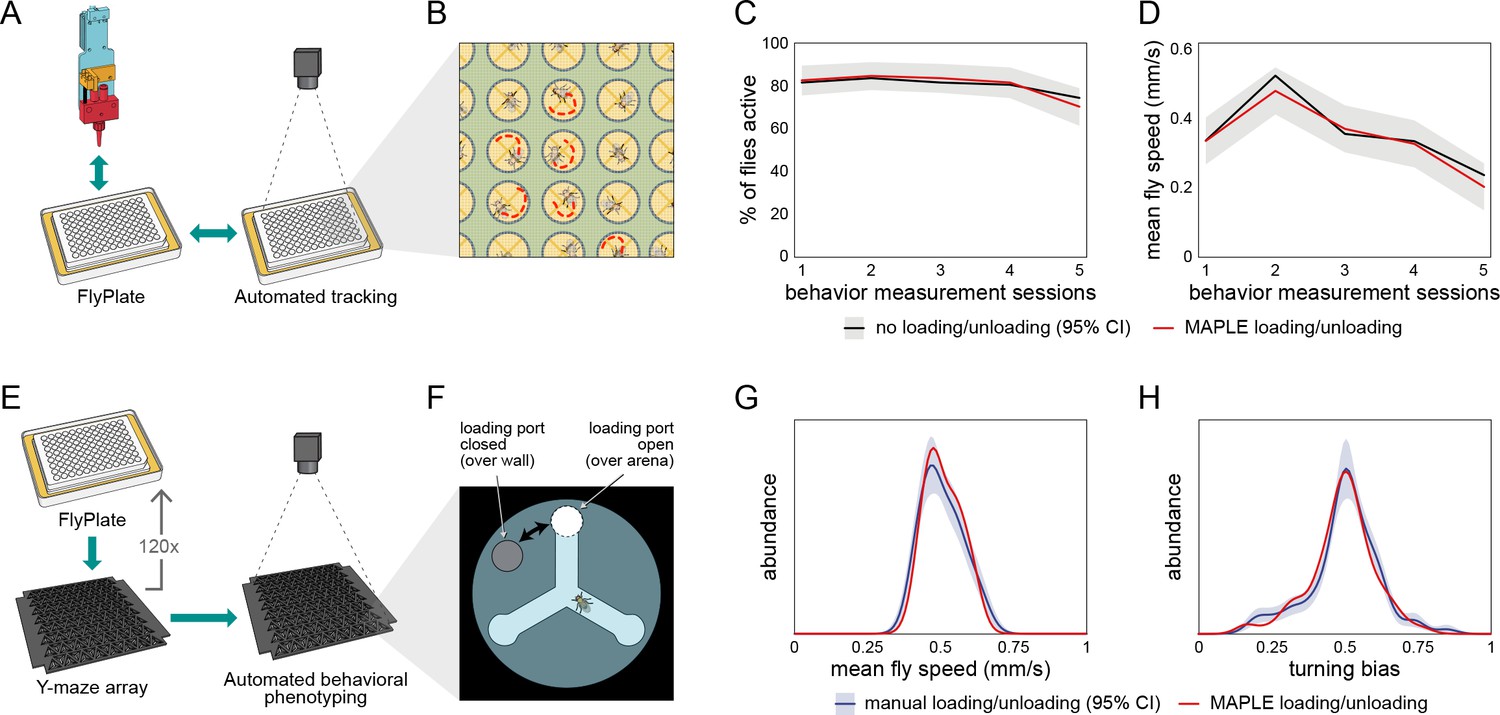
(A) Diagram of repeated MAPLE handling procedure. Flies were removed from and replaced back into wells of a FlyPlate using MAPLE’s organism manipulator. In between these handling events their activity was assessed by automated tracking. (B) Illustration of automatic tracking of flies in a FlyPlate through the nylon mesh covering the wells. (C) Percentage of flies exhibiting supra-threshold activity (mean speed >0.1 mm/s) across handling sessions. Red line is MAPLE-handled flies, black line is matched unhandled flies. Gray area denotes 95% CI around unhandled flies. (D) Fly mean speed across handling sessions. (E) Illustration of MAPLE-assisted handedness phenotyping procedure. (F) Y-maze arena adapted for MAPLE use with a multi-position loading port allowing the deposition of awake flies into the behavioral arena. The hole in the rotatable lid can be aligned to the arena to load or unload flies, or to the wall surrounding the arena to trap flies in. (G) Distribution of fly mean speeds in MAPLE and manually loaded experiments. Distributions shown are kernel density estimates (KDEs). Gray area is 95% CI around manually loaded flies as estimated by bootstrap resampling of KDEs. (H) Distributions of fly turning bias (# right turns / # total turns) in MAPLE and manually loaded experiments.
Figure 2—figure supplement 1
MAPLE- versus manual-handling in the social arena.
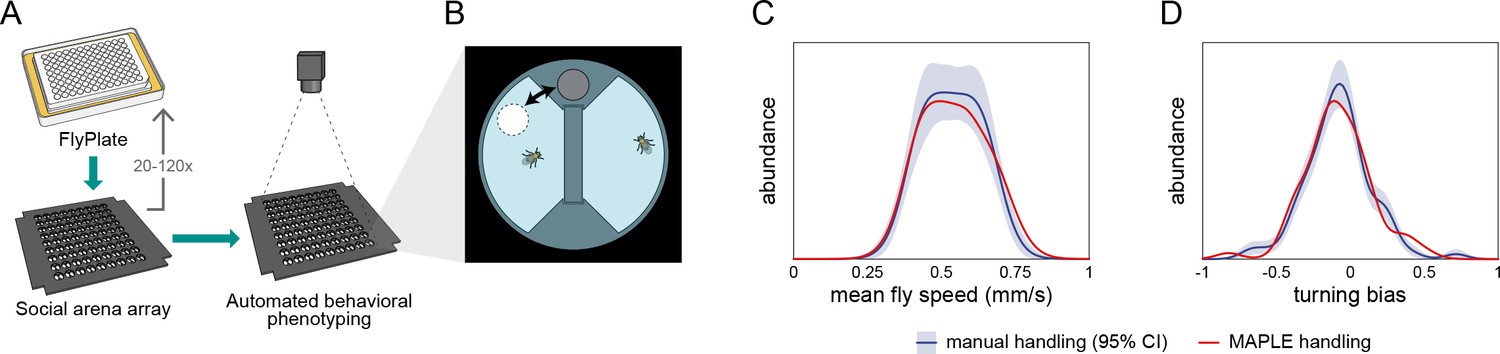
(A) Experimental procedure by which MAPLE-loaded flies from a FlyPlate into a social arena array for automated behavioral phenotyping in a back-lit imaging box. (B) Flies were inserted into behavioral arenas via multi-position loading ports. (C) The distribution of mean fly walking speeds in these arenas was statistically indistinguishable between MAPLE- and manually handled flies. p=0.99 by KS-test. Distributions are estimated by KDE. Red indicates MAPLE-handled flies. Dark blue is manually handled flies; light blue area is the 95% CI of the manually-handled KDE as determined by bootstrap resampling. (D) The distribution of mean fly circling biases (tendency to turn clockwise or counterclockwise in their respective semi-circular arena compartment) was statistically indistinguishable between MAPLE- and manually handled flies, p=0.99 by KS-test. The circling bias metric was defined as µ score (Buchanan et al., 2015), which measures the average circumferential component of motion, with −1 indicating purely clockwise motion,+1 purely counterclockwise, and 0 equal portions clockwise and counterclockwise motion or inward/outward motion. Colors as in (C).
Figure 3 with 3 supplements
An ecosystem of MAPLE hardware modules for flexible experimental automation in fruit flies.
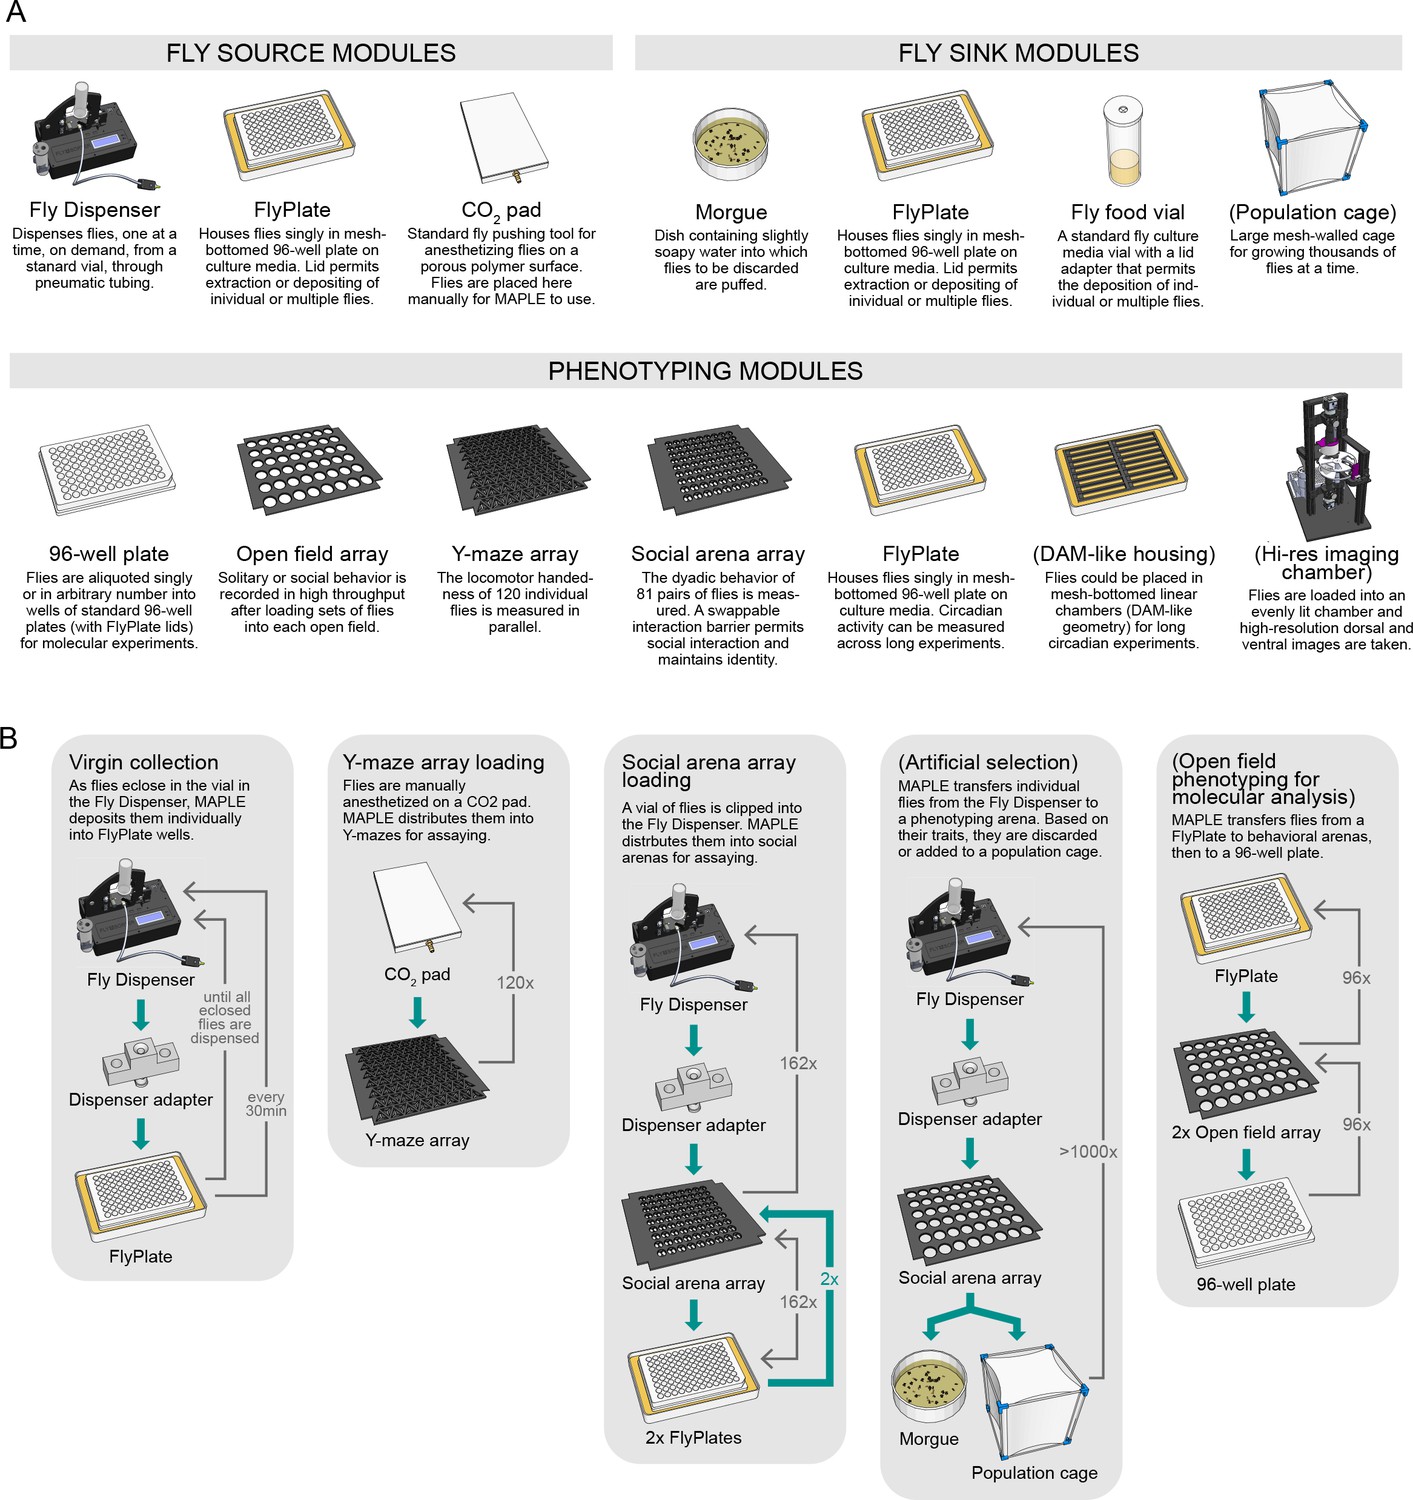
(A) Illustrations and brief descriptions of experimental MAPLE modules. Fly source modules can provide flies into the MAPLE system. Fly sink modules can receive flies. Phenotyping modules are used to collect experimental measurements. See Materials and methods for more extensive descriptions. Modules with names in (parentheses) are under development. (B) Simplified flowcharts illustrating a selection of tasks MAPLE is capable of performing using different combinations of modules. Green arrows indicate the flow of animals through the task, thin grey arrows the motion of the MAPLE end effectors. Tasks with names in (parentheses) are hypothetical and illustrate the scope of possibilities.
Figure 3—figure supplement 1
Multi-position loading ports.
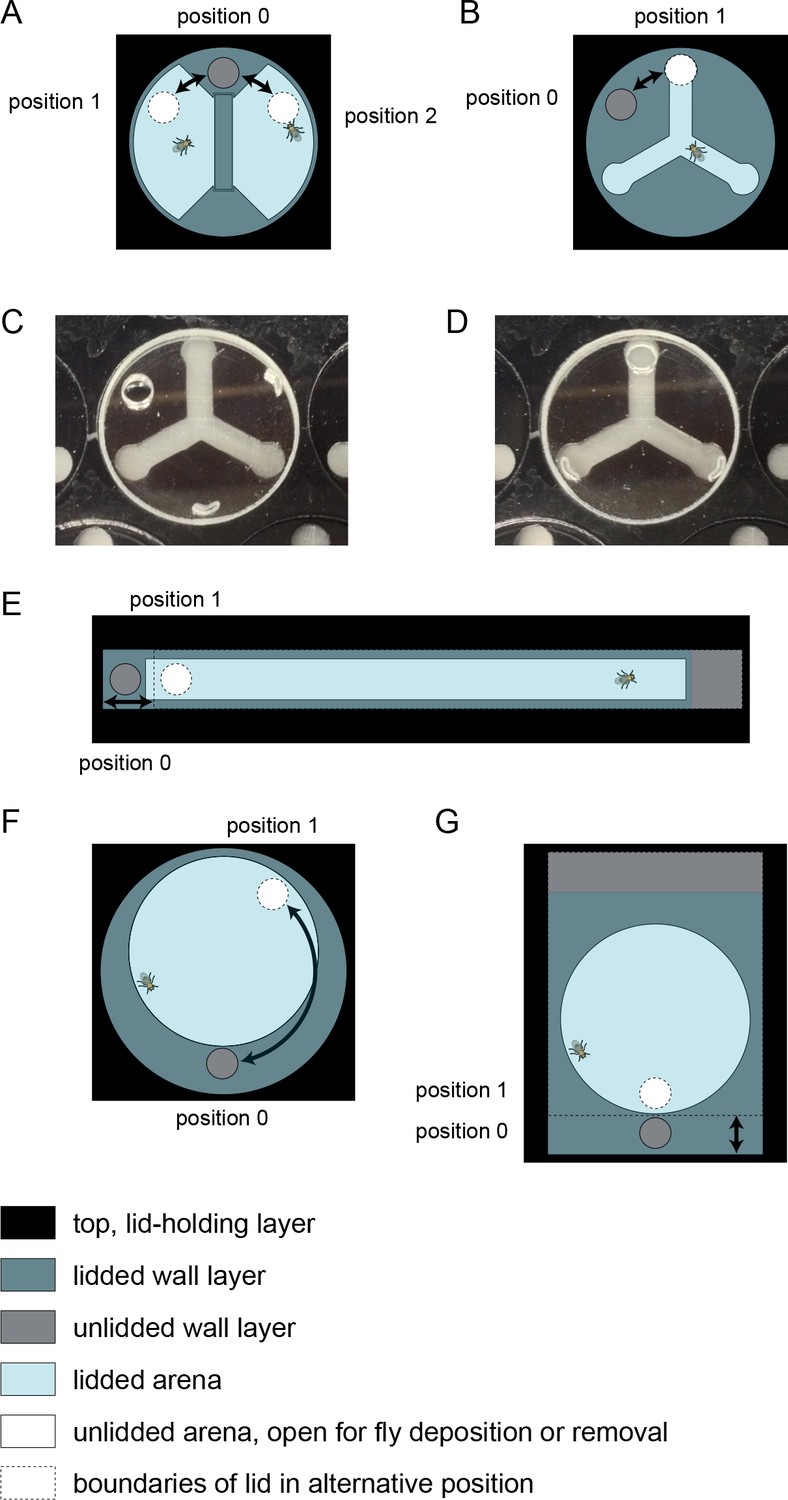
Illustrations of arena lids that can be rotated or slid to position an opening over a behavioral arena, or over a portion of inaccessible wall, corresponding to configurations that are, respectively, open or closed for MAPLE loading or unloading. Arenas are shown for different experimental geometries: (A) social arena, (B) Y-maze arena, (E) linear (Drosophila Activity Monitor style) arena, (F) circular arena with rotating multi-position loading port, and (G) circular arena with linearly sliding multi-position loading port. (C,D) Photos of a Y-maze with its loading port rotated over the walls, closed to the loading or unloading of flies (C) or over the arena and open to the loading or unloading of flies (D).
Figure 3—figure supplement 2
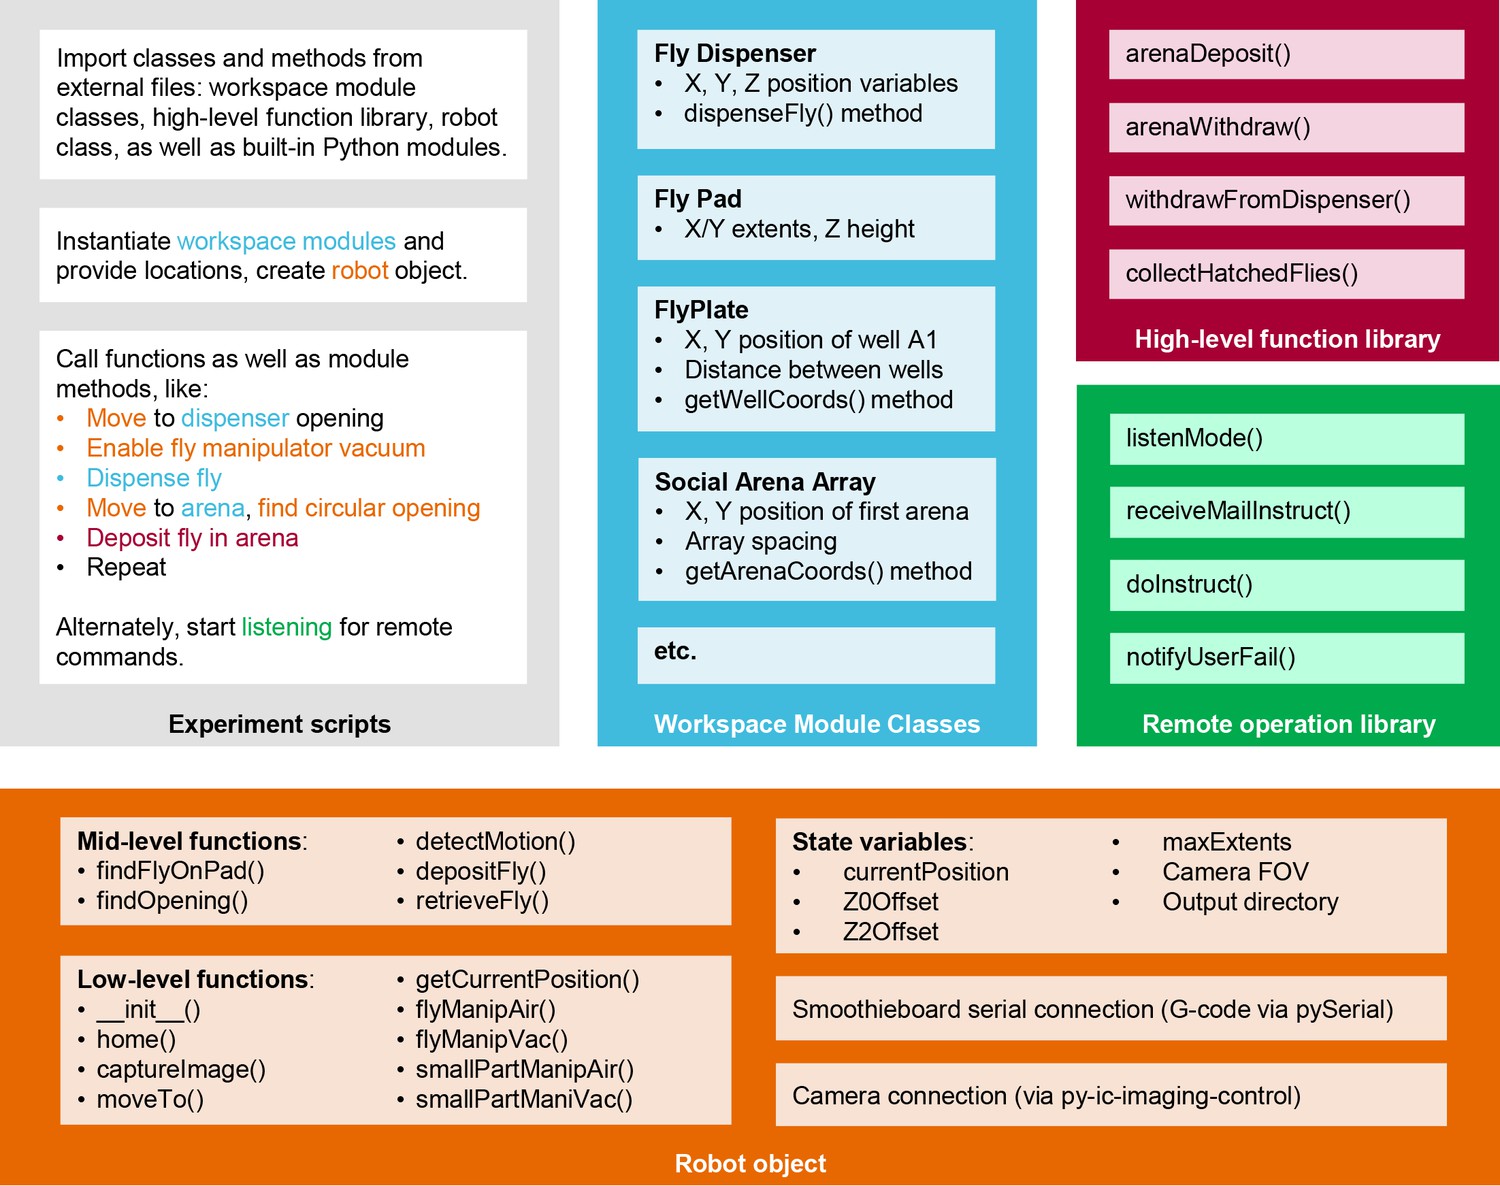
MAPLE software architecture.
Schematic of the organization of MAPLE software into experimental scripts, module class files, a high-level function library, a remote operation library, and the robot object which harbors functions for low-level robot operations. The generic experiment script indicates with color how each of these file types is called to generate a useful MAPLE procedure.
Figure 3—figure supplement 3
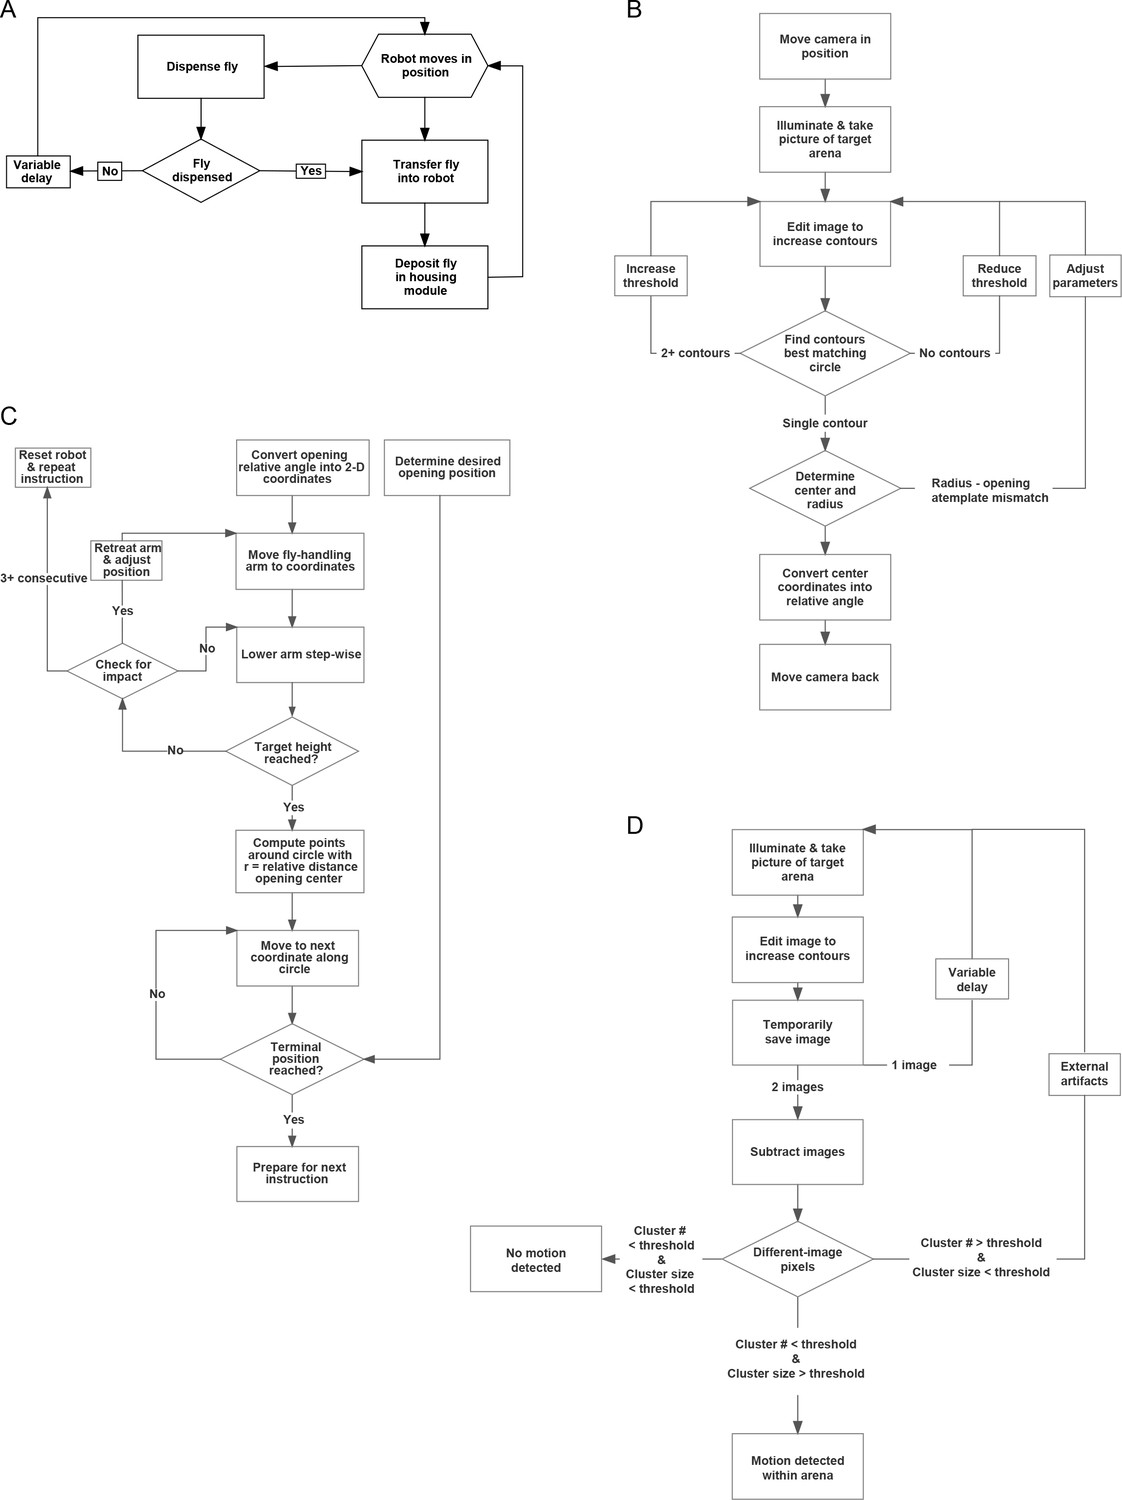
MAPLE procedure flowcharts.
(A) Flowchart for a high-level MAPLE experimental procedure, the collecting of virgin females in a FlyPlate from the Fly Dispenser. High-level functions such as this one depend on lower-level procedures, such as those illustrated in subsequent panels. (B) Flowchart for detecting the opening of multi-position loading ports (Figure 3—figure supplement 1) using machine vision. (C) Flowchart for using the fly manipulator end effector to put a multi-position loading port into the open configuration. (D) Flowchart for using the camera end effector to detect if there is a moving fly within a behavioral arena.
Figure 4 with 1 supplement

MAPLE performance at collecting virgin female flies for genetic crosses.
(A) Diagram of modules and procedure employed in MAPLE virgin-collecting. (B) Comparison of cumulative number of virgin females collected versus manual labor time required in MAPLE and conventional manual virgining procedures. Dotted lines indicate the maximum potential virgins that might have been collected in each approach. Thus the difference between the dotted and solid line indicates females that were ‘lost’ and not retained as virgins.
Figure 4—figure supplement 1
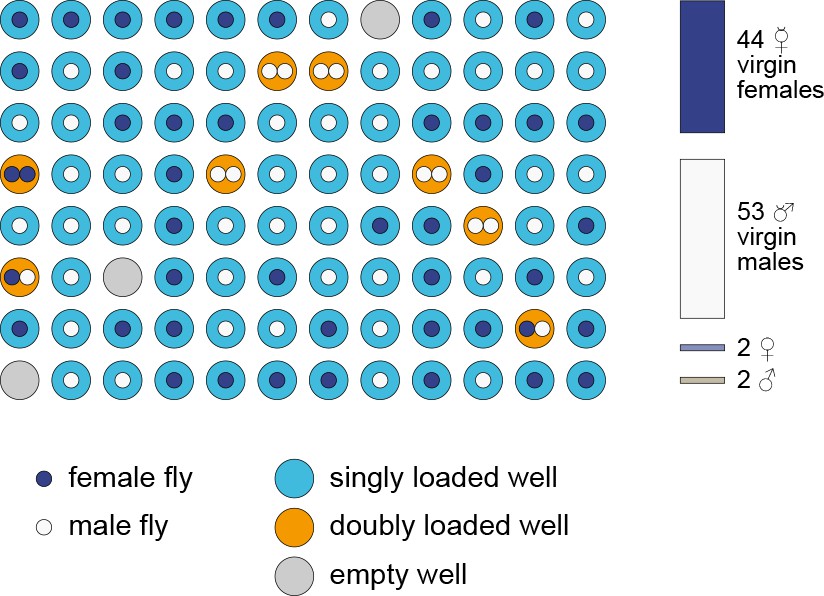
Outcome of a virgin-collecting experiment.
Representative illustration of the contents of the wells of a full FlyPlate after 3 days of virgin collecting. Outer circle color indicates the number of flies loaded. Inner circles indicate the sex of deposited flies. Stacked bars at right indicate the number of flies isolated by sex and virgin status.
Figure 5 with 2 supplements
Persistent fly social networks measured using MAPLE.
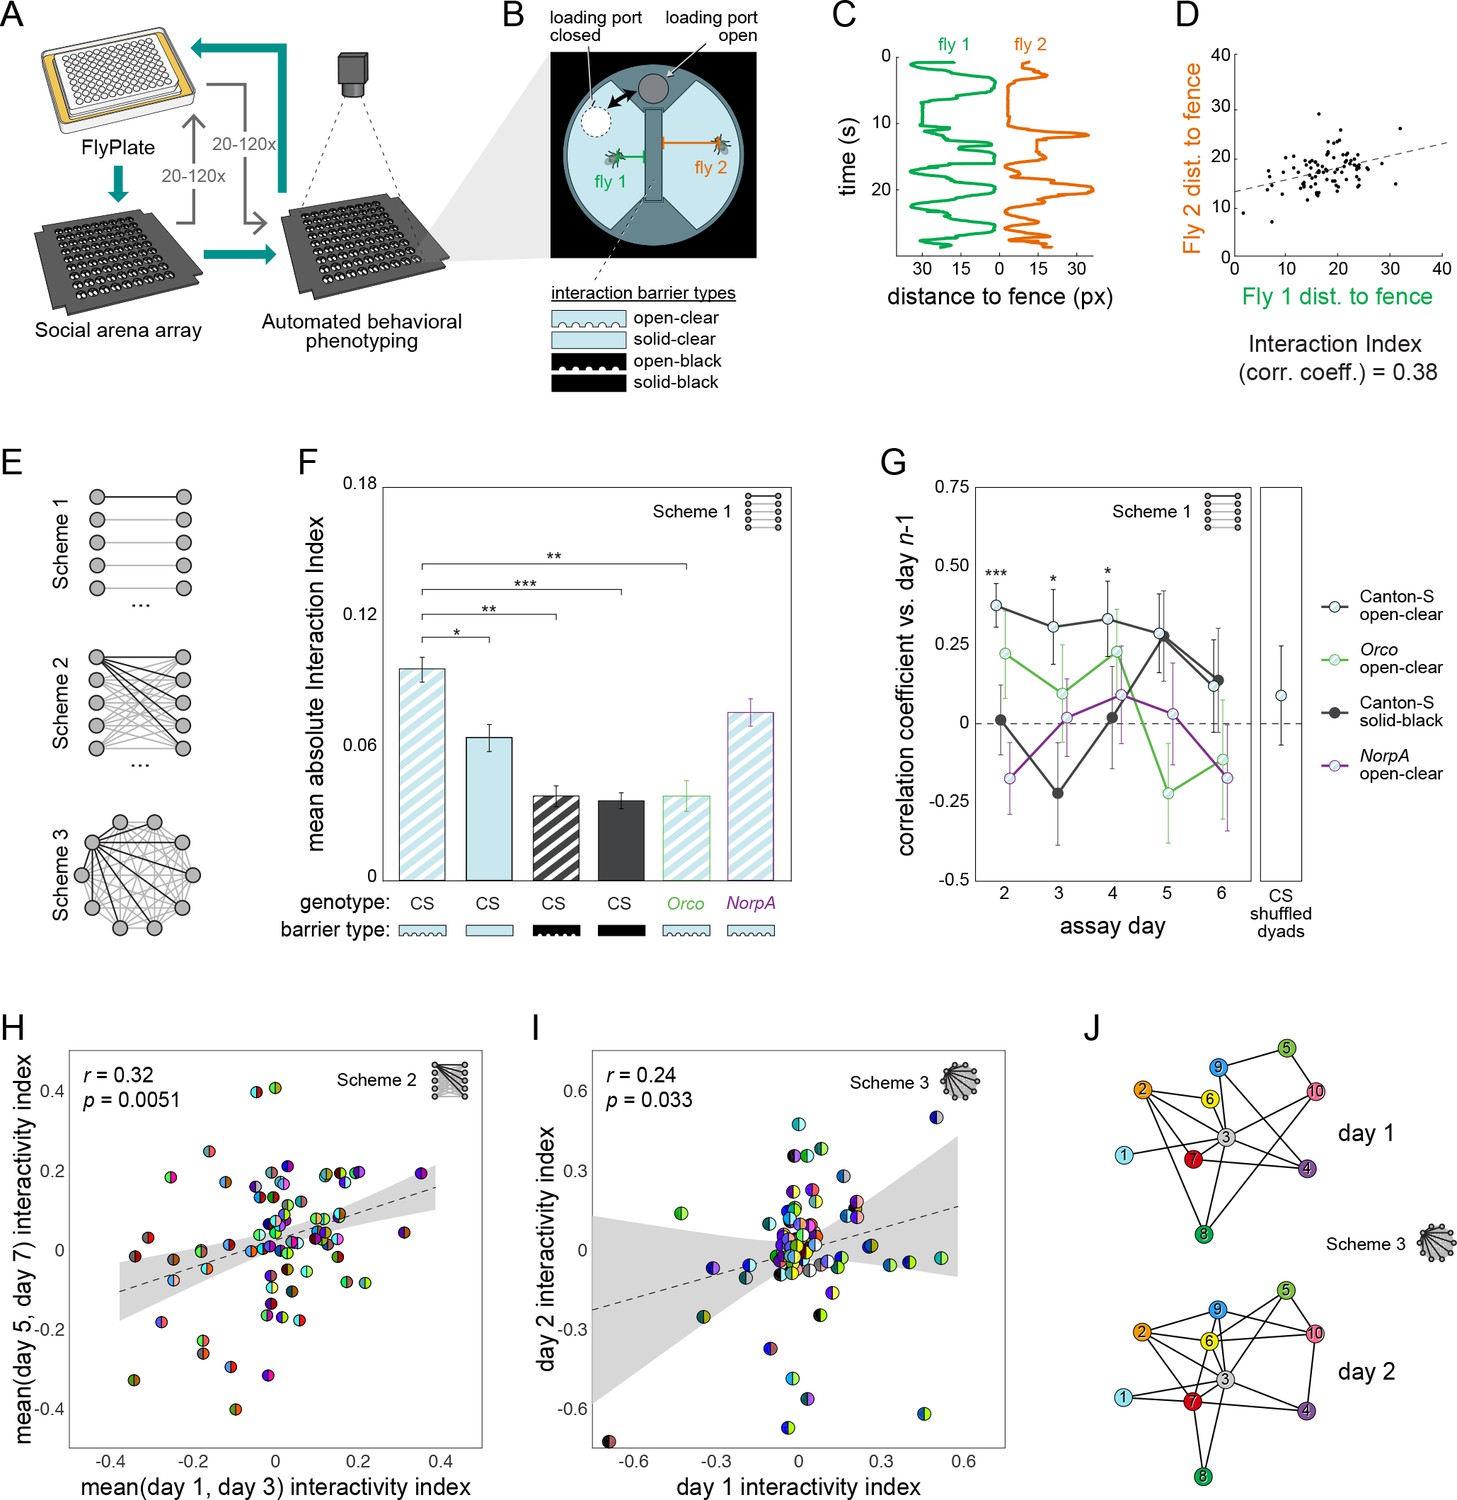
(A) Diagram of MAPLE-assisted social interaction behavior phenotyping procedure. (B) Schematic of one of 81 social arenas including interchangeable interaction barrier types (shown in side-on view to illustrate the channels along the bottom of some barriers that permit airflow). A multi-position loading port allows flies to be loaded or removed from either compartment independently. (C) Individual flies’ distances to the interaction barrier over time in an example session. Colors correspond to distances illustrated in (B). (D) An example dyad interactivity index, calculated as the correlation between individual flies’ interaction barrier distances. (E) Diagram of pairing schemes employed to form dyads. (F) Mean absolute interactivity indices across interaction barrier types and genotypes. Dyads were formed according to scheme 1. Patterns denote barrier type, outline colors denote genotype. Error bars correspond to ±1 SEM. Mean absolute interactivity indices differ significantly across conditions, F(7, 853)=13.42, p<0.001. Asterisks indicate pair-wise comparisons that are significant by t-test. *: significance at ɑ = 0.05; **: significance at ɑ = 0.01; ***: significance at ɑ = 0.001. (G) Pearson correlation coefficient between dyad interactivity indices measured on successive days, over 6 days. Dyads were formed according to scheme 1. Point patterns denote barrier type, line colors denote genotype. Error bars correspond to ±1 SEM. Asterisks denote significant two-tailed z-tests. (H) Scatter plot of interactivity indices of Canton-S (wild type) flies in arenas with open-clear barriers from measurements made across 2- to 4-day intervals. Dyads were formed according to scheme 2. Gray area is 95% CI of the linear regression line. Circles represent dyads; semi-circles denote individual flies forming a dyad; colors denote fly identity. Pearson correlation coefficient is statistically significant, r(99) = 0.32, p=0.005. N: 99 dyads, 20 flies. (I) As in (H) for two groups of 10 virgin female Canton-S forming 45 dyads each according to scheme 3 and tested on successive days, r(78) = 0.24, p=0.034. (J) Visualization of a Social Interaction Network (SIN) of 10 Canton-S (45 dyads) in arenas with open-clear barriers. Connections denote dyads exhibiting absolute interactivity index values greater than the average of the absolute values of the 1st and 4th quartiles (threshold: 0.031). Threshold was identical for day 2. Colors and numbers indicate fly identity on both days.
Figure 5—figure supplement 1
Interactivity index controls.
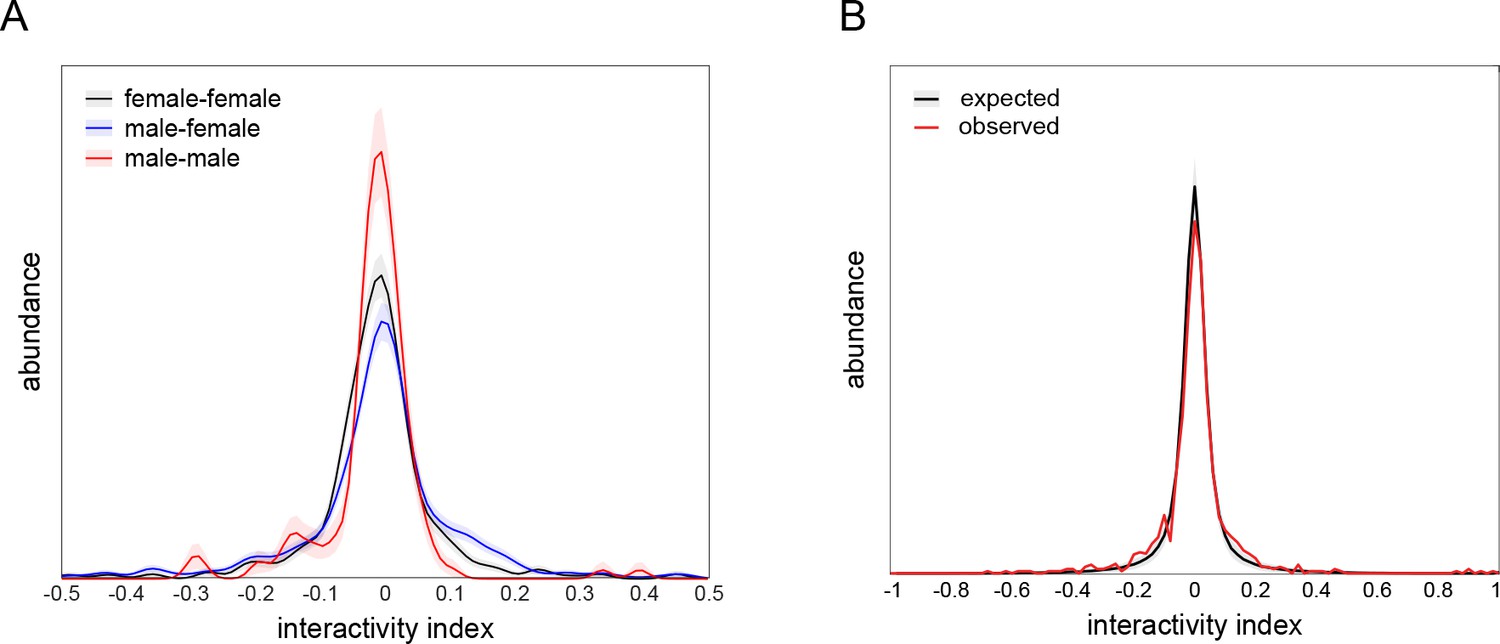
(A) Interactivity index distributions of female-female (black), male-female (blue), and male-male (red) dyad compositions, visualized using kernel density estimation. Female-female distribution is not significantly different from male-female (p=0.66 by KS-test) or male-male (p=0.14 by KS-test) distributions. Male-female distribution is significantly different from male-male distribution (p=0.0094 by KS-test). Distributions comprise 396, 474, and 132 dyads, respectively. Shaded regions indicate ±1 standard error of the distribution estimate as determined by bootstrap resampling. (B) Observed (black) and expected (red) distributions of interactivity index from male-female and female-female dyads (n = 870). The overdispersion of the observed distribution (standard deviation = 0.13) over the expected distribution (standard deviation = 0.096) indicates that dyads are exhibiting more strongly positive or negative interactivity indices than expected under the null hypothesis in which interactions between dyad partners are independent (F = 37.3, p<0.0001 by Levene’s test; p<0.0001 by KS-test; p<0.0001 by χ2 test of variance). This null hypothesis was simulated in a resampling procedure by shuffling dyad partner identity and recomputing the interactivity index. Shaded region indicates ±1 standard error of the distribution estimate as determined by bootstrap resampling. Observed distribution comprises 870 dyads. Bootstrapped shuffled dyad distribution was resampled 1000 times.
Figure 5—figure supplement 2
Social interactions and their persistence as measured by the coincidence index metric.
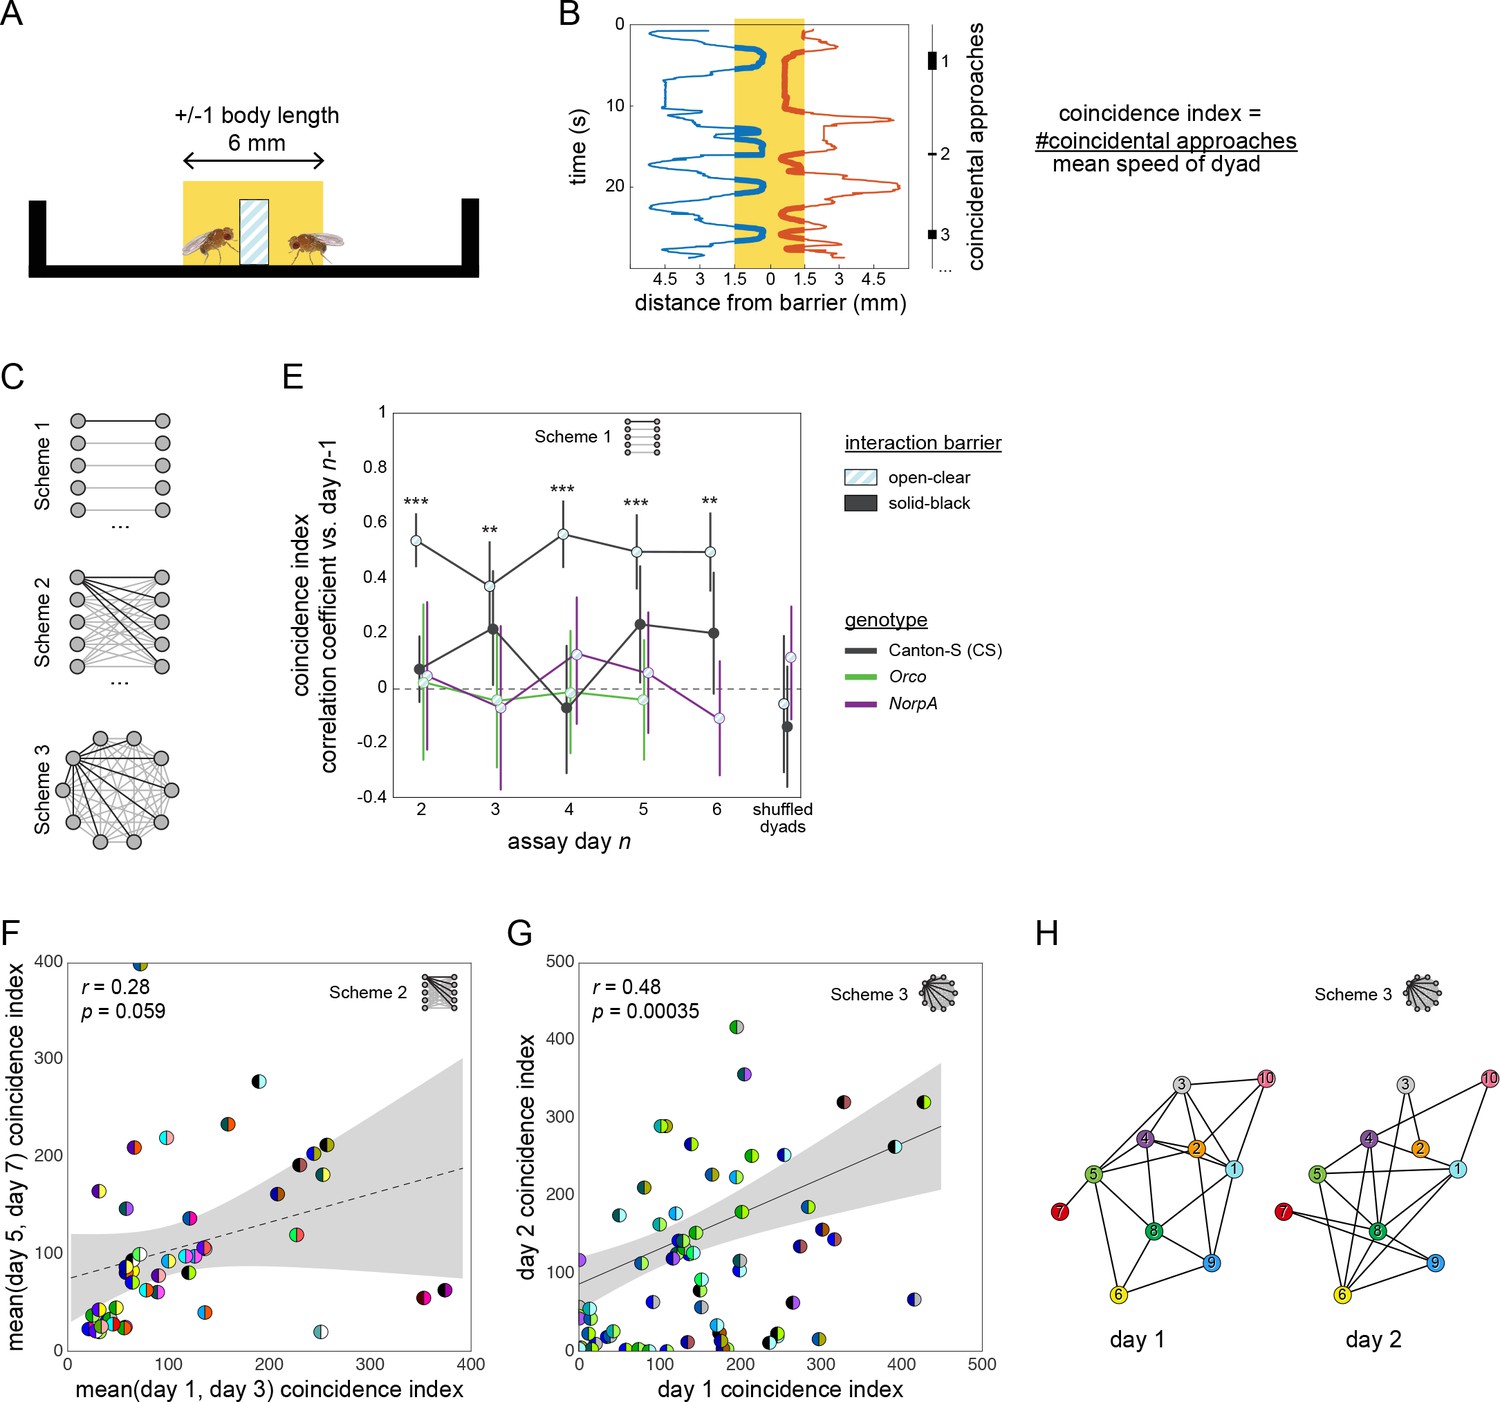
(A) Schematic side view of a social arena showing in yellow the zone in which flies are scored as being at the barrier. (B) Position (x-axis) vs time (y-axis) of two flies interacting in a dyad. Thick lines indicate timepoints when the flies are in the at-barrier-zone (yellow). Black bars at right indicate intervals in which both flies are at the barrier. Each of these intervals represents one ‘coincidental encounter’. Coincidence index is defined as the number of coincidental encounters normalized for average dyad speed. (C) Diagram of pairing schemes employed to form dyads. (D) Pearson correlation coefficient between dyad coincidence indices measured on successive days, over 6 days. Dyads were formed according to scheme 1. Point patterns denote barrier type, line colors denote genotype. Error bars correspond to ±1 SEM. Asterisks denote significant one-sample two-tailed z-tests. (E) Scatter plot of coincidence index of Canton-S (wild type) flies in arenas with open-clear barriers from measurements made across 2- to 4-day intervals. Dyads were formed according to scheme 2. Gray area is 95% CI of the linear regression line. Circles represent dyads; semi-circles denote individual flies forming a dyad; colors denote fly identity. Pearson correlation coefficient is not statistically significant, r(45) = 0.28, p=0.059. (F) As in (E) for two groups of 10 Canton-S flies forming 45 possible dyads each according to scheme three and tested on successive days, r(68) = 0.48, p=0.00035. (G) Visualization of a Social Interaction Network (SIN) of 10 Canton-S flies (45 dyads) in arenas with open-clear barriers. Connections denote dyads exhibiting coincidence indices greater than the average values of the 1st and 4th quartiles (threshold: 223). Threshold was identical for day 2. Colors and numbers indicate fly identity on both days.
Videos
Video 1
MAPLE in use.
MAPLE is situated on a standard experimental bench. The user controls its behavior through an attached PC. Real-time video shows that MAPLE moves at speeds similar to human fly experimentalists.
Video 2
Motion VR view from within MAPLE during an experimental procedure.
Time-lapse view from a wide-angle camera mounted on the x-axis assembly of MAPLE during a procedure to move flies from a 96-well plate into social arenas, providing a clear view of the action of all three z-assemblies and end effectors. Moments when MAPLE flashes multiple times successively in the same position reflect an algorithm to vary the exposure time for image acquisition to detect the opening of a multi-position loading port. This video is available on YouTube at https://youtu.be/wxEgbYfif_M. The viewing angle can be adjusted during playback in the YouTube viewer.
Video 3
MAPLE can operate autonomously.
Wide-angle movie acquired by mounting the camera on the y-assembly as MAPLE conducts a social arena array loading procedure. After starting the protocol, confirming that the camera stays attached and trimming some zip-tie tails from the camera mount, the operator walks away while MAPLE continues the experiment.
Video 4
Transferring yeast colonies with MAPLE.
Real-time video showing MAPLE load an applicator stick in its organism manipulator, pick a colony from a source plate, transfer those cells to a target plate in a known pattern, repeat this procedure for additional single colonies from the source plate, and finish by streaking out the last transferred colony.
Video 5
C. elegans worms foraging on growth plates.
MAPLE collected 1 Hz video at 1944 × 2592 px resolution of worms foraging on a standard growth plate with a lawn of OP50 E. coli. Worm positions were recorded manually in Fiji, and the track overlays were added in MATLAB. Movie frames acquired at 1 Hz and played back at 30 fps.
Video 6
MAPLE collecting images for time-lapse movies of Physarum growth.
Real-time video of MAPLE traveling between plates of 2% agar inoculated with Physarum plasmodia, and taking an image of each plate at a rate of 1 image/min. MAPLE thus collected time-lapse movies (Video 7) of all the plasmodia in parallel.
Video 7
Time-lapse movies of Physarum plasmodial growth and movement .
Movie frames acquired at 0.017 Hz and played back at 30fps, covering a recording period of 12 hr. Movies show outgrowth followed by exploratory motion growth as well as rhythmic cytosolic pumping.
Video 8
Motion VR view from within a bumblebee colony in BEECH.
Wide-angle movie acquired by mounting the camera inside a bumblebee colony box and placing into the BEECH platform for imaging. BEEtag spatial barcodes are visible on the backs of individual bees. Once BEECH begins to move, its camera and IR illuminator effectors periodically come into view above the nest chamber (e.g. at 3:05); in this movie, the normally visible-opaque next chamber roof has been replaced with clear acrylic. This video is available on YouTube at https://youtu.be/crIb4ZfecYQ. The viewing angle can be adjusted during playback in the YouTube viewer.
Video 9
BEECH recording behavior of multiple bumblebee colonies.
Timelapse of a real BEECH experiment in which the camera end effectors are moved between bumble bee colony boxes to record brief videos in each successively.
Video 10
MAPLE-assisted virgin-collecting procedure.
Animation illustrating the MAPLE procedure for efficiently collecting virgin female flies. See also Figure 4.
Video 11
Motion VR view from the MAPLE workspace floor.
Time-lapse view from a wide-angle camera mounted on MAPLE’s experimental workspace plate during a procedure to move flies from a 96-well plate into social arenas. Moments when MAPLE flashes multiple times successively in the same position reflect an algorithm to vary the exposure time for image acquisition to detect the opening of a multi-position loading port. This video is available on YouTube at https://youtu.be/F9KdnkGfkhI. The viewing angle can be adjusted during playback in the YouTube viewer.
Video 12
Fly behavior in social arena assay.
Six social arenas are seen with a fly loaded into each of the 12 semicircular compartments. These compartments are separated by open-clear barriers which are made of clear acrylic with horizontal channels allowing flies to both see and smell each other.
Additional files
-
Supplementary file 1
MAPLE bill of materials.
Spreadsheet listing MAPLE’s components, parts numbers, vendor links, and fabrication techniques.
- https://doi.org/10.7554/eLife.37166.030
-
Supplementary file 2
MAPLE Build Instructions.
Document outlining the steps to assemble MAPLE from parts, including frame, rails, effectors, control electronics, wiring and plumbing. Some maintenance information is included, as well as software instructions to test MAPLE’s basic functionality and communication protocols.
- https://doi.org/10.7554/eLife.37166.031
-
Transparent reporting form
- https://doi.org/10.7554/eLife.37166.032
Download links
A two-part list of links to download the article, or parts of the article, in various formats.
Downloads (link to download the article as PDF)
Open citations (links to open the citations from this article in various online reference manager services)
Cite this article (links to download the citations from this article in formats compatible with various reference manager tools)
MAPLE (modular automated platform for large-scale experiments), a robot for integrated organism-handling and phenotyping
eLife 7:e37166.
https://doi.org/10.7554/eLife.37166


