A selective gut bacterial bile salt hydrolase alters host metabolism
- Harvard Medical School, United States
- Brigham and Women’s Hospital, United States
Figures
Figure 1
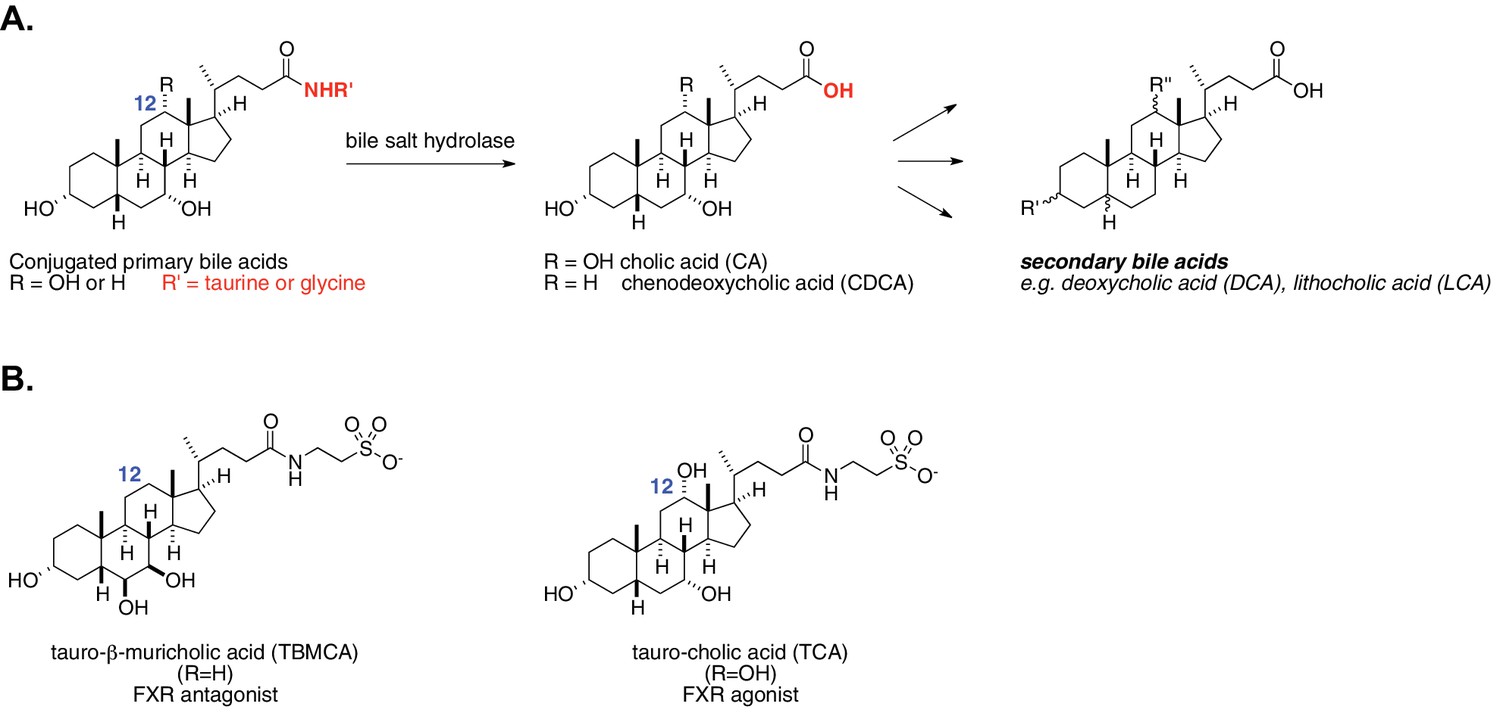
Enzymatic activity of gut bacterial bile salt hydrolase (BSH) enzymes.
(A) BSH cleave the amide bond linking primary bile acids to taurine or glycine. (B) Structures of the two most abundant murine-conjugated bile acids, tauro-β-muricholic acid (TβMCA) and tauro-cholic acid (TCA).
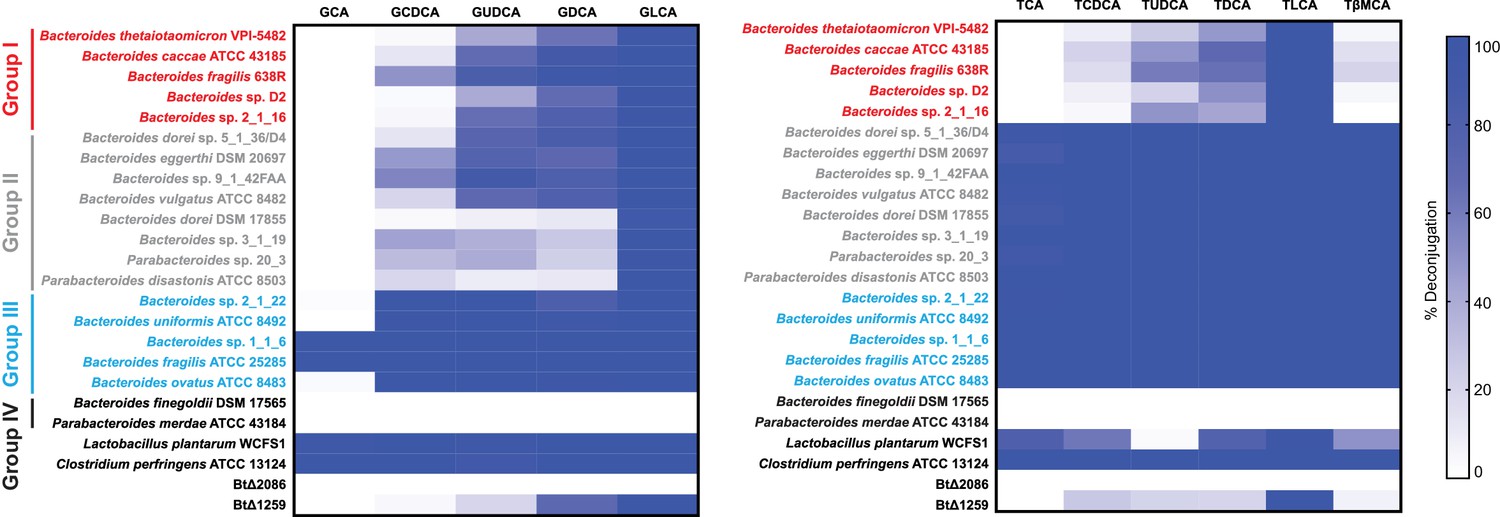
Figure 2 with 3 supplements

Identification of selective BSH activity in the human gut bacterial phylum Bacteroidetes.
(A) Deconjugation ability of twenty prevalent Bacteroidetes strains and two Firmicutes strains found in the human gut represented as heat maps. Individual strains were incubated for 48 hr total with a group of glyco- or tauro-conjugated bile acids found in human and murine GI tracts. G (glyco-), T (tauro-), CA (cholic acid), CDCA (chenodeoxycholic acid), UDCA (ursodeoxycholic acid), DCA (deoxycholic acid), LCA (lithocholic acid), βMCA (β-muricholic acid). Assays were performed in biological duplicate. Group I (red): Bacteroidetes species that deconjugate primary bile acids based on steroidal core structure (C12 = H but not C12 = OH); Group II (gray): species that deconjugate based on amino acid conjugate; Group III (blue): species that deconjugate all bile acid substrates; Group IV (black): no deconjugation observed. (B) Representative UPLC-MS timecourses for deconjugation of TDCA and TLCA showing that steady state has been reached by 48 hr. (C) Representative UPLC-MS traces showing that Bacteroides thetaiotaomicron wild-type (Bt WT) and BtΔ1259 deconjugate TUDCA, whereas BtΔ2086 does not. BtΔ2086,2086 + recovered the deconjugation function while the BtΔ2086,CTRL +control strain containing an empty pNBU2 vector did not, demonstrating that BT2086 is responsible for bile salt hydrolase activity in Bt. (D) Representative UPLC-MS traces showing that Bt WT deconjugates the murine primary bile acid TβMCA but not TCA, whereas BTΔ2086 (Bt KO) does not deconjugate either bile acid.
Figure 2—figure supplement 1
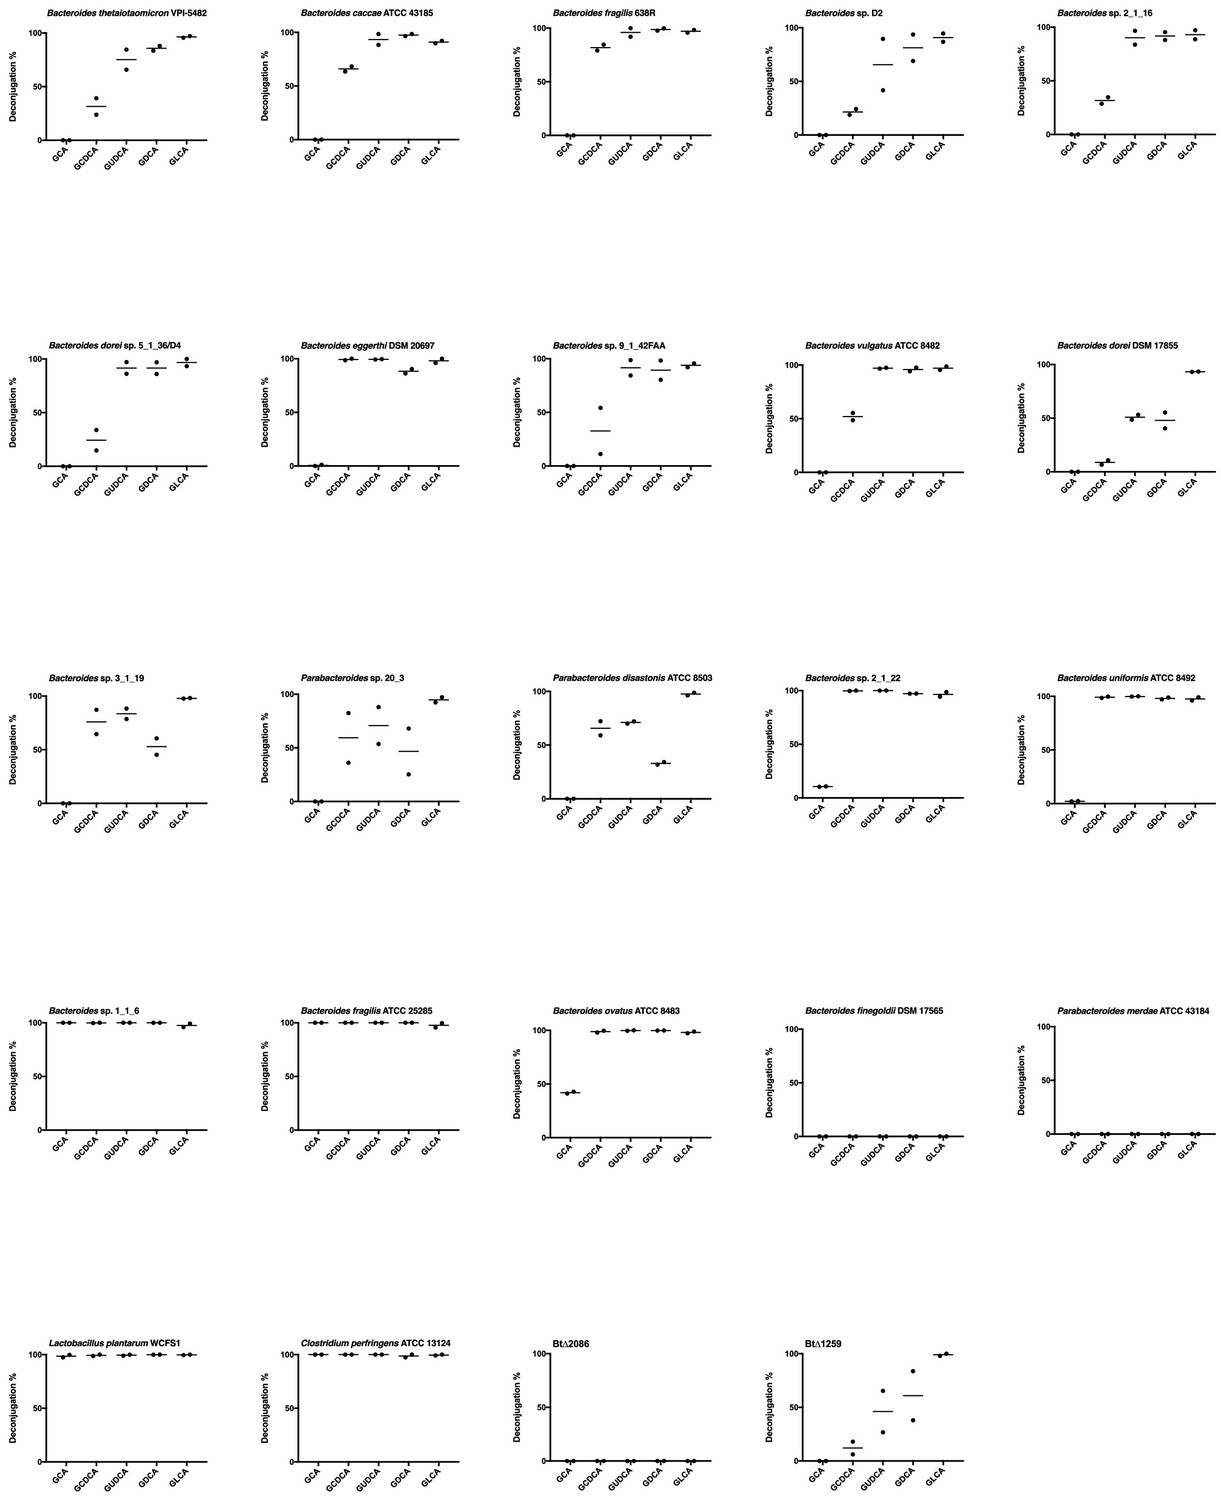
Biological duplicates of percent deconjugation at 48 hr, glyco-conjugated bile acids.
https://doi.org/10.7554/eLife.37182.005
Figure 2—figure supplement 2
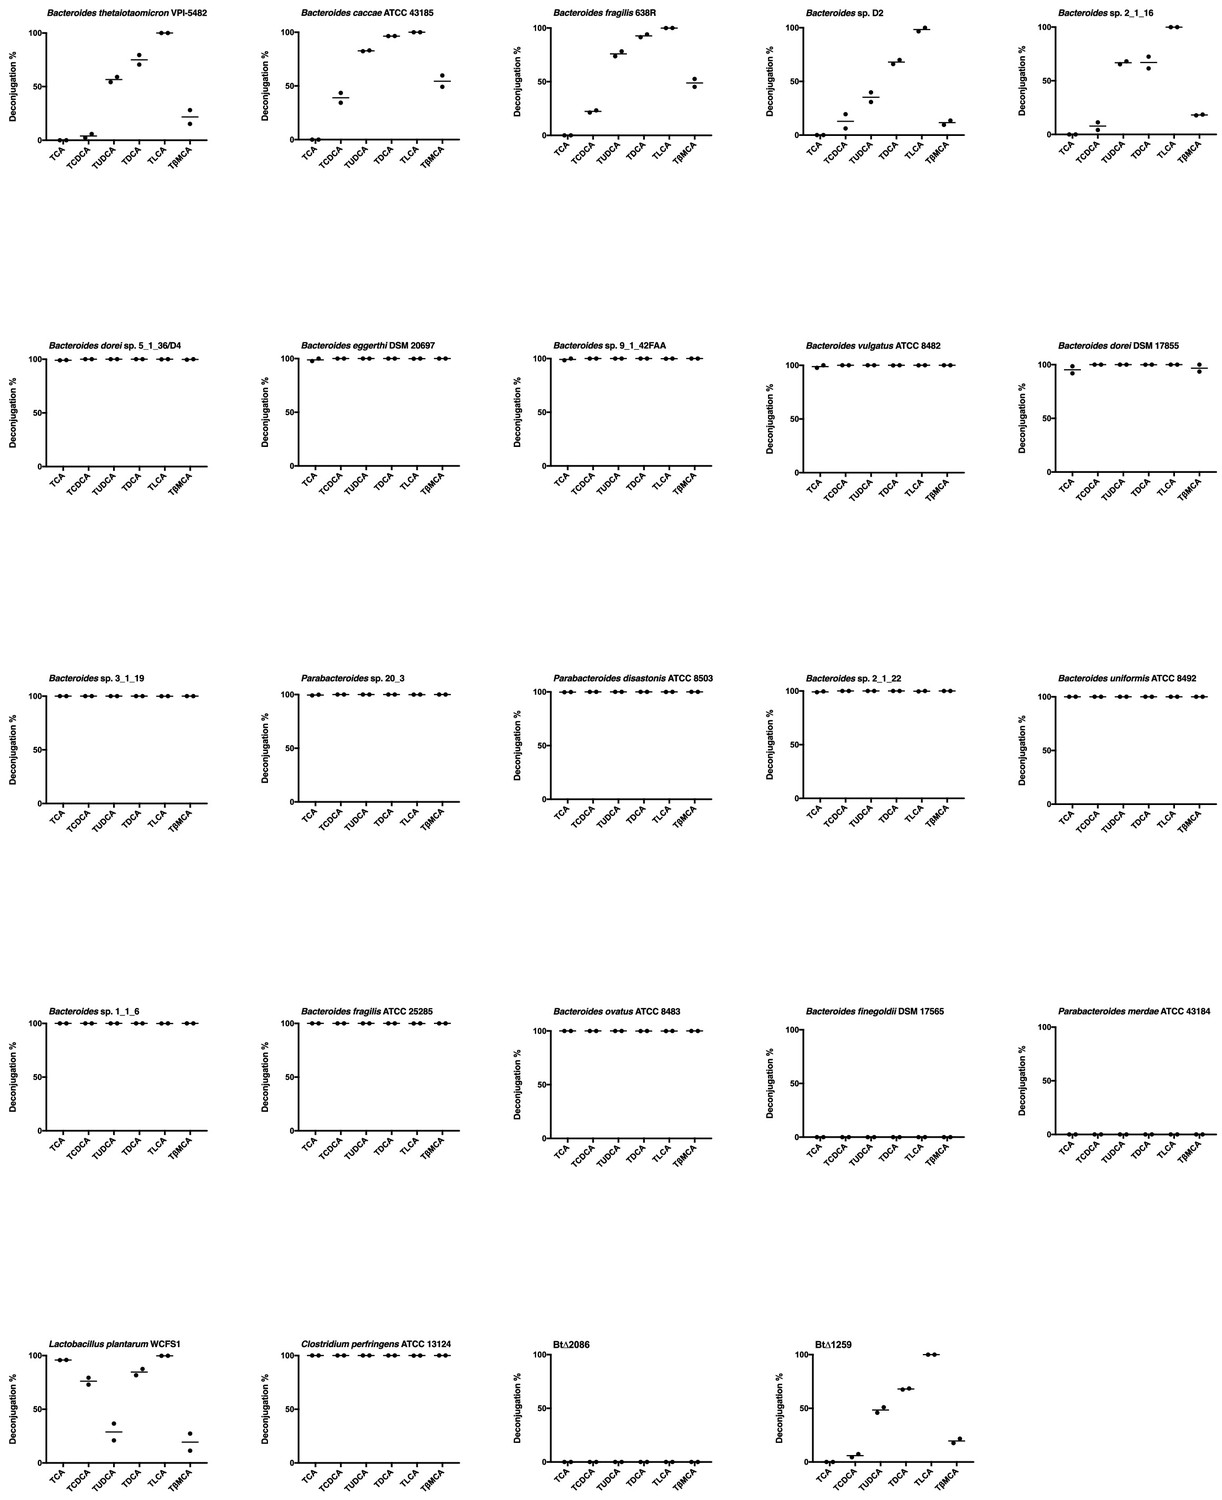
Biological duplicates of percent deconjugation at 48 hr, tauro-conjugated bile acids.
https://doi.org/10.7554/eLife.37182.006
Figure 2—figure supplement 3
Deconjugation heat maps, 24 hr timepoint.
Assays were performed in biological duplicate. Group I (red): Bacteroidetes species that deconjugate primary bile acids based on steroidal core structure (C12 = H but not C12 = OH); Group II (gray): species that deconjugate based on amino acid conjugate; Group III (blue): species that deconjugate all bile acid substrates; Group IV (black): no deconjugation observed.
Figure 3
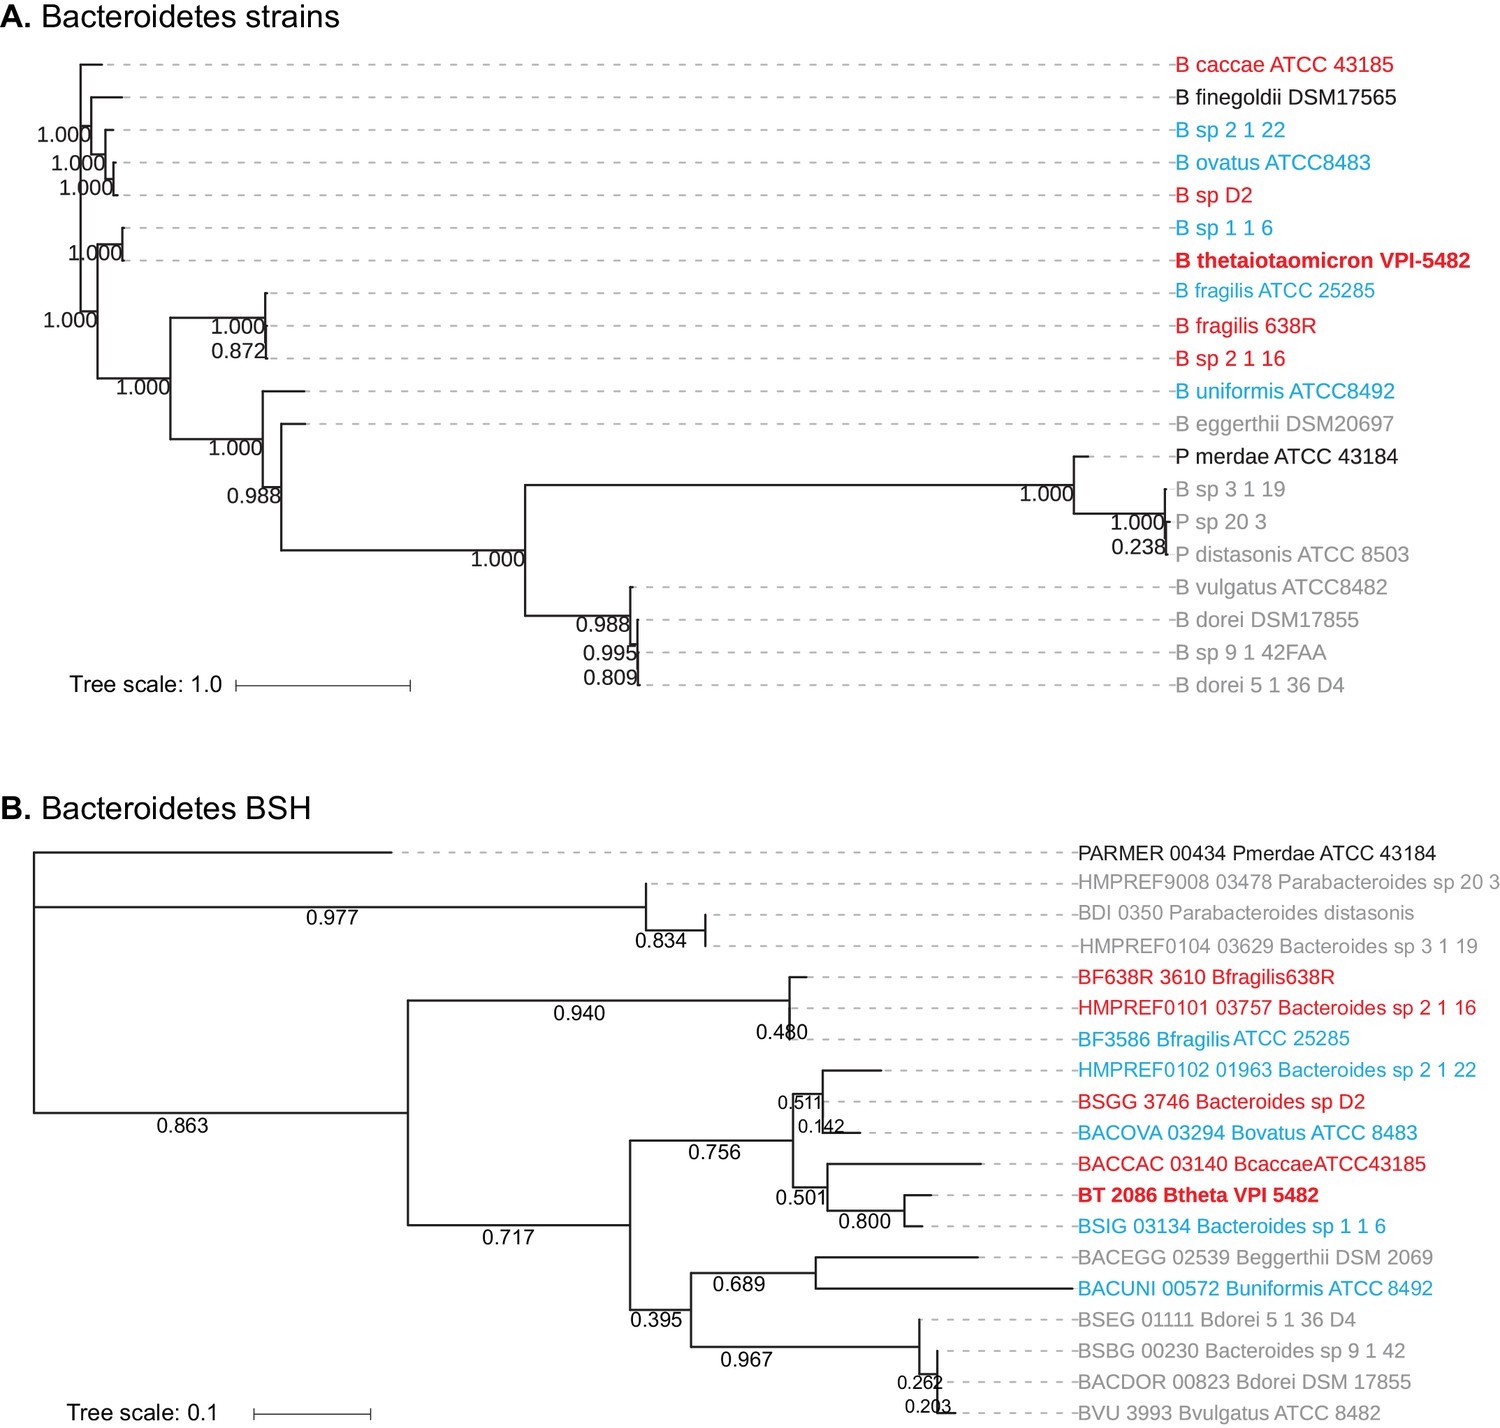
Homology-based classification of Bacteroidetes strains and putative BSH genes.
(A) Phylogenetic tree of 20 Bacteroidetes strains using alignment-based whole proteome phylogeny (PhyloPhlAn). Bacteroidetes strains from Group II (gray; deconjugation based on amino acid) form a partial clade, while Group I (red) and Group III (blue) strains do not separate into distinct clades. (B) Phlyogenetic tree of candidate Bacteroidetes BSH genes. A search for BLAST-P matches of BT2086 identified an ortholog in 19 of the 20 Bacteroidetes species assayed. Numbers next to the branches represent the percentage of replicate trees in which this topology was reached in a bootstrap test of 1000 replicates. No significant clustering of Bacteroidetes strains into clades based on enzymatic activity was observed. Scale bars represent number of nucleotide substitutions per site.
Figure 4 with 2 supplements

Monocolonization of GF mice with BT WT and Bt KO results in predictably altered bile acid pools.
(A) Male germ-free C57BL/6 mice were monocolonized with either Bt WT or BT KO and fed a high-fat diet (HFD) for 4 weeks (monocolonization experiment). In a second experiment, monocolonized mice (Bt WT or Bt KO) or GF mice were fed a HFD for 4 weeks and transferred to CLAMS during the 4th week to monitor metabolic inputs and outputs (CLAMS experiment). (B) Bile acid profiling using UPLC-MS revealed that Bt KO-colonized mice displayed higher levels of TβMCA in cecal contents than Bt WT-colonized mice while the levels of TCA remained the same between the two groups. βMCA levels were significantly higher in Bt WT-colonized animals and no CA was detected in any group (red boxes). (C–D) Similar changes were observed in feces (C) and distal ileum (D), although no βMCA was observed in any group in the distal ileum. Data are presented as mean ± SEM. BA (bile acid). For the monocolonization experiment, n = 12 mice per group, Welch’s t test. For the CLAMS experiment, n = 7–8 mice per group, one-way ANOVA followed by Tukey’s multiple comparisons test. *p<0.05, **p<0.01, ***p<0.001, ****p<0.0001.
Figure 4—figure supplement 1
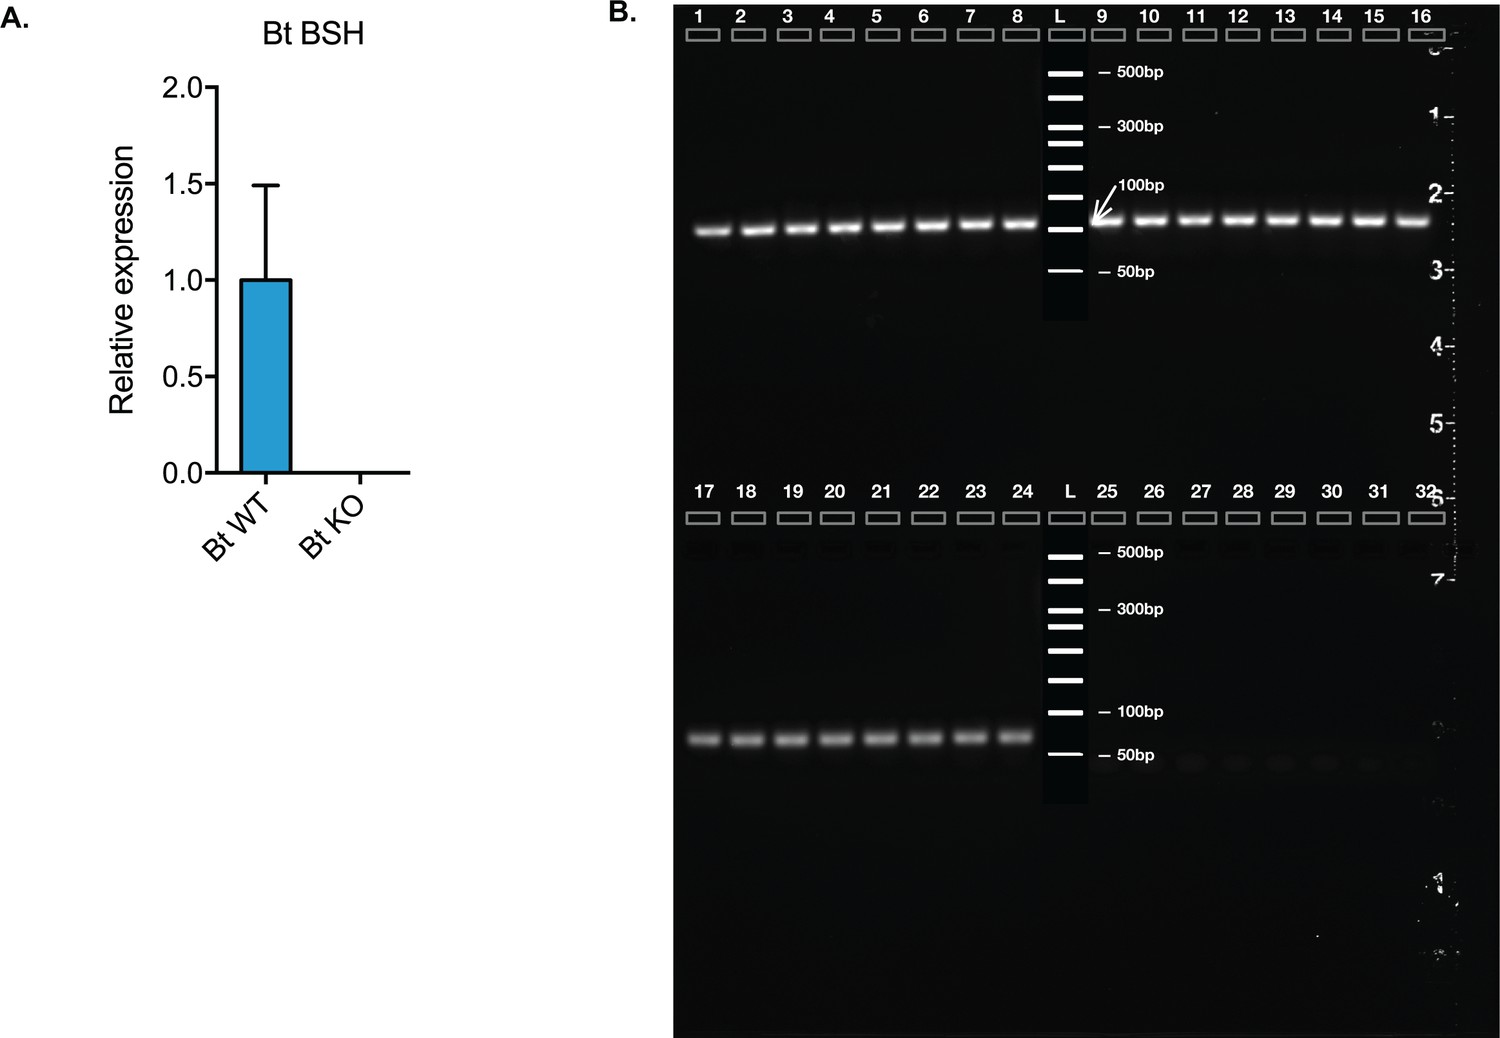
Confirmation of in vivo expression of Bt BSH.
(A) Bt BSH qRT-PCR results from mouse cecal contents from CLAMS experiment on day 32, using 16S ribosomal RNA as the housekeeping gene. (B) Gel electroporation results of the same qRT-PCR products. Lane 1–8, amplification of 16S ribosomal RNA qPCR fragment from eight Bt WT-colonized mice; lane 9–16, amplification of 16S ribosomal RNA qPCR fragment from eight Bt KO-colonized mice; lane 17–24, amplification of Bt BSH qPCR fragment from eight Bt WT-colonized mice; lane 25–32, amplification of Bt BSH qPCR fragment from eight Bt KO-colonized mice.
Figure 4—figure supplement 2
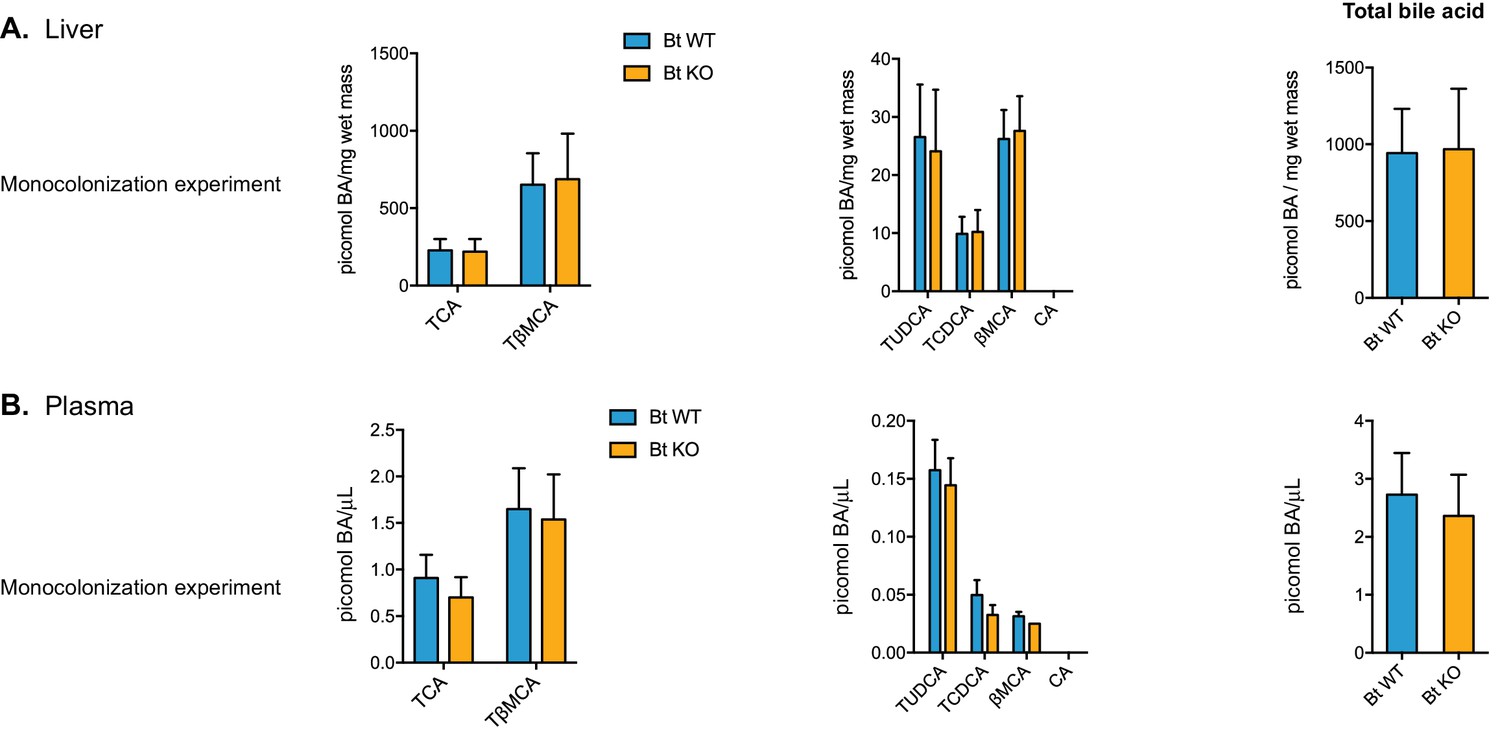
Bile acid composition in the liver and plasma.
No significant differences in bile acid pool composition were noted in the liver (A) or plasma (B). Data are presented as mean ± SEM. BA (bile acid). For the monocolonization experiment, n = 12 mice per group, Welch’s t test.
Figure 5
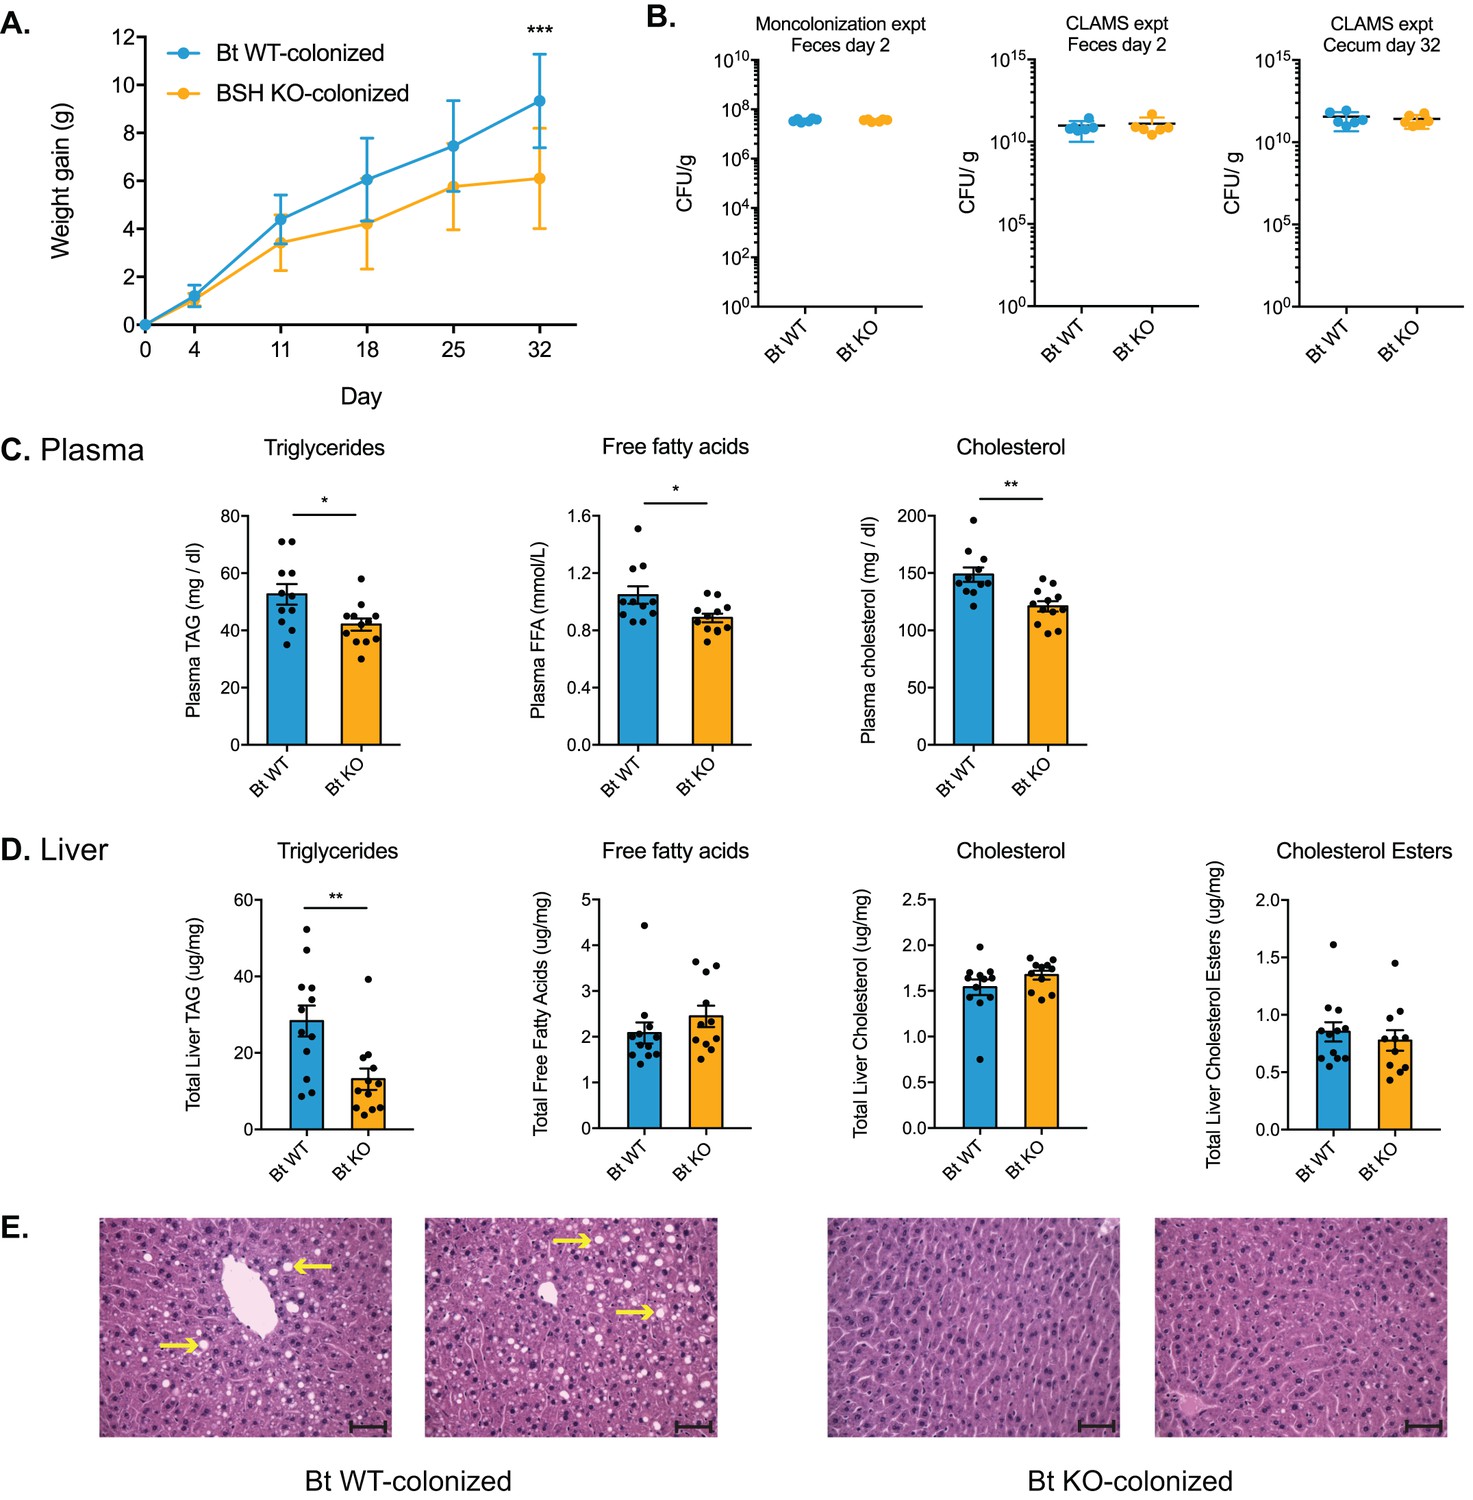
Bt BSH colonization status affects weight gain and lipid profiles.
(A) Weight-matched, male, germ-free C57BL/6 mice monocolonized with Bt KO gained less weight during a 4-week diet challenge than Bt WT-colonized mice. n = 12 mice per group, multiple t test analysis using the FDR method (Q = 1%), ***p<0.001 (FDR-corrected). (B) Microbial biomass did not differ between the Bt WT and Bt KO strains in GF mice. For the monocolonization experiment, frozen feces (day 2 post-colonization) were plated to determine colony-forming units per gram. For the CLAMS experiment, fresh feces (day 2) were plated. Cecal contents collected at sacrifice (day 32) were also plated to confirm maintenance of monocolonized status throughout the experiment. No CFU were detected in the GF group. n = 6 samples per group, Mann-Whitney test. (C–D) Lipid levels in plasma and blood, monocolonization experiment. (C) Triglyceride, free fatty acid, and cholesterol levels were lower in the plasma of Bt KO-colonized mice. (D) Levels of triglycerides were reduced in Bt KO-colonized mice. No significant differences in liver free fatty acids, liver cholesterol, or liver cholesterol esters were observed. n = 12 mice per group, Welch’s t test. (E) Representative H and E staining of liver sections (monocolonization experiment). Bt KO-colonized mice displayed decreased liver steatosis. Scale bars, 100 μm. Yellow arrows indicate representative white lipid droplets. n = 4 mice per group. All data are presented as mean ± SEM. *p<0.05, **p<0.01.
Figure 6 with 1 supplement
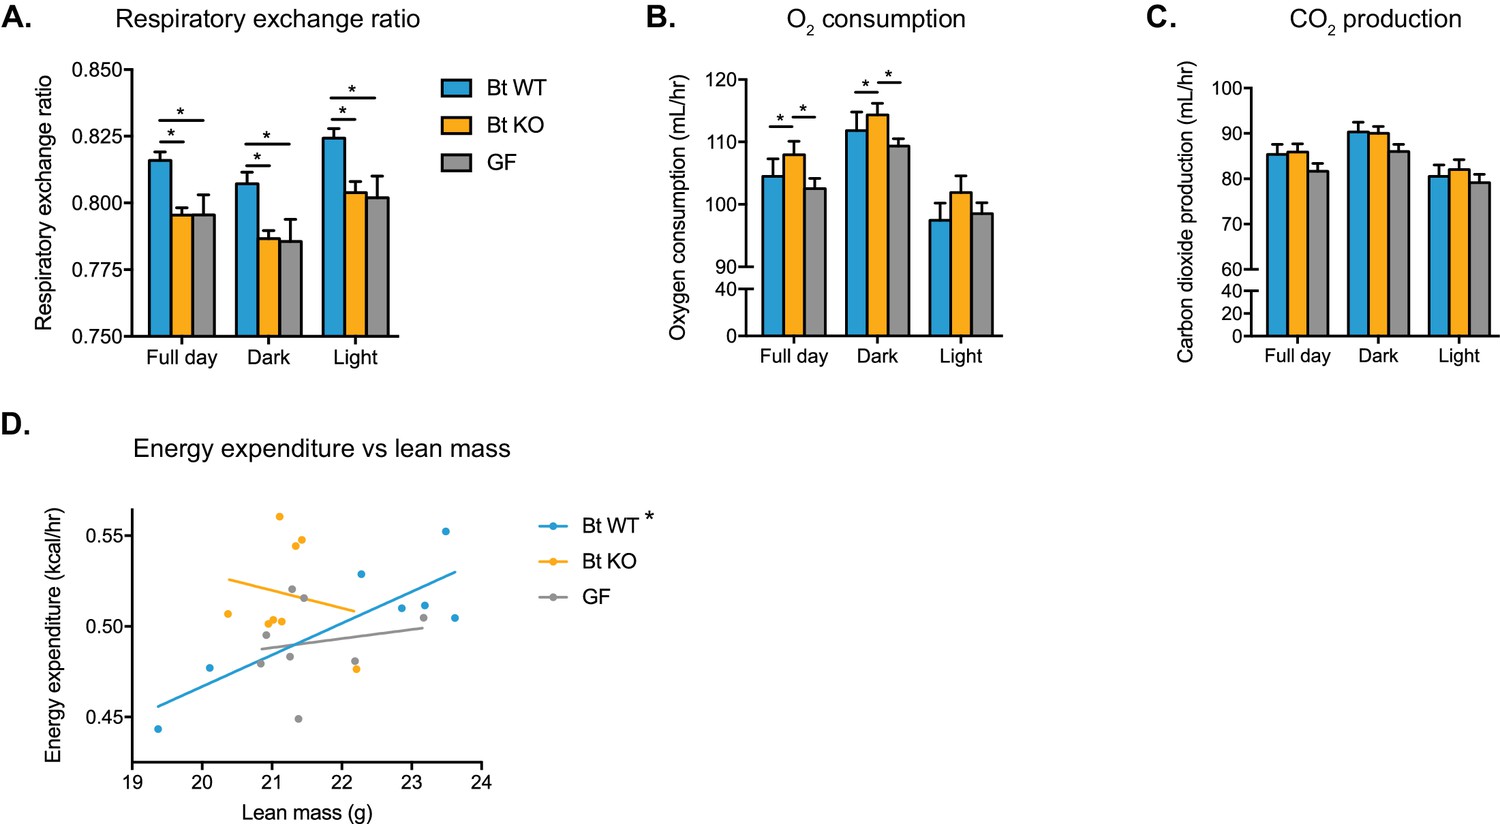
Bt WT-colonized, Bt KO-colonized, and GF mice display distinct metabolic phenotypes.
Mice were monitored in metabolic cages during the final week of the CLAMS experiment and continued on a HFD. Mice were allowed to acclimate to cages for 24 hr prior to the start of data acquisition. (A) Respiratory exchange ratio (RER). One-way ANOVA followed by Tukey’s multiple comparisons test, *p<0.05. (B–C) Oxygen consumption and (B) carbon dioxide production (C). ANCOVA with lean body mass as the covariate, *p<0.05. (D) Regression plot of energy expenditure as a function of lean mass. Energy expenditure (EE) is given by EE = CV x VO2, where CV = 3.815 + 1.232(RER). For the Bt WT-colonized group, *p=0.0168, indicating the slope is significantly non-zero. For the Bt KO-colonized and GF groups, p=0.6806 and p=0.6930, respectively. For (A–C), data are represented as mean ± SEM, where the number of samples is the number of mice. For Bt WT-colonized group, n = 7 mice, and for Bt KO-colonized and GF groups, n = 8 mice per group.
Figure 6—figure supplement 1
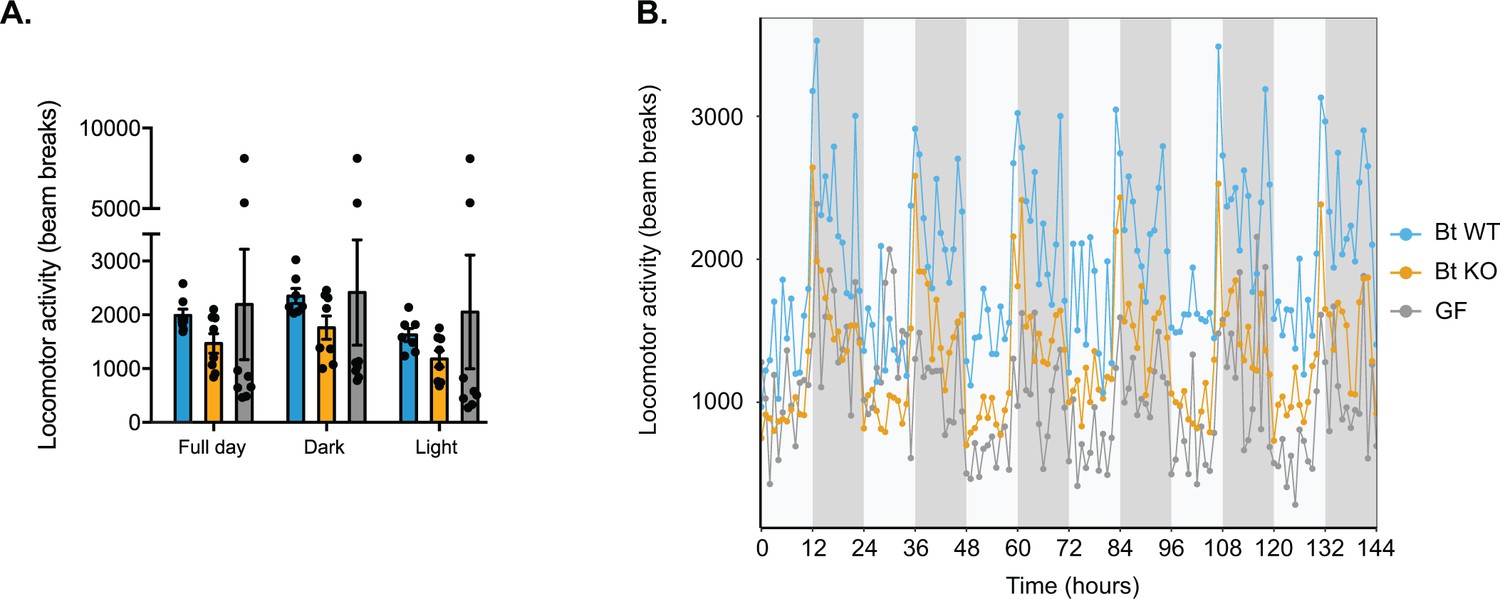
Locomotor activity.
(A) Locomotor activity was measured by the number of beam breaks. Each dot represents the mean for a given mouse. Data are represented as mean ± SEM, where the number of samples is the number of mice. (B) Hourly plot in which each dot represents the mean for a group of mice (Bt WT-colonized, Bt KO-colonized, or GF) at a given time point and error bars are omitted for clarity. For Bt WT-colonized group, n = 7 mice, and for Bt KO-colonized and GF groups, n = 8 mice per group.
Figure 7

Detergent properties of ileal bile acid pools do not significantly differ.
(A) Bile acid pools were reconstituted in vitro using the mean values measured from the distal ileum of Bt KO- and Bt WT-colonized mice (CLAMS experiment). Pools were added to four different concentrations of a mixture of fats representative of lipolysis products in the small intestine and incubated under physiologically relevant conditions (37˚C, pH 6.3). SDS (sodium dodecyl sulfate) was used as a positive control at its critical micelle concentration (8.2 mM). No significant differences in solubilization effects as measured by OD400 were observed at 5 hr and 24 hr time points. n = 3 biological replicates per condition, one-way ANOVA followed by Tukey’s multiple comparisons test. (B) No significant differences were observed in energy content of feces collected from Bt KO-colonized, Bt WT-colonized, or GF mice (CLAMS experiment). Feces were collected from CLAMS cages. n = 7–8 mice per group, one-way ANOVA followed by Tukey’s multiple comparisons test. Each data point represents the mean of two calorimetry experiments per mouse. All data are presented as mean ± SEM.
Figure 8 with 2 supplements
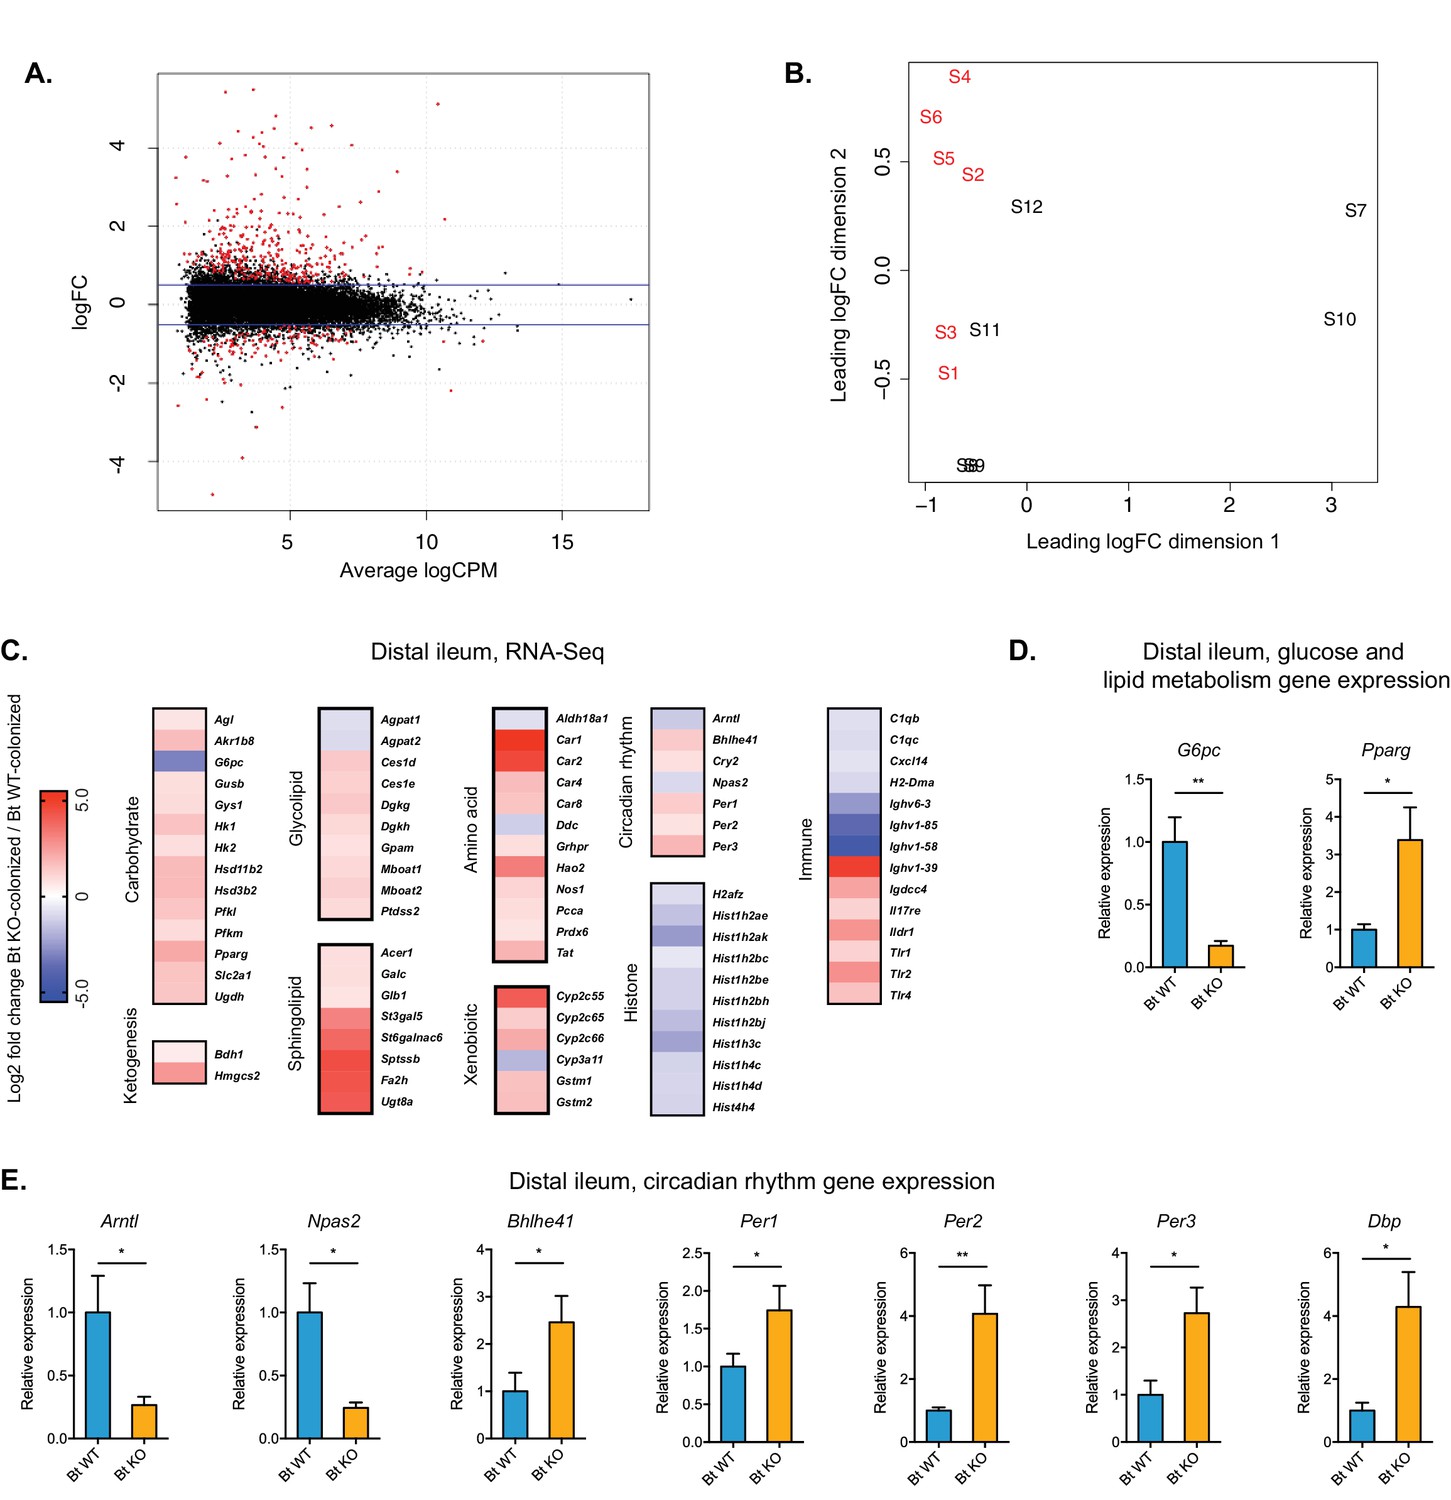
Global transcription analysis revealed changes in metabolism, circadian rhythm, immune response, and histone modification pathways in the distal ileum of Bt KO- vs.
Bt WT-colonized mice (monocolonization experiment). (A) Log2-transformed fold change in normalized RNA-seq gene counts in the distal ileum of GF mice colonized with Bt KO relative to mice colonized with Bt WT. MA plot showing the relationship between average concentration (logCPM) and fold-change (logFC) across the genes. Each gene is represented by a black dot. Significant differentially expressed genes are colored in red. The blue lines represent logFC ±0.5 threshold. (B) Multidimensional scaling (MDS) plot of two monocolonized groups (S1-S6: Bt WT-colonized mice; S7-S12: Bt KO-colonized mice) derived from RNA-Seq normalized gene counts, showing that samples segregate based on colonization status (Bt WT vs. Bt KO). (C) Changes in the host distal ileum transcriptome between Bt WT- and Bt KO-colonized conditions. Heatmap shows statistically significant fold changes of genes identified using differential expression analysis (FDR ≤ 0.05 and absolute Log2 fold-change ≥0.5). n = 6 samples for each group. (D–E) Gene expression in the distal ileum as measured by qPCR. Data are presented as mean ± SEM; n = 12 mice/group; *p<0.05, Welch’s t test.
Figure 8—figure supplement 1
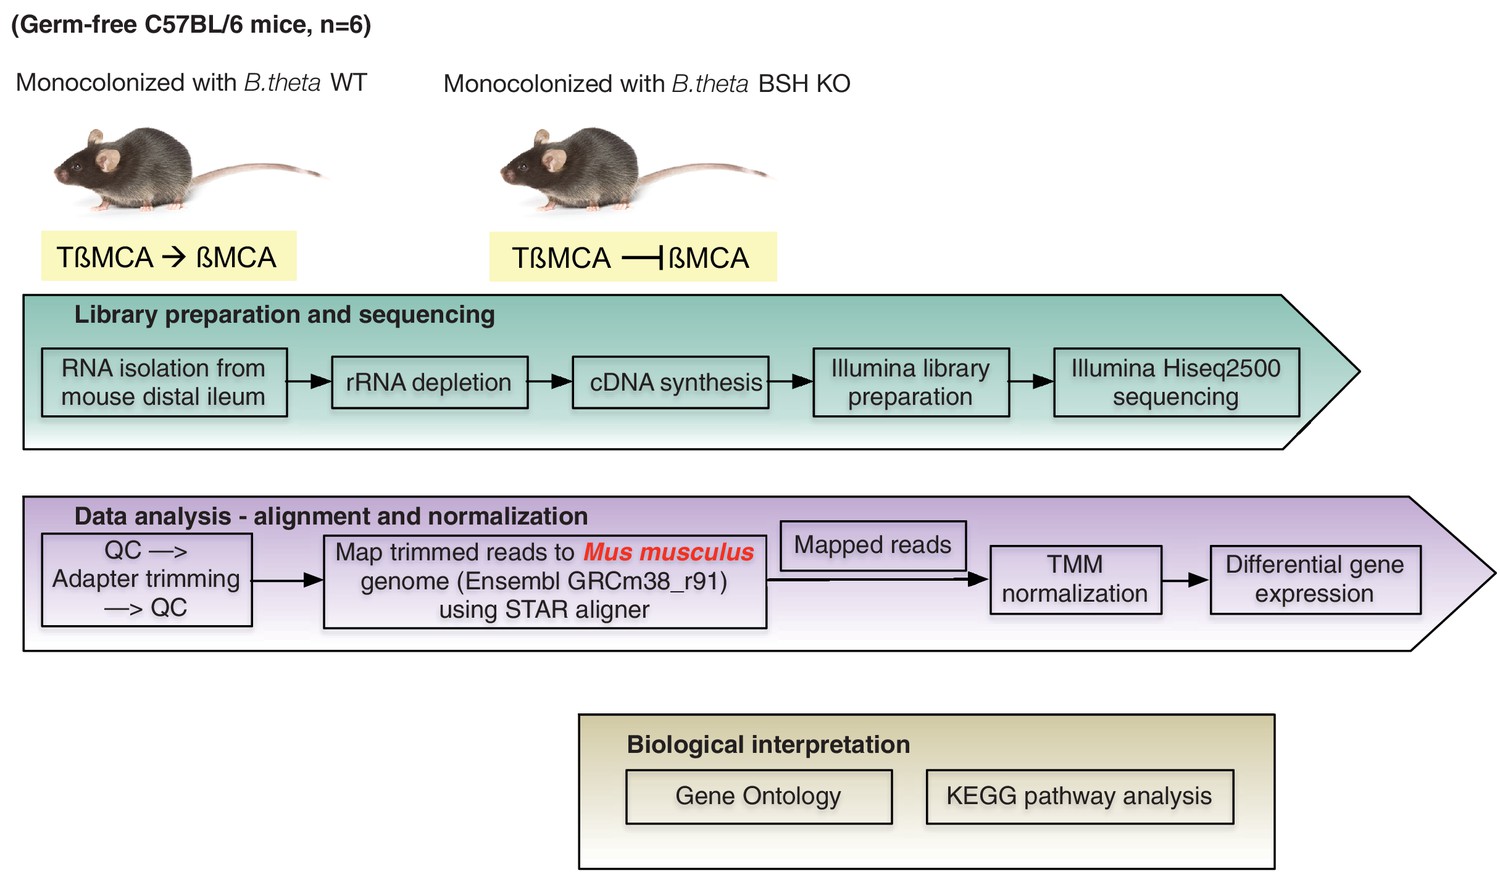
RNA-seq workflow.
https://doi.org/10.7554/eLife.37182.017
Figure 8—figure supplement 2
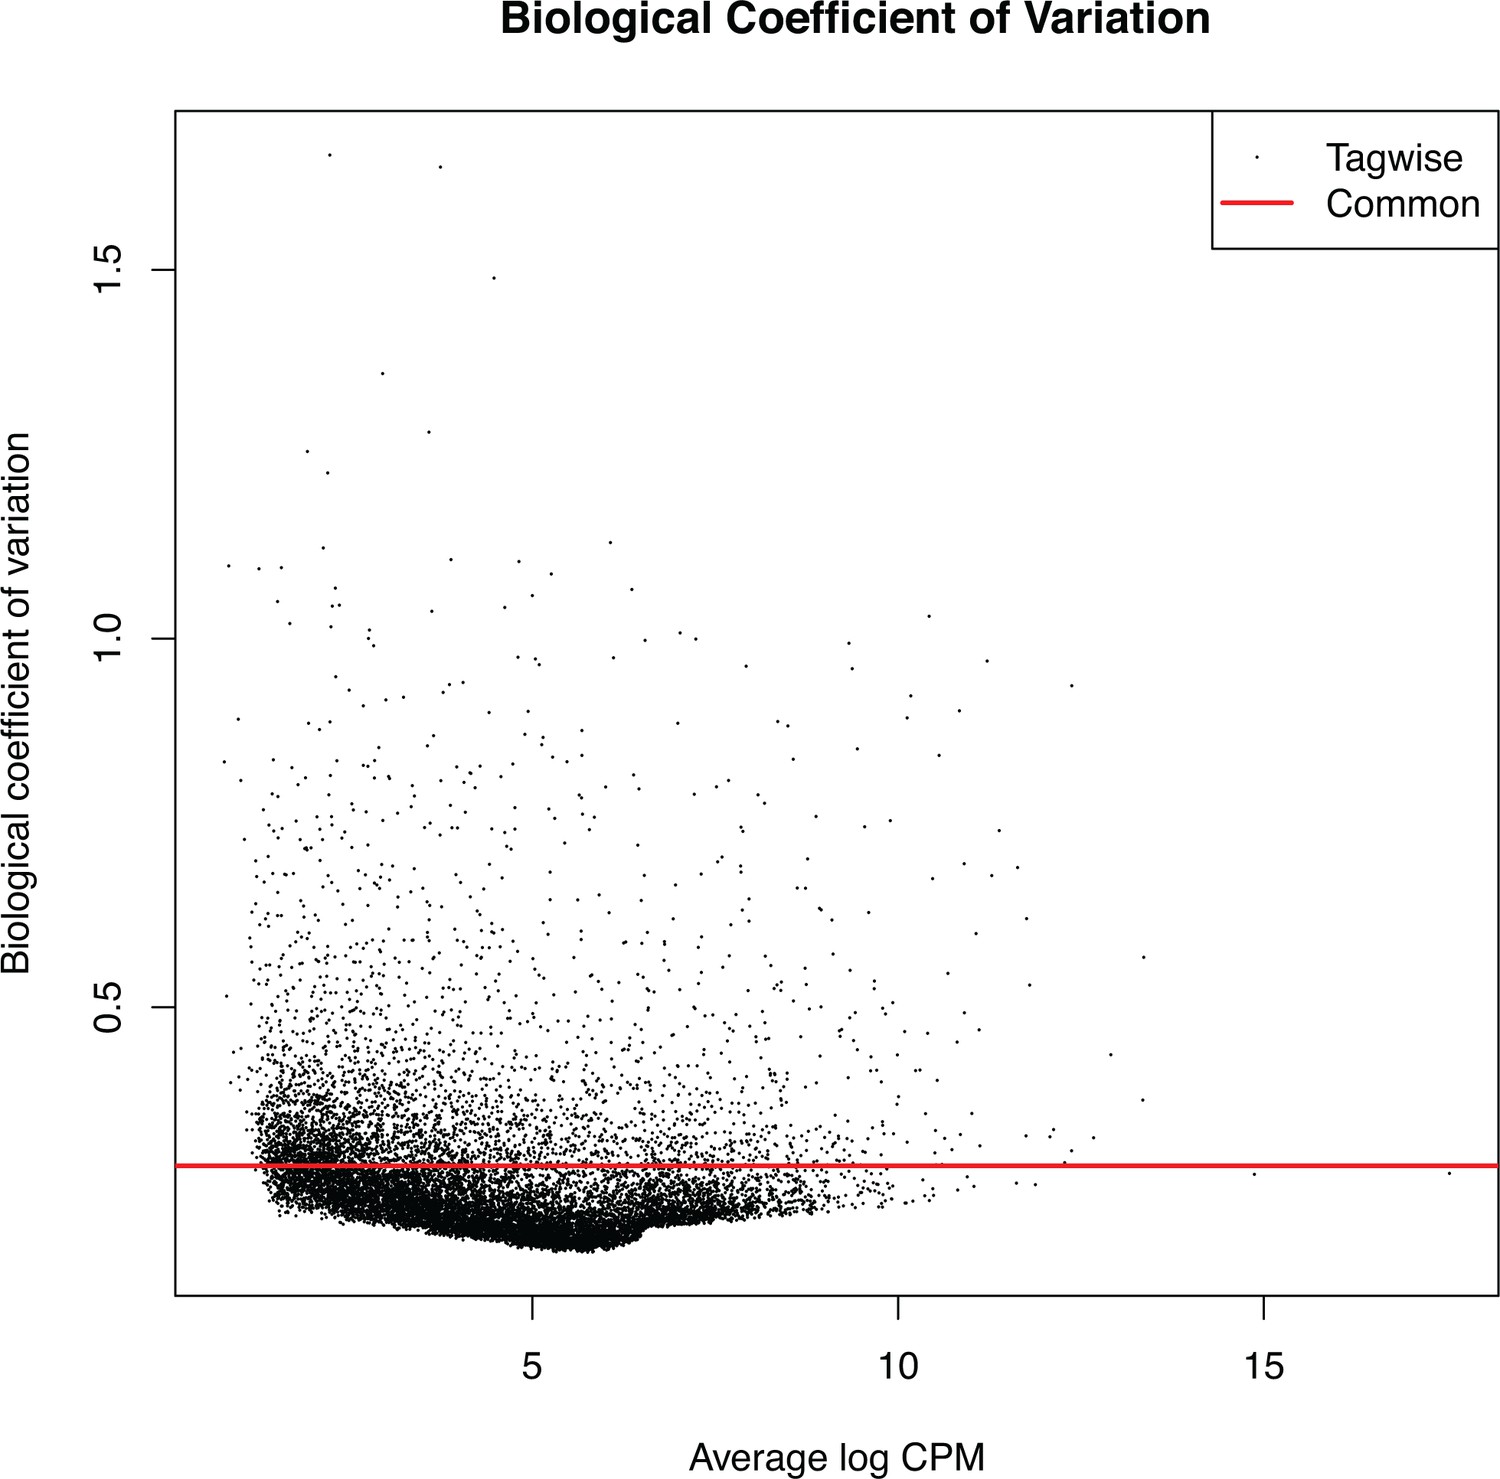
RNA-seq, biological coefficient of variation.
Low variation within biological replicates was observed.
Figure 9
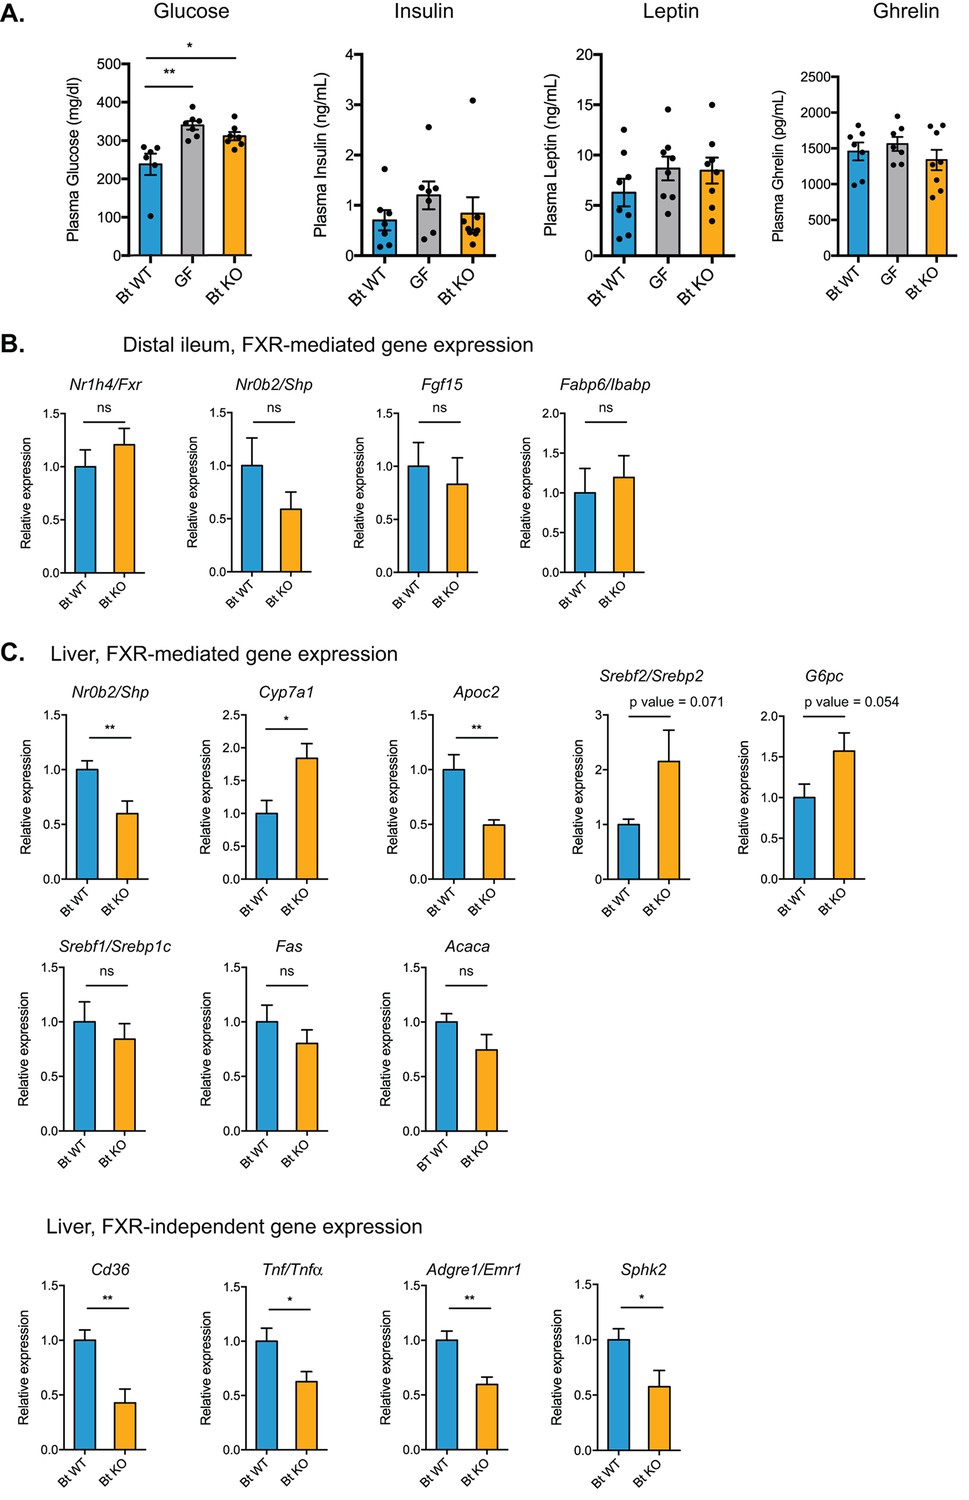
Bt BSH status affects transcription of genes in FXR-dependent and FXR-independent pathways.
(A) Plasma glucose and hormone levels, CLAMS experiment. Mice were fasted for 4 hr prior to terminal blood draw. n = 7–8 mice per group, data are presented as mean ± SEM, one-way ANOVA followed by Tukey’s multiple comparisons test, *p<0.05, **p<0.01. (B) Expression of genes in FXR-mediated pathways in the distal ileum was not significantly different between Bt KO- and Bt WT-colonized mice as measured by qPCR. (C) Gene expression in the liver as measured by qPCR. Genes in both FXR-mediated pathways (Nr0b2/Shp, Cyp7a1, Apoc2) and pathways not known to be mediated by FXR (Cd36, Tnf/Tnfα, Adgre1/Emr1, Sphk2) were significantly affected by Bt BSH status. (B–C) Data are presented as mean ± SEM; n = 12 mice/group; *p<0.05, **p<0.001, ns - not significant, Welch’s t test.
Tables
Key resources table
| Reagent type (species) or resource | Designation | Source or reference | Identifiers | Additional information |
|---|---|---|---|---|
| Strain, strain background (Bacteroides thetaiotaomicron) | VPI 5482 [CIP 104206T, E50, NCTC 10582] | ATCC | ATCC 29148 | |
| Strain, strain background (Bacteroides caccae) | VPI 3452A [CIP 104201T, JCM 9498] | ATCC | ATCC 43185 | |
| Strain, strain background (Bacteroides ovatus) | [NCTC 11153] | ATCC | ATCC 8483 | |
| Strain, strain background (Bacteroides vulgatus) | [NCTC 11154] | ATCC | ATCC 8482 | |
| Strain, strain background (Bacteroides uniformis) | Not applicable | ATCC | ATCC 8492 | |
| Strain, strain background (Parabacteroides distasonis) | [NCTC 11152] | ATCC | ATCC 8503 | |
| Strain, strain background (Bacteroides fragilis) | VPI 2553 [EN-2; NCTC 9343] | ATCC | ATCC 25285 | |
| Strain, strain background (Parabacteroides merdae) | VPI T4-1 [CIP 104202T, JCM 9497] | ATCC | ATCC 43184 | |
| Strain, strain background (Bacteroides eggerthii) | Not applicable | DSMZ | DSM-20697 | |
| Strain, strain background (Bacteroides finegoldii) | 199 | DSMZ | DSM-17565 | |
| Strain, strain background (Bacteroides dorei) | 175 | DSMZ | DSM-17855 | |
| Strain, strain background (Bacteroides dorei) | 5_1_36/D4 | BEI | HM-29 | |
| Strain, strain background (Bacteroides sp.) | 1_1_6 | BEI | HM-23 | |
| Strain, strain background (Bacteroides sp.) | 9_1_42FAA | BEI | HM-27 | |
| Strain, strain background (Bacteroides sp.) | D2 | BEI | HM-28 | |
| Strain, strain background (Bacteroides sp.) | 3_1_19 | BEI | HM-19 | |
| Strain, strain background (Bacteroides sp.) | 2_1_16 | BEI | HM-58 | |
| Strain, strain background (Parabacteroides sp.) | 20_3 (Deposited as Bacteroides sp., Strain 20_3) | BEI | HM-166 | |
| Strain, strain background (Bacteroides sp.) | 2_1_22 | BEI | HM-18 | |
| Strain, strain background (Bacteroides fragilis) | 638R | Other | Gift from Seth Rakoff-Nahoum, Boston Children's Hospital | |
| Strain, strain background (Lactobacillus plantarum) | NCIMB 8826 [Hayward 3A, WCFS1] | ATCC | BAA-793 | |
| Strain, strain background (Clostridium perfringens) | NCTC 8237 [ATCC 19408, CIP 103 409, CN 1491, NCIB 6125, NCTC 6125, S 107] | ATCC | ATCC 13124 | |
| Strain, strain background (Escherichia coli S17-1 λ pir) | E. coli S17-1 λ pir | Other | Gift from Michael Fischbach, Stanford University | |
| Strain, strain background (B. thetaiotaomicron VPI-5482 Δtdk) | Bt WT | Other | Gift from Michael Fischbach, Stanford University | |
| Strain, strain background (B. thetaiotaomicron VPI-5482 ΔtdkΔ2086) | BtΔ2086 | This paper | See Materials and methods, ‘Construction of Bacteroides thetaiotaomicron knockout mutants’ | |
| Strain, strain background (B. thetaiotaomicron VPI-5482 ΔtdkΔ1259) | BtΔ1259 | This paper | See Materials and methods, ‘Construction of Bacteroides thetaiotaomicron knockout mutants’ | |
| Strain, strain background (B. thetaiotaomicron VPI-5482 Δtdk Δ2086 pNBU2_erm_us1311_BT2086) | BtΔ2086,2086+ | This paper | See Materials and methods, ‘Construction of Bacteroides thetaiotaomicron complementation strains’ | |
| Strain, strain background (B. thetaiotaomicron VPI-5482 Δtdk Δ2086 pNBU2_erm_us1311_CTRL) | BtΔ2086,CTRL+ | This paper | See Materials and methods, ‘ Construction of Bacteroides thetaiotaomicron complementation strains’ | |
| Recombinant DNA reagent | pExchange-tdk (plasmid) | PMID: 18611383 | ||
| Recombinant DNA reagent | pNBU2_erm_us1311 (plasmid) | PMID: 25574022 | ||
| Sequence-based reagent (knockout primer pairs) | BT2086_UF | Eurofins Genomics | GAA AGA AGA TAA CAT TCG AGT CGA CAT CCA AAC CCA GTG TGA ACT | |
| Sequence-based reagent (knockout primer pairs) | BT2086_UR | Eurofins Genomics | CAT ATT ACT TCC AAA TTA AAT AGT TGA TAC TC | |
| Sequence-based reagent (knockout primer pairs) | BT2086_DF | Eurofins Genomics | GAG TAT CAA CTA TTT AAT TTG GAA GTA ATA TGT AGT CGA TAG TTA GTT ATG TGG TAA G | |
| Sequence-based reagent (knockout primer pairs) | BT2086_DR | Eurofins Genomics | CCA CCG CGG TGG CGG CCG CTC TAG AAG CAG ACG TTA TCC TGG TTT C | |
| Sequence-based reagent (knockout primer pairs) | BT1259_UF | Eurofins Genomics | GAA AGA AGA TAA CAT TCG AGT CGA CGG ATG ATT ATT GCC CCA TTT TG | |
| Sequence-based reagent (knockout primer pairs) | BT1259_UR | Eurofins Genomics | CGT ACA CAT AAT TTC GAT TTT TAG TTA TAG | |
| Sequence-based reagent (knockout primer pairs) | BT1259_DF | Eurofins Genomics | CTA TAA CTA AAA ATC GAA ATT ATG TGT ACG TAA ATT GAT AGC AGC TTG CTG C | |
| Sequence-based reagent (knockout primer pairs) | BT1259_DR | Eurofins Genomics | CCA CCG CGG TGG CGG CCG CTC TAG ACG TTT TTC TAC CGG ACG AAT C | |
| Sequence-based reagent (complementation primer pairs) | us1311-BT-For-NdeI | Eurofins Genomics | GGG TCC ATA TGA AGA AAA AAC TTA CGG GTG TTG C | |
| Sequence-based reagent (complementation primer pairs) | BT-Rev-XbaI | Eurofins Genomics | CTA GTC TAG ACT ACA TCA CCG GAG TTT CGA A | |
| Sequence-based reagent (diagnostic primer) | pExchange_seq_UF | Eurofins Genomics | CGG TGA TCT GGC ATC TTT CT | |
| Sequence-based reagent (diagnostic primer) | pExchange_seq_DR | Eurofins Genomics | AAC GCA CTG AGA AGC CCT TA | |
| Sequence-based reagent (diagnostic primer) | BT2086_seq_F1 | Eurofins Genomics | CAA CTG TCC GGG TGA ATA TAA AG | |
| Sequence-based reagent (diagnostic primer) | BT2086_seq_F2 | Eurofins Genomics | GAA GTT TTC GTT GGG TGA ATG | |
| Sequence-based reagent (diagnostic primer) | BT1259_seq_F1 | Eurofins Genomics | AGA AGG TAC ATC GCC TGT AC | |
| Sequence-based reagent (diagnostic primer) | BT1259_seq_F2 | Eurofins Genomics | TAC TAT TCA CGC ACC ACA CC | |
| Sequence-based reagent (diagnostic primer) | pNBU2_UNIV-F | Eurofins Genomics | TAA CGG TTG TGG ACA ACA AG | |
| Sequence-based reagent (diagnostic primer) | pNBU2_UNIV-R | Eurofins Genomics | CAC AAT ATG AGC AAC AAG GAA TCC | |
| Sequence-based reagent (qRT-PCR primer) | qBTBSH_F | Eurofins Genomics | GCGTGCGGGACACAATAAAG | |
| Sequence-based reagent (qRT-PCR primer) | qBTBSH_R | Eurofins Genomics | TAGCCTGTTGCGATTACGCT | |
| Sequence-based reagent (qRT-PCR primer) | qBT16s_F | Eurofins Genomics | GTGAGGTAACGGCTCACCAA | |
| Sequence-based reagent (qRT-PCR primer) | qBT16s_R | Eurofins Genomics | CTGCCTCCCGTAGGAGTTTG |
Additional files
-
Supplementary file 1
Mouse experiment analyses.
- https://doi.org/10.7554/eLife.37182.020
-
Transparent reporting form
- https://doi.org/10.7554/eLife.37182.021
Download links
A two-part list of links to download the article, or parts of the article, in various formats.
Downloads (link to download the article as PDF)
Open citations (links to open the citations from this article in various online reference manager services)
Cite this article (links to download the citations from this article in formats compatible with various reference manager tools)
A selective gut bacterial bile salt hydrolase alters host metabolism
eLife 7:e37182.
https://doi.org/10.7554/eLife.37182


