An alternative splicing switch in FLNB promotes the mesenchymal cell state in human breast cancer
- Dana-Farber Cancer Institute, United States
- Harvard Medical School, United States
- Broad Institute of MIT and Harvard, United States
- Whitehead Institute for Biomedical Research and MIT, United States
- Garvan Institute of Medical Research, Australia
- University of California, Santa Cruz, United States
Figures
Figure 1 with 2 supplements
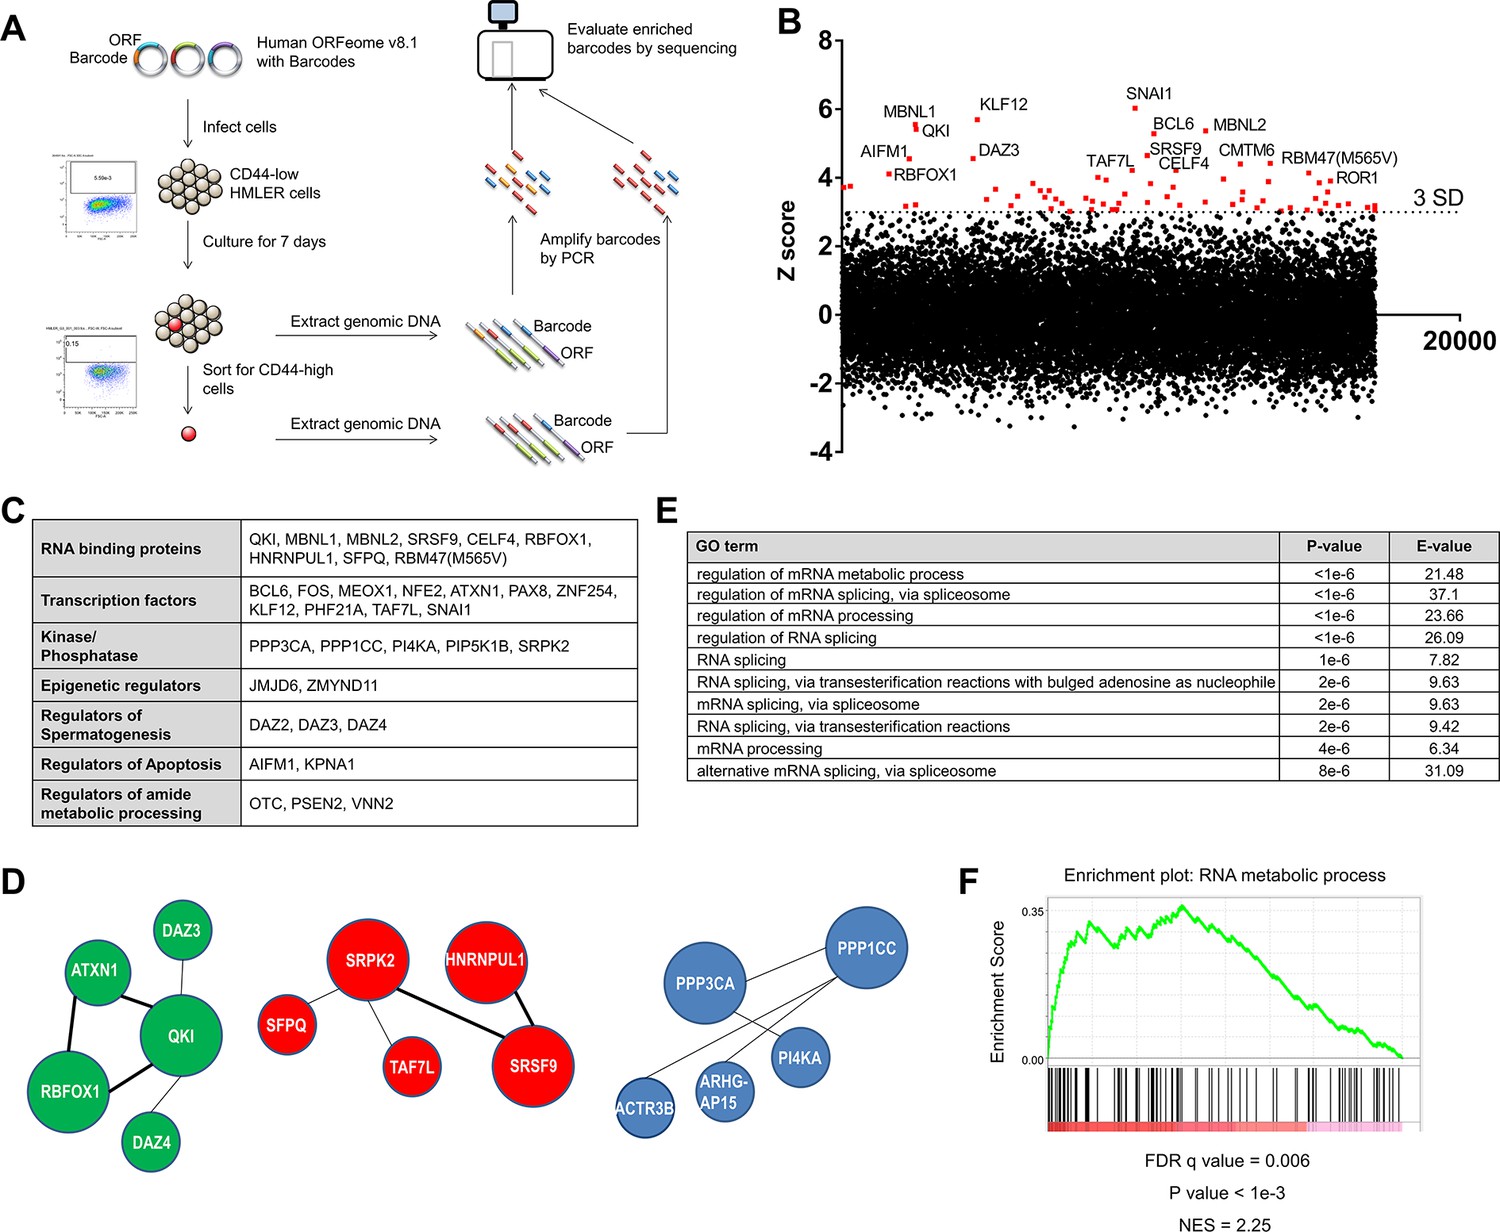
Genome scale ORF screen identifies splicing factors and RNA-binding proteins as regulators of EMT.
(A) Schematic of the genome scale ORF screen used to identify regulators of EMT. (B) Distribution of enrichment Z scores. The red dots indicate the ORFs with a Z score >3 and the top 15 gene names are labeled (Figure 1—source data 1). (C) The top candidate ORFs in the screen categorized into seven different functional classes. (D) Network analysis of enriched protein complexes among the top candidates ORFs. (E) GO term enrichment analysis of the top candidate ORFs. (F) Enrichment for RNA metabolic processes among the top candidate ORFs, as determined by pre-ranked GSEA analysis.
-
Figure 1—source data 1
ORF screen results.
- https://doi.org/10.7554/eLife.37184.006
Figure 1—figure supplement 1
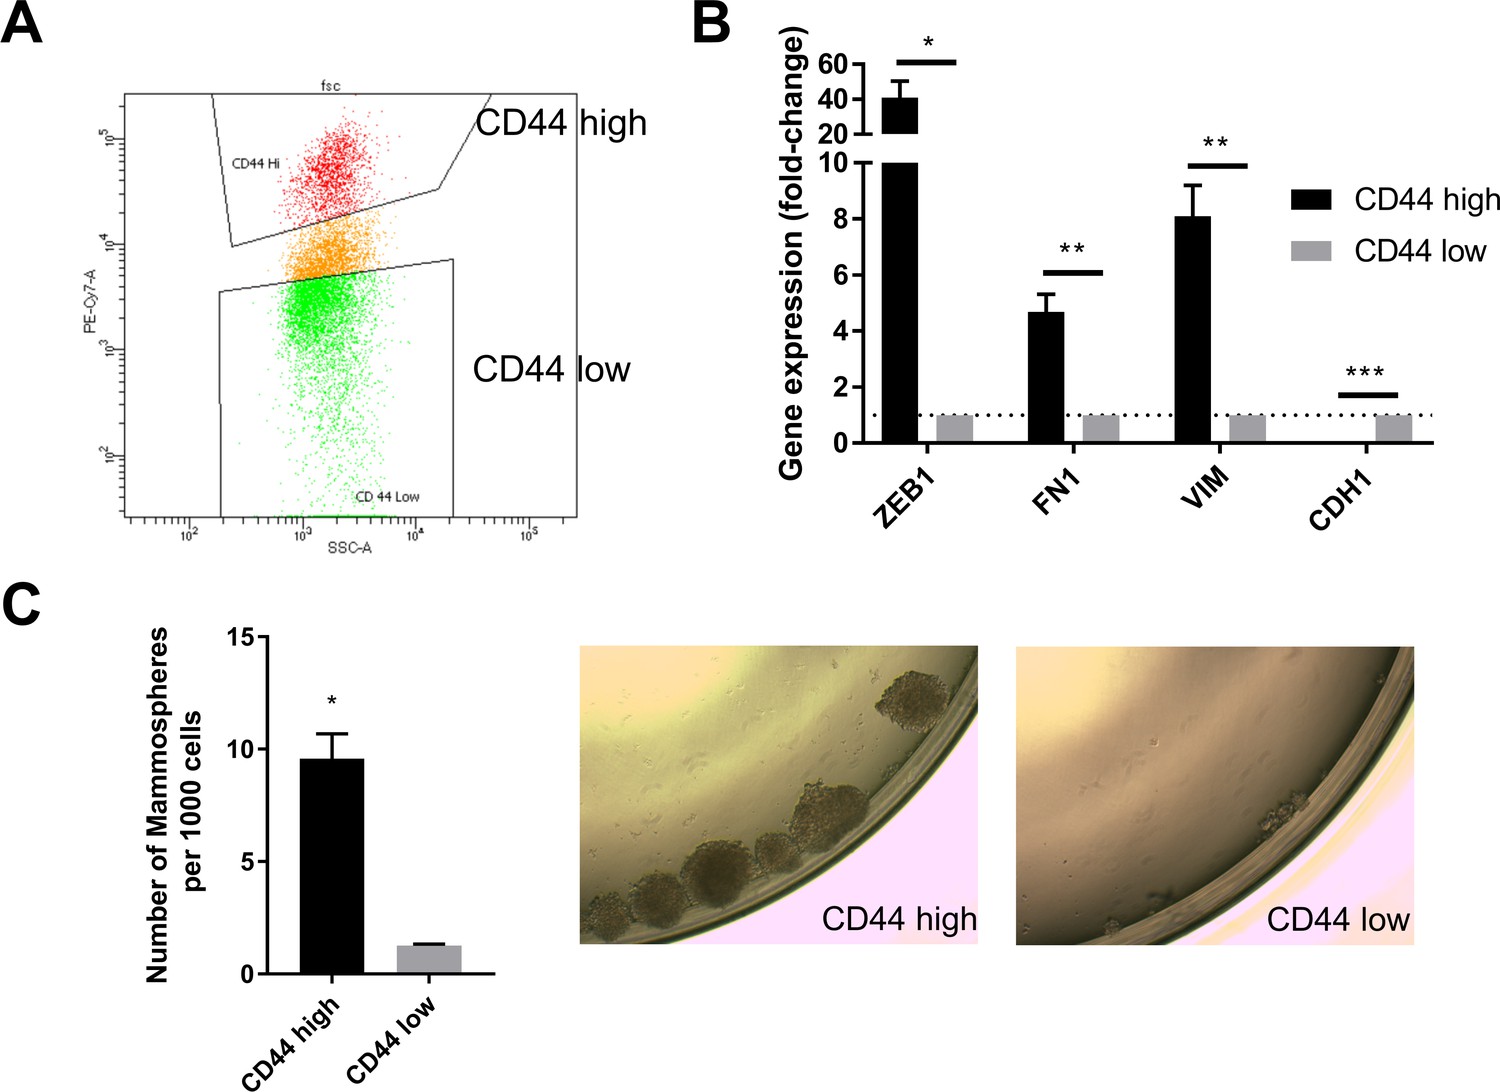
CD44 status serves as a marker for the mesenchymal and stem-like cell state in human mammary epithelial cells.
(A) HMLER cells were stained with CD44-PE-CY7 antibody. CD44 high and low cell populations were sorted by flow cytometry. The gating for CD44 high and low cells is shown. (B) qPCR analysis of the expression of mesenchymal (ZEB1, FN1 and VIM) and epithelial (CDH1) markers in CD44 high and low HMLER cells. n = 4. *, p<0.05, **, p<0.01. Student’s two-tailed t test. (C) Left: Quantification of mammosphere numbers derived from 1000 HMLER CD44 high or low cells plated in ultra-low attachment plates. n = 3. *, p<0.05. Student’s two-tailed t test. Right: Representative images of the CD44 high and CD44 low cells.
Figure 1—figure supplement 2
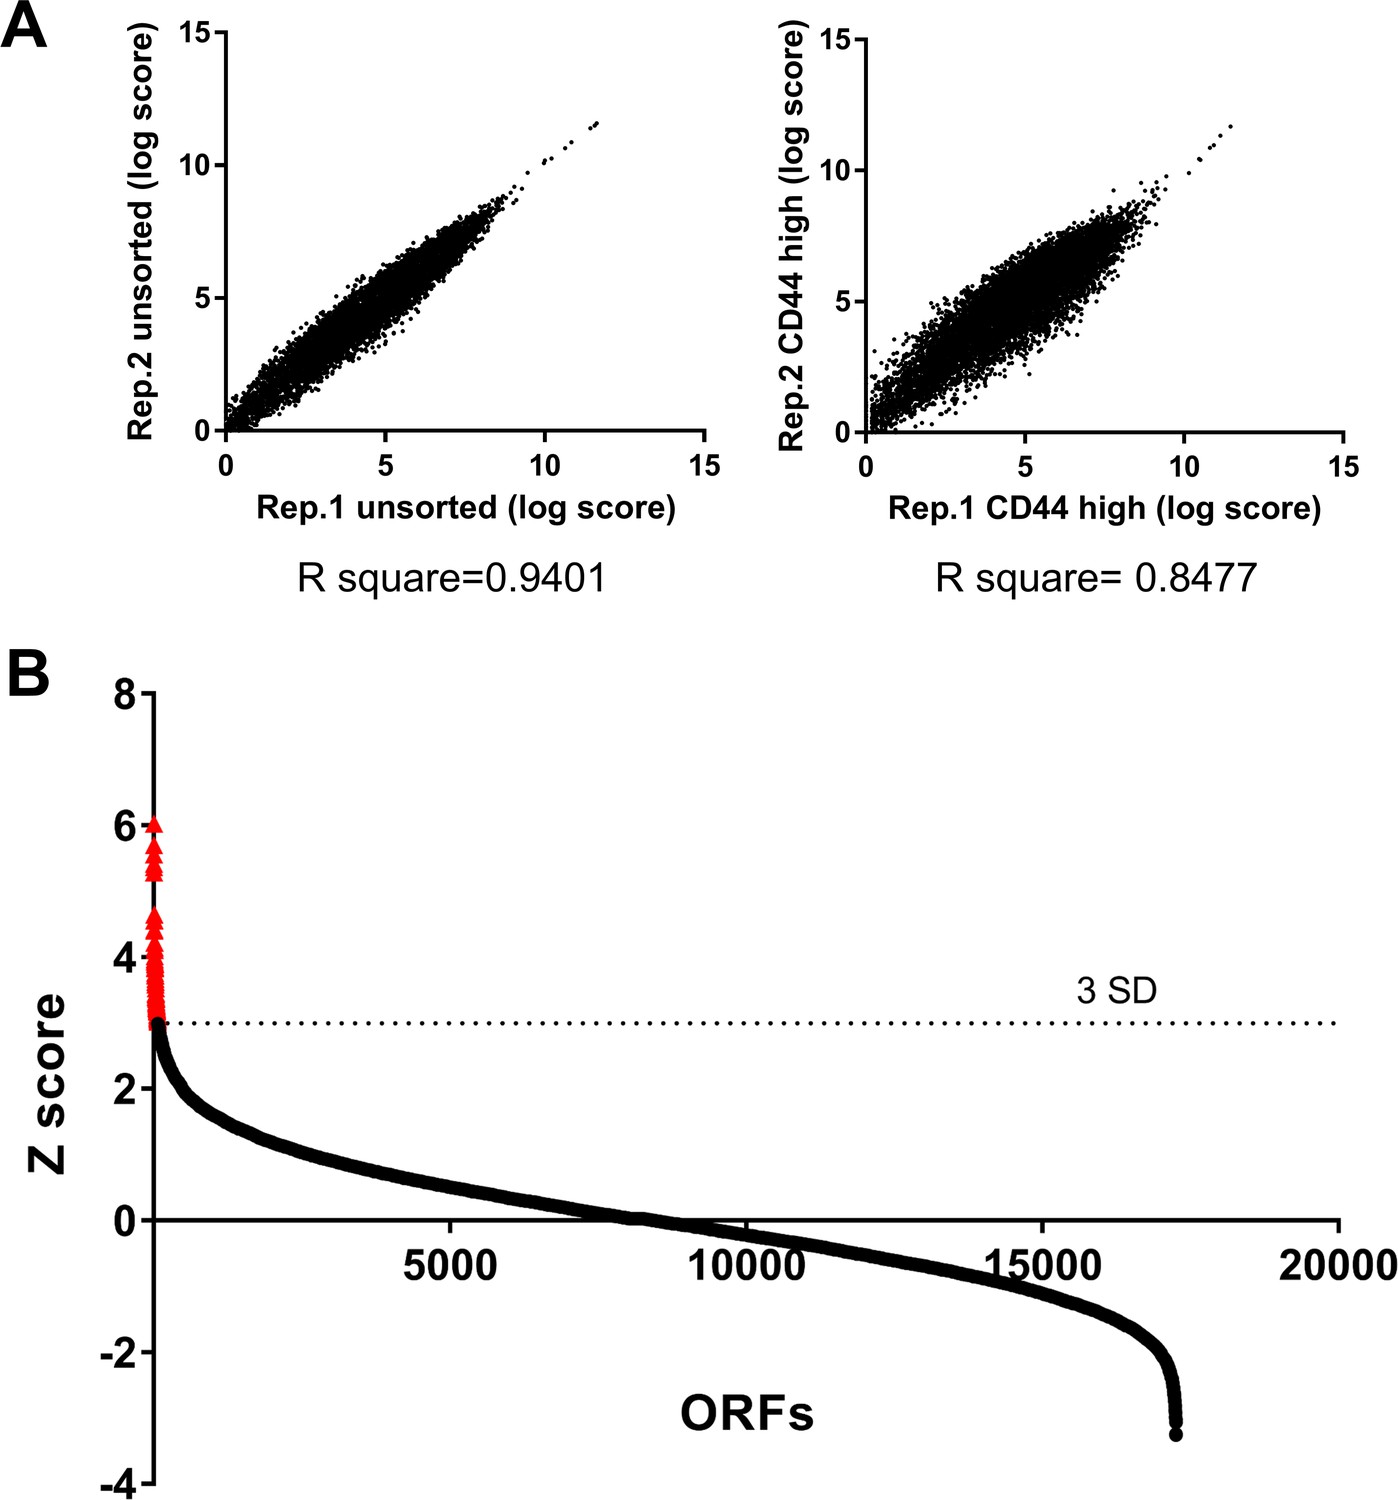
A genome scale ORF screen to identify regulators of EMT.
(A) The reproducibility of the two replicates in the screen. Shown are the comparison of the Log scores of the unsorted cell population (left) or the CD44 high cell population (right) between the two replicates. (B) The Z scores of all the ORFs tested in the screen. The ORFs were sorted from high to low based on their Z score value. The red dots indicate the 68 genes with a Z score greater than 3 (related to Figure 1B).
Figure 2 with 4 supplements
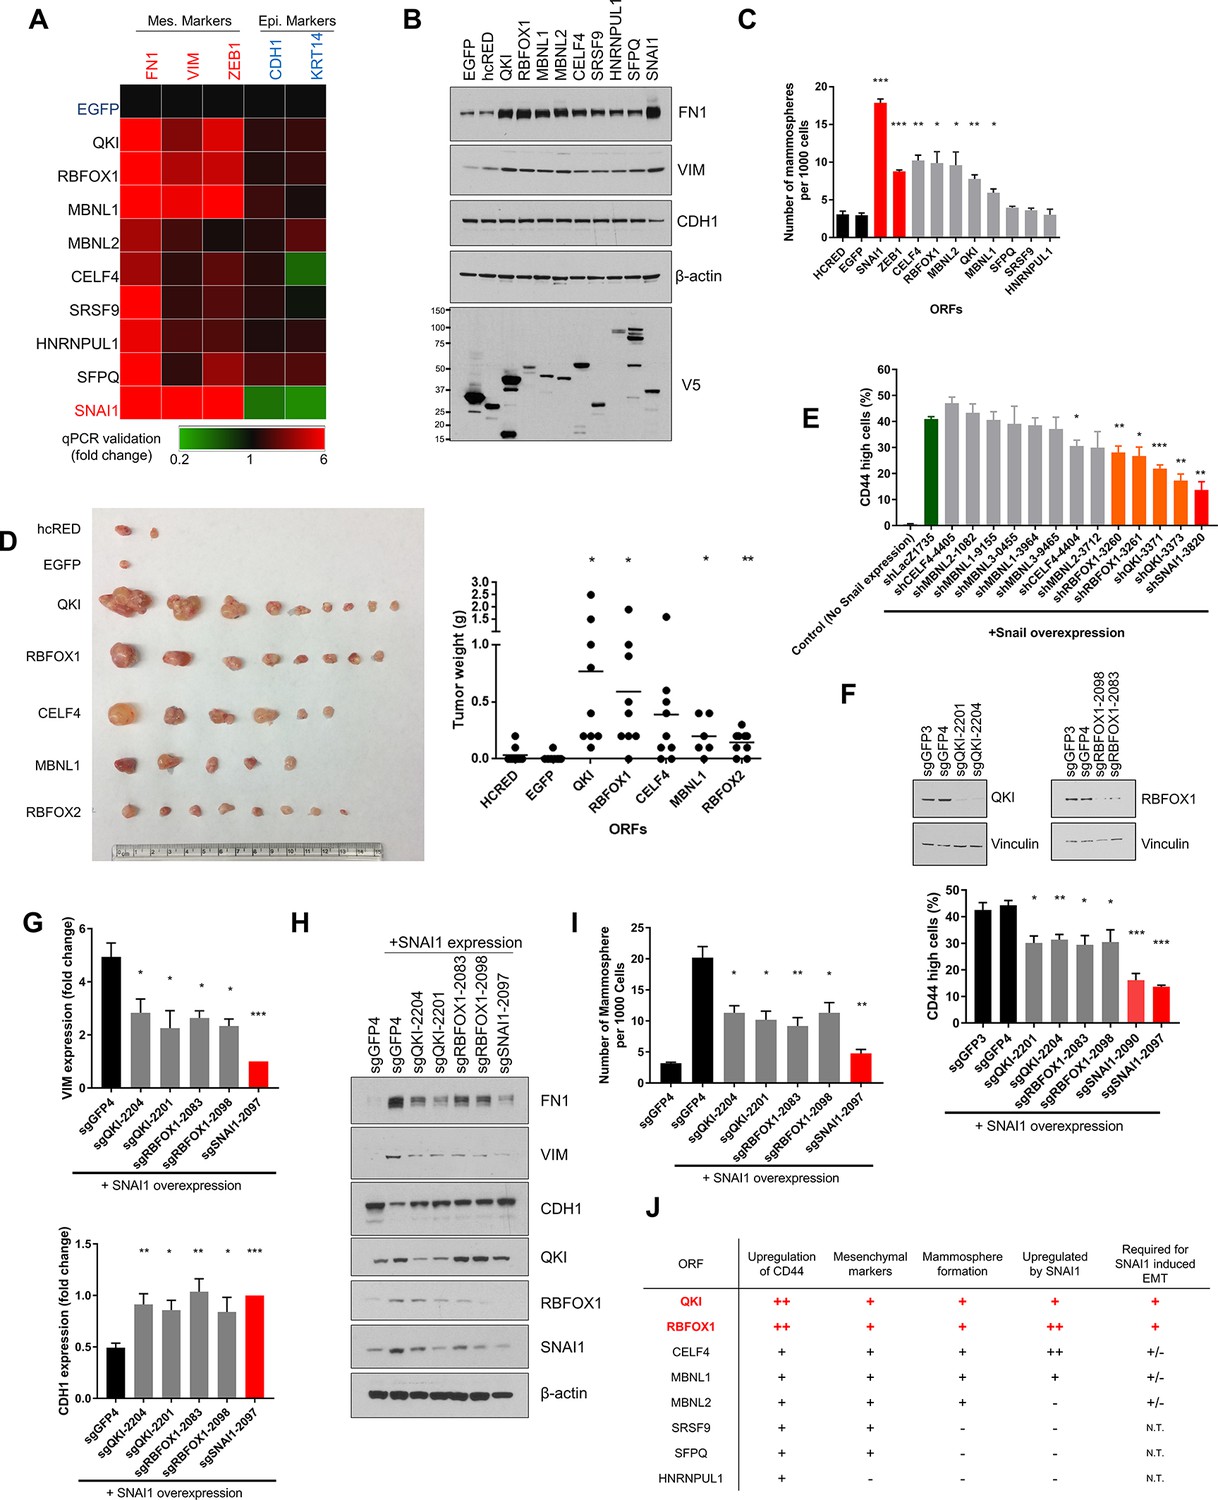
QKI and RBFOX1 are sufficient and partially required for an intermediate mesenchymal and stem-like cell state.
(A) Heatmap showing the expression of mesenchymal (FN1, VIM, ZEB1) and epithelial (CDH1, KRT14) markers in HME cells expressing the indicated candidate ORFs, normalized to a negative control (EGFP) and quantified by qPCR. n = 3. Bar graphs and statistical significance for each gene are shown in Figure 2—figure supplement 1B. (B) Levels of EMT marker expression in HME cells expressing the indicated candidate ORFs quantified by immunoblotting. (C) The rate of mammosphere formation in HMLE cells that express the indicated ORFs. The number of mammosphere per 1000 cells plated was counted. n = 5, ***, p<0.001; **, p<0.01; *, p<0.05. Representative images are shown in Figure 2—figure supplement 1C. (D) In vivo tumor formation assay. HMLER cells expressing the corresponding ORFs were injected subcutaneously into immuno-compromised mice and tumor growth was monitored for 15 weeks. Shown are an image of tumor sizes (left) and quantification of tumor weights (right) (individual tumor growth curves are shown in Figure 2—figure supplement 1E). n = 9, **, p<0.01; *, p<0.05, Student’s two-tailed t-test. (E) The percentage of CD44-high cells when SNAI1 is overexpressed along with shRNAs targeting candidate RNA-binding proteins or LacZ as a negative control. The red bar indicates a positive control shRNA against SNAI1 and the orange bars indicate shRNAs targeting QKI and RBFOX1. The knockdown efficiency is shown in Figure 2—figure supplement 3D. n = 4, ***, p<0.001; **, p<0.01; *, p<0.05, Student’s two-tailed t-test. (F–I) The effect of CRISPR/Cas9-targeting of endogenous QKI or RBFOX1 in HMLE cells ectopically expressing SNAI1 on: (F) the percentage of CD44-high cells, (G) EMT marker expression (VIM: mesenchymal marker, CDH1: epithelial marker) quantified by qPCR, (H) EMT marker expression quantified by immunoblotting and (I) mammosphere formation. Also shown is the efficiency of gene knockout as quantified by immunoblotting. (B) n = 4, (C) n = 4, (E) n = 3, ***, p<0.001; **, p<0.01; *, p<0.05, Student’s two-tailed t-test. (J) Summary of effects of ORFs on EMT markers and phenotypes.
Figure 2—figure supplement 1

Functional validation of candidate RNA-binding proteins in cellular assays.
(A) Validation of individual candidate ORFs by CD44 status. (Upper) Immunoblot analysis of ORF expression. The ORFs were tagged with a V5 epitope in the lentiviral expression vector (the TGFBR2 ORF contains a termination codon before the V5 tag). The expression of the indicated ORFs were analyzed using a V5 antibody. (Lower left) Flow cytometry plots of CD44 staining. The y-axis shows CD44 staining while the x-axis shows side scatter (SSC). (Lower right) Quantification of the percentage of CD44 high cells. n = 3, *, p<0.05, Student’s two-tailed t-test. (B) Change in the expression of mesenchymal (FN1, VIM, ZEB1) and epithelial (CDH1, KRT14) markers in HME cells expressing splicing factors normalized to a negative control (EGFP). Cells expressing SNAI1 served as a positive control. Fold-changes in gene expression were quantified by qPCR in cells that expressed the corresponding ORFs (data corresponds to heatmap in Figure 2A). n = 3. *, p<0.05; **, p<0.01, student’s two-tailed t-test. (C) Representative images of the mammospheres in HMLE cells that express the indicated ORFs as quantified in Figure 2C.
Figure 2—figure supplement 2
QKI and RBFOX1 are regulated by EMT-TFs and promote tumor formation.
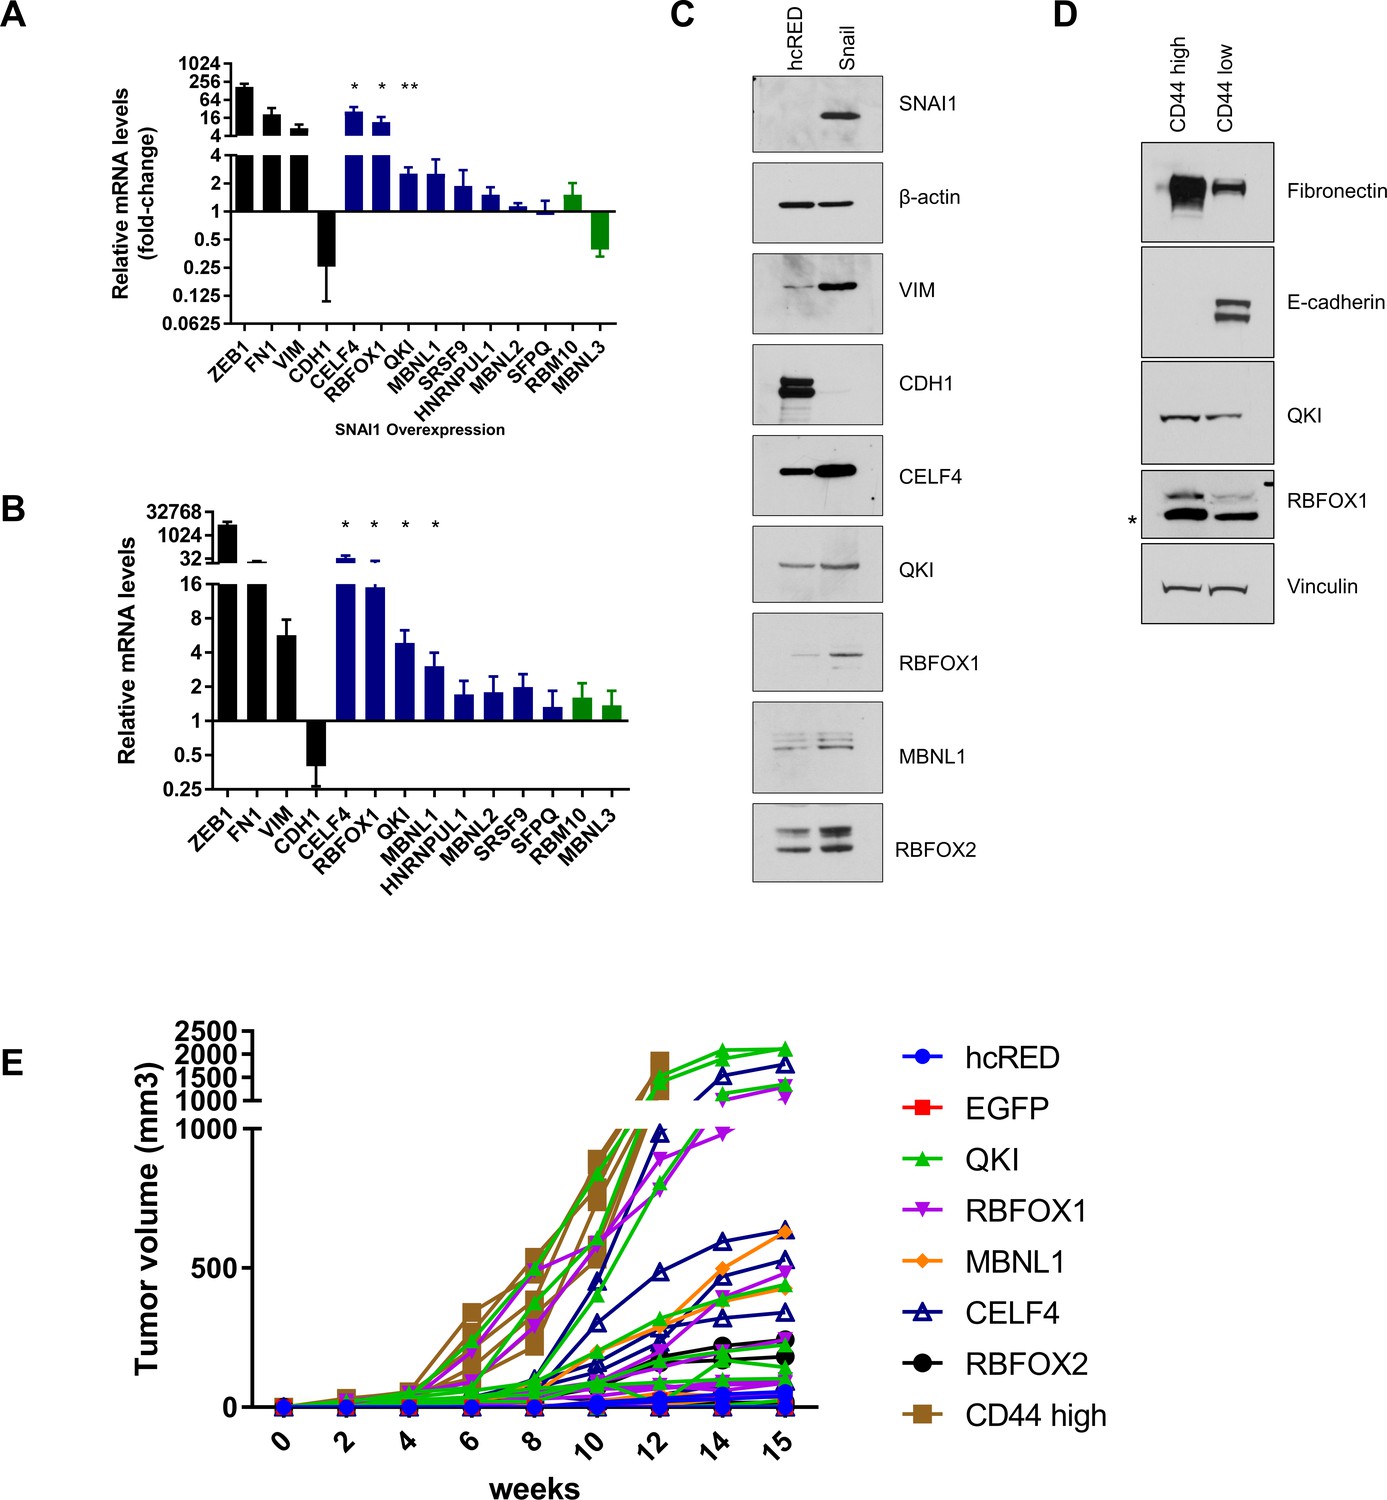
(A–B) Change in endogenous mRNA expression level of RBPs in HME cells undergoing an EMT by ectopic expression of SNAI1 (A) or ZEB1 (B), as quantified by qPCR and relative to control HME cells expressing hcRED. n = 5, **, p<0.01; *, p<0.05, Student’s two-tailed t-test. (C) Levels of RBPs in HME cells expressing hcRED or SNAI1, quantified by immunoblotting. (D) HMLER cells were sorted as CD44 high or CD44 low cells as shown in Figure 1—figure supplement 1A. The expression of candidate RNA-binding proteins (QKI and RBFOX1), a mesenchymal marker (Fibronectin) and an epithelial marker (E-cadherin) were analyzed by immunoblotting. (E) Tumor growth curve over the course of 15 weeks. The tumor volumes are summarized in Figure 2D.
Figure 2—figure supplement 3
QKI and RBFOX1 promote an intermediate mesenchymal cell state.
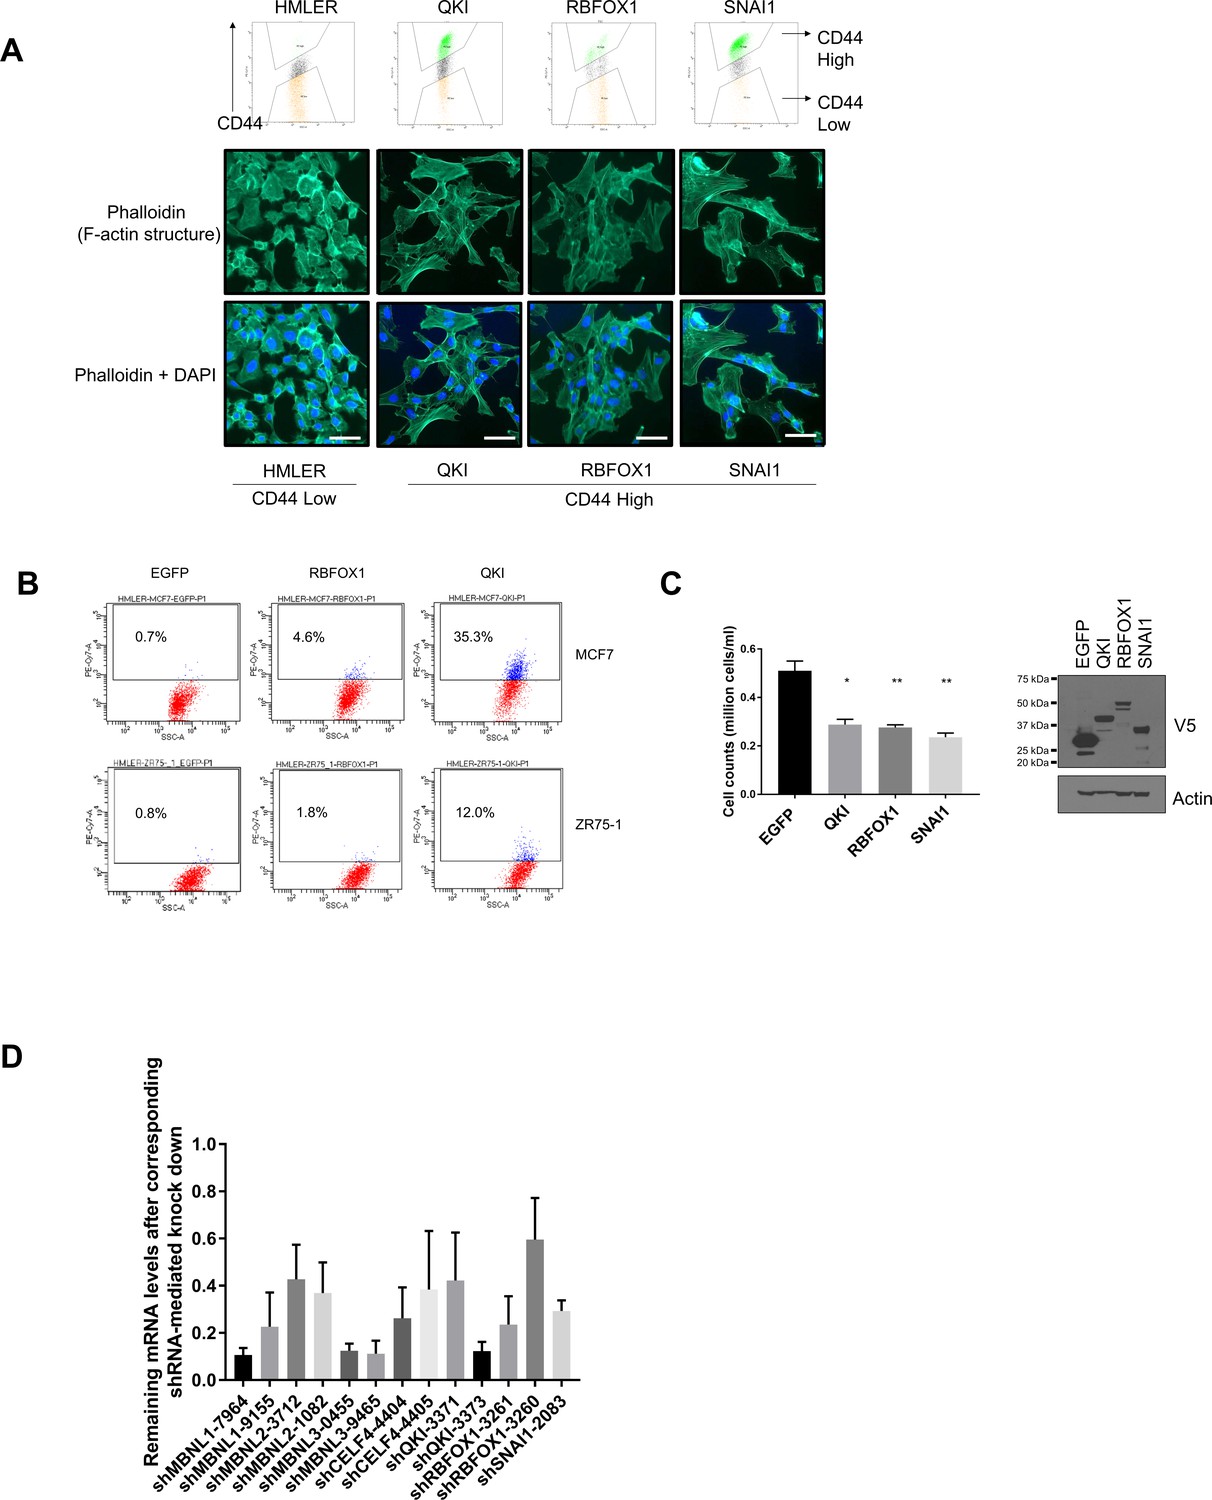
(A) Cell morphologies of the CD44-high cells induced by QKI, RBFOX1 and SNAI1. (Upper) HMLER cells expressing QKI, RBFOX1 or SNAI1 were subjected to cell sorting for CD44 high populations by FACS. (Lower) CD44-high cells induced by QKI, RBFOX1 or SNAI1 were stained for actin structures by Phalloidin. Representative pictures were shown for each cell lines. (B) Levels of CD44 as measured by flow cytometry in multiple cell lines including MCF7 and ZR75-1 with ectopic expression of EGFP, RBFOX1 or QKI. (C) The impact of QKI and RBFOX1 overexpression in cell proliferation. 10,000 HME cells expressing EGFP, QKI, RBFOX1 and SNAI1 were plated in six-well plates and cell numbers were counted after 6 days of propagation. (Left) Relative cell number quantification. (Right) Immunoblot showing the expression of the indicated V5-tagged ORFs. n = 5; *p<0.05; **p<0.01, student’s t test. (D) The efficiency of shRNA-mediated gene suppression as quantified by qPCR for the remaining amount of the corresponding mRNAs (related to Figure 2E).
Figure 2—figure supplement 4
The expression of QKI and RBFOX1 are altered in murine and human tumor samples that have undergone an EMT.
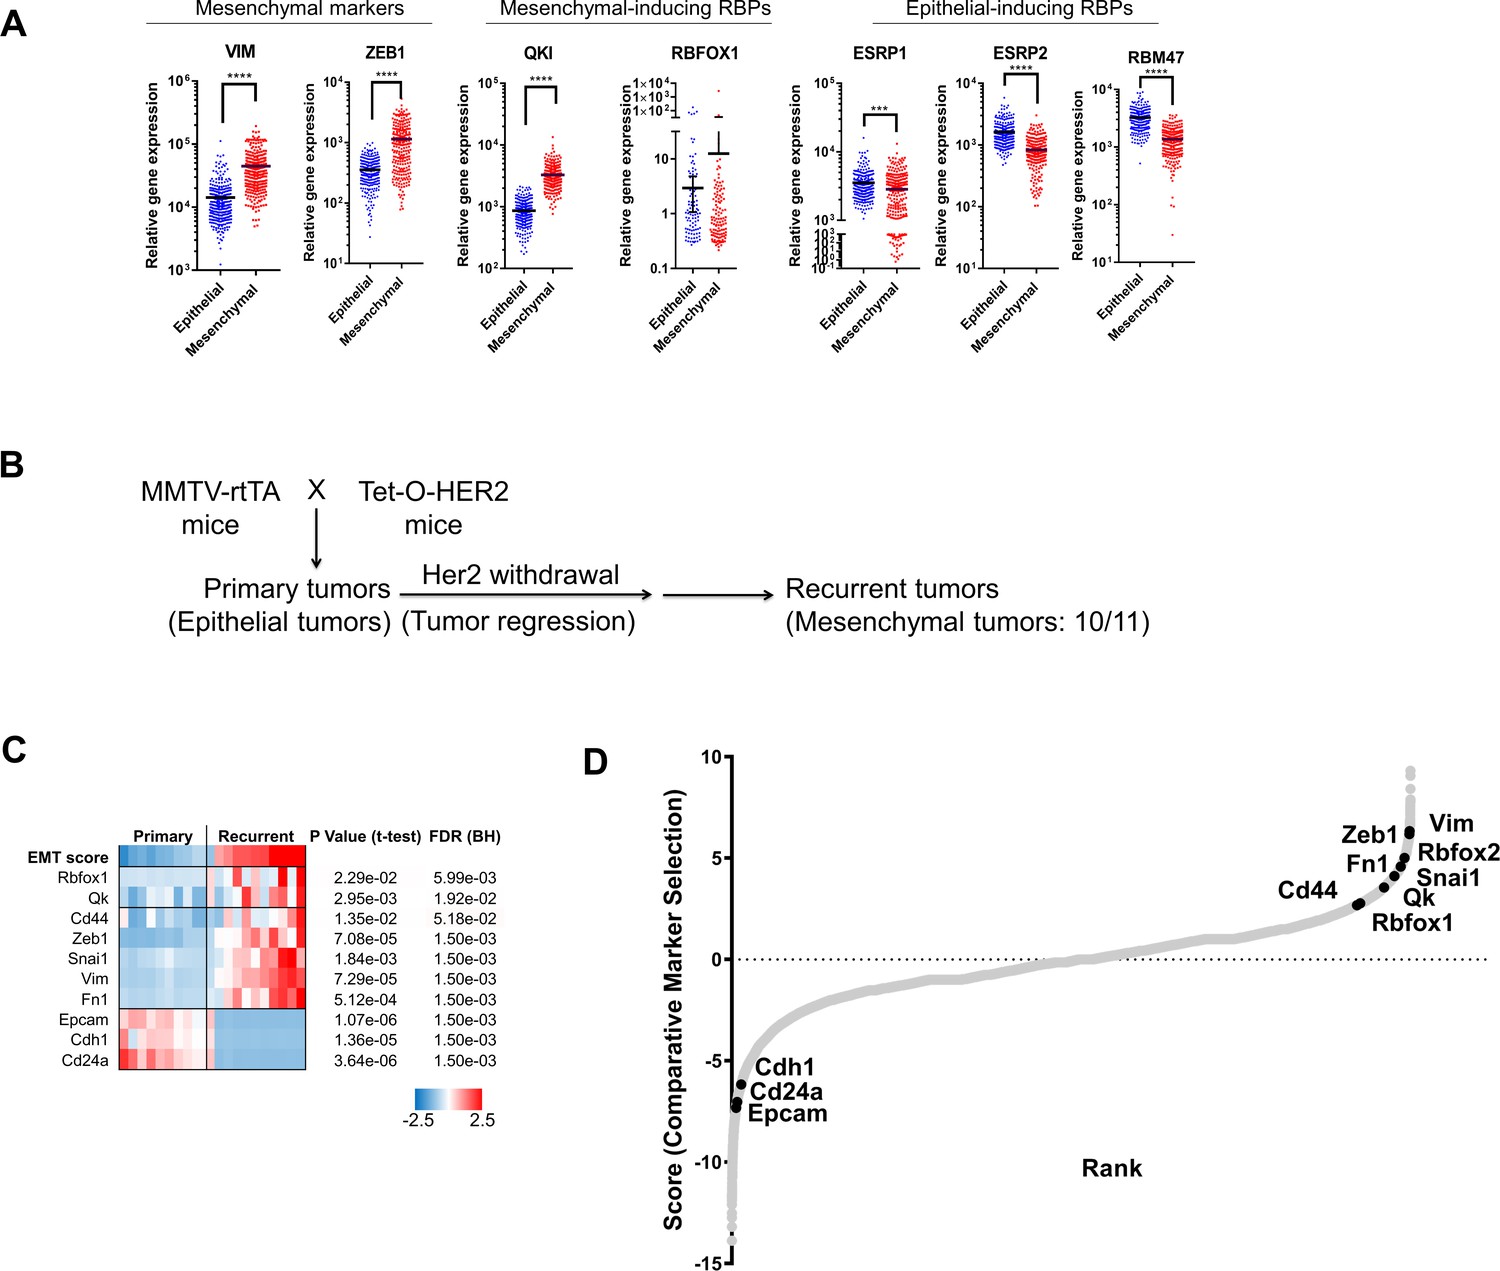
(A) The gene expression levels of QKI, RBFOX1, other RBPs, and mesenchymal markers in TCGA breast invasive carcinoma (BRCA) patient samples. Tumors were defined as epithelial or mesenchymal based on a published gene expression signature generated in breast cancer cell lines (Charafe-Jauffret et al., 2006; Ciriello et al., 2015). Epithelial samples, n = 242; mesenchymal samples, n = 242. **** p<1e-4, student two-tailed t-test. (B) Scheme of the generation of HER2-positive murine mammary tumors, as reported previously (Goel et al., 2016). TetO-HER2 (tetracycline-operator-HER2) transgenic founders were bred with MMTV-rtTA mice (reverse tetracycline-controlled transactivator under control of the mouse mammary tumor virus promoter), producing MMTV-rtTA/tetO-HER2 bitransgenic mice. Sustained HER2 expression leads to induction of mammary carcinoma. Subsequent withdrawal of HER2 expression leads to tumor regression followed by tumor recurrence in approximately two-thirds of mice. The recurrent tumors showed substantial upregulation of mesenchymal markers and downregulation of epithelial markers in 10 out of 11 recurrent tumors subjected to RNA-sequencing analysis. In the previous report, immunoblotting and histology staining also confirmed that an EMT occurs under these conditions (Goel et al., 2016). (C) Heatmap showing the expression of splicing factors (Qk and Rbfox1), mesenchymal-associated markers (Zeb1, Snai1, Vim, Fn1 and Cd44) and epithelial-associated markers (Cdh1, Epcam and Cd24a) in murine mammary tumor samples. The p value and False Discovery Rate (FDR) are also shown. (D) Identification of genes that were differentially expressed between primary tumors and the recurrent tumors depicted in (B) by comparative marker selection analysis, a module in GenePattern. The differentially expressed genes were ranked from left to right. EMT markers and RBPs are shown.
Figure 3 with 1 supplement

Identification of splicing targets regulated by QKI and RBFOX1.
(A) Quantification of the different types of alternative splicing events regulated by QKI or RBFOX1 overexpression as determined using rMATS. Exclusion or inclusion are relative to control cells overexpressing EGFP. (B) RT-PCR validation of individual splicing events regulated by QKI or RBFOX1. The cDNA from cells expressing the indicated ORFs were subjected to PCR amplification using primers flanking the alternative exon. The ratios of the intensity of the upper (inclusion) and lower (exclusion) PCR product bands were quantified and the relative intensity of the upper band is indicated. Below are shown RNA-sequencing based quantification of the % inclusion of the alternative exon. n = 3 (EGFP, HcRed and RBFOX1) or n = 2 (QKI and SNAI1).
-
Figure 3—source data 1
QKI rMATS splicing output.
- https://doi.org/10.7554/eLife.37184.014
-
Figure 3—source data 2
RBFOX1 rMATS splicing output.
- https://doi.org/10.7554/eLife.37184.015
Figure 3—figure supplement 1
RNA sequencing analysis of HME cells expressing QKI and RBFOX1.
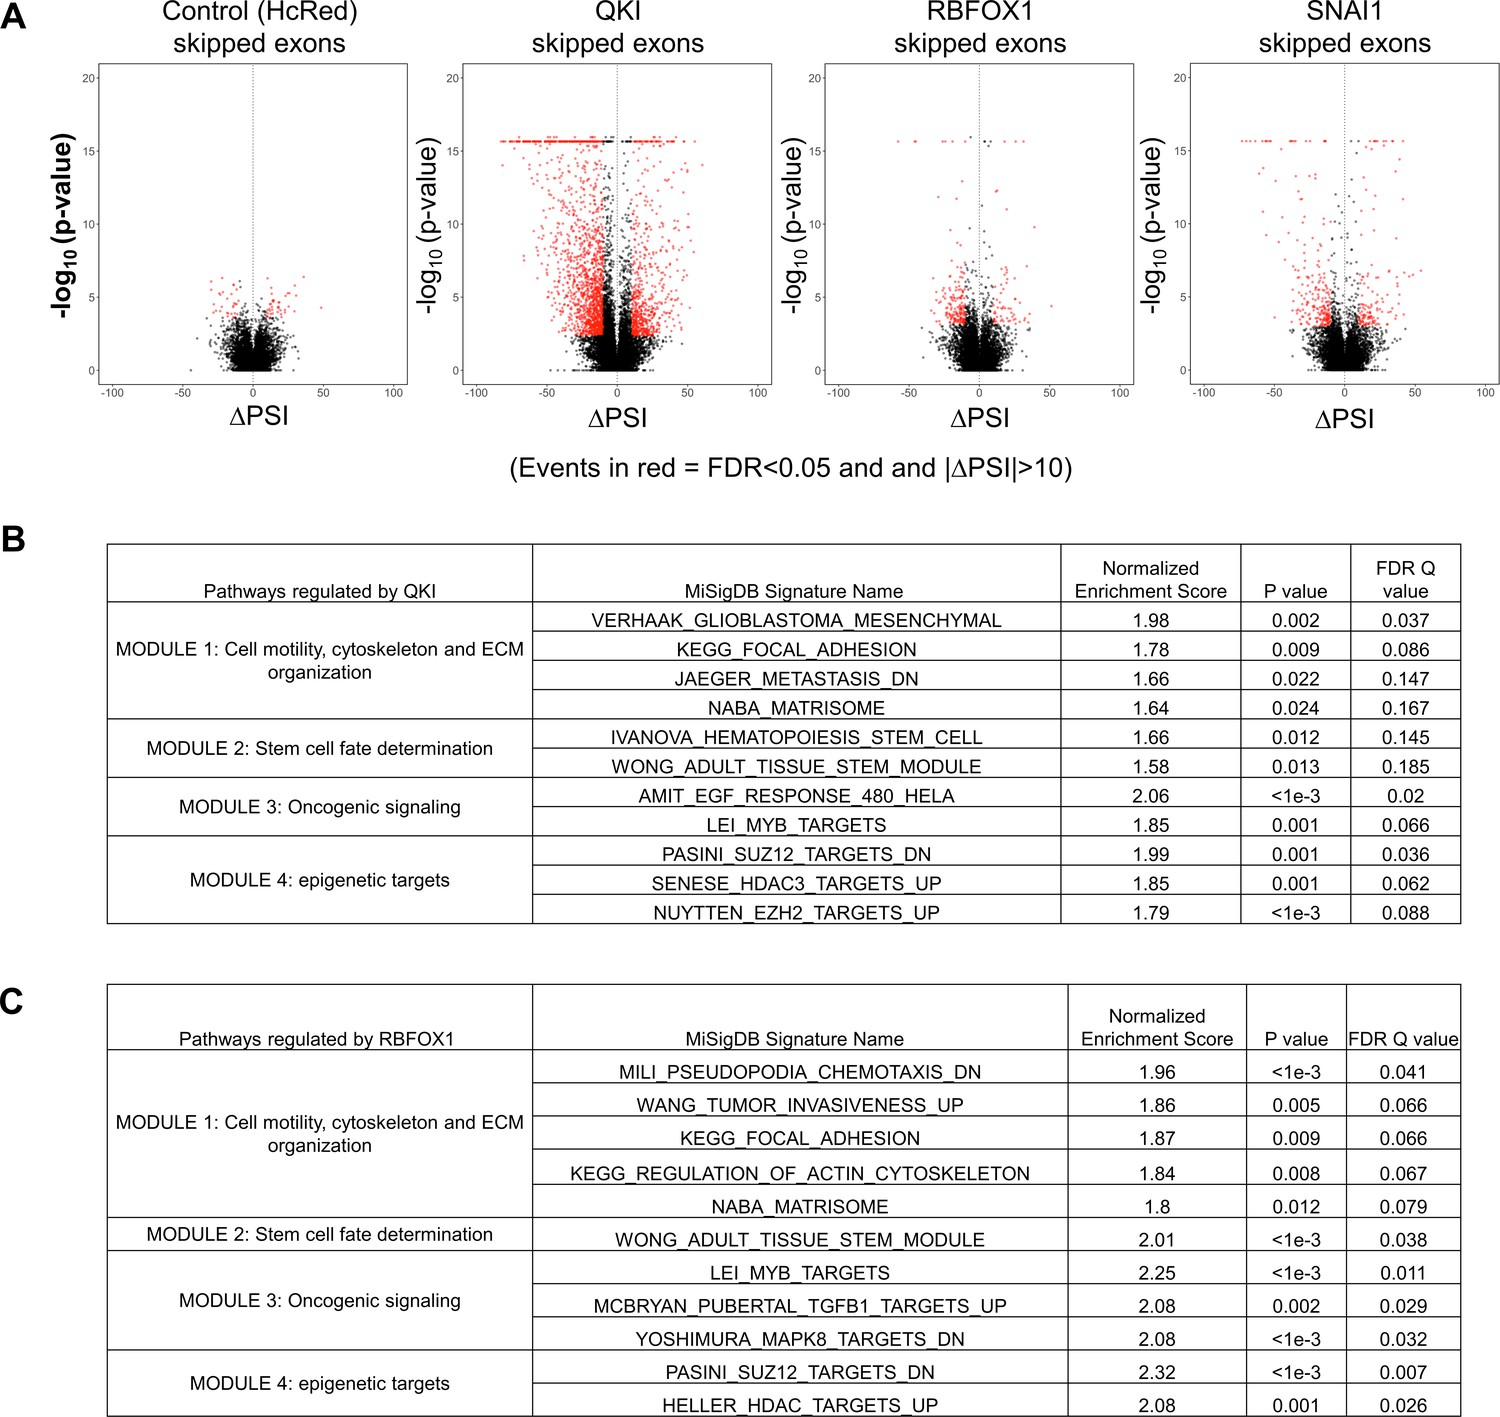
(A) Volcano plots of the change in ‘Percentage Spliced In’, or ∆PSI (x-axis), versus the –log10(p value) (y-axis) for alternatively skipped exons in HME cells expressing hcRED, QKI, RBFOX1 or SNAI1, in comparison to cells expressing EGFP. (B, C) Genes with alternatively skipped exons regulated by QKI (B) or RBFOX1 (C) were analyzed by pre-ranked gene set enrichment analysis (GSEA) and the enriched Geneset pathways and their normalized enrichment scores, P and FDR Q values are shown.
Figure 4 with 1 supplement
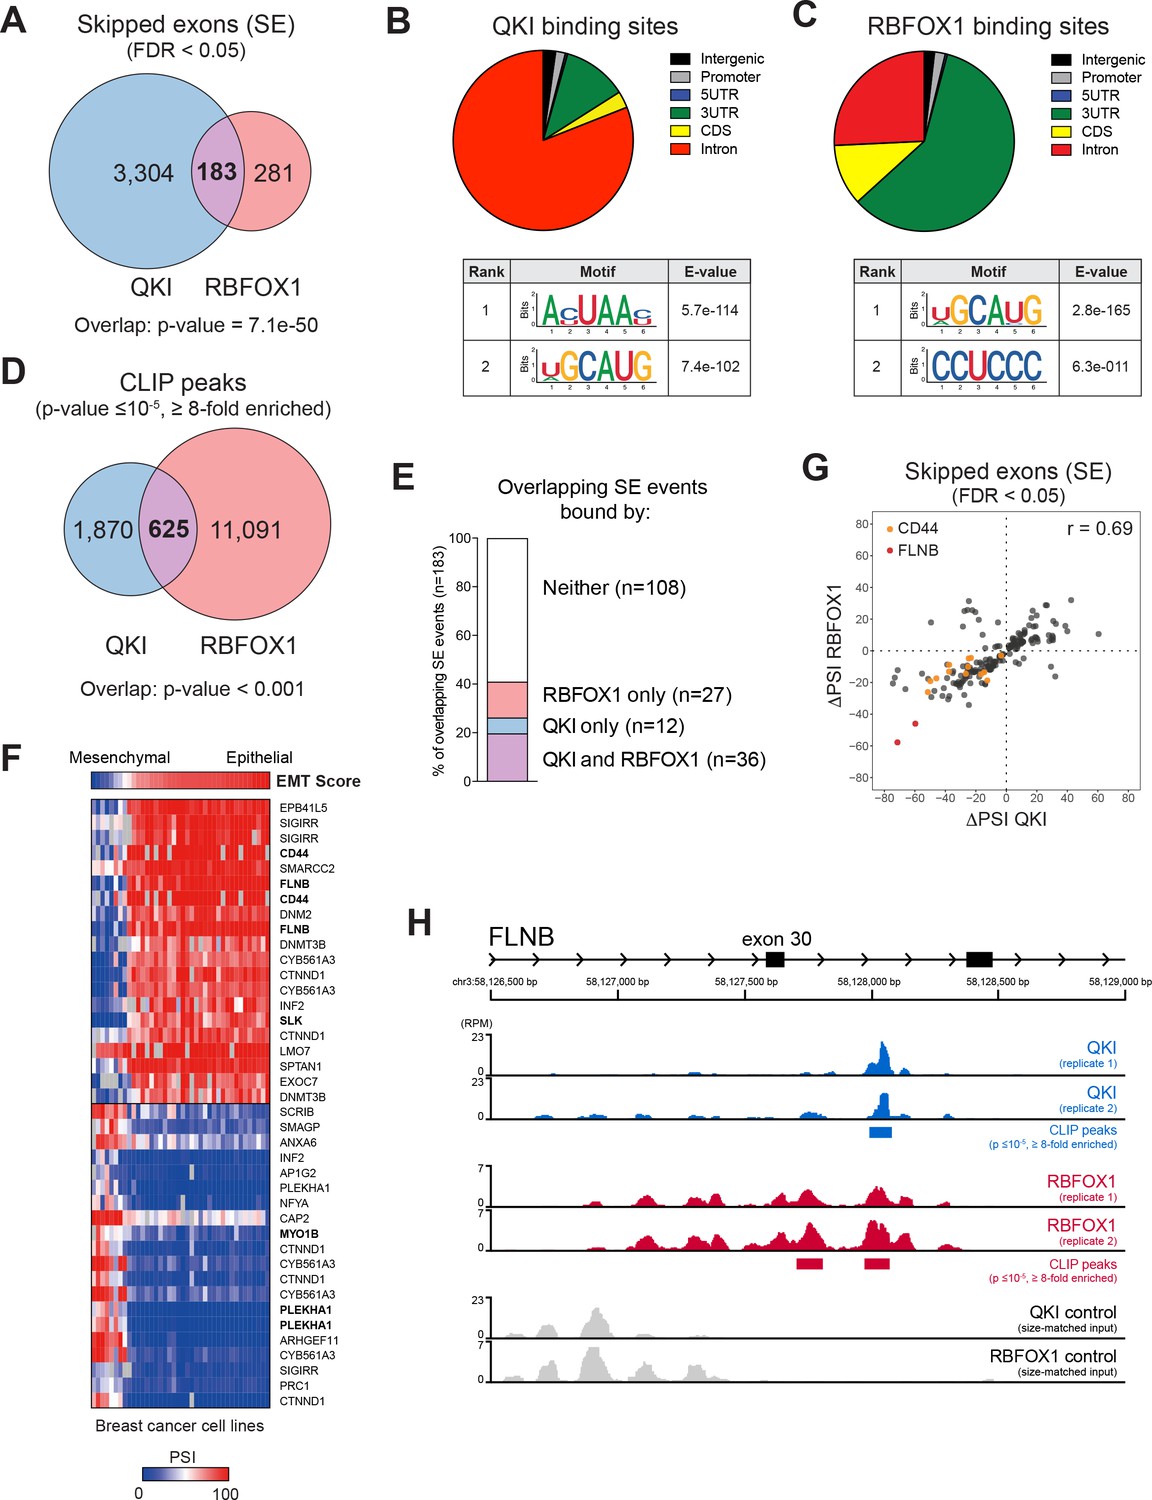
QKI and RBFOX1 cooperatively regulate the alternative splicing of common downstream targets, including FLNB.
(A) Venn diagram illustrating the overlap in skipped exons regulated by QKI and RBFOX1, as detected by RNA-seq. The significance of overlap was determined by Fisher’s exact test. (B, C) Binding distributions and de novo motifs identified from eCLIP-seq analysis of significant peaks (p≤10−5, fold-enrichment ≥8). The QKI (B) or RBFOX1 (C) binding distributions are shown in pie charts (upper). Below are shown the top two ranked QKI (B) and RBFOX1 (C) binding motifs. (D) Venn diagram illustrating the overlap in binding peaks detected by eCLIP-seq analysis of QKI and RBFOX1. p<0.001, as determined by random shuffling of one set of peaks and repeated testing of the extent of overlap. (E) Percentage of SE splicing events regulated by both QKI and RBFOX1 (n = 183), that contain CLIP-binding peaks located in the exon or flanking introns, for either or both proteins. (F) Heatmap depicting the association between an EMT signature score (top row) and AS events in a panel of breast cancer cell lines. Shown are the top 20 AS events that are positive or negatively associated with the EMT score. (G) Scatter plot of the change in ‘Percentage Spliced In’ (PSI) for SE events shared between QKI and RBFOX1. ΔPSI values are for each ORF relative to EGFP. Colored dots indicate events in CD44 or FLNB. (H) Tracks indicate eCLIP-seq read density for QKI and RBFOX1 at FLNB exon 30, normalized to a million total usable reads. Below each pair of replicate tracks are shown significant binding peaks called by CLIPper software (p≤10−5, fold-enrichment ≥8). Also shown are size-matched input controls for each pair of replicates.
-
Figure 4—source data 1
QKI and RBFOX1 overlapping events.
- https://doi.org/10.7554/eLife.37184.018
-
Figure 4—source data 2
QKI and RBFOX1 CLIP peaks.
- https://doi.org/10.7554/eLife.37184.019
Figure 4—figure supplement 1

RNA-Seq and eCLIP-Seq analysis of HME cells expressing QKI and RBFOX1.
(A) (Upper) Venn diagrams illustrating the overlap in AS events regulated by QKI and RBFOX1 for each AS event type, including alternative 5’ splice sites (A5SS), alternative 3’ splice sites (A3SS), mutually exclusive exons (MXE) and retained introns (RI) (related to Figure 4A). The significance of overlapping events was determined by Fisher’s exact test and p values are shown. (Lower) Scatter plot of the change in ‘Percentage Spliced In’ (PSI) for the corresponding alternative splicing events shared between QKI and RBFOX1. ΔPSI values are for each ORF relative to EGFP (related to Figure 4G). (B) Schematic of the eCLIP-seq experiment. Briefly, protein-RNA interactions were stabilized with UV crosslinking followed by immunoprecipitation. The RNA was then ligated to a 3’ end adapter and reverse-transcribed. An additional adapter was ligated to the 3’ end of the cDNA and the cDNA was amplified by PCR for Illumina sequencing. The crosslinked sites (‘RT stops’) correspond to the 5’ end of sequenced reads and allow the identification of specific protein-RNA interaction sites. (C) Interaction between QKI and RBFOX1 as determined by immunoprecipitation of endogenous QKI protein followed by immunoblotting for QKI, RBFOX1 or vinculin. The cell lysate was pretreated with the indicated concentration of RNase at room temperature for 20 min (left). Cell lysate was pretreated with 50 ng/ml of RNase before the immunoprecipitation of endogenous QKI proteins (right).
Figure 5 with 1 supplement

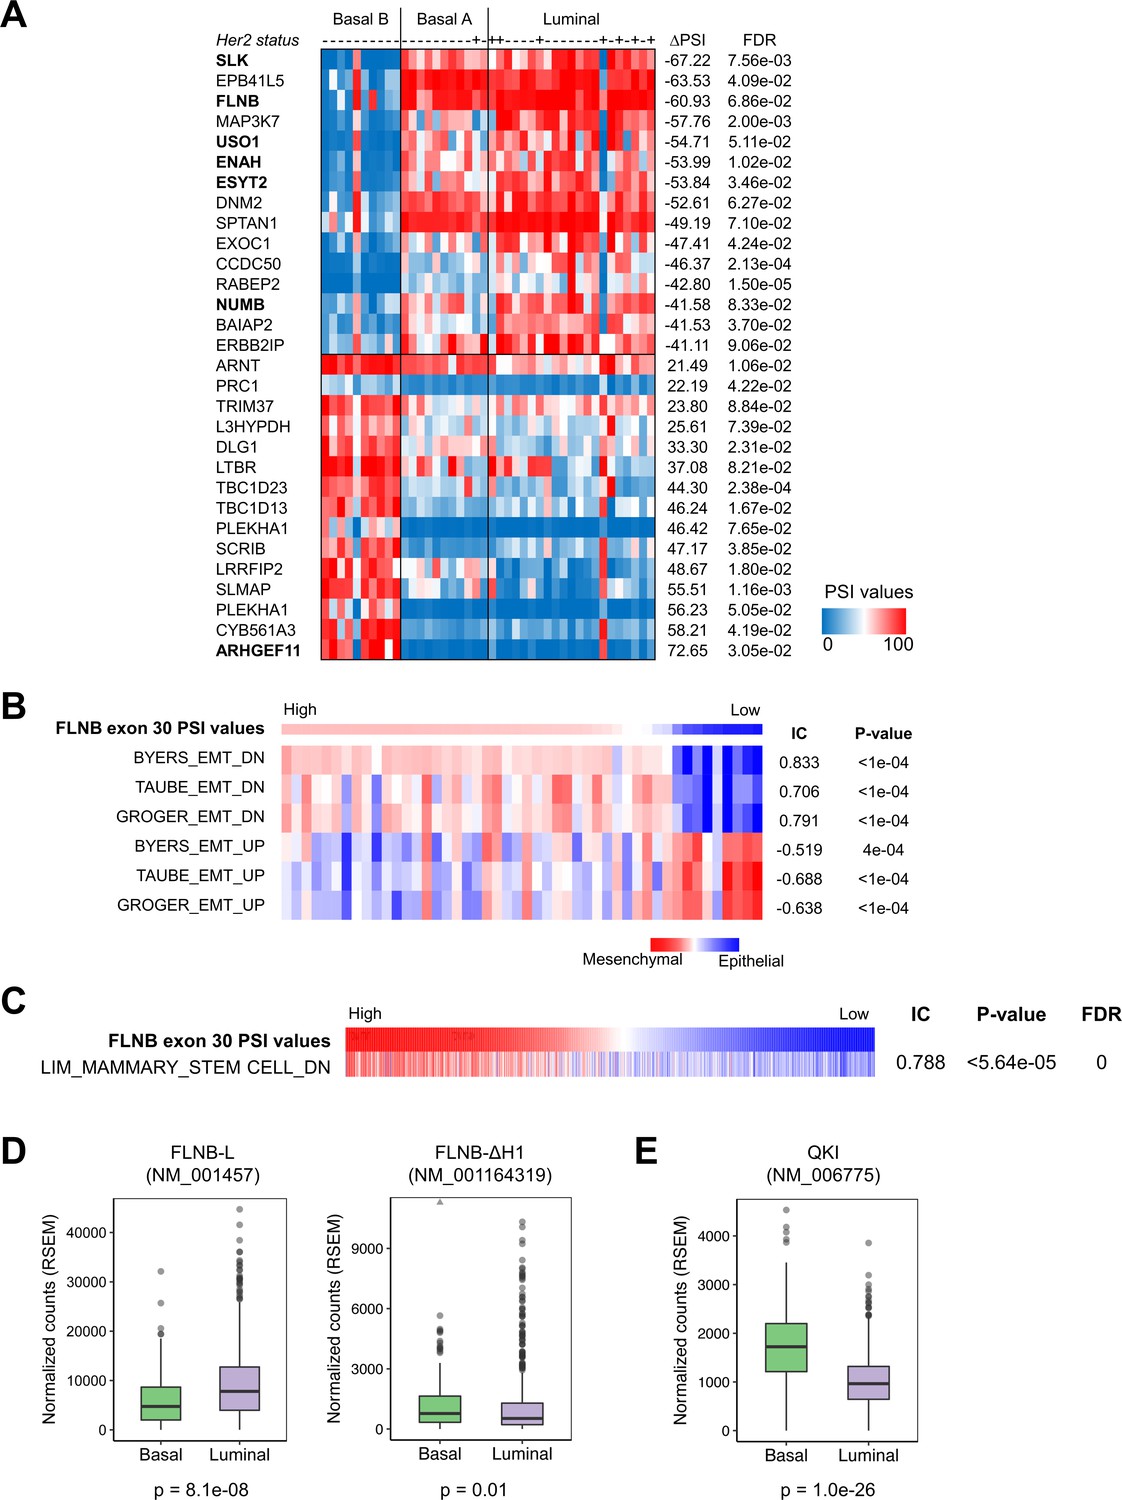
Alternative splicing of FLNB exon 30 is strongly associated with basal-like breast cancer.
(A) FLNB exon 30 PSI in all CCLE breast cancer cell lines. RT-PCR validation of FLNB exon 30 splicing in two Basal B cell lines (BT549 and MDAMB231) and two luminal cell lines (ZR75-1 and MCF7) is shown on the right. (B) CCLE cell lines (except hematopoietic cell lines, n = 787) were ranked by their FLNB exon 30 Percent Spliced In (PSI) values, and associated gene expression signatures were analyzed by the REVEALER program. The top associated signatures with their Information coefficient (IC), p values and False Discovery Rates (FDR) are shown.
Figure 5—figure supplement 1
Alternative splicing of FLNB exon 30 and the expression of QKI correlate with EMT-related gene signatures in cancer cell lines and TCGA breast cancer patient samples.
(A) CCLE breast cancer cell lines were classified by subtype (Basal B, Basal A and Luminal). Alternatively spliced genes are ranked by the difference in the PSI value between the Basal B, Luminal and Basal A subtypes. The HER2 status of these cell lines is also shown. (B) Breast cancer cell lines in CCLE were sorted by their FLNB exon 30 PSI values, and associated features were assessed by the REVEALER algorithm. Multiple independent EMT signatures were highly enriched. Their Information Coefficient (IC), p value and False Discovery Rate (FDR) values are shown. (C) All CCLE cell lines, except hematopoietic cell lines, were ranked by their FLNB exon 30 PSI values, and a mammary stem cell signature was shown to correlate with the AS of FLNB. The correlation co-efficiency (IC), p value and False Discovery Rate (FDR) values are shown. (D, E) Gene expression of two FLNB isoforms (FLNB-L and FLNB-ΔH1) (D) and QKI (E) in breast invasive carcinoma patient samples analyzed by TCGA. Basal samples, n = 136; Luminal samples, n = 591. Two tailed t-test.
Figure 6 with 1 supplement
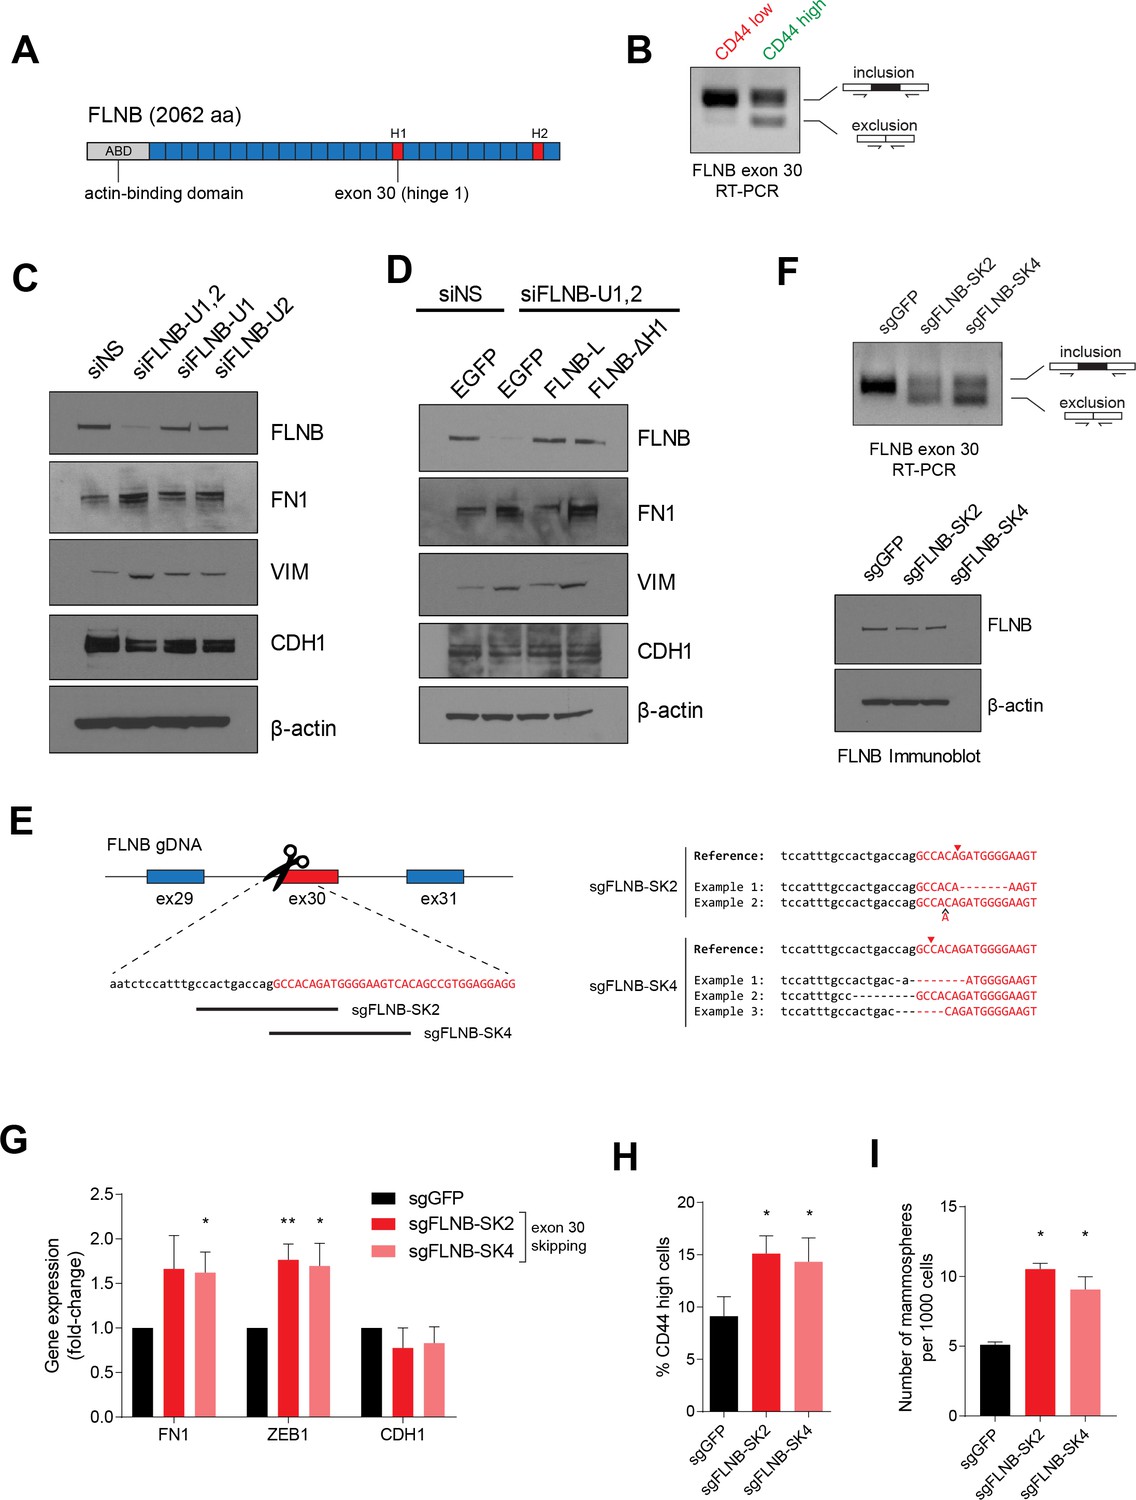
FLNB isoform switching promotes the mesenchymal cell state.
(A) Schematic of FLNB (Filamin B) protein domain structure, which contains an N-terminal actin-binding domain (ABD, shown in yellow), 24 filamin repeats (shown in blue) and two hinge domains (H1 and H2, shown in red). The exon 30 of FLNB encodes the first hinge domain (H1). (B) CD44-high and CD44-low HMLER cells were sorted and FLNB AS was analyzed by RT-PCR with primers flanking FLNB exon 30. The CD44-high HMLER cells were spontaneously generated. (C) The expression of FLNB was suppressed by siRNAs against FLNB 3’UTR region (FLNB-U1, U2 and UTR1,2) in HMLE cells. FLNB-U1,2 is a pool of FLNB-U1 and FLNB-U2 siRNAs. Protein levels of FN1, VIM (mesenchymal markers), CDH1 (epithelial marker) and FLNB after FLNB suppression was quantified by immunoblotting. (D) The expression of FLNB was rescued by FLNB-L (FLNB long isoform) or FLNB-ΔH1 (FLNB lacking H1 domain) after endogenous FLNB depletion by siRNA targeting the UTR of FLNB (FLNB-U1,2). Protein levels of FN1, VIM (mesenchymal markers), CDH1 (epithelial marker) and FLNB were quantified by immunoblotting. (E) Schematic of CRISPR/Cas9-mediated targeting of the FLNB intron 29 - exon 30 junction. (Left) Guide RNAs were designed to target the junction of FLNB intron 29 (in lower-case black letters) and exon 30 (in capital red letters). (Right) Examples of modifications to the junction induced by sgRNAs sgFLNB-SK2 and sgFLNB-SK4 are shown. (F) FLNB exon 30 skipping and total FLNB levels were quantified in cells expressing sgRNAs targeting the junction of FLNB intron 29 and exon 30 by RT-PCR (upper) and immunoblot (lower) (corresponding to Figure 6E). (G–I) Effect of CRISPR/Cas9-mediated modulation of the FLNB-L/FLNB-ΔH1 ratio on the expression of mesenchymal and epithelial markers as examined by qPCR (G), on the expression of CD44 as analyzed by flow cytometry (H), and on the number of mammosphere formed per 1000 cells cultured in low attachment condition (I). n = 4 for (G), n = 6 for (H), n = 3 for (I). *, p<0.05; **, p<0.01, Student’s two-tailed t-test compared to sgGFP controls.
Figure 6—figure supplement 1
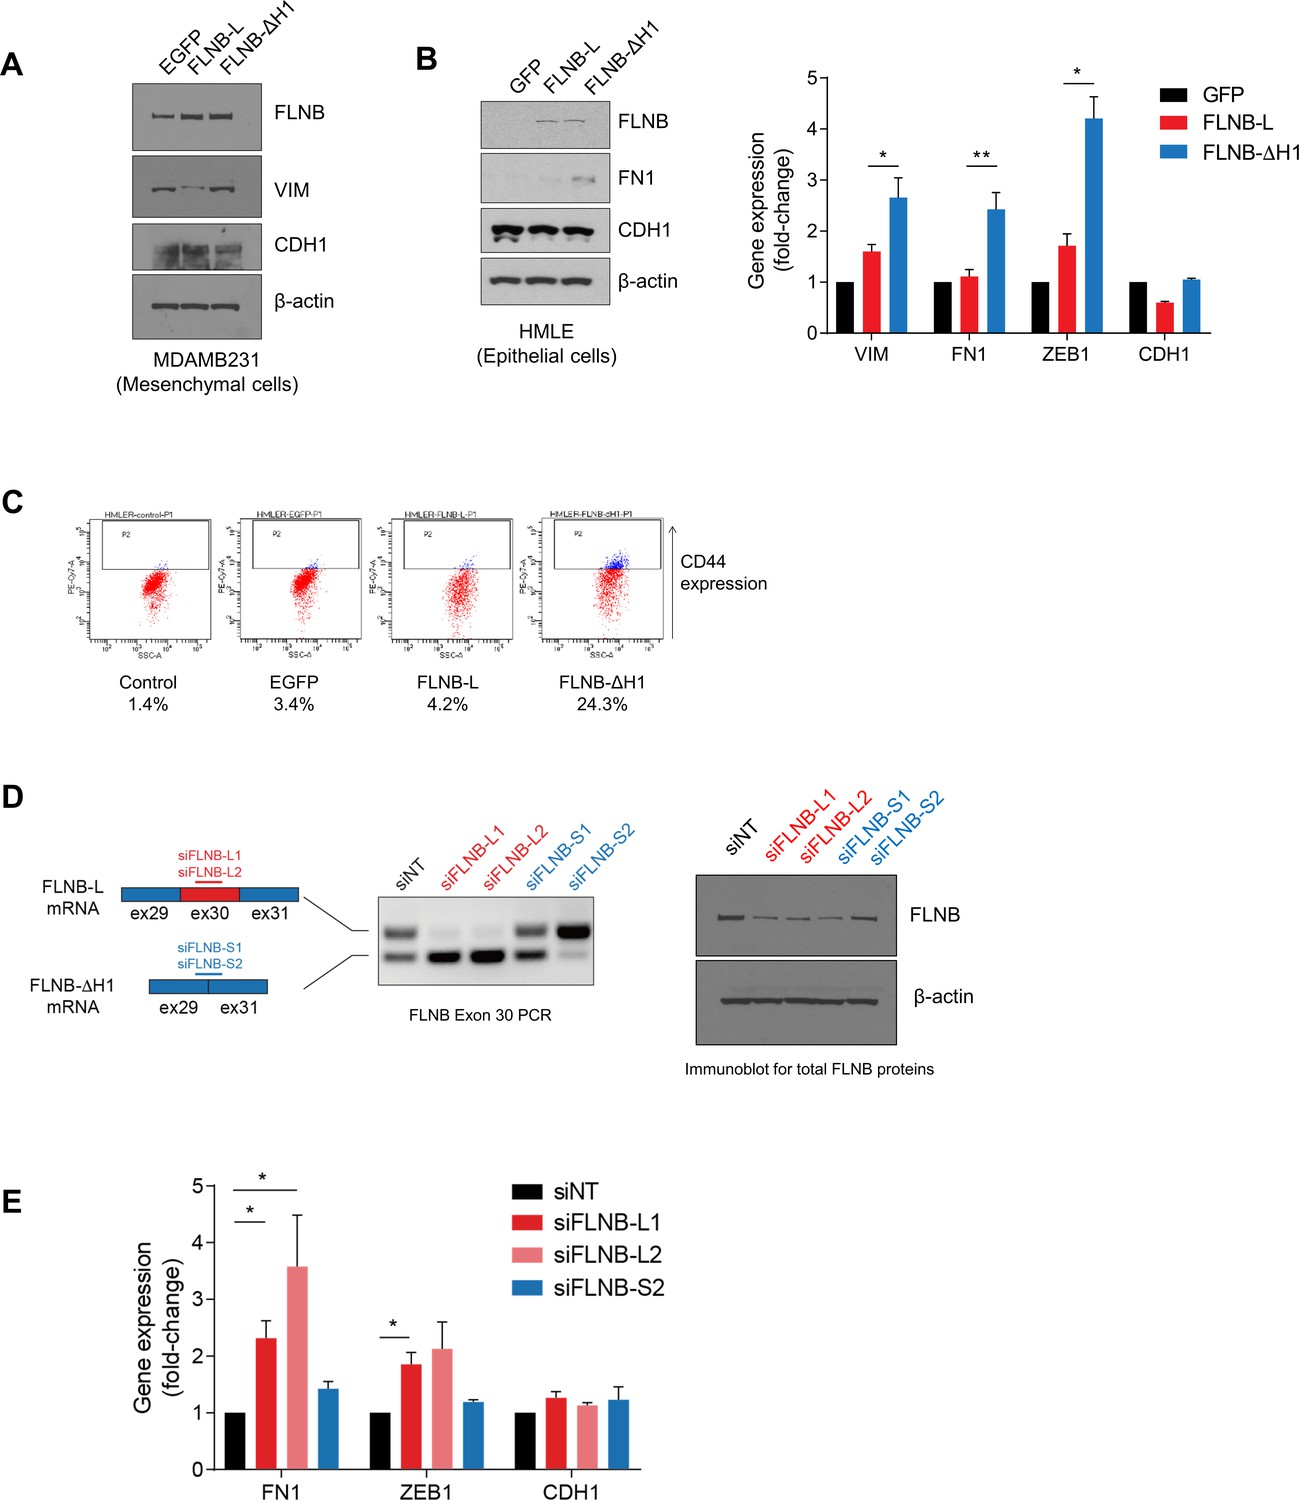
FLNB regulates EMT.
(A) Protein levels of VIM (mesenchymal marker) and CDH1 (epithelial marker) after the ectopic expression of control GFP, FLNB-L or FLNB-ΔH1 in a mesenchymal cell line, MDA-MB-231 cells, as quantified by immunoblotting. (B) EMT makers were quantified by immunoblotting (left) or qPCR (right) after the ectopic expression of control GFP, FLNB-L or FLNB-ΔH1 in an epithelial cell line, HMLE cells. n = 4, *, p<0.05; **, p<0.01, Student’s two-tailed t-test between FLNB-L and FLNB-ΔH1. (C) CD44 expression in HMLE cells expressing different isoforms of FLNB, as measured by flow cytometry. (D) Schematic depicting the siRNAs used to regulate FLNB isoform ratios. Upper, siFLNB-L1 and siFLNB-L2 (in red) target the alternative exon 30. Lower, siFLNB-S1 and siFLNB-S2 (in blue) target the junction between exon 29 and exon 31. Exon 30 splicing and total FLNB levels were assessed by RT-PCR and immunoblot (right). (E) Effect of siRNA-mediated modulation of FLNB-L/FLNB-ΔH1 ratio on the expression of mesenchymal and epithelial markers, as measured by qPCR. n = 3, *, p<0.05, Student’s two-tailed t-test.
Figure 7 with 1 supplement
EMT mediated by FLNB isoform switching is dependent on the FOXC1 transcription factor.
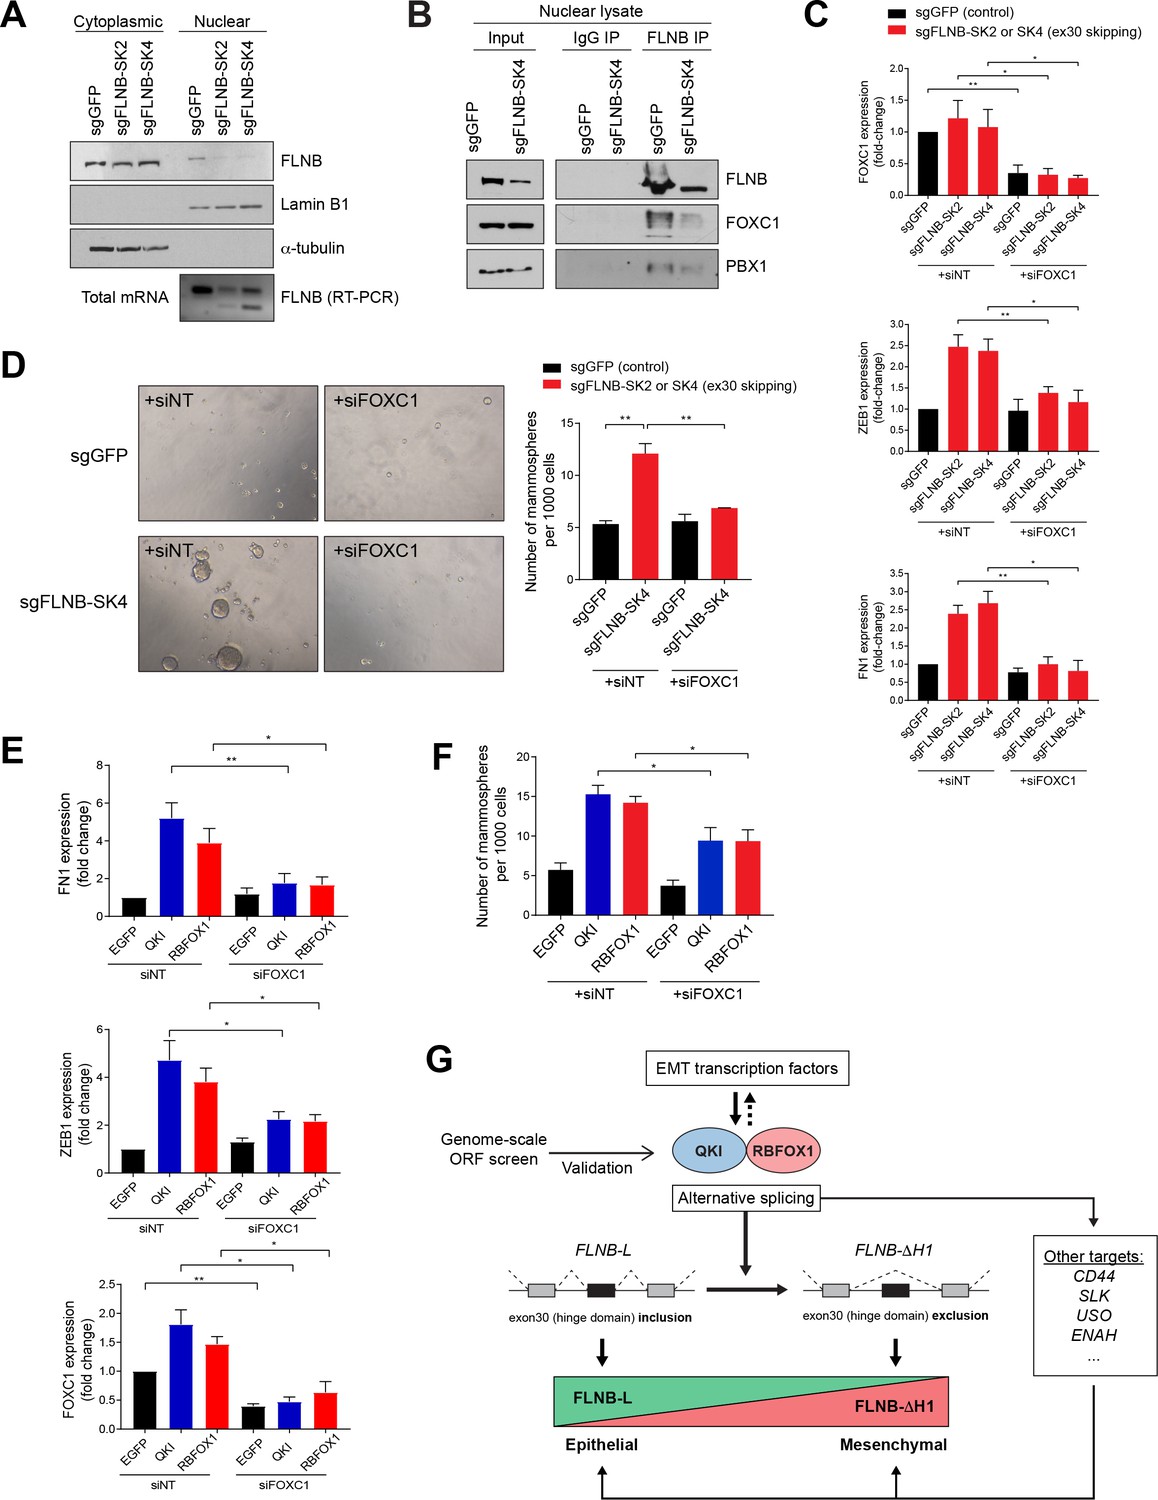
(A) Analysis of nuclear and cytoplasmic fractions of FLNB. HMLE cells expressing Cas9 and sgRNAs targeting GFP (sgGFP, as control) or targeting the FLNB intron 29 - exon 30 junction to induce exon skipping (sgFLNB-SK2 and SK4, described in Figure 6E), were subjected to subcellular fractionation. The levels of FLNB proteins in the nuclear and cytoplasmic fractions were analyzed by immunoblotting and the skipping of exon 30 was confirmed by RT-PCR. The nuclear levels of FLNB is diminished when exon 30 is skipped. (B) Interaction between FLNB, FOXC1 and PBX1 in the nucleus as determined by immunoprecipitation followed by immunoblotting. HMLE cells expressing Cas9 and sgRNAs targeting GFP (sgGFP, as control) or targeting the FLNB intron 29 - exon 30 junction to induce exon skipping (sgFLNB-SK4, described in Figure 6E), were subjected to immunoprecipitation analysis using nuclear protein extract. The interaction between FLNB and FOXC1 in the nuclear extract was reduced largely due to the decrease in nuclear FLNB levels. (C) The depletion of FOXC1 diminishes the upregulation of mesenchymal markers (ZEB1 and FN1) mediated by FLNB exon 30 skipping (sgFLNB-SK2 and SK4, shown in red bars) as measured by qPCR. n = 6, *, p<0.05; **, p<0.01, Student’s two-tailed t-test. The knockdown efficiency for FOXC1 is shown in the upper panel. (D) The rate of mammosphere formation in HMLE cells that expressed the indicated sgRNAs and transfected with a FOXC1 siRNA pool. The number of mammospheres per 1000 cells plated was counted. Representative images (left) and quantification (right) are shown. n = 3, **, p<0.01, Student’s two-tailed t-test. (E, F) Depletion of FOXC1 diminishes the upregulation of mesenchymal markers (E) and mammosphere formation (F) mediated by QKI and RBFOX1 expression, as measured by qPCR (E) and mammosphere formation assay (F). n = 6 for (E), n = 4 for (F). *, p<0.05; **, p<0.01, Student’s two-tailed t-test. (G) A model of the mechanism underlying the QKI and RBFOX1-induced mesenchymal and stem-like cell state.
Figure 7—figure supplement 1
EMT mediated by FLNB isoform switching is dependent on the FOXC1 transcription factor.
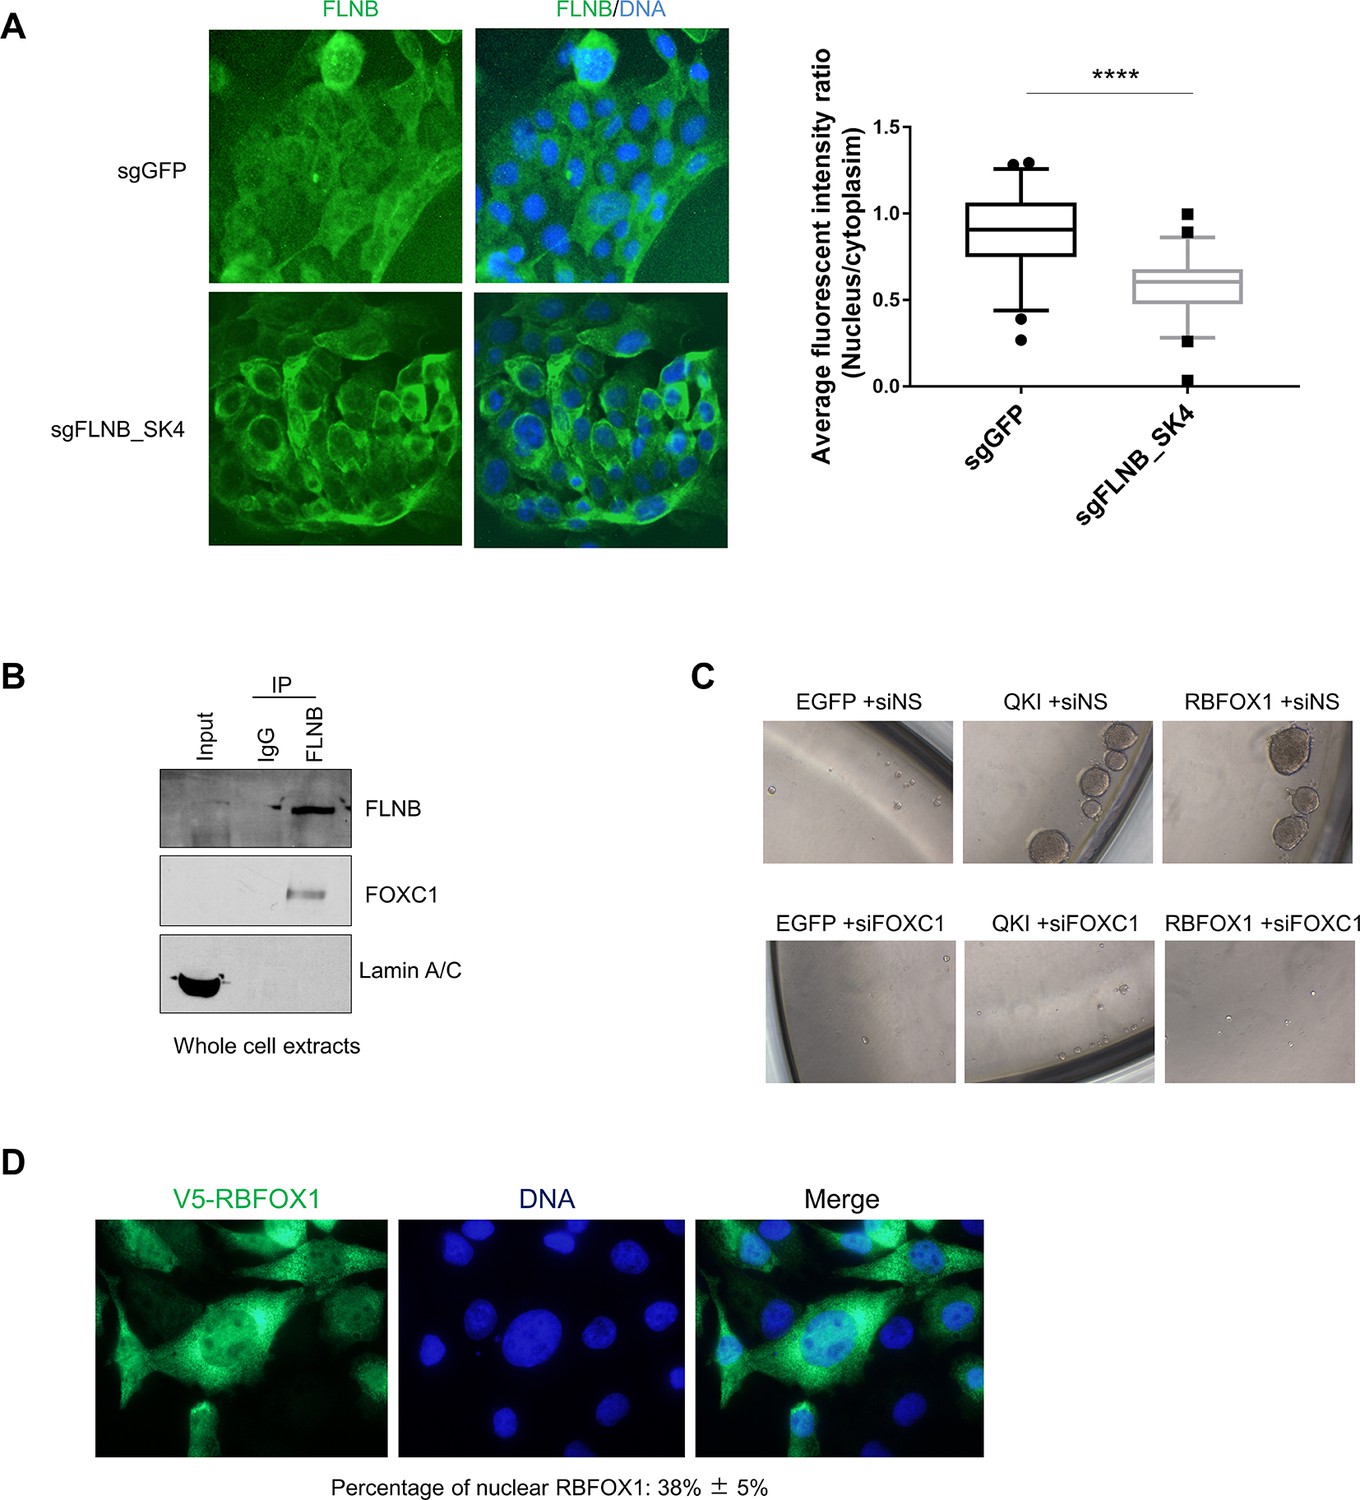
(A) Immunofluorescence analysis of the subcellular localization of FLNB isoforms in HMLE cells expressing Cas9 and sgRNAs targeting GFP or targeting the FLNB intron 29 - exon 30 junction to induce exon skipping (sgFLNB-SK4, described in Figure 6E) (related to Figure 7A). The ratios of average fluorescence intensity in the nucleus to that in the cytoplasm (nucleus/cytoplasm) were quantified by ImageJ software (n = 50 for each group. ****p=1.64e-11, student’s t test). (B) Immunoprecipitation followed by immunoblotting to assess the interaction between endogenous FLNB and FOXC1 in HMLE whole cell lysates. (C) Representative images of mammosphere formation in HMLE cells that expressed the indicated ORFs or sgRNAs. The number of mammospheres per 1000 cells plated was counted and quantification is shown in Figure 7F. (D) Immunofluorescent staining of V5-RBFOX1 (NM_145893.2) in human mammary epithelial cells using V5 antibody. Fluorescent intensity was quantified by ImageJ software. The percentage of nuclear RBFOX1 (NM_145893.2) is 38 ± 5%.
Author response image 1
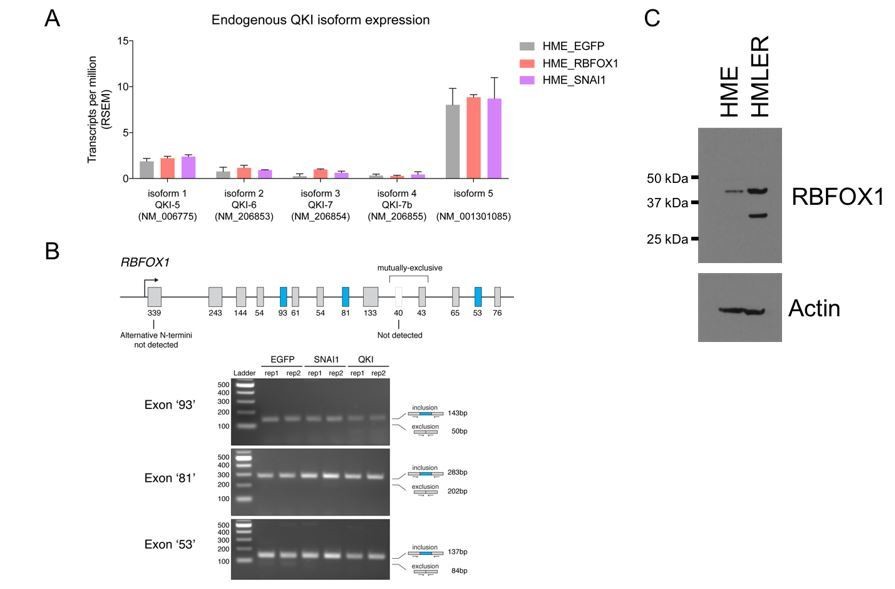
Endogenous QKI and RBFOX1 isoform expression in HME and HMLER cells.
(A) Expression of endogenous QKI isoforms based on RSEM quantification of RNA-sequencing data in HME cells expressing control EGFP, RBFOX1, or SNAI1. (B) RT-PCR for alternatively spliced exons in endogenous RBFOX1 in HME cells expressing control EGFP, SNAI1 or QKI. (C) Immunoblots for RBFOX1 protein expression in HME or HMLER cells.
Author response image 2
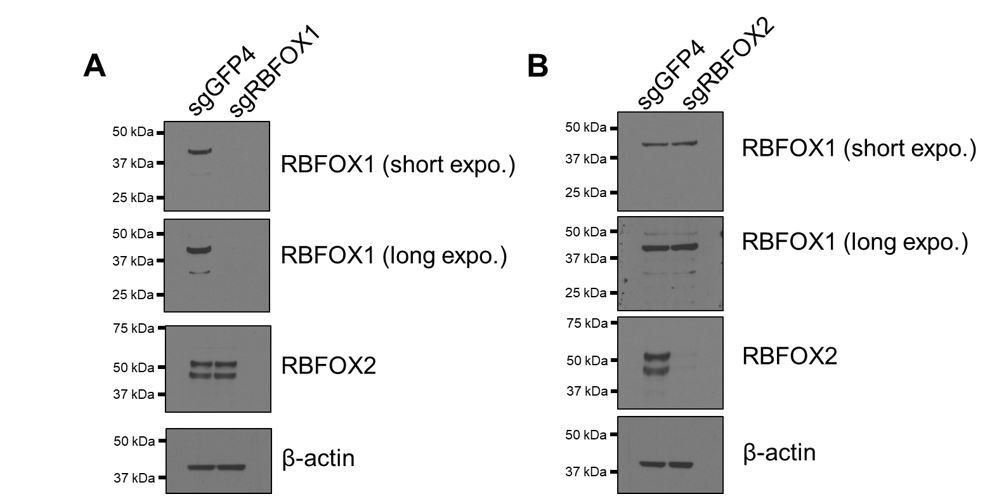
Verification of RBFOX1 antibody specificity.
RBFOX1 (A) or RBFOX2 (B) was depleted by CRISPR-Cas9-mediated knock out in HMLE cells. RBFOX1 and RBFOX2 proteins were detected by the corresponding antibodies.
Tables
Key resources table
| Reagent type or resource | Designation | Source or reference | Identifiers | Additional information |
|---|---|---|---|---|
| Antibody | anti-Pan-QKI | Millipore | MABN624 | |
| Antibody | anti-QKI | Bethyl | A300-183A RRID:AB_2173160 | |
| Antibody | anti-RBFOX1 | Sigma | SAB2100002 RRID:AB_10600323 | |
| Antibody | anti-MBNL1 | Santa-Cruz | sc-47740 RRID:AB_784435 | |
| Antibody | anti-MBNL2 | Santa-Cruz | sc-136167 RRID:AB_2140469 | |
| Antibody | anti-CELF4(Brunol4) | Santa-Cruz | sc-398292 | |
| Antibody | anti-RBFOX2 (RBM9) | Bethyl | A300-864A RRID:AB_609476 | |
| Antibody | anti-FLNB | Cell signaling | 12979S | |
| Antibody | anti-SNAI1 | Cell signaling | 3879S RRID:AB_2255011 | |
| Antibody | anti-Vinculin | Cell signaling | 4650S RRID:AB_10559207 | |
| Antibody | anti-V5 | Cell signaling | 13202 | |
| Antibody | anti-V5 (for eCLIP) | Life Technologies | R96025 RRID:AB_159313 | |
| Antibody | anti-CD44-PE-Cy7 | Affymetrix | 25-0441-81 RRID:AB_469622 | |
| Chemical compound, drug | siRNA NS #1 | GE Dharmacon | D-001810–01- 05 | |
| Chemical compound, drug | siFLNB-L1 (3019) | GE Dharmacon | CTM-237650/ LJBYN-000019 | |
| Chemical compound, drug | siFLNB-L2 (3021) | GE Dharmacon | CTM-237646/ LJBYN-000021 | |
| Chemical compound, drug | siFLNB-S1 (2923) | GE Dharmacon | CTM-237648/ LJBYN-000023 | |
| Chemical compound, drug | siFLNB-S2 (2925) | GE Dharmacon | CTM-237649/ LJBYN-000025 | |
| Chemical compound, drug | siFOXC1 smart pool of 4 siRNAs | GE Dharmacon | M-009318-01-0005 | |
| Chemical compound, drug | siFLNB-U1 (targeting UTR region of FLNB) | GE Dharmacon | CTM-206669 | |
| Chemical compound, drug | siFLNB-U2 (targeting UTR region of FLNB) | GE Dharmacon | CTM-206671 | |
| Chemical compound, drug | Lipofectamine RNAiMAX Transfection Reagent | thermofisher | 13778150 | |
| Commercial assay or kit | QIAamp DNA Mini Kit | Qiagen | 51304 | |
| Commercial assay or kit | RNeasy Mini kit | Qiagen | 74104 | |
| Gene | QKI | NCBI Reference | NM_006775.2 | |
| Gene | RBFOX1 | NCBI Reference | NM_145893.2 | |
| Strain, strain background | NCr-nude mice | Taconic | NCRNU,F, CrTac:NCr,Foxn1nu |
Additional files
-
Supplementary file 1
Antibodies, primer and oligo sequence
This file contains information for antibodies, and the sequence for primers and oligonucleotides that were used in this study.
- https://doi.org/10.7554/eLife.37184.026
-
Transparent reporting form
- https://doi.org/10.7554/eLife.37184.027
Download links
A two-part list of links to download the article, or parts of the article, in various formats.
Downloads (link to download the article as PDF)
Open citations (links to open the citations from this article in various online reference manager services)
Cite this article (links to download the citations from this article in formats compatible with various reference manager tools)
An alternative splicing switch in FLNB promotes the mesenchymal cell state in human breast cancer
eLife 7:e37184.
https://doi.org/10.7554/eLife.37184


