Visualizing conformational dynamics of proteins in solution and at the cell membrane
- University of Washington, United States
Figures
Figure 1

MBP as a model system for optimizing and validating ACCuRET.
(A) X-ray crystal structure of MBP bound to maltose (PDB ID: 1N3X) showing the positions of the donor and acceptor FRET pairs at the top (295 and 237, respectively) and bottom (322 and 309, respectively) of the clamshell, with the distance represented by dashed lines. The distance separating the 295/237 FRET pair decreases and the 322/309 FRET pair increases with maltose binding (Video 1). (B) Soluble MBP was studied in a cuvette in a fluorometer (left), and membrane-bound MBP was studied in membranes of unroofed cells (right). The red dot represents bound metal, the blue side-chain represents L-Anap, and the squiggle at the membrane represents protein lipidation at the engineered CAAX site.
Figure 2 with 1 supplement
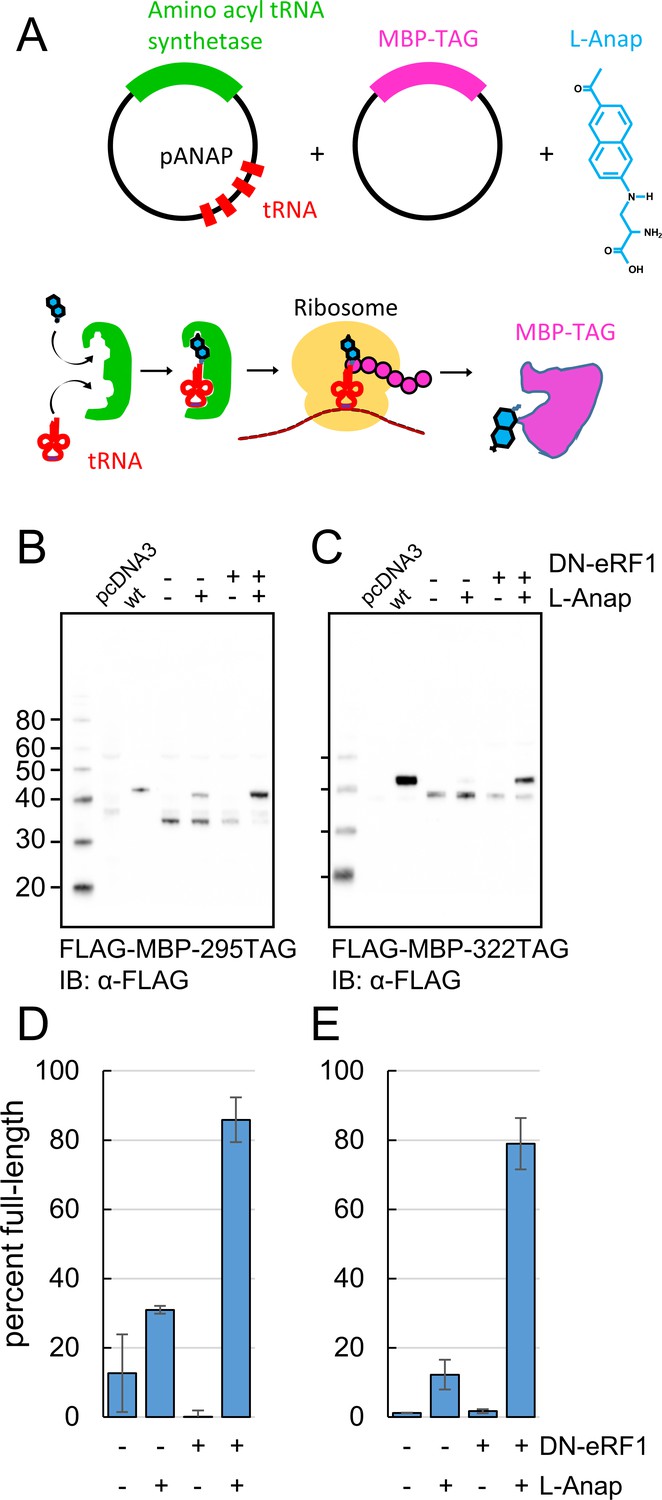
Incorporation of the fluorescent noncanonical amino acid L-Anap into MBP as the FRET donor.
(A) Cartoon representation of amber codon suppression strategy for site-specific incorporation of L-ANAP into MBP. (B–C) Full-length protein for MBP-TAG constructs, where TAG indicates that the construct includes an internal amber stop codon, was produced with L-ANAP-ME and increased with DN-eRF1 cotransfection. Western blots are shown of clarified lysates of cells cotransfected with (B) MBP-295TAG or (C) MBP-322TAG, pANAP, and either with (+) or without (-) DN-eRF1, and cultured with (+) or without (−) L-ANAP-ME in the medium. The blots were probed with an anti-FLAG antibody that recognizes both truncated and full length MBP. Vector only transfected cells (pcDNA3) were used as a negative control and wild-type MBP (wt) was used as a positive control. The amount of wild-type MBP loaded on the gel was less than the amount of the TAG mutations. As discussed in Materials and methods, all MBP constructs used in this work included an N-terminal FLAG epitope. (D–E) Quantitation of the percent of full-length product of (D) MBP-295TAG or (E) MBP-322TAG under the same conditions as B and C. Shown are mean ±SEM with n = 3.
Figure 2—figure supplement 1
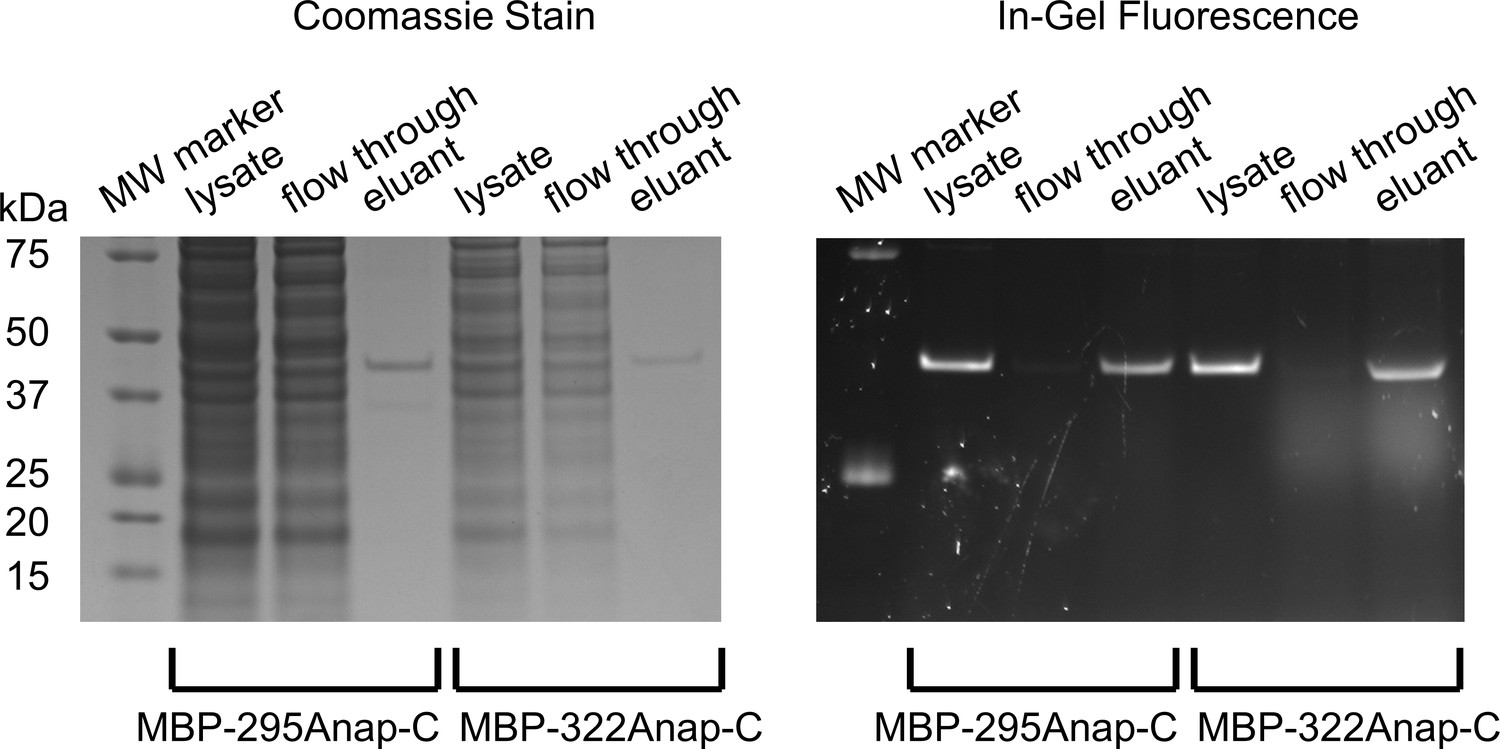
SDS-PAGE showing purification of MBP constructs and specificity of Anap incorporation.
Coomassie stained (left) and in-gel fluorescence (right) images of gel during the stages of purification of for MBP-295Anap-C and MBP-322Anap-C: cleared cell lysate, flow through, and elutant from M2-anti-FLAG beads. Similar fractions of the lysates were loaded for each stage, but 10 times more lysate was used for MBP-295Anap than MBP-322Anap. The absence of other bands in the lysate suggest strong specificity for Anap incorporation in MBP. Note, all constructs contain an N-terminal FLAG epitope, as described in Materials and methods.
Figure 3
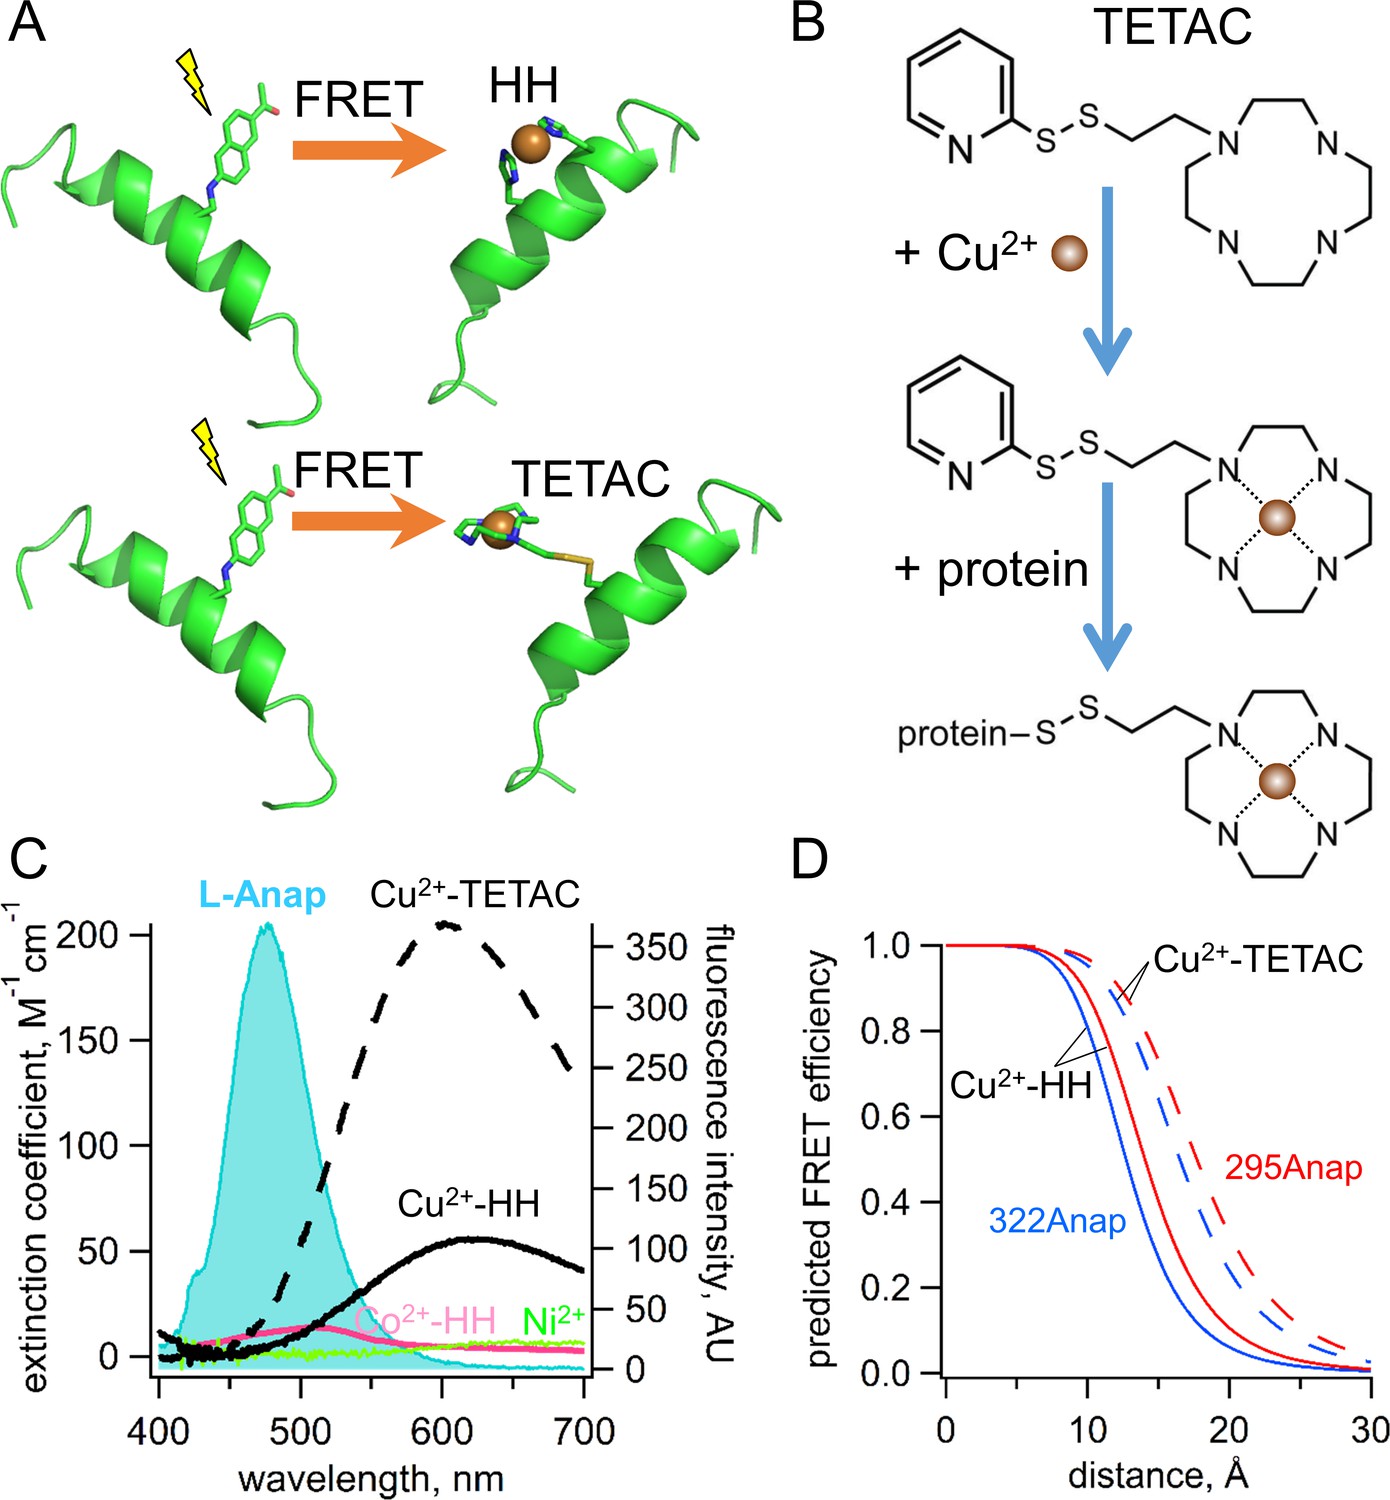
Incorporation of transition metal ions as the FRET acceptor using standard HH sites and TETAC.
(A) Diagram illustrating tmFRET between L-Anap (left) and transition metal (right) for two different types of metal-binding sites: a standard HH site (top) and TETAC site (bottom). (B) Structure of TETAC, binding of Cu2+ (brown ball), and reaction with a cysteine in a protein. (C) Spectral properties of free L-ANAP and Cu2+-TETAC make them an ideal FRET pair for measuring small distances on the order of 10–20 Å. The emission spectrum from L-Anap (blue) is overlaid on the absorption spectra of Cu2+-TETAC (dashed black line), Cu2+-HH (black line), Co2+-HH (magenta line) and Ni2+ (green line). (D) Distance dependence of the FRET efficiency predicted with the Förster equation for each of the two FRET pairs, MBP-295Anap (red line) and MBP-322Anap (blue line), for both Cu2+-TETAC (dashed line) and Cu2+-HH (solid line).
Figure 4
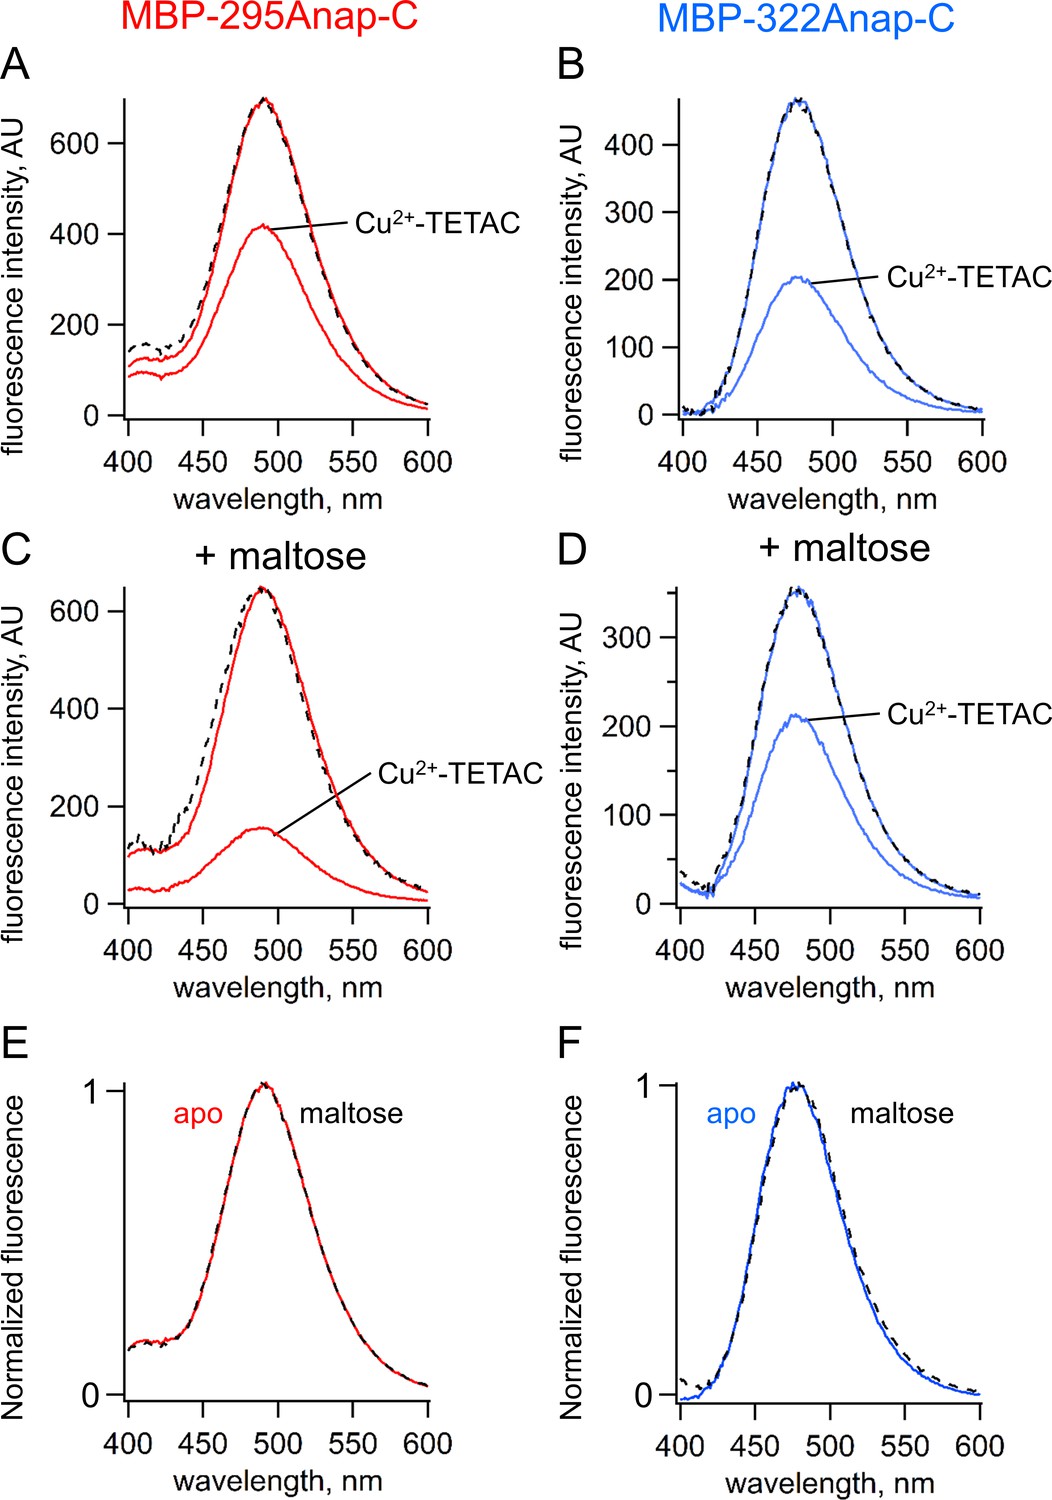
ACCuRET measures FRET and ligand-dependent changes in FRET.
(A–B) Emission spectra of L-Anap for (A) MBP-295Anap-C and (B) MBP-322Anap-C measured in a fluorometer, before and after addition of 10 µM Cu2+-TETAC to the cuvette. The fluorescence quenching reveals FRET between L-Anap and Cu2+-TETAC. (C–D) Emission spectra of L-Anap for (C) MBP-295Anap-C and (D) MBP-322Anap-C, before and after addition of 10 µM Cu2+-TETAC, in the presence of 10 mM maltose. Maltose produced an increased FRET in MBP-295Anap-C and decreased FRET in MBP-322Anap-C. The dashed lines in panels A-D represent the Cu2+-TETAC spectra scaled to the initial spectra. The similarity indicates that quenching produced little or no change in the shape of the emission spectra, consistent with a FRET mechanism. (E–F) Scaled emission spectra of L-Anap for (E) MBP-295Anap-C and (F) MBP-322Anap-C with and without maltose. The similarity suggests that Anap experiences little or no environmental changes with maltose binding.
Figure 5

Using ACCuRET to measure the dependence of the rearrangement in MBP on maltose concentration.
Plot of the fractional fluorescence of MBP-295Anap-C (Cys) and MBP-295Anap (no Cys), as indicated, after addition of Cu2+-TETAC, as a function of maltose concentration. Shown are mean ±SEM for n = 4. The smooth curve is a fit of a binding isotherm with an apparent affinity of 280 µM. The low affinity is expected from the W340A mutation we introduced into all of our MBP constructs to reduce binding to endogenous sugars (Martineau et al., 1990).
Figure 6
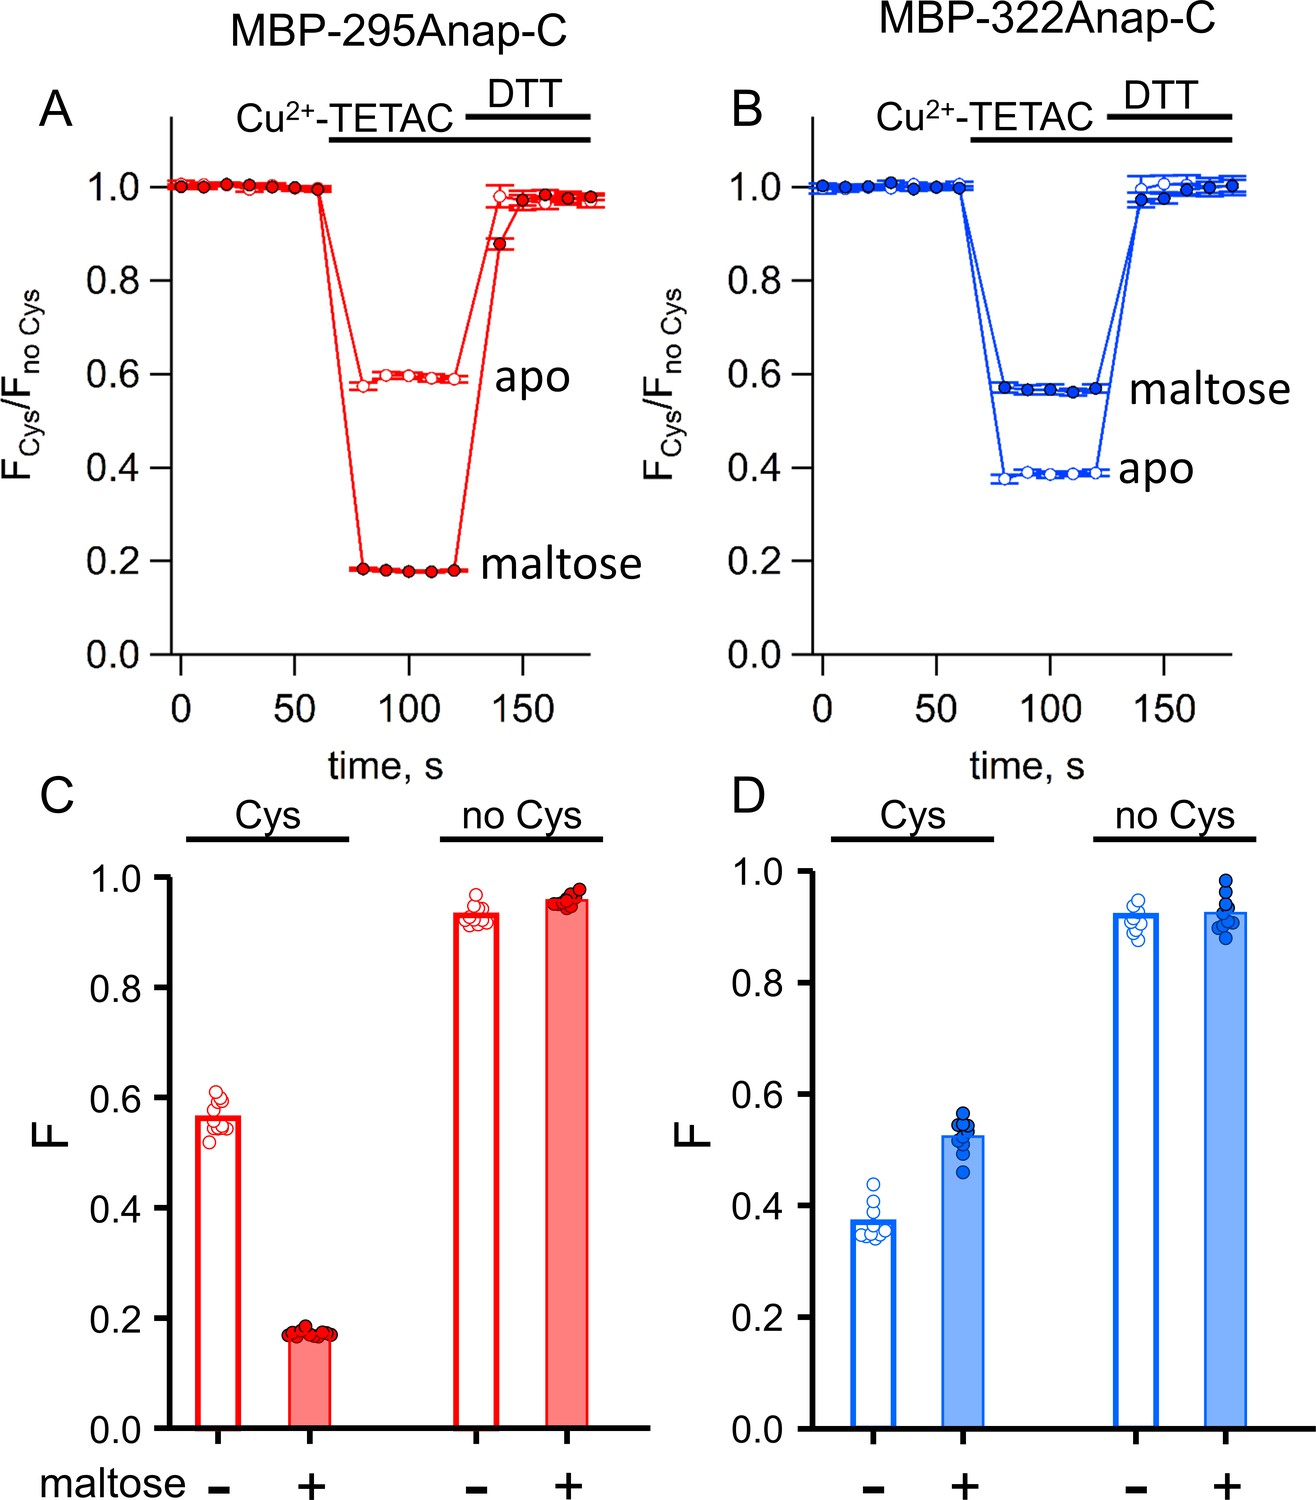
ACCuRET in MBP is reproducible, reversible, maltose dependent, and specific for each FRET pair.
(A–B) Time course and reversal of ACCuRET for (A) MBP-295Anap-C and (B) MBP-322Anap-C in the absence (open symbols) and presence (filled symbols) of 10 mM maltose. The fractional fluorescence of each construct was recorded every 10 s and normalized to the fractional fluorescence of the corresponding construct without an introduced cysteine. 10 µM Cu2+-TETAC and 1 mM DTT were added to the cuvette at the times indicated by the bars. Shown are mean ±SEM for n = 6–8. (C–D) Scattergrams of fractional fluorescence of (C) MBP-295Anap and (D) MBP-322Anap, with (Cys) and without (no Cys) the introduced cysteine, after addition of 10 µM Cu2+-TETAC in the absence (-) and presence (+) of 10 mM maltose. The amount of quenching was reproducible, maltose-dependent, construct-dependent, and nearly absent without the introduced cysteine.
Figure 7 with 1 supplement
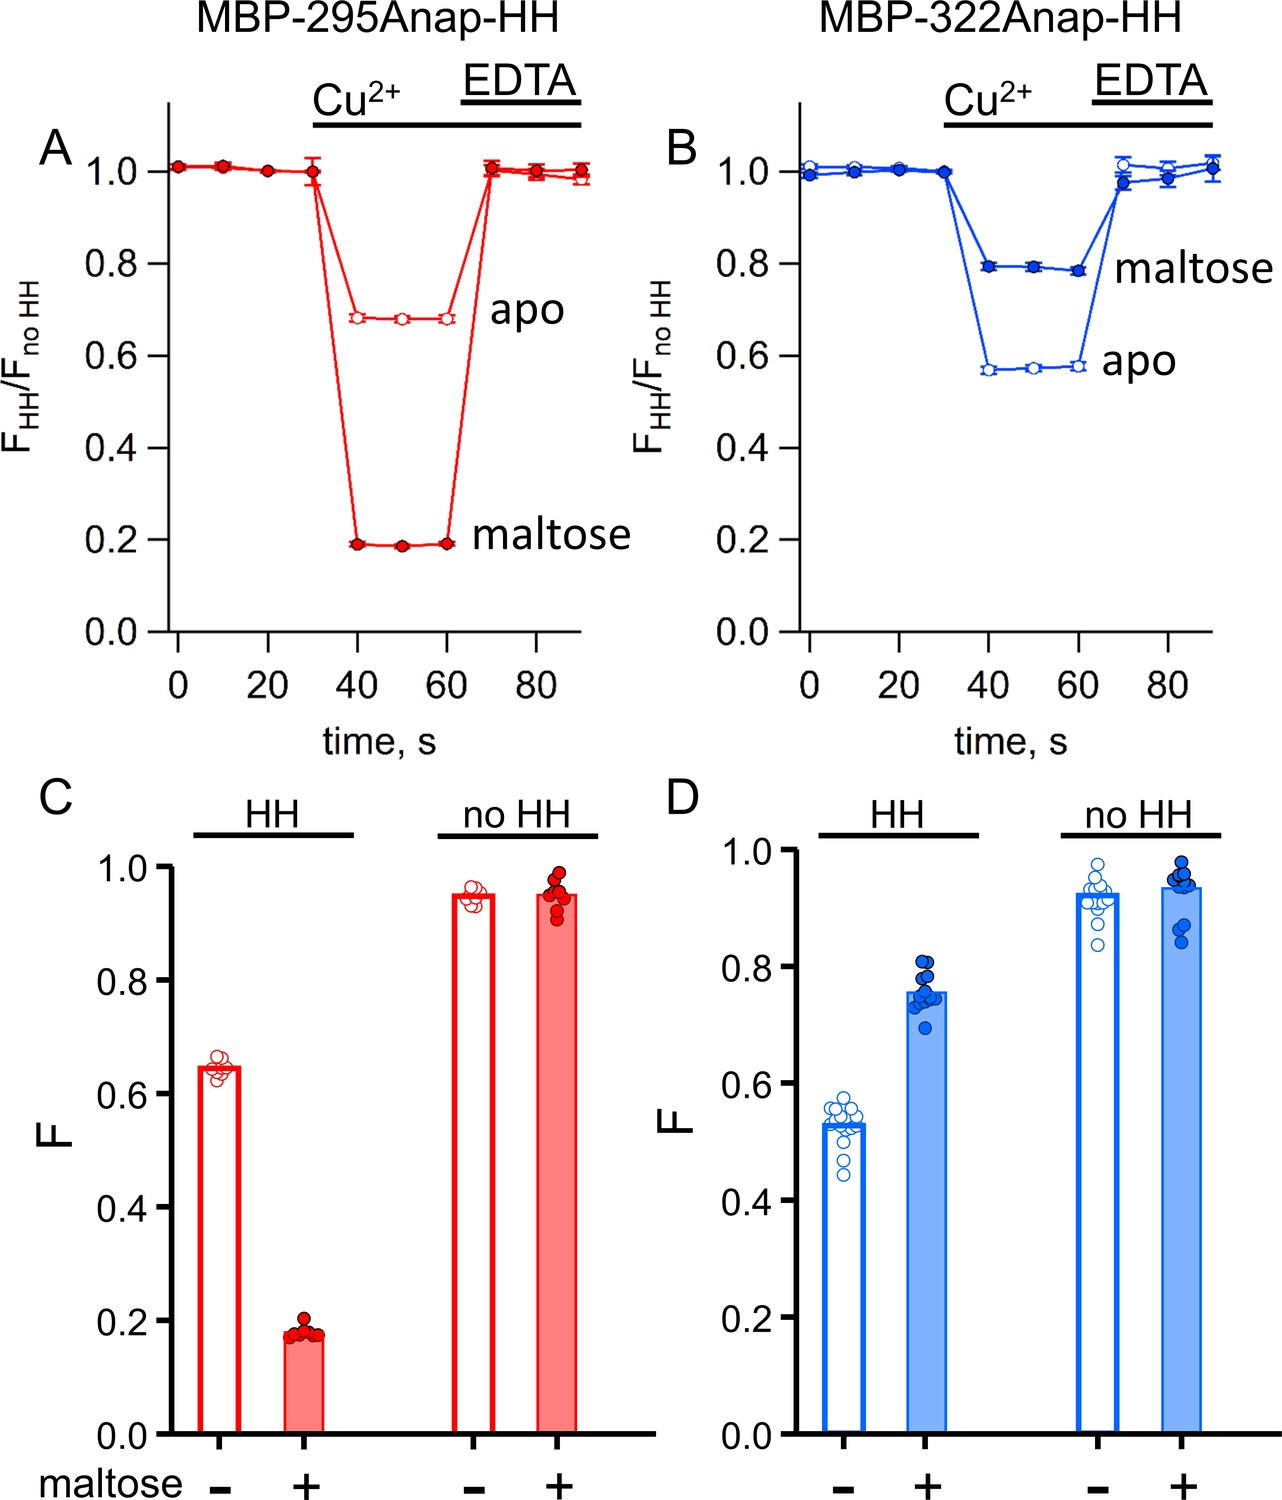
tmFRET with standard HH sites in MBP gives similar quenching to ACCuRET for the same FRET pairs.
(A–B) Time course and reversal of tmFRET with HH sites for (A) MBP-295Anap-HH and (B) MBP-322Anap-HH in the absence (open symbols) and presence (filled symbols) of 10 mM maltose. The fractional fluorescence of each construct was recorded every 10 s and normalized to the fractional fluorescence of the corresponding construct without a HH site. 100 µM Cu2+ and 10 mM EDTA were added to the cuvette at the times indicated by the bars. Shown are mean ±SEM for n = 8. (C–D) Scattergrams of fractional fluorescence of (C) MBP-295Anap and (D) MBP-322Anap, with (HH) and without (no HH) the HH site, after addition of 100 µM Cu2+ in the absence (-) and presence (+) of 10 mM maltose. The amount of quenching with standard HH sites was similar to that with ACCuRET.
Figure 7—figure supplement 1
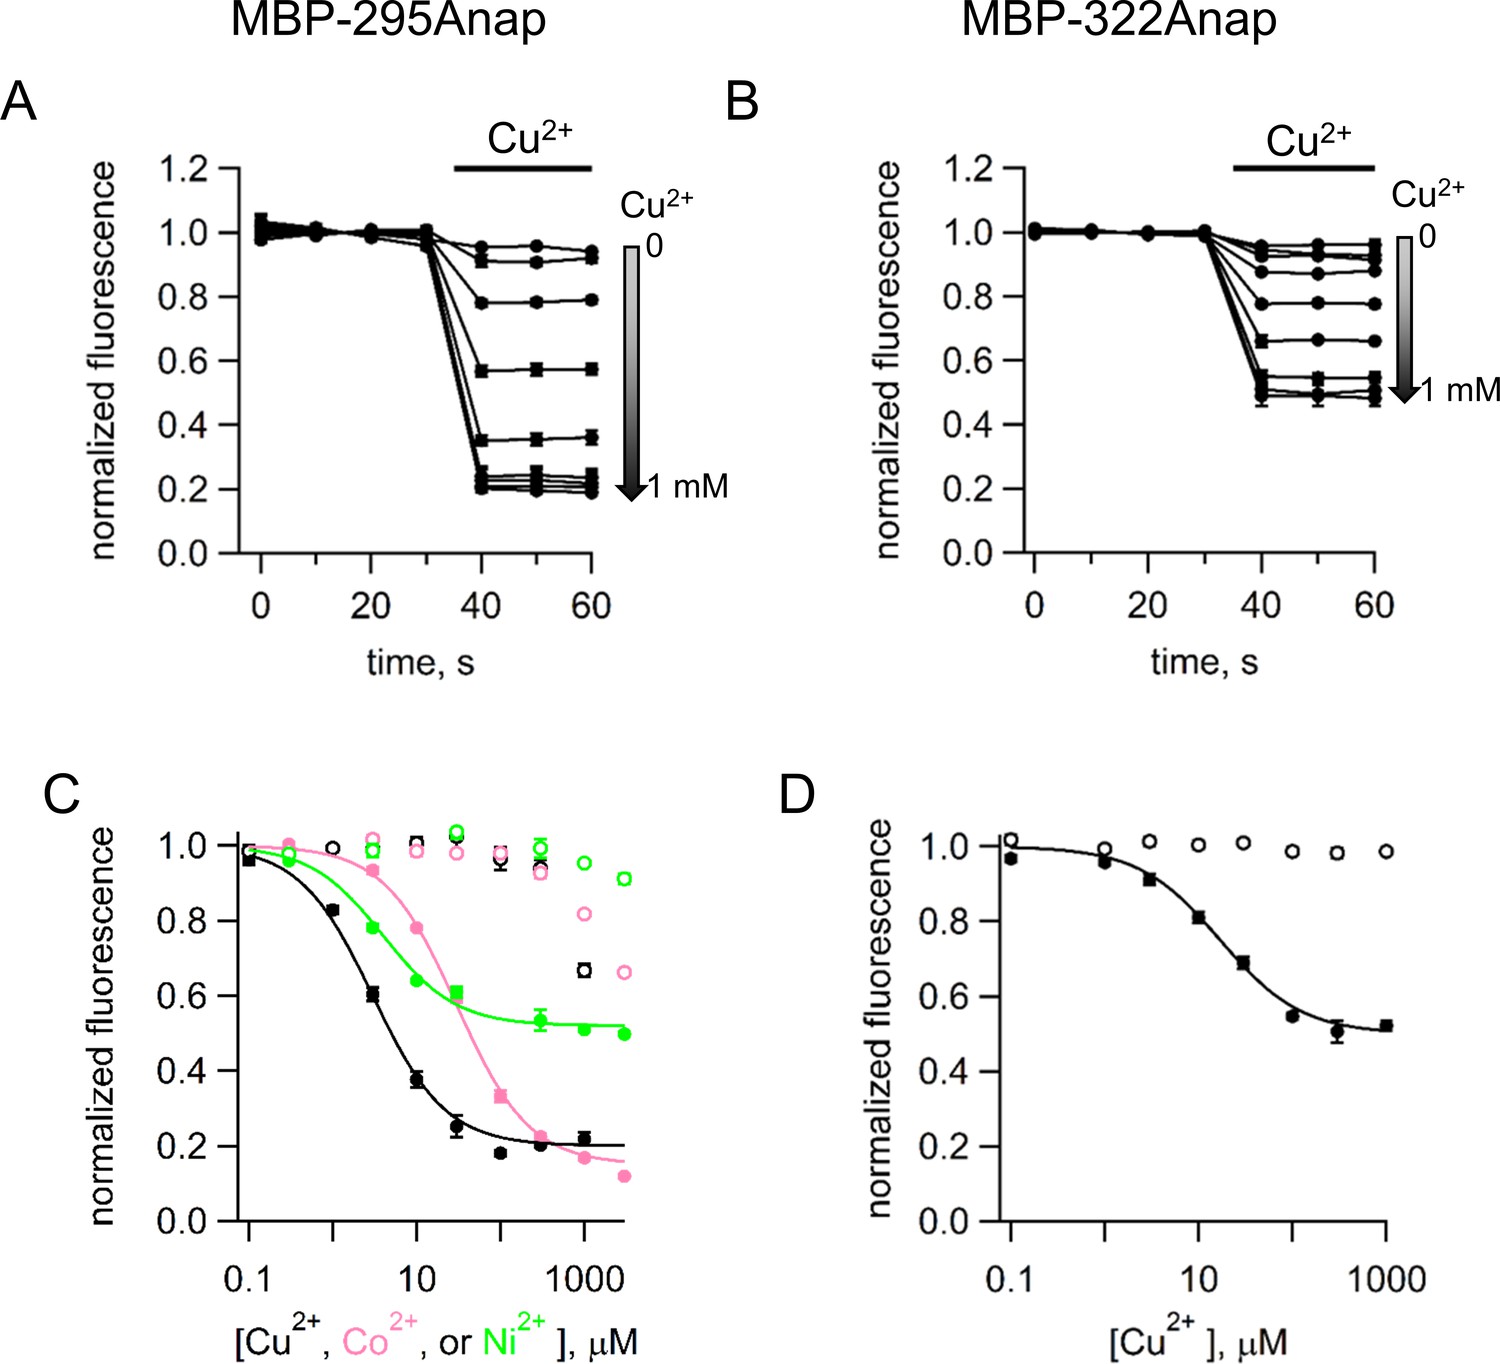
tmFRET with standard HH sites in MBP with different metals and metal concentrations.
(A–B) Time course of tmFRET with HH sites for (A) MBP-295Anap-HH and (B) MBP-322Anap-HH with application of different concentrations of Cu2+ranging from 0 to 1 mM at the time of the bar. MBP-295Anap-HH was measured in the presence of 10 mM maltose and MBP-322Anap-HH was measure in the absence of maltose. The fluorescence of each construct was recorded every 10 s and normalized to the fluorescence in the absence of Cu2+. Shown are mean ±SEM for n = 3. (C–D) Plots of the concentration dependence of metal quenching for (C) MBP-295Anap and (D) MBP-322Anap. The quenching in shown for Cu2+ (black), Ni2+ (green), and Co2+ (magenta) for constructs with (filled symbols) or without (open symbols) a HH site. Shown are mean ±SEM for n = 3. The fits to the data correspond to a single binding isotherm and indicate that MBP-295Anap-HH has an affinity of 3 µM, 4 µM, and 30 µM for Cu2+, Ni2+, and Co2+, respectively, and MBP-322Anap-HH has an affinity of 17 µM for Cu2. The fractional fluorescence at saturating concentration for MBP-295Anap-HH was 0.2, 0.48, and 0.15 for Cu2+, Ni2+, and Co2+, respectively, and for MBP-322Anap-HH was 0.5 for Cu2.
Figure 8
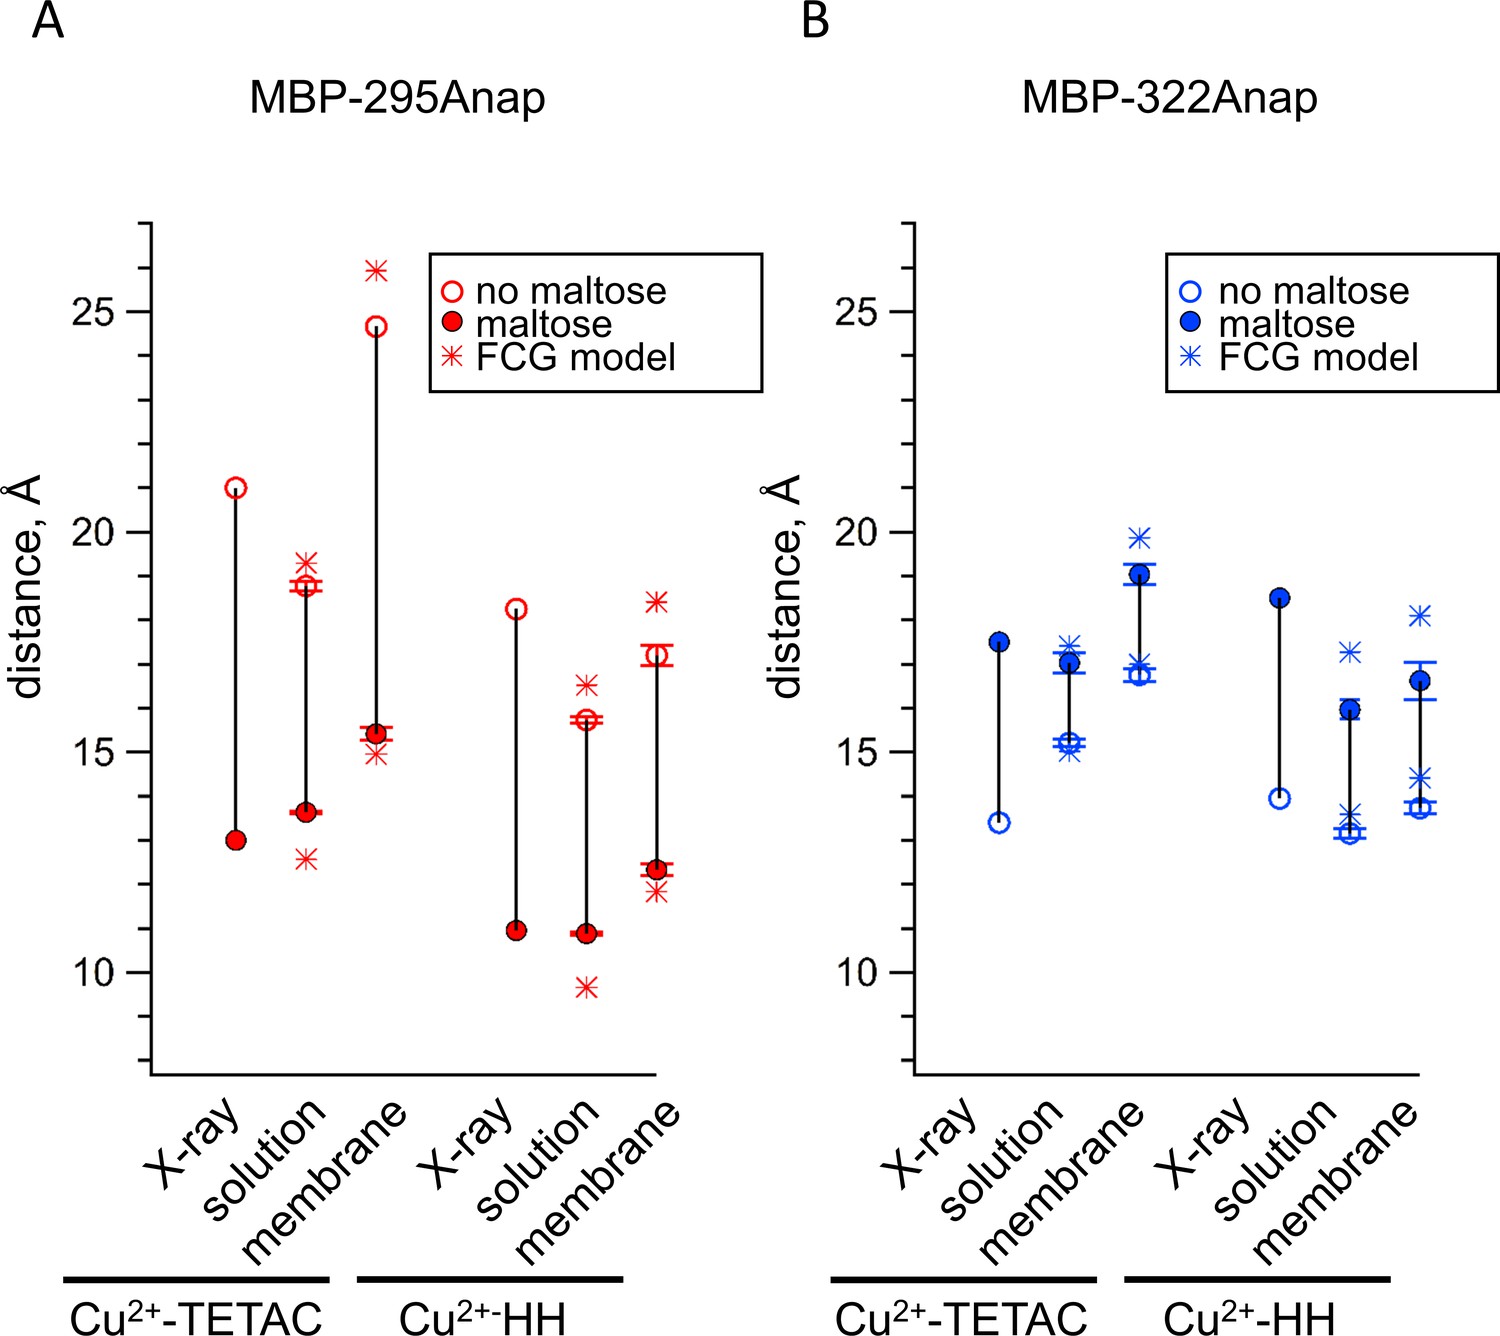
Comparison of distances measured with ACCuRET and standard HH sites to distances in the X-ray crystal structures of MBP.
(A–B) Distances from the X-ray crystal structures (X-ray) and determined using ACCuRET (Cu2+-TETAC) and standard HH sites (Cu2+-HH) from soluble (solution) and membrane-bound (membrane) MBP for the (A) MBP-295Anap and (B) MBP-322Anap FRET pairs. The distances determined using the Förster equation in the absence (open symbols) and presence (filled symbols) of maltose are shown and connected by a vertical line that reflects the maltose-dependent change in distance. Shown are mean ±SEM for n ≥ 8. The distances determined using the FCG model, assuming FWHM = 8 Å, are shown as asterisks.
Figure 9 with 1 supplement
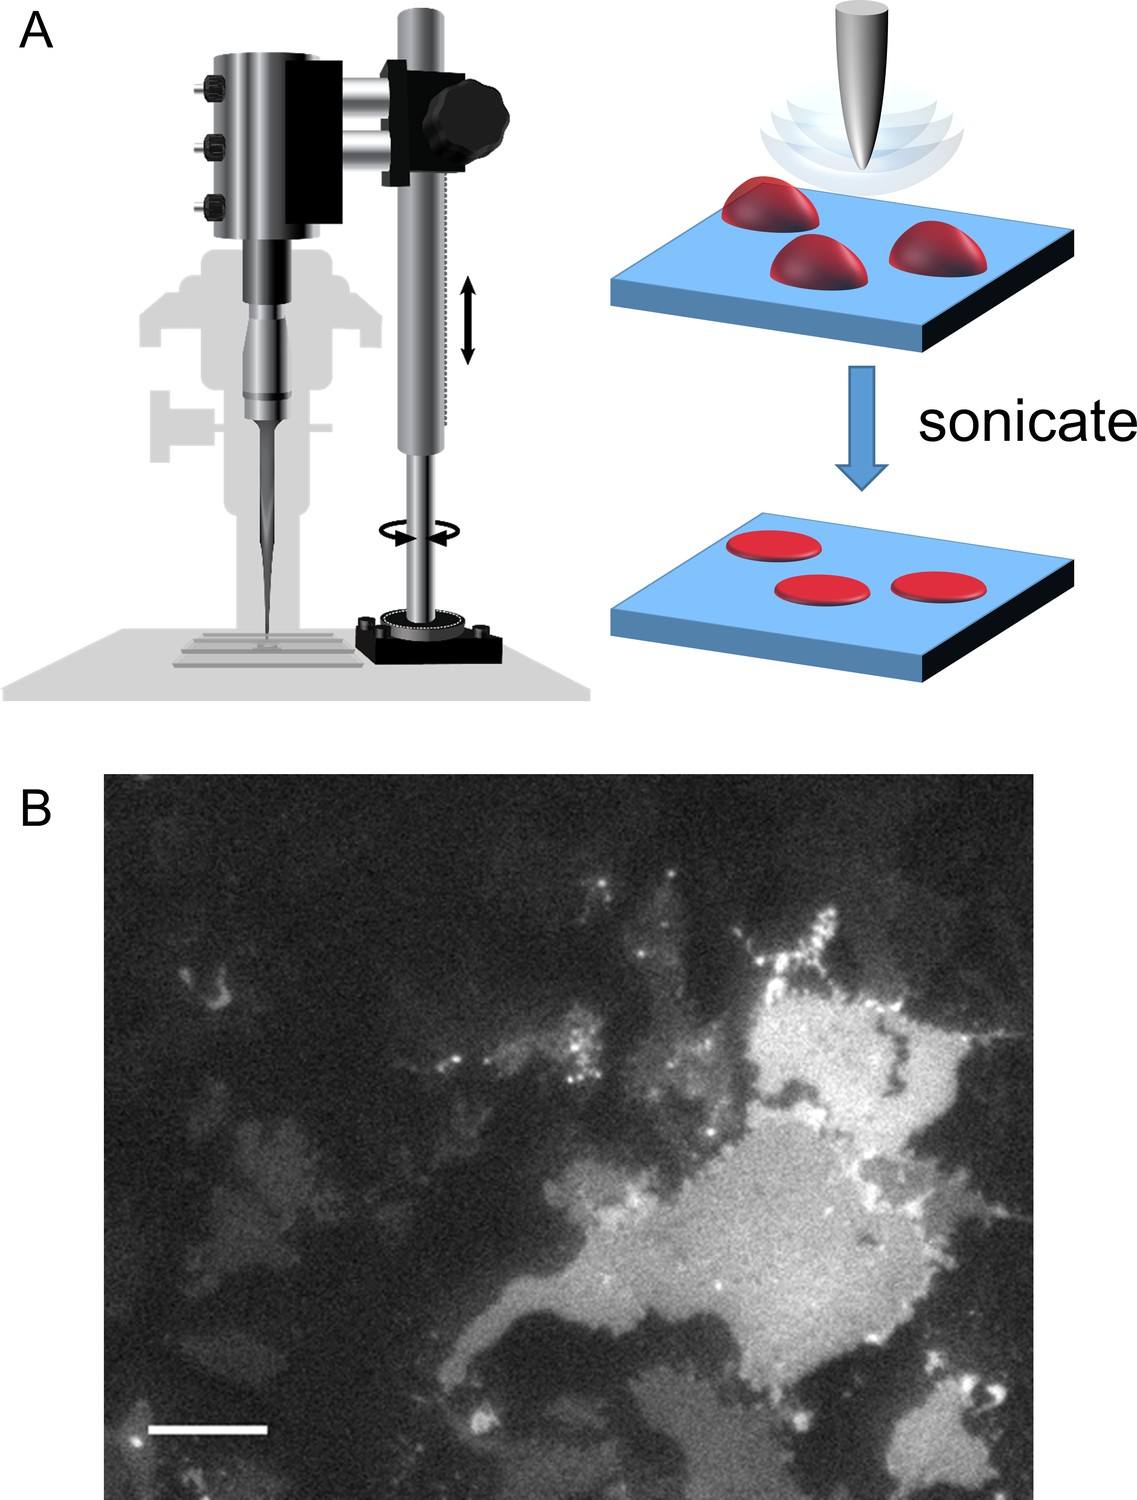
Cell unroofing to isolate plasma membrane sheets.
(A) Diagram of the experimental setup used to unroof cells in a chamber on the microscope stage (left) with a cartoon of the unroofing process (right), as previously described (Zagotta et al., 2016). (B) An image of a field of unroofed HEK293T/17 cells transiently transfected with MBP-322TAG-CAAX and imaged with epifluorescence microscopy. The scale bar is 10 µm.
Figure 9—figure supplement 1
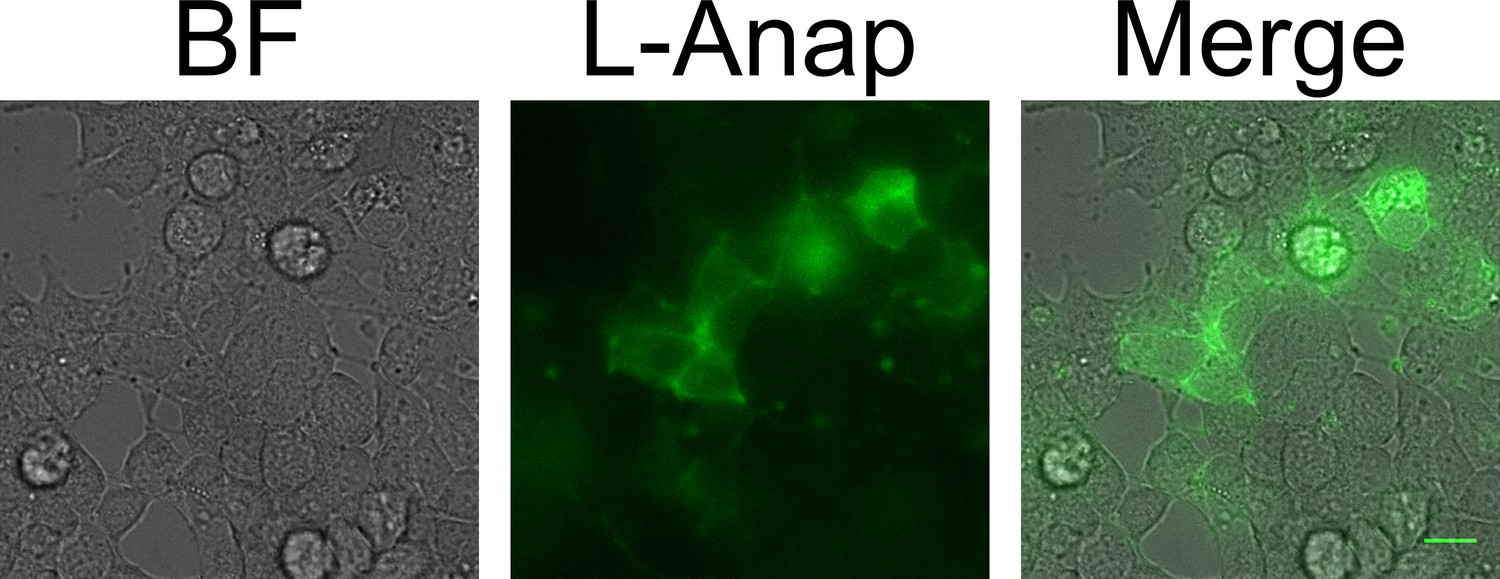
MBP-Anap-CAAX in intact cells.
A bright field (left) and fluorescence image (center) of MBP-322TAG-CAAX is shown in intact cells, with the two-color merge shown at right. The scale bar is 10 µm.
Figure 10
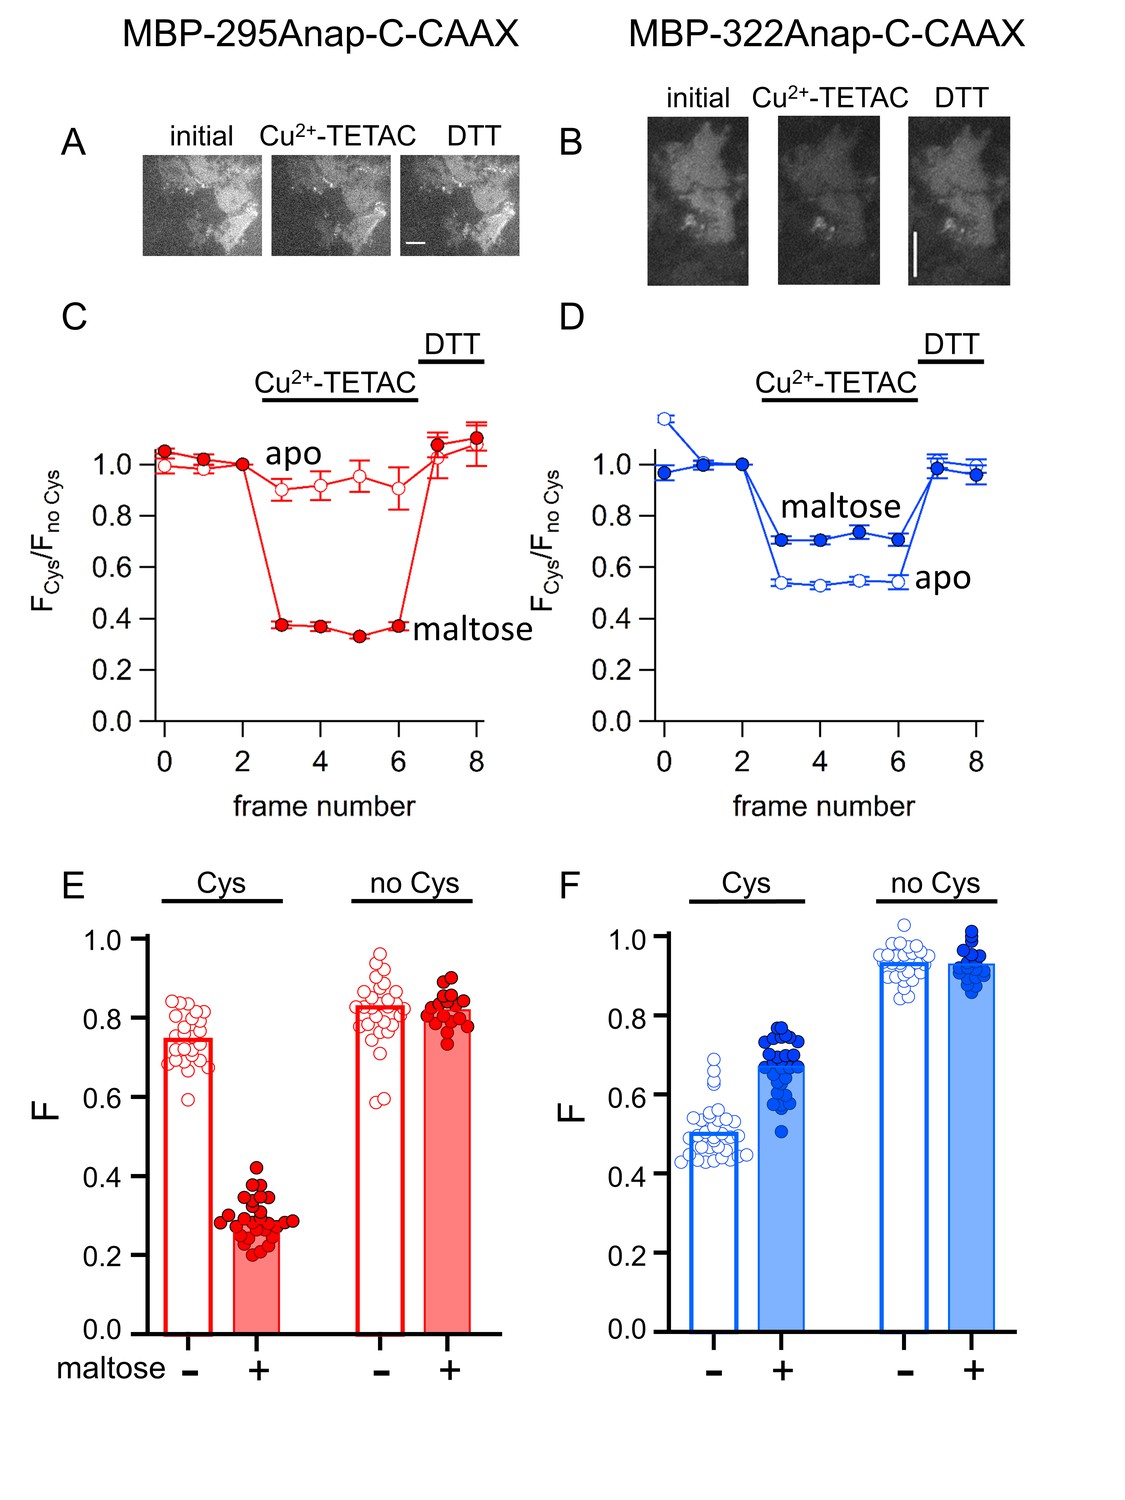
ACCuRET in membrane-bound MBP in unroofed cells.
(A–B) Images of unroofed cells expressing (A) MBP-295Anap-C-CAAX or (B) MBP-322Anap-C-CAAX showing quenching upon addition of 10 µM Cu2+-TETAC and reversal upon addition of 1 mM DTT, all in the absence of maltose. All images for a given field were acquired using the same illumination and camera settings and use the same look up table. Exposure time for (A) was 500 ms and for (B) was 125 ms. The scale bar is 10 µm. Time course and reversal of ACCuRET for (C) FLAG- MBP-295Anap-C-CAAX and (D) FLAG- MBP-322Anap-C-CAAX in the absence (open symbols) and presence (filled symbols) of 10 mM maltose. The fractional fluorescence of each construct was recorded every 10 s and normalized to the fractional fluorescence of the corresponding construct without an introduced cysteine. 10 µM Cu2+-TETAC and 1 mM DTT were added to the chamber at the times indicated by the bars. The x-axis label, frame number, indicates the temporal sequence in which solutions were applied and images acquired. Shown are mean ±SEM for n ≥ 17. (E–F) Scattergrams of fractional fluorescence of (E) FLAG- MBP-295Anap-C-CAAX, and (F) FLAG- MBP-322Anap-C-CAAX, with (Cys) and without (no Cys) the introduced cysteine, after addition of 10 µM Cu2+-TETAC in the absence (-) and presence (+) of 10 mM maltose. The amount of quenching was reproducible, maltose-dependent, construct dependent, and nearly absent without the introduced cysteine.
Figure 11
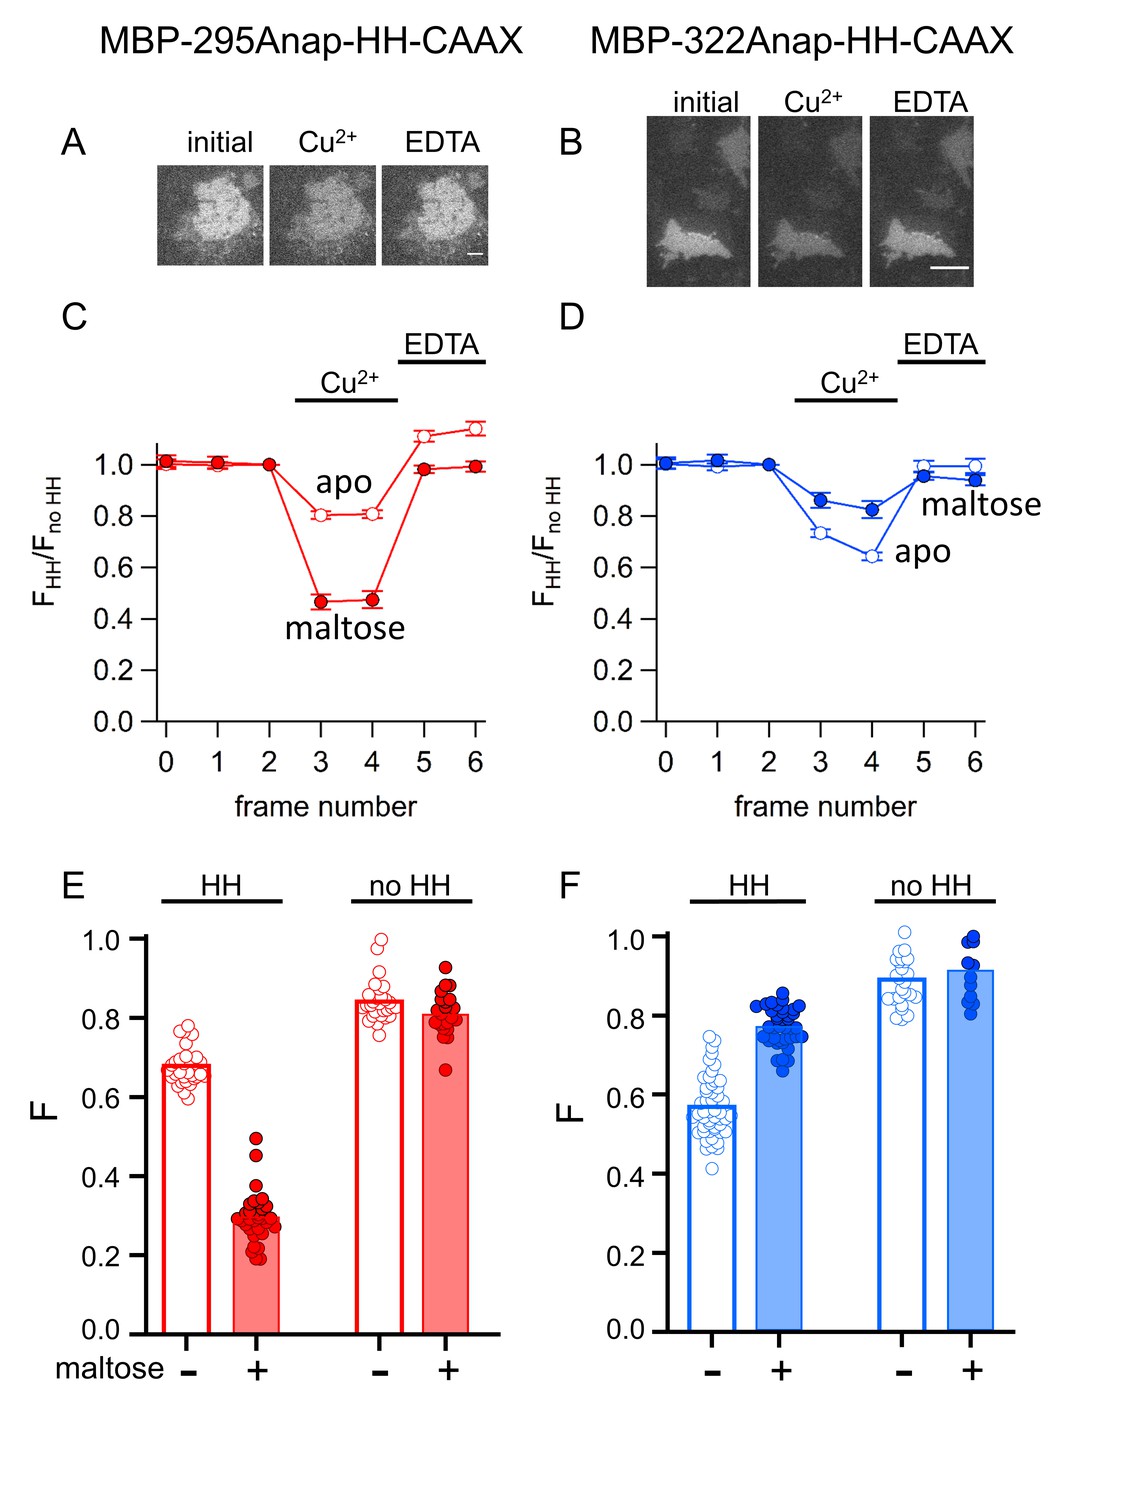
tmFRET with HH sites in membrane-bound MBP in unroofed cells.
(A–B) Images of unroofed cells expressing (A) MBP-295Anap-HH-CAAX or (B) MBP-322Anap-HH-CAAX showing quenching upon addition of 100 µM Cu2+ and reversal upon addition of 10 mM EDTA, all in the absence of maltose. All images for a given field were acquired using the same illumination and camera settings and use the same look up table. Exposure times for (A) and (B) were 125 ms. The scale bar is 10 µm. (C–D) Time course and reversal of tmFRET with HH sites for (C) MBP-295Anap-HH-CAAX or (D) MBP-322Anap-HH-CAAX in the absence (open symbols) and presence (filled symbols) of 10 mM maltose. The fractional fluorescence of each construct was recorded and normalized to the fractional fluorescence of the corresponding construct without a HH site. 100 µM Cu2+ and 10 mM EDTA were added to the chamber at the times indicated by the bars. The x-axis label, frame number, indicates the temporal sequence in which solutions were applied and images acquired. Shown are mean ±SEM for n ≥ 12. (E–F) Scattergrams of fractional fluorescence of (E) MBP-295Anap-HH-CAAX or (F) MBP-322Anap-HH-CAAX, with (HH) and without (no HH) the HH site, after addition of 100 µM Cu2+ in the absence (-) and presence (+) of 10 mM maltose. The amount of quenching with standard HH sites was similar to that with ACCuRET.
Figure 12
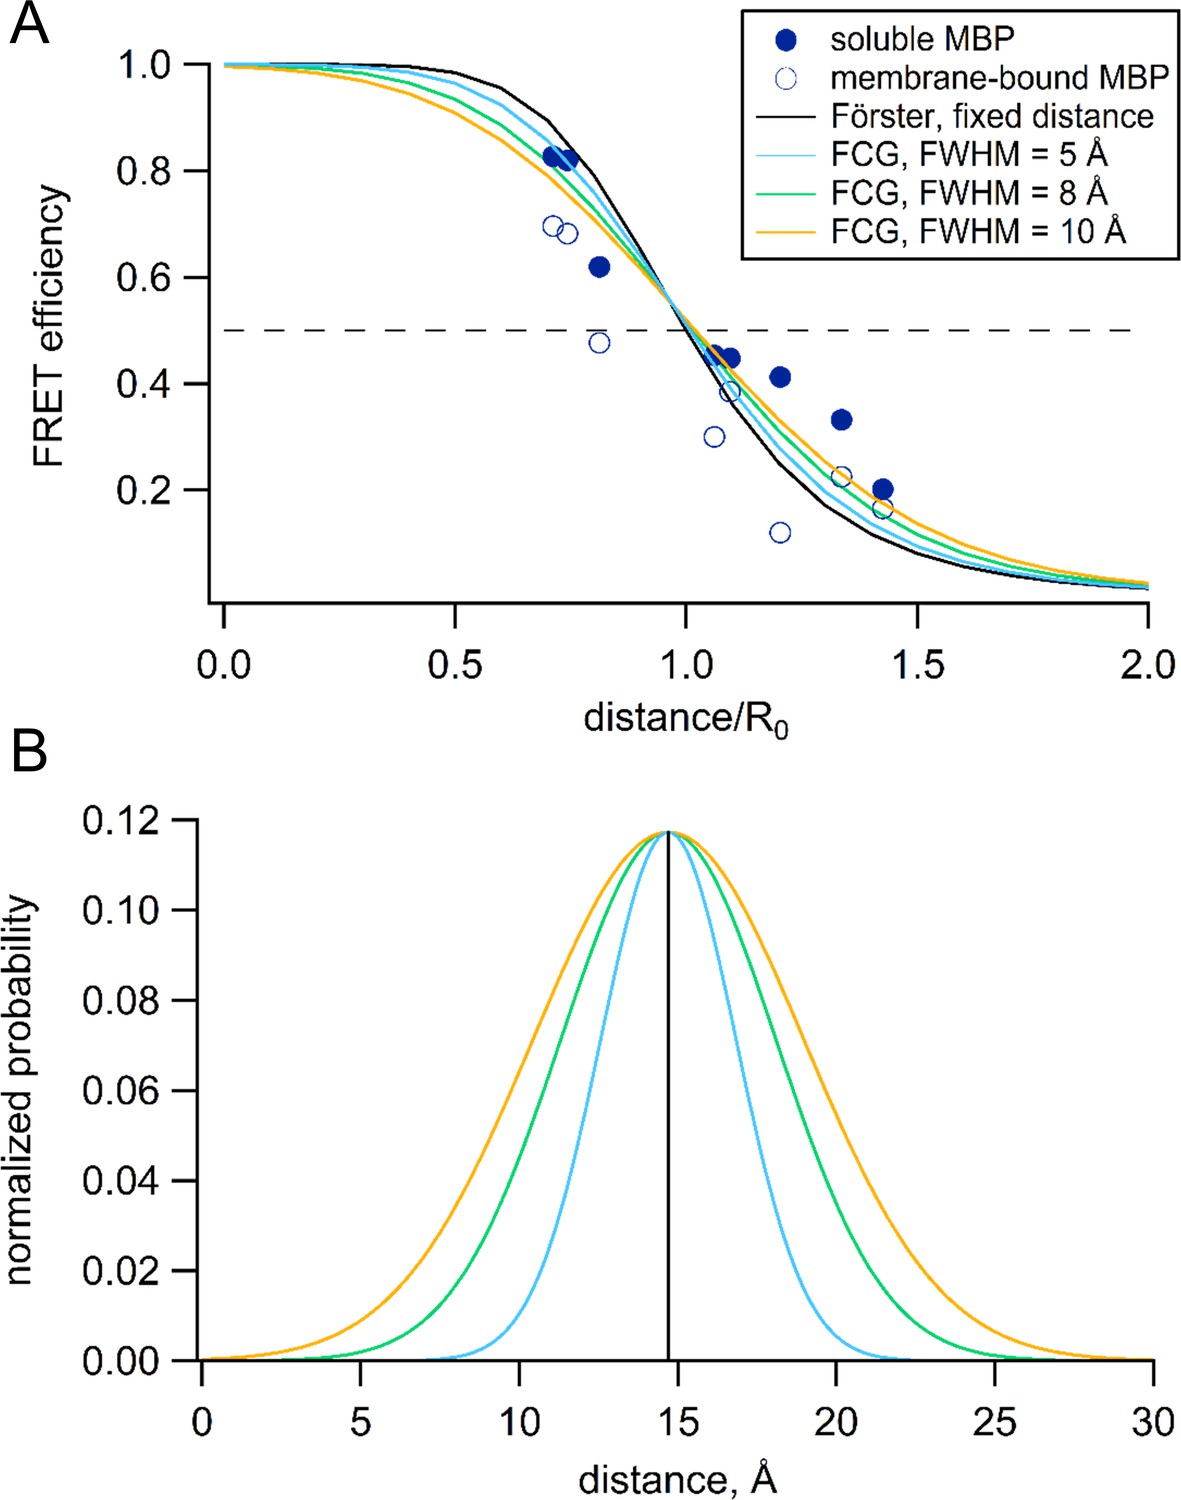
Förster equation convolved with Gaussian distribution to predict average distances.
(A) Plot of the measured and predicted distance dependence of FRET efficiency. The FRET efficiencies measure in this paper from soluble (filled symbols) and membrane-bound (open symbols) MBP are plotted versus the Cβ-Cβ distances predicted from the MBP X-ray crystal structures (PDB IDs: 1N3W and 1N3X for apo and maltose-bound, respectively). The predicted distance dependencies are shown for the Förster equation and the Förster equation convolved with Gaussian distribution. The Gaussians used for convolution had mean intramolecular distances of 14.7 Å and the following FWHM values: 0 Å (black), 5 Å (blue), 8 Å (green), and 10 Å (orange). (B) The Gaussian distributions that were convolved with the Förster equation for panel (A), using the same color scheme.
Figure 13
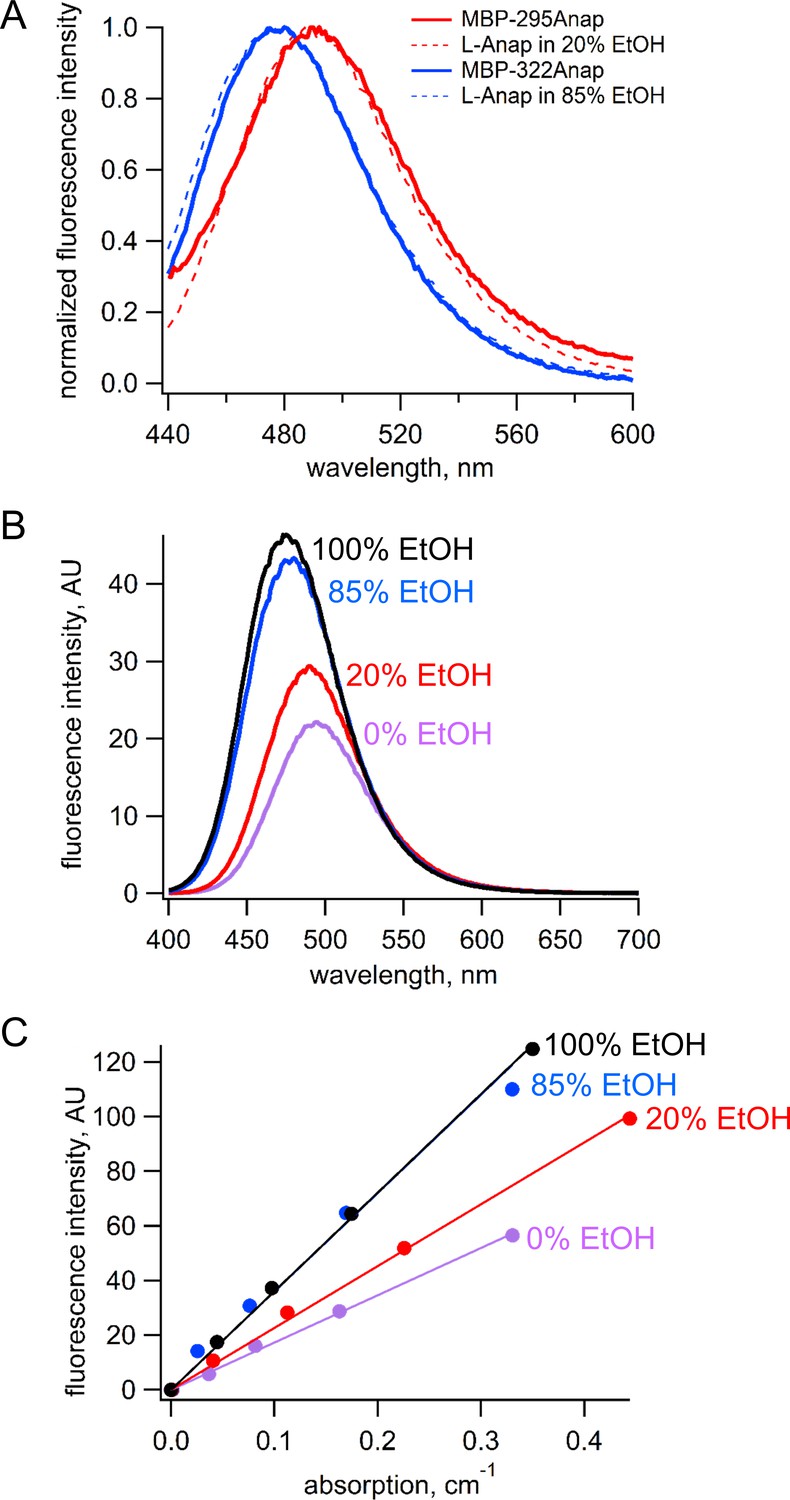
Estimation of quantum yield of Anap incorporate at the 295 and 322 sites in MBP.
(A) Normalized emission spectra of MBP-295Anap (red line) and MBP-322Anap (blue line) showing the emission of Anap at 322 is blue shifted relative to that of Anap at 295. Also shown are the normalized emission spectra of free L-Anap in 20% ethanol (dashed red line), closely matching Anap at 295, and 85% ethanol (dashed blue line), closely matching Anap at 322. (B) Emission spectra of free L-Anap in different ethanol concentrations showing the environmental sensitivity of L-Anap. Over this range, as the environment becomes more hydrophobic, the peak fluorescence becomes larger and blue shifted. (C) Plot of fluorescence intensity versus absorption of free L-Anap in different ethanol concentrations. The quantum yield, calculated using the slope of these plots, increases with increasing ethanol concentration. The quantum yield of free L-Anap in 20% and 85% ethanol were used to estimate the quantum yield of Anap incorporate at the 295 and 322 sites, respectively.
Videos
Video 1
Conformation change in MBP upon maltose binding.
Morph of the X-ray crystal structures of MBP in the apo (PDB ID: 1N3W) and maltose-bound (PDB ID: 1N3X) states. Shown are the measurements of the distances for the FRET pairs used in this study, MBP-295Anap-C (top) and MBP-322Anap-C (bottom). Maltose is shown in magenta.
Tables
Key resources table
| Reagent type (species) or resource | Designation | Source or reference | Identifiers | Additional information |
|---|---|---|---|---|
| Cell line (Homo sapiens) | HEK293T/17 | ATCC | ATCC: CRL-11268; RRID:CVCL_1926 | |
| Recombinant DNA reagent | pANAP | Addgene: DOI: 10.1021/ja4059553 | Addgene: 48696; | |
| Recombinant DNA reagent | DN-eRF1 (peRF1-E55D.pcDNA5-FRT) | Jason Chin: DOI: 10.1021/ja5069728 |
Additional files
-
Transparent reporting form
- https://doi.org/10.7554/eLife.37248.019
Download links
A two-part list of links to download the article, or parts of the article, in various formats.
Downloads (link to download the article as PDF)
Open citations (links to open the citations from this article in various online reference manager services)
Cite this article (links to download the citations from this article in formats compatible with various reference manager tools)
Visualizing conformational dynamics of proteins in solution and at the cell membrane
eLife 7:e37248.
https://doi.org/10.7554/eLife.37248


