E proteins sharpen neurogenesis by modulating proneural bHLH transcription factors’ activity in an E-box-dependent manner
- Instituto de Biología Molecular de Barcelona, Spain
Figures
Figure 1 with 1 supplement
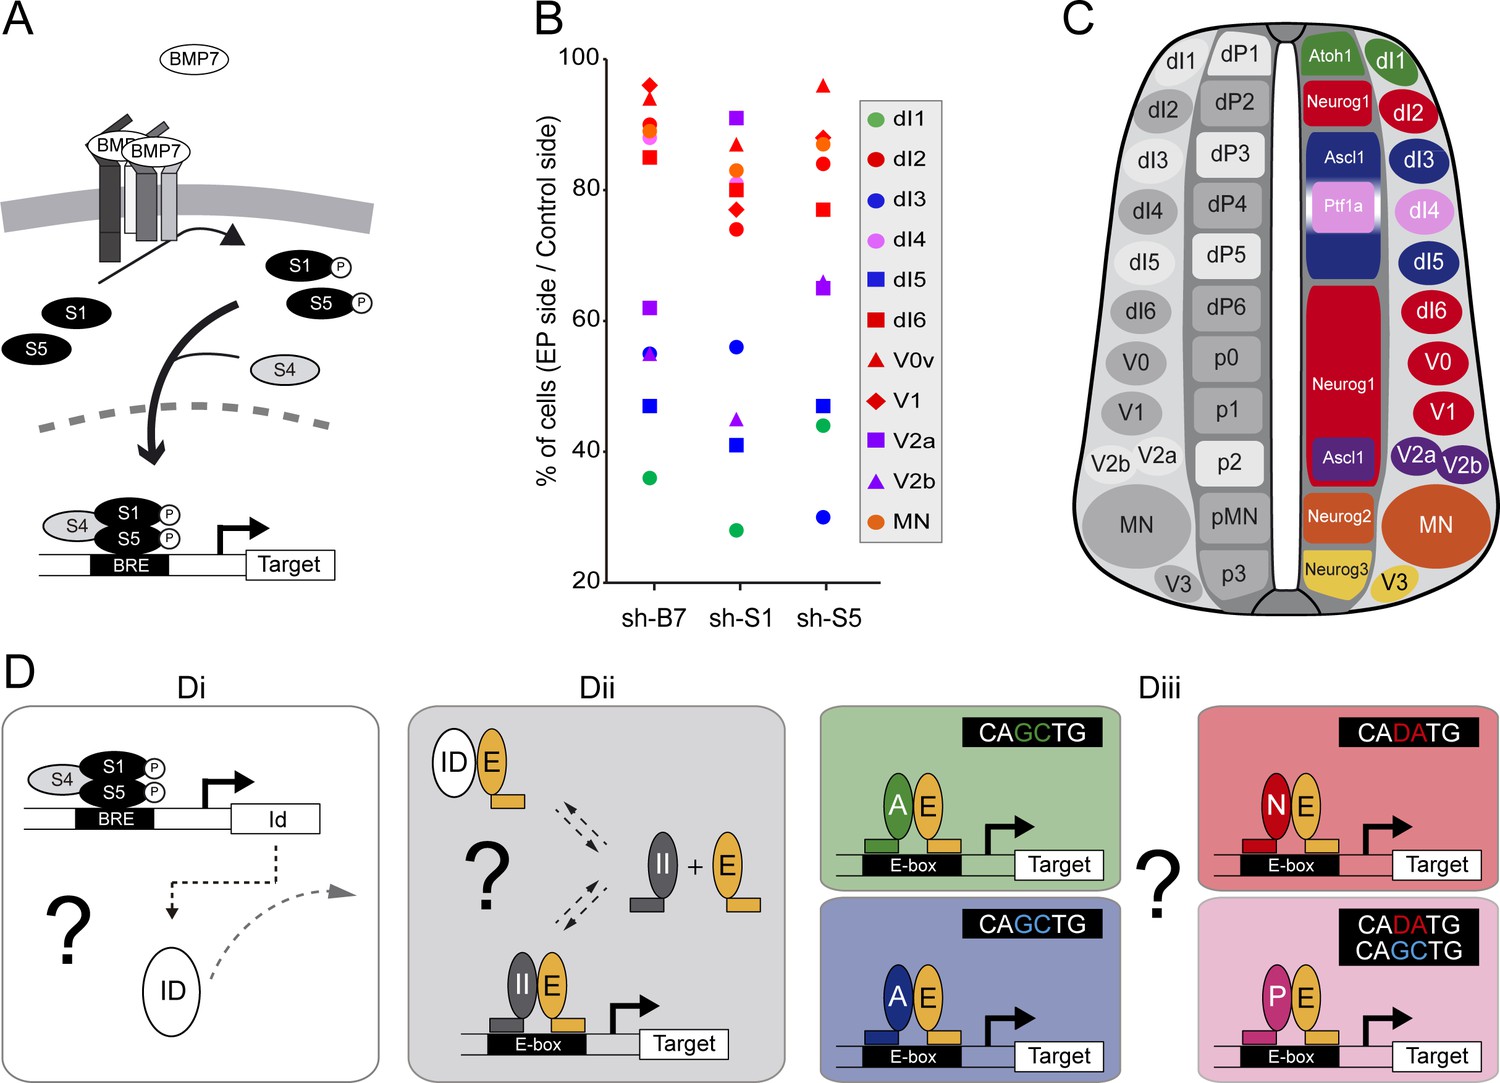
The canonical BMP pathway differentially regulates the generation of spinal neurons derived from progenitors that express ASCL1/ATOH1 or NEUROG1/NEUROG2/PTF1a.
(A) Actors of the canonical BMP pathway (BMP7, SMAD1 and SMAD5) known to regulate spinal neurogenesis. (B) Dot-plot representing the spinal neuronal subtypes generated 48 hpe with plasmids producing sh-RNA targeting cBmp7 (sh-B7), cSmad1 (sh-S1) or cSmad5 (sh-S5), comparing the electroporated side to the contra-lateral side. The colour code corresponds to the proneural proteins expressed in the corresponding progenitor domains, as shown in C. (C) Drawing of a transverse section of the developing spinal cord at mid-neurogenesis, highlighting: (left) the neuronal subtypes strongly (white) or moderately (grey) affected by inhibiting canonical BMP activity, and (right) a colour-coded representation of the proneural proteins expressed in the corresponding progenitor domains. (D) Working hypothesis whereby we propose to test if (i) the canonical BMP activity is mediated by ID proteins; (ii) ID proteins act by sequestering E proteins (E, orange), thereby inhibiting the activity of class II HLH/proneural proteins (II, grey); and (iii) E proteins co-operate equally or differentially with the distinct proneural proteins as a function of their preferential binding to specific E-box sequences. .
Figure 1—figure supplement 1
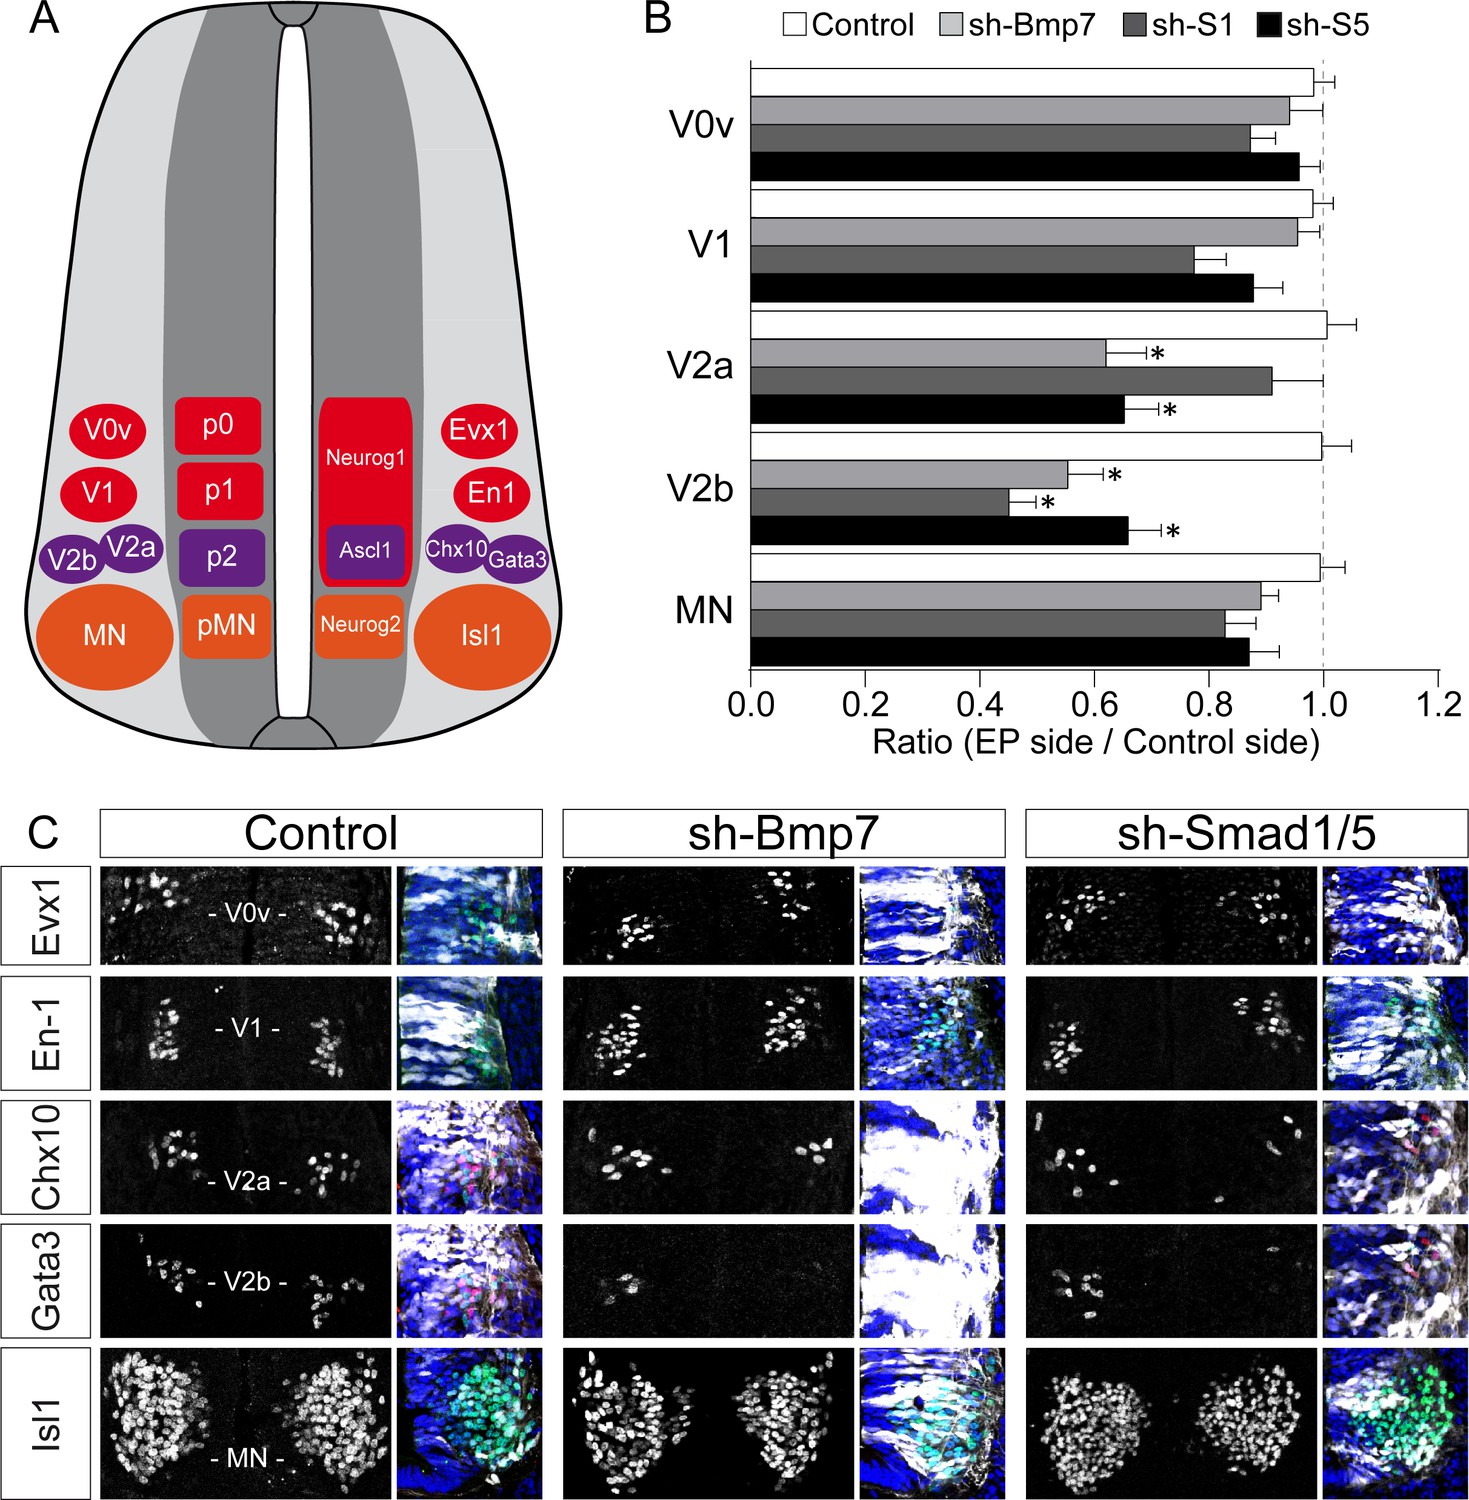
Inhibiting the canonical BMP pathway affects the generation of ventral spinal neurons.
(A) Diagram of a transverse section of the developing spinal cord at mid-neurogenesis, highlighting the ventral neuron subtypes analysed and the markers used to identify them. (B, C) The proportions (B) and representative images (C) of the ventral spinal neuron subtypes generated 48 hr after in ovo electroporation with a control plasmid or plasmids producing sh-RNAs specifically targeting cBmp7 (sh-Bmp7), cSmad1 (sh-Smad1) or cSmad5 (sh-Smad5). GFP staining (white) and DAPI (blue) are shown to confirm the region of interest was electroporated. The data are presented as the mean ratios ± sem obtained from n = 6–17 embryos per condition; one-way ANOVA + Tukey’s test; *p<0.05.
Figure 2 with 3 supplements
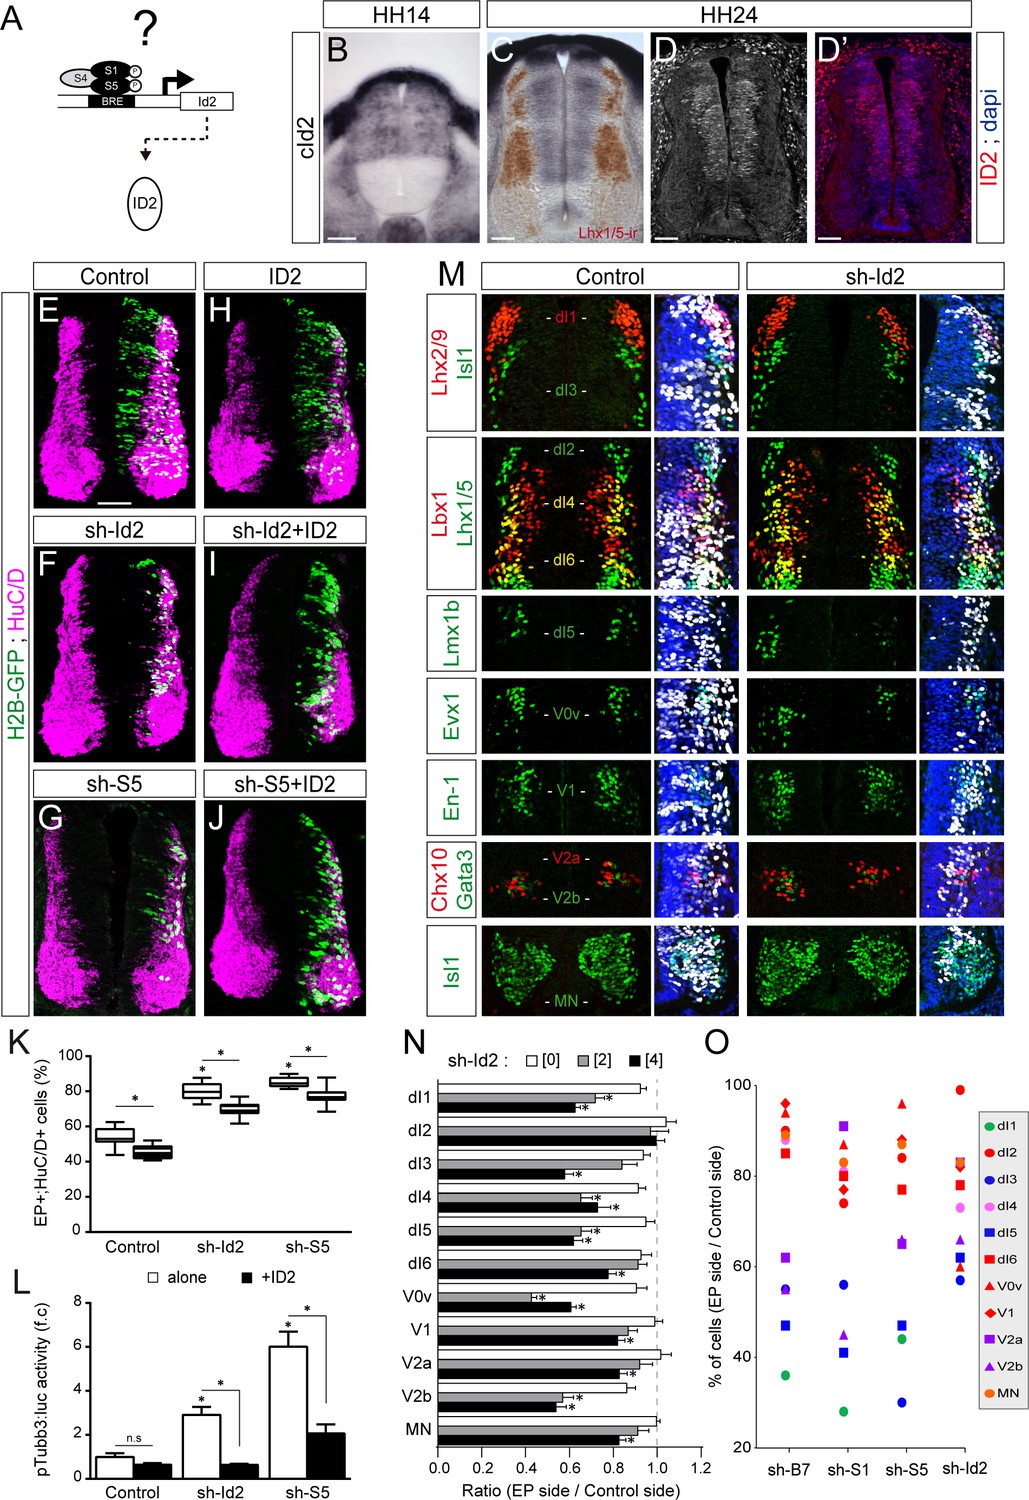
ID2 acts downstream of the canonical BMP pathway and it differentially regulates the generation of spinal neurons derived from progenitors expressing ASCL1/ATOH1 or NEUROG1/NEUROG2/PTF1a.
(A) Hypothesis: ID2 mediates the canonical BMP activity during spinal neurogenesis. (B, C) Detection of cId2 transcripts by in situ hybridization in transverse spinal sections at stages HH14 (B) and HH24 (C). Lhx1/5 immunoreactivity (brown) was detected a posteriori (C). (D–D’) Endogenous cID2 immunoreactivity and DAPI staining at stage HH24. (E–J) Transverse spinal cord sections of electroporated cells (H2B-GFP+) that differentiated into neurons (HuC/D+) 48 hpe with: a control plasmid (E), plasmids producing sh-RNAs against cId2 (sh-Id2, (F) or cSmad5 (sh-S5, (G), a murine ID2 construct (H), and its combination with sh-Id2 (I) or sh-S5 (J). (K) Box-and-whisker plots obtained from n = 7–16 embryos; one-way ANOVA + Tukey’s test; *p<0.05. (L) Activity of the pTubb3:luc reporter quantified 24 hpe in the conditions cited above, expressed as the mean fold change ± sem relative to the control, obtained from n = 8–9 embryos; one-way ANOVA + Tukey’s test; *p<0.05. (M) Representative images of the spinal neuron subtypes (identified with the combinations of the markers indicated) generated 48 hpe with control or sh-Id2. (N) Mean ratios ± sem or (O) dot-plots comparing the mean number of neurons on the electroporated and contralateral sides, obtained from n = 8–11 embryos; one-way ANOVA + Tukey’s test; *p<0.05. Scale bars, 50 µM.
Figure 2—figure supplement 1

Regulation of Id2 expression by the canonical BMP pathway.
(A) Representation of the proximal murine Id2 promoter region and different mutant constructs of pId2:luc reporters, highlighting the location of the SMAD1/5/8-responsive (BRE) elements. (B) Transcriptional assay showing the activity of the different pId2:luc reporters measured 24 hpe. The data are expressed as the mean fold change ±sem relative to the control values, obtained from n = 7–8 embryos per condition; one-way ANOVA + Tukey’s test; *p<0.05. (C) Transcriptional assay showing the activity of the full pId2:luc reporter measured 24 hpe with dominant-negative (Somitabun) or constitutively active (SMAD5-SD) SMAD5 mutant constructs. The data are expressed as the mean Log2 fold changes ± sem relative to the control values, obtained from n = 7–10 embryos; two-sided unpaired t-test; *p<0.05.
Figure 2—figure supplement 2

cId2 expression during spinal neurogenesis.
(A–A’) Detection of cId2 transcripts by in situ hybridization in transverse spinal sections of stage HH24 chick embryos. PAX2 immunoreactivity (brown, expressed ventrally by V1 but not V2 interneurons), was detected a posteriori to delineate the frontier between p1and p2 progenitor domains. (B–B’) Endogenous cID2 immunoreactivity (green) detected in transverse spinal sections from HH24 chick embryos, together with NKX6.1 (red), a patterning protein expressed in the ventral region encompassing p2, pMN and p3 progenitor domains. Scale bars, 50 µM.
Figure 2—figure supplement 3
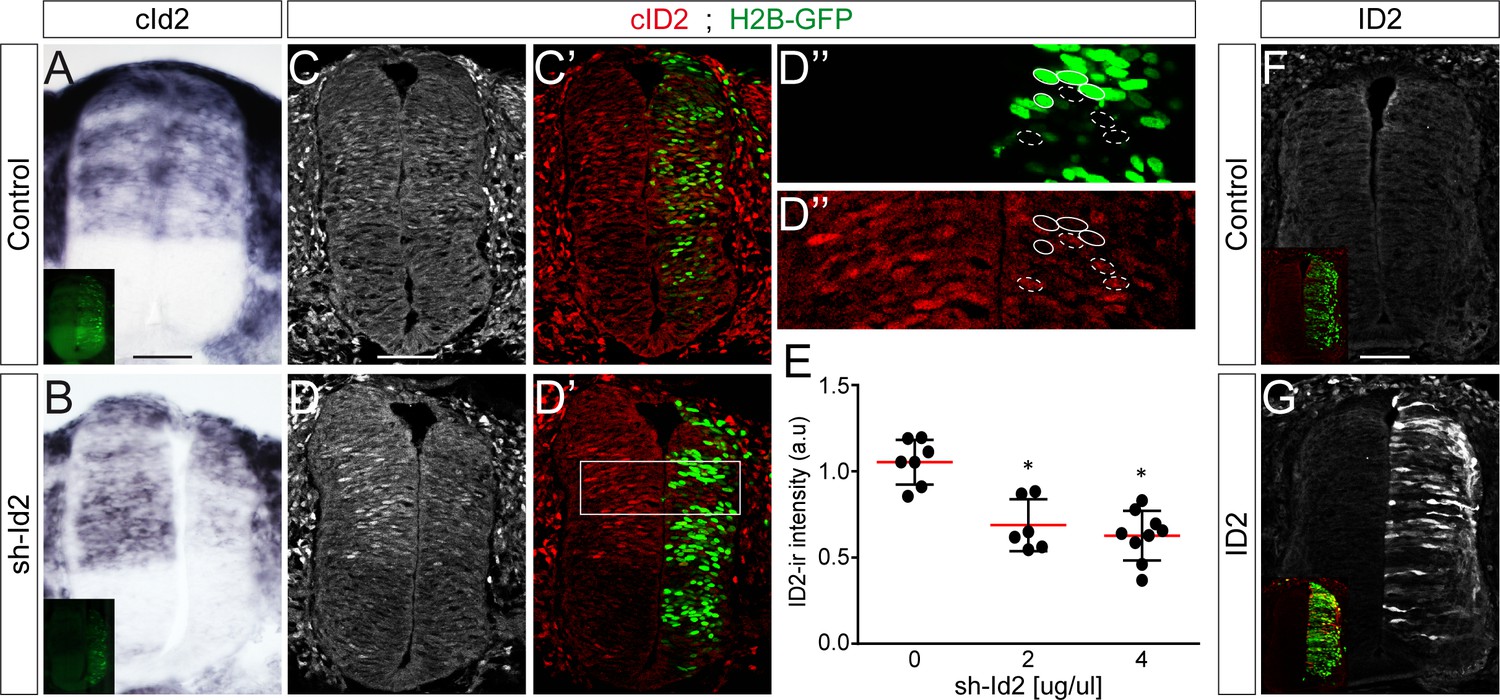
Modulation of ID2 activity in vivo.
(A–B) Detection of cId2 transcripts by in situ hybridization in transverse spinal sections 24 hpe with control (A) or sh-Id2-producing (B) plasmids. (C–D) Endogenous cID2 immunoreactivity detected in transverse spinal sections 24 hpe with control (C, C’) or sh-Id2-producing (D–D’’) plasmids, and quantified in electroporated and nearby non-electroporated cells (as highlighted in D’’). (E) The data represent the mean cID2 immunoreactivity ±sd measured after electroporation of a control plasmid [0] or increasing concentrations [2 and 4 µg/µl] of sh-Id2 plasmids in electroporated relative to non-electroporated cells, obtained from n = 6–9 embryos per condition; one-way ANOVA + Tukey’s test; *p<0.05. (F–G) ID2 immunoreactivity in transverse spinal sections 24 hpe with a control plasmid (F) or overexpression of a murine ID2 construct (G). Scale bars, 50 µM.
Figure 3 with 1 supplement

ID2 and E proteins counteract each other’s activity during spinal neurogenesis.
(A) Hypothesis: ID2 sequesters E proteins during spinal neurogenesis. (B, C) Detection of cTcf3/cE2a (B) and cTfc12 (C) transcripts by in situ hybridization in transverse spinal cord sections at stage HH24. (D–O) Transverse spinal cord sections of electroporated cells (GFP+ or H2B-GFP+) that differentiated into neurons (HuC/D+) 48 hpe with: a control (D), E47 (E), TCF12 (F), ID2 (G) or combinations of these (H, I); a control (K), E47bm (L), sh-Id2 (M) or their combination (N). (J, O) Box-and-whisker plots obtained from n = 7–16 (J) and n = 9–16 (O) embryos; one-way ANOVA + Tukey’s test; *p<0.05. Scale bars, 50 µM. .
Figure 3—figure supplement 1

E47bm rescues the premature neuronal differentiation caused by both E47 and TCF12.
(A–F) Transverse spinal cord sections of electroporated cells (GFP+) that had differentiated into neurons (HuC/D+) 48 hpe with a control (A), E47 (B), TCF12 (C), E47bm (D) construct or combinations thereof (E, F). (G) The box-and-whisker plots show the proportion obtained from n = 7–14 embryos per condition; one-way ANOVA + Tukey’s test; *p<0.05. Scale bars, 50 µM.
Figure 4

E47 activity is differentially required for the generation of spinal neurons deriving from progenitors expressing ASCL1/ATOH1 and NEUROG1/NEUROG2/PTF1a.
(A) Hypothesis: E proteins co-operate differently with the distinct proneural proteins during spinal neurogenesis. (B–E) Representative images of spinal neurons expressing Lhx2/9 (dI1, (B–B’), Tlx3 (dI3/dI5, (C–C’), Lhx1/5 (dI2/dI4/dI6-V1, (D–D’) or Isl1 (MN, (E–E’), 48 hpe with a control (B–E) or E47bm (B’–E’). (F) Mean ratios ± sem of neuron numbers on the electroporated side relative to the contralateral side, obtained from n = 8–13 embryos; two-sided unpaired t-test; *p<0.05. (G–H’) Transverse spinal cord sections of electroporated cells (RFP+) that differentiated into neurons (HuC/D+) 48 hpe with a control plasmid (G) or a plasmid expressing an E47Dnls-RFP fusion construct (H). (I) Box-and-whisker plots obtained from n = 9–12 embryos; Mann-Whitney’s test; *p<0.05. (J–Q’) Transverse spinal cord sections showing the electroporated cells (RFP+) that differentiated into Lhx2/9+ (J–K’), Tlx3+ (L–M’) or Lhx1/5+ (N–O’) interneurons or Isl1+ motoneurons (P–Q’) 48 hpe with a control plasmid (J,L,N,P) or a plasmid expressing an E47Dnls-RFP fusion construct (K,M,O,Q). Examples of differentiated RFP+;marker+ cells are highlighted by arrowheads, or by stars for the electroporated cells that were found prematurely differentiated in the ventricular zone. (R) Proportions of differentiated electroporated cells (RFP+;HuC/D+ or RFP+;Sox2-) that express the distinct neuronal subtype markers mentioned above, obtained from n = 10–12 embryos; Mann–Whitney’s non-parametric test for Lhx2/9 or two-sided unpaired t-test for the three other markers; *p<0.05. Scale bars, 50 µM.
Figure 5 with 1 supplement
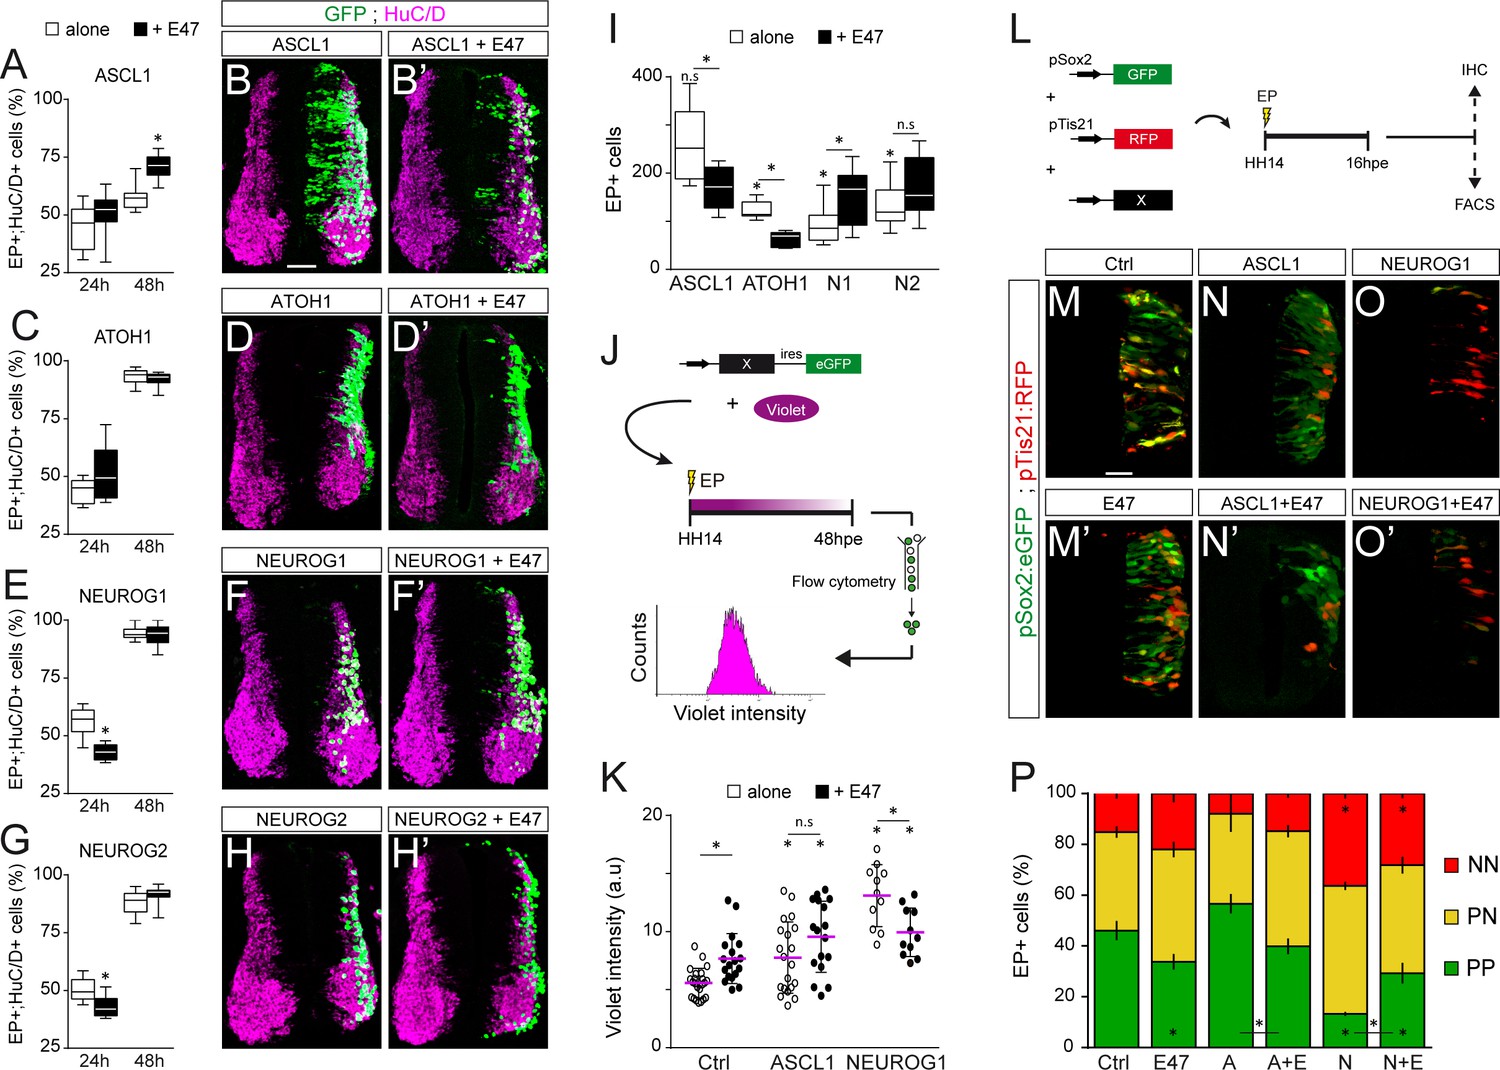
E47 modulates in opposite ways the neurogenic abilities of ASCL1/ATOH1 and NEUROG1/NEUROG2 during spinal neurogenesis.
(A–H’) Transverse spinal cord sections of electroporated cells (GFP +or H2B-GFP+) that differentiated into neurons (HuC/D+) 24 and 48 hpe with ASCL1 (A–B), ATOH1 (C–D), NEUROG1 (E–F) or NEUROG2 (G–H) alone (white) or together with E47 (black, A‘-H’). Box-and-whisker plots obtained from n = 6–9 (A), 6–8 (C), 6–14 (E) and 7–12 (G) embryos; two-way ANOVA + Sidak’s test; *p<0.05. (I) Mean number ±sem of electroporated cells quantified 48 hpe with the proneural proteins on their own (white) or together with E47 (black), obtained from 6 to 14 embryos; two-sided unpaired t-test; *p<0.05. (J) Cell cycle exit assay. (K) Mean Violet fluorescence intensity measured 48 hpe with a control, ASCL1 and NEUROG1 on their own (white) or together with E47 (black). The individual values (dots, n = 11–23 embryos) and the mean (bars) are shown; one-way ANOVA + Tukey’s test and two-way ANOVA + Sidak’s test; *p<0.05. (L) Assessment of the modes of division of spinal progenitors. (M–O) Transverse spinal cord sections showing the activity of the pSox2:GFP and pTis21:RFP reporters at 16 hpe, when electroporated in combination with control, ASCL1 or NEUROG1 on their own (M–O) or together with E47 (M’-O‘). (P) Mean proportion ±sem of cells identified as pSox2+/pTis21- (PP), pSox2 +/pTis21+ (PN) or pSox2-/pTis21+ (NN) when quantified by FACS, obtained from n = 6–10 pools of embryos; two-way ANOVA + Tukey’s test; *p<0.05. Scale bars, 50 µM. .
Figure 5—figure supplement 1
Effects of E47 and proneural proteins on spinal neuronal differentiation.
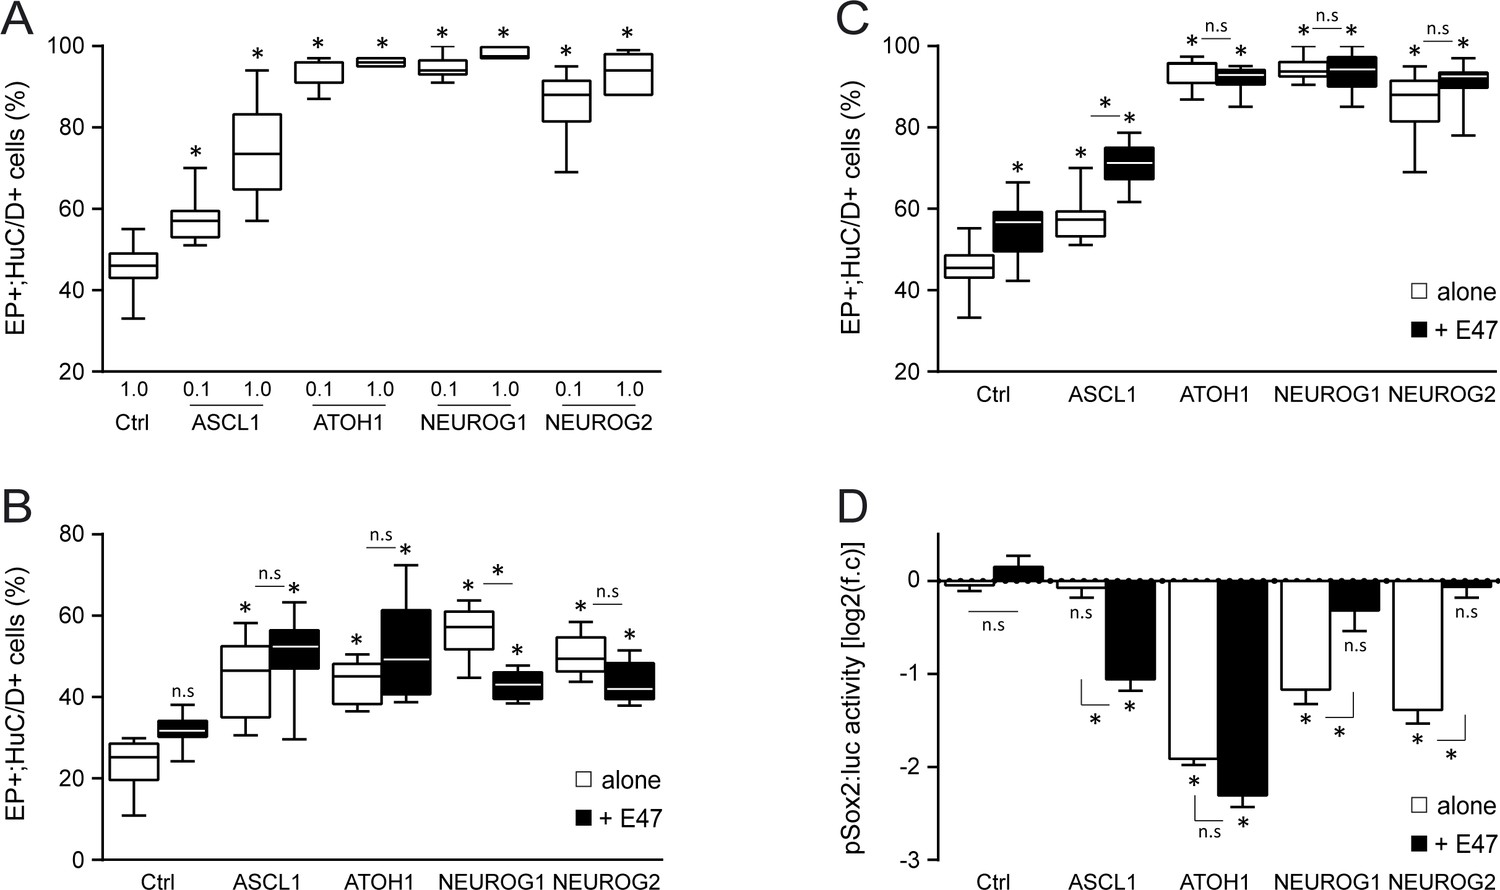
(A) Box-and-whisker plots showing the proportion of electroporated cells (GFP+) that differentiated into neurons (HuC/D+) 48 hpe with increasing concentrations [0.1 or 1 µg/µl] of ASCL1, ATOH1, NEUROG1 or NEUROG2, from n = 7–13 embryos per condition; one-way ANOVA + Tukey’s test. (B, C) Proportion of electroporated cells (GFP+) that differentiated into neurons (HuC/D+) 24 (B) or 48 (C) hpe with control, ASCL1, ATOH1, NEUROG1 or NEUROG2 alone (white whiskers) or together with E47 (black whiskers), obtained from n = 6–13 embryos; one-way ANOVA + Tukey’s test. (D) Transcriptional assay showing the activity of a pSox2:luc reporter measured 24 hpe with control, ASCL1, ATOH1, NEUROG1 or NEUROG2 alone (white whiskers) or together with E47 (black whiskers). The data are expressed in Log2 as the mean fold change ± sem relative to the control values, obtained from n = 6–19 embryos per condition; one-way ANOVA + Tukey’s test; *p<0.05.
Figure 6 with 3 supplements
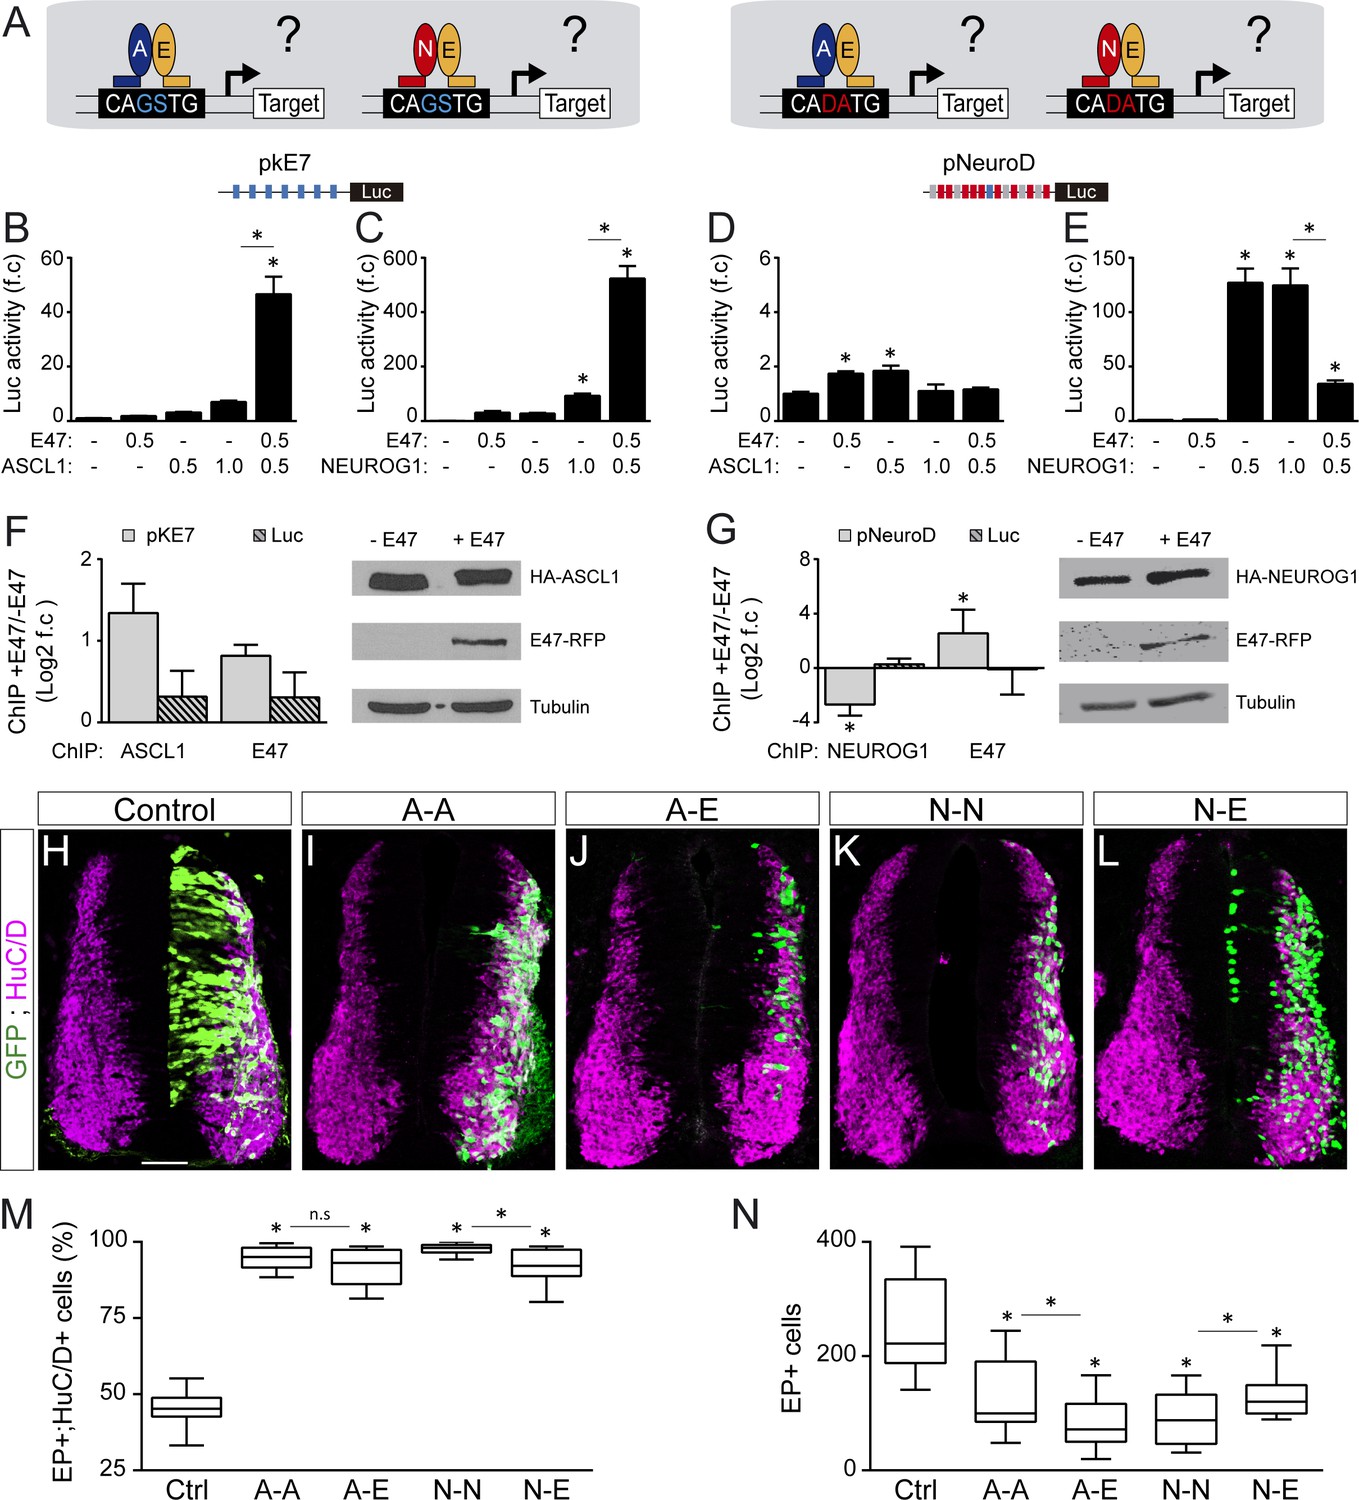
E47 modulates the transcriptional activities of ASCL1 and NEUROG1 in an E-box-dependent manner and through physical interactions.
(A) Hypothesis: E proteins modulate the activity of the proneural proteins differently depending on the E-box context. (B–E) Activity of the pkE7 (B, C) and pNeuroD (D, E) luciferase reporters measured 24 hpe with a control, E47 and ASCL1 (B, D) or NEUROG1 (C, E), expressed as the mean fold change ±sem relative to the control, obtained from n = 8 embryos; one-way ANOVA + Tukey’s test. (F–G) ChIP assays performed on the pkE7 (F) or pNeuroD (G) promoter regions (light grey), or luciferase ORF (Luc, striped grey), in HEK293 cells 24 hr after transfection with HA-ASCL1 (F) or HA-NEUROG1 (G) on their own or together with E47-RFP, expressed as Log2 values of the mean fold change ±sem in DNA binding measured in the presence of E47 relative to absence of E47, obtained from n = 3 (F) or n = 5 (G) experiments; two-sided one sample t-test. The HA-ASCL1, HA-NEUROG1 and E47-RFP proteins probed in western blots, with Tubulin-beta as a transfection control. (H–L) Transverse spinal cord sections of electroporated cells (GFP+) that differentiated into neurons (HuC/D+) 48 hpe with a control (H), ASCL1 or NEUROG1 homodimer (A-A, I; N–N, K), or ASCL1-E47 or NEUROG1-E47 heterodimers (A-E, J; N–E, L). (M) Box-and-whisker plots obtained from n = 12–15 embryos; one-way ANOVA + Tukey’s test. (N) Mean number of electroporated cells (GFP+) generated 48 hpe in the conditions cited above, calculated from n = 11–14 embryos; one-way ANOVA + Tukey’s test. *p<0.05. Scale bars, 50 µM. .
Figure 6—figure supplement 1
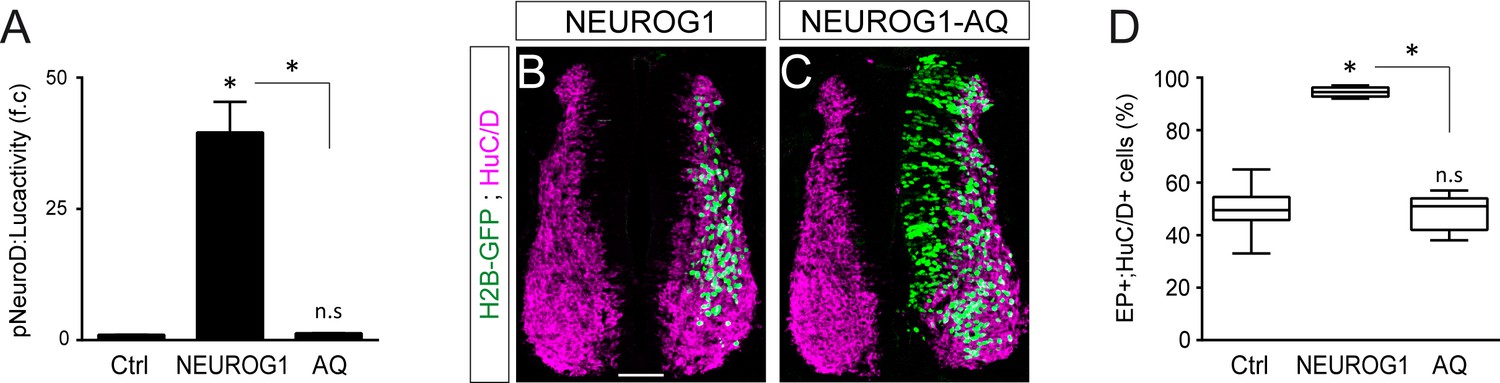
The ability of NEUROG1 to induce spinal neuronal differentiation depends on its DNA-binding.
(A) Transcriptional assay showing the activity of the pNeuroD:luc reporter measured 24 hpe with control or myc-tagged wild-type NEUROG1 construct and the NEUROG1-AQ mutant, obtained from n = 6 embryos per condition; Kruskal-Wallis + Dunn’ test. (B, C) Transverse spinal cord sections of electroporated cells (H2B-GFP+) that differentiated into neurons (HuC/D+) 48 hpe with NEUROG1 (B) or NEUROG1-AQ (C). (D) Box-and-whisker plots showing the proportion obtained from n = 6–7 embryos per condition; Kruskal-Wallis + Dunn’ test. *p<0.05. Scale bars, 50 µM.
Figure 6—figure supplement 2
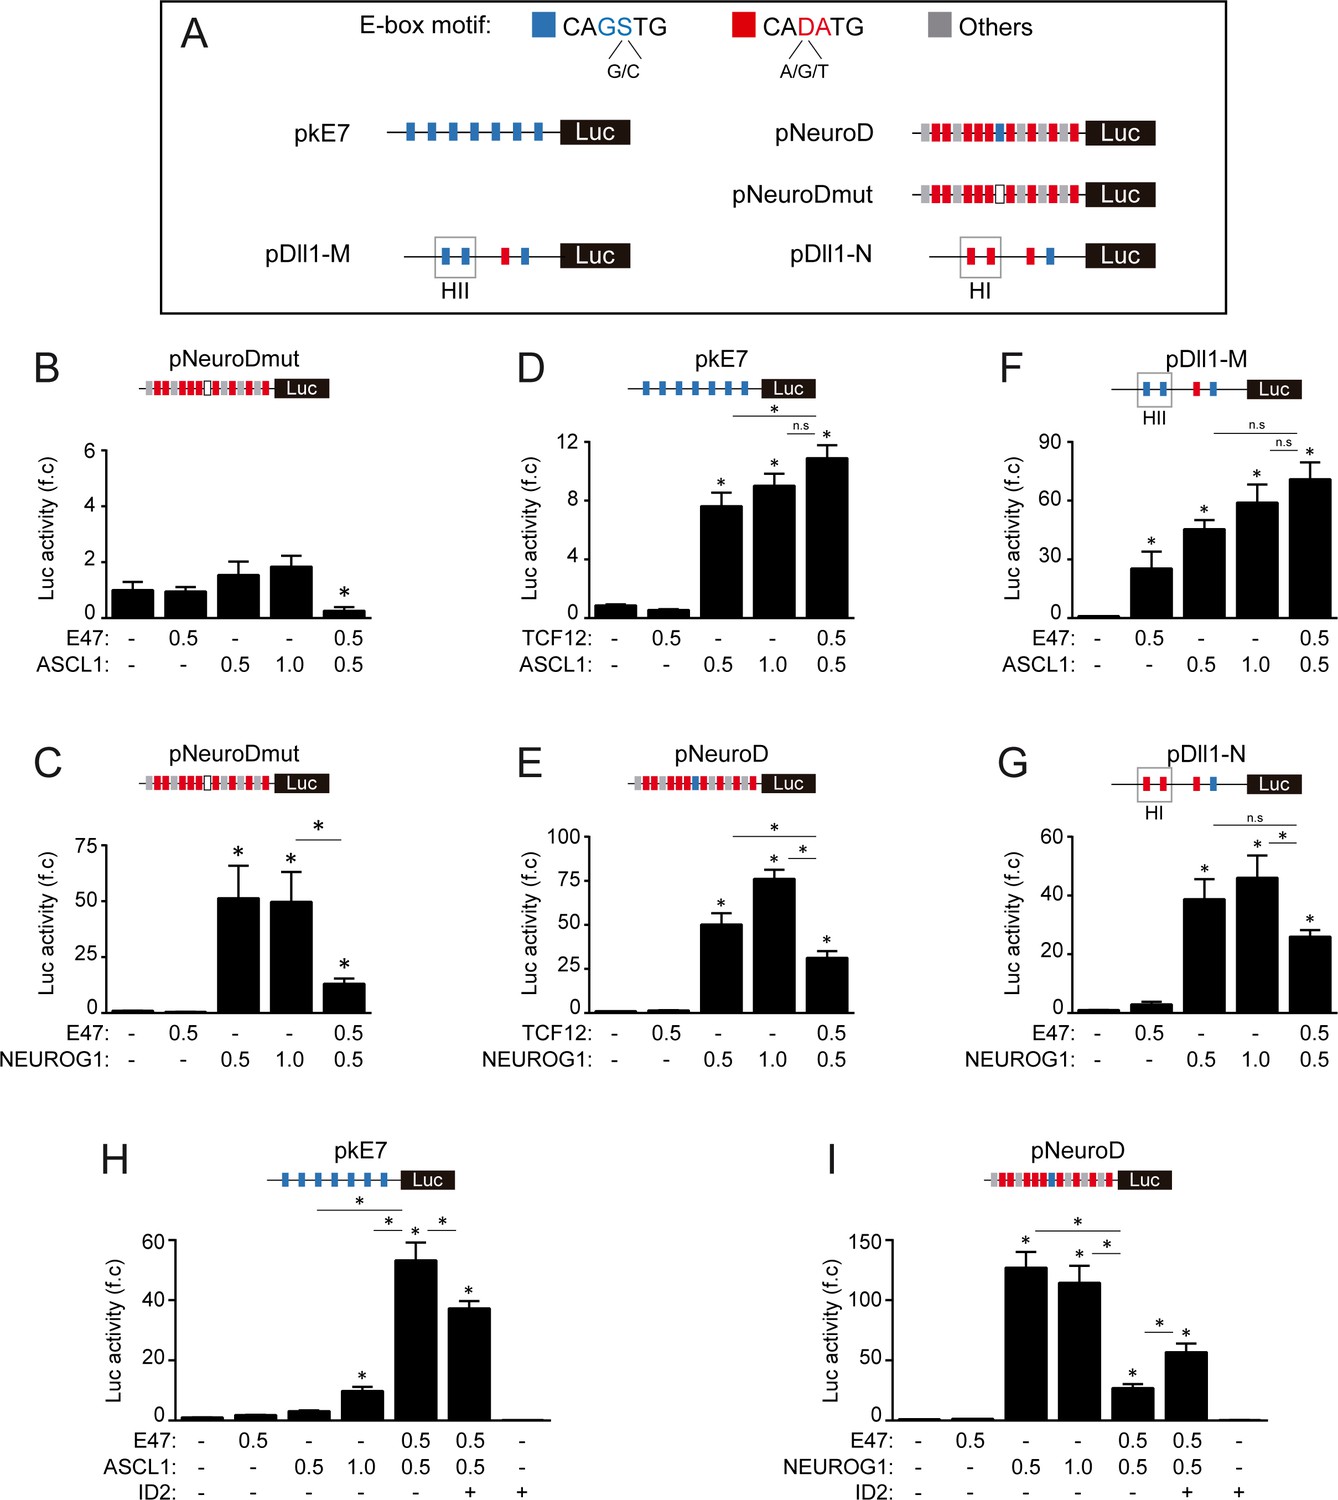
E-box dependent activity of E47, TCF12, ASCL1 and NEUROG1 during spinal neurogenesis.
(A) Schematic representation of the E-box-containing luciferase reporters used in this study. (B, I) Transcriptional assays showing the activity of the mutated version of the pNeuroD:luc reporter measured 24 hpe with control, E47 and ASCL1 (B) or NEUROG1 (C), the effects of TCF12 in combination with ASCL1 on pKE7:luc (D) or with NEUROG1 on pNeuroD:luc (E), the effects of E47 in combination with ASCL1 on pDll1-M:luc (F) or with NEUROG1 on pDll1-N:luc (G) and the consequences of ID2 addition on the effects of E47 in combination with ASCL1 on pKE7:luc (H) or with NEUROG1 on pNeuroD:luc (I). The data are expressed as the mean fold change ± sem relative to the control values, obtained from n = 7–13 (B), 6 (C), 8–9 (D), 10–14 (E), 8–12 (F), 9–14 (G), 8–12 (H) and 8–12 (I) embryos per condition; Kruskal-Wallis + Dunn’ test (B, F) or one-way ANOVA + Tukey’s test (C, D, E, G, H and I); *p<0.05.
Figure 6—figure supplement 3

Characterization of the tethered constructs of bHLH dimers.
(A–C) Western blot detection of monomeric and dimeric ASCL1 (A), NEUROG1 (B) and E47 (C) constructs in protein extracts obtained 24 hr after transfecting HEK293 cells with constructs encoding ASCL1, NEUROG1 and E47 monomers (A, N, E), homo- and heterodimers (A–A, A–E, N–N, N–E), a control plasmid (pCIG), or non-transfected cells (-). (D–F) Transcriptional assays showing the activity of the pkE7 (D), pNeuroD (E) and pSox2 (F) luciferase reporters measured 24 hpe with controls, ASCL1 (A–A) and NEUROG1 (N–N) homodimers, and ASCL1-E47 (A–E) and NEUROG1-E47 (N–E) heterodimers. The data are expressed as the mean (D, E) or Log2 fold changes (F) ± sem relative to the control values, obtained from n = 4–6 (D), 11–12 (E) or 6 (F) embryos per condition; Kruskal-Wallis + Dunn’ test or one-way ANOVA + Tukey’s test; *p<0.05.
Figure 7 with 1 supplement
E47 modulates in opposite ways the neurogenic abilities of ASCL1 and NEUROG1/NEUROG2 during corticogenesis.
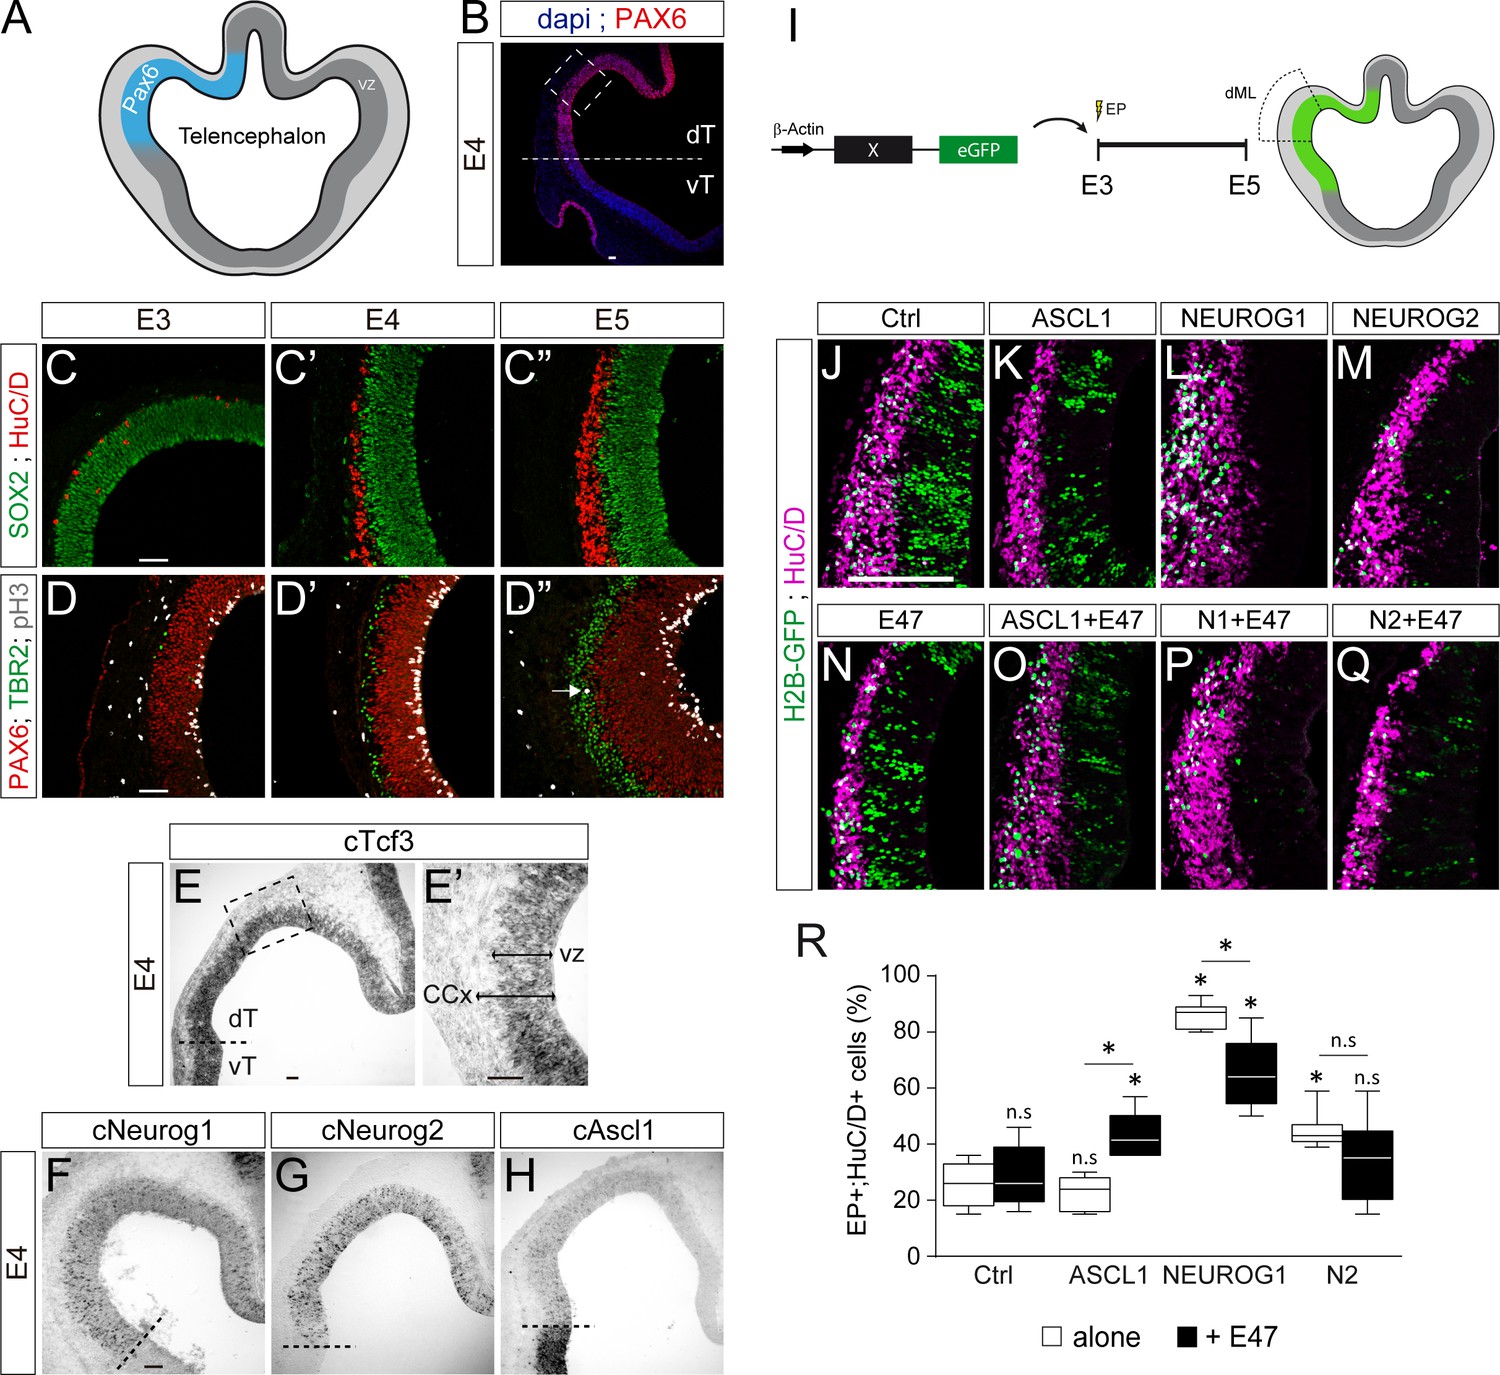
(A) Scheme of the embryonic chick telencephalon at early stages of neurogenesis. (B–D) Coronal telencephalic sections showing PAX6 immunoreactivity and the cell nuclei (DAPI) at low magnification at E4 (B), cortical progenitors and differentiating neurons (SOX2 +and HuC/D+, (C), apical progenitors (PAX6+;TBR2-, (D) and mitotic basal progenitors (TBR2+;pH3+, arrow in D’’) at E3 (C, D), E4 (C’, D’) and E5 (C’’, D’’). (E–H) Detection of cTcf3/cE2a (E), cNeurog1 (F), cNeurog2 (G) and cAscl1 (H) transcripts by in situ hybridization at E4. (I) In ovo electroporation of the chick telencephalon. (J–Q) Coronal telencephalic sections of electroporated cells (GFP+) that differentiated into neurons (HuC/D+) 48 hpe with a control (J), ASCL1 (K), NEUROG1 (L) or NEUROG2 (M) on their own or together with E47 (N–Q). (R) Box-and-whisker plots obtained from n = 5–9 embryos; one-way ANOVA + Tukey’s test; *p<0.05. Scale bars, 50 µM. CCx, cerebral cortex; dT/vT, dorsal and ventral telencephalon; dML, dorso-medial-lateral; VZ, ventricular zone.
Figure 7—figure supplement 1
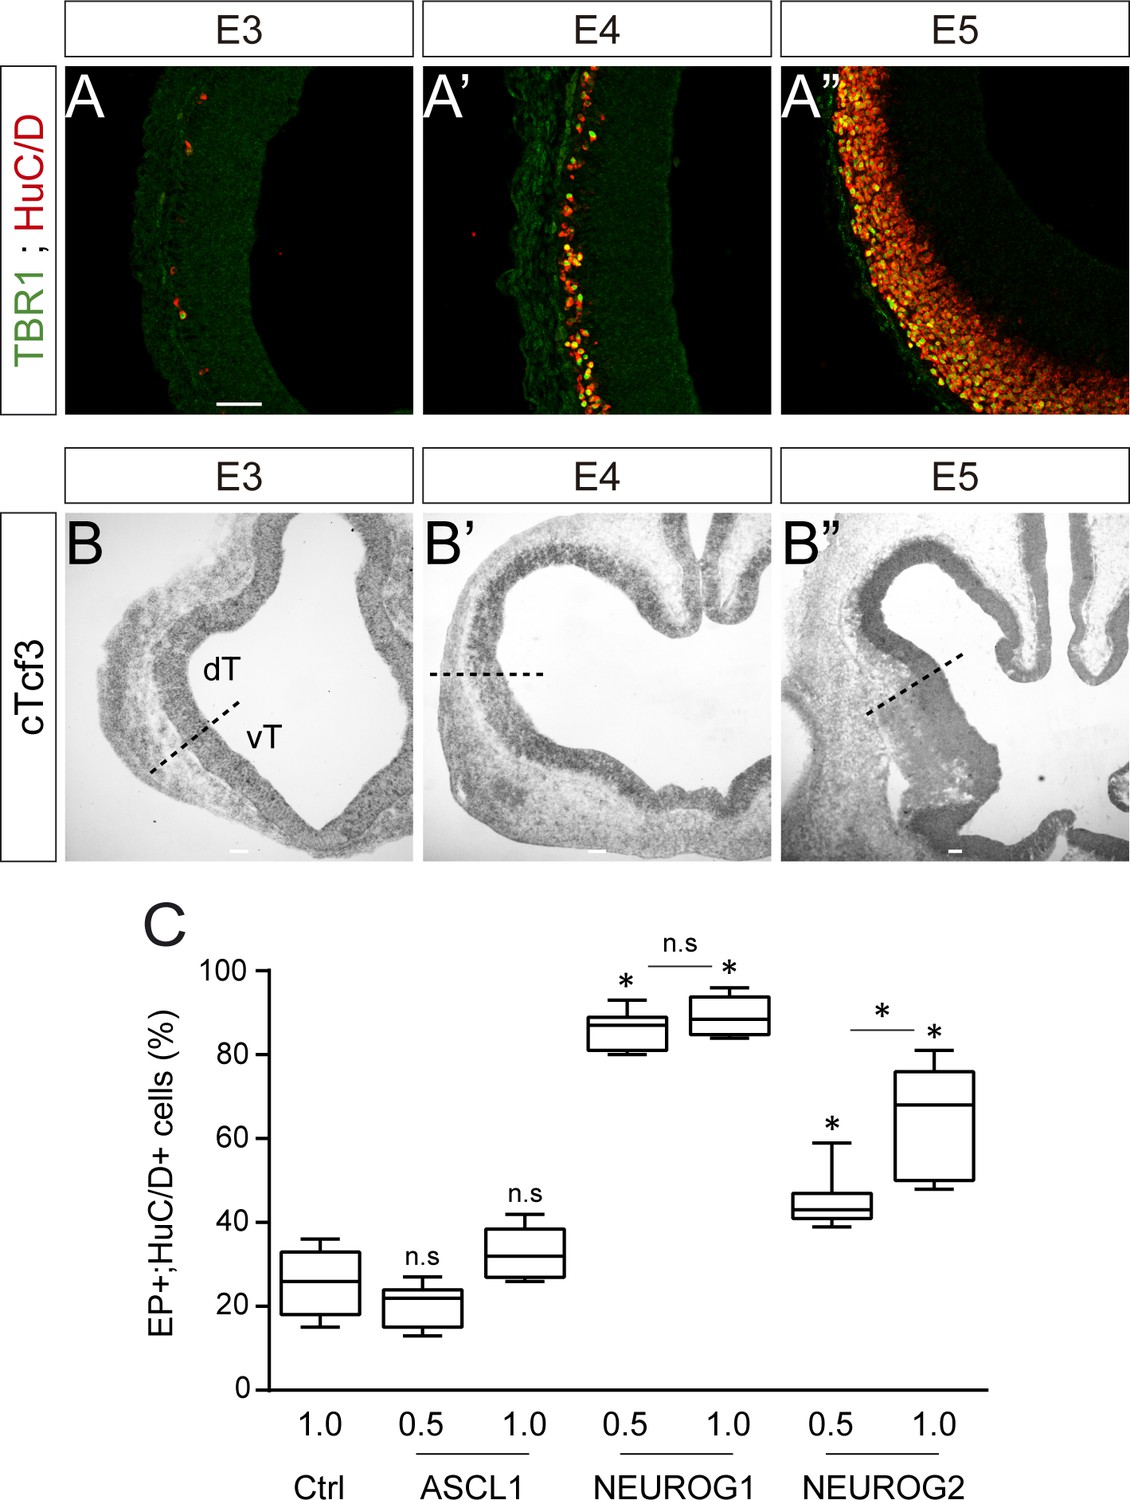
Neurogenesis, cTcf3 expression and concentration-dependent effects of proneural proteins during early chick corticogenesis.
(A) Coronal telencephalic sections showing TBR1 immunoreactivity in differentiating neurons (HuC/D+) that are generated during early corticogenesis in chick, at E3 (A), E4 (A’) and E5 (A’’). (B) Coronal telencephalic sections showing cTcf3/cE2A expression as detected by in situ hybridization during early corticogenesis in chick, at E3 (B), E4 (B’) and E5 (B’’). (C) Proportion of electroporated cells (GFP+) that differentiated into neurons (HuC/D+) 48 hpe with increasing concentrations [0.5 or 1 µg/µl] of the ASCL1, NEUROG1 or NEUROG2 constructs. Data were obtained from n = 6–9 embryos per condition; one-way ANOVA + Tukey’s test; *p<0.05. Scale bars: 50 µM. dT/vT, dorsal and ventral telencephalon.
Figure 8

Model of the E-box-dependent co-operation of E proteins with proneural proteins.
In neural progenitors, ID proteins (ID) physically sequester E proteins (E), thereby regulating their ability to interact with ASCL1 and ATOH1 (A) or NEUROG1/2 (N). When E protein availability is limited, ASCL1/ATOH1 cannot bind optimally to high affinity CAGSTG E-box motifs, resulting in poor regulation of their target genes and favouring symmetric proliferative (PP) divisions and hence, progenitor maintenance. The release of E proteins from IDs allows heterodimerization with ASCL1/ATOH1, resulting in optimal binding to CAGSTG motifs, correct regulation of the target genes and the appropriate increase in neurogenic asymmetric (PN) and self-consuming (NN) divisions. In the absence of E proteins, NEUROG1/2 bind to high affinity CADATG motifs, possibly as homodimers, and regulate the expression of target genes in an exacerbated manner. This deregulation results in excessive neurogenic divisions that cause premature neuronal differentiation and depletion of the progenitor pool. In the presence of E proteins and when N-E heterodimers are formed, the activity of NEUROG1/2 is moderated and the proportions of the different modes of divisions are balanced appropriately to sustain the progenitor population while promoting correct neuronal differentiation.
Tables
Key resources table
| Reagent type (species) or resource | Designation | Source or reference | Identifiers | Additional information |
|---|---|---|---|---|
| Strain, strain background (Gallus gallus domesticus) | Chicken fertilized eggs | Granja Gibert | ||
| Cell line (human) | HEK293 | ATCC | RRID:CVCL_0045 | |
| Transfected construct (empty) | pCAGGS:_ires_ GFP | (Megason and McMahon, 2002) | ||
| Transfected construct (Rattus norvegicus) | pCAGGS:ASCL1 | Other | Gift from François Guillemot, Francis Crick Institute, London, UK | |
| Transfected construct (Rattus norvegicus) | pCAGGS:ASCL1-t- E47_ires_GFP | (Geoffroy et al., 2009) | ||
| Transfected construct (Rattus norvegicus) | pCAGGS:ASCL1-t- ASCL1_ires_GFP | This paper | See Materials and methods | |
| Transfected construct (Mus musculus) | pCAGGS:ATOH1_ ires_GFP | This paper | See Materials and methods | |
| Transfected construct (Mus musculus) | pCAGGS:E47 | (Holmberg et al., 2008) | ||
| Transfected construct (Mus musculus) | pCAGGS:E47bm_ ires_GFP | This paper | See Materials and methods | |
| Transfected construct (Rattus norvegicus) | pCAGGS:HA- ASCL1 | (Alvarez-Rodríguez and Pons, 2009) | ||
| Transfected construct (Rattus norvegicus) | pCAGGS:HA- NGN1 | This paper | See Materials and methods | |
| Transfected construct (Mus musculus) | pCAGGS:ID2_ires _GFP | This paper | See Materials and methods | |
| Transfected construct (Rattus norvegicus) | pCAGGS:NGN1 | Other | Gift from François Guillemot, Francis Crick Institute, London, UK | |
| Transfected construct (Rattus norvegicus) | pCAGGS:NGN1-t- E47_ires_GFP | This paper | See Materials and methods | |
| Transfected construct (Rattus norvegicus) | pCAGGS:NGN1-t- NGN1_ires_GFP | This paper | See Materials and methods | |
| Transfected construct (Rattus norvegicus) | pCAGGS:NGN2 | Other | Gift from François Guillemot, Francis Crick Institute, London, UK | |
| Transfected construct (Rattus norvegicus) | pCAGGS:SMAD5- SD_ires_GFP | (Le Dréau et al., 2012) | ||
| Transfected construct (Mus musculus) | pCAGGS:TCF12 | (Holmberg et al., 2008) | ||
| Transfected construct (Mus musculus) | pCMV2:Flag- E47-RFP | (Mehmood et al., 2009) | ||
| Transfected construct (Mus musculus) | pCMV2:Flag- E47Δnls-RFP | (Mehmood et al., 2009) | ||
| Transfected construct (human) | pCS2:H2B-GFP | (Le Dréau et al., 2014) | ||
| Transfected construct (Mus musculus) | pCS2:Somitabun | (Beck et al., 2001) | ||
| Transfected construct (Mus musculus) | pMiW:myc- NGN1 | (Gowan et al., 2001) | ||
| Transfected construct (Mus musculus) | pMiW:myc- NGN1-AQ | (Gowan et al., 2001) | ||
| Transfected construct (empty) | pSuper | Oligoengine | ||
| Transfected construct (empty) | pShin | (Kojima et al., 2004) | ||
| Transfected construct (Gallus gallus domesticus) | sh-Bmp7 | (Le Dréau et al., 2012) | ||
| Transfected construct (Gallus gallus domesticus) | sh-Smad1 | (Le Dréau et al., 2012) | ||
| Transfected construct (Gallus gallus domesticus) | sh-Smad5 | (Le Dréau et al., 2012) | ||
| Transfected construct (Gallus gallus domesticus) | sh-Id2 | This paper | See Materials and methods | |
| Transfected construct (Mus musculus) | pTubb3:luc | This paper | See Materials and methods | |
| Transfected construct (Mus musculus) | pId2(backbone): luc | (Kurooka et al., 2012) | ||
| Transfected construct (Mus musculus) | pId2(Full):luc | (Kurooka et al., 2012) | ||
| Transfected construct (Mus musculus) | pId2(BREonly): luc | (Kurooka et al., 2012) | ||
| Transfected construct (Mus musculus) | pId2(BREmut): luc | (Kurooka et al., 2012) | ||
| Transfected construct (Gallus gallus domesticus) | pSox2:luc | (Saade et al., 2013) | ||
| Transfected construct (artificial) | pKE7:luc | (Akazawa et al., 1995) | ||
| Transfected construct (Mus musculus) | pNeuroD:luc | Other | Gift from François Guillemot, Francis Crick Institute, London, UK | |
| Transfected construct (Mus musculus) | pNeuroDmut: luc | This paper | See Materials and methods | |
| Transfected construct (Mus musculus) | pDll1-M:luc | (Castro et al., 2006) | ||
| Transfected construct (Mus musculus) | pDll1-N:luc | (Castro et al., 2006) | ||
| Transfected construct (Gallus gallus domesticus) | pSox2:eGFP | (Saade et al., 2013) | ||
| Transfected construct (Mus musculus) | pTis21:RFP | (Saade et al., 2013) | ||
| Biological sample (Gallus gallus domesticus) | developing spinal cord (HH14-HH24) | |||
| Biological sample (Gallus gallus domesticus) | developing telencephalon (E3-E5) | |||
| Antibody | anti-Ascl1 (mouse) | BD Pharmingen | cat #556604; RRID:AB_396479 | |
| Antibody | Anti-Chx10 (guinea pig) | Other | Gift from Sam Pfaff, The Salk Institute for Biological Studies, La Jolla, CA, USA; 4% PFA fixation; dilution 1/10,000 | |
| Antibody | Anti-E2A (rabbit) | Santa Cruz | cat #sc-349; RRID:AB_675504 | |
| Antibody | Anti-En-1 (mouse) | Other | Gift from Alexandra Joyner, Sloan Kettering Institute, New York, NY, USA; 4% PFA fixation; dilution 1/100 | |
| Antibody | Anti-Evx1 (mouse) | DSHB | cat #99.1-3A2; RRID:AB_528231 | |
| Antibody | Anti-Gata3 (mouse) | Santa Cruz | cat #sc-268; RRID:AB_2108591 | |
| Antibody | Anti-HA (rabbit) | Abcam | cat #ab20084 RRID:AB_445319 | |
| Aantibody | Anti-HuC/D (mouse) | Life Technologies | cat #A-21271; RRID:AB_221448 | |
| Antibody | Anti-ID2 (mouse) | Abcam/Thermo Fisher Scientific | cat #ab166708; RRID: AB_2538566 | |
| Antibody | Anti-ID2 (rabbit) | Calbio Reagents | cat #M213; RRID: AB_1151771 | |
| Antibody | Anti-Isl1 (mouse) | DSHB | cat #402D6; RRID: AB_528315 | |
| Antibody | Anti-Lbx1 (guinea pig) | Other | Gift from Thomas Müller and Carmen Birchmeier, Max Delbrück Center for Molecular Medicine, Berlin, Germany; 4% PFA fixation; dilution 1/10,000 | |
| Antibody | Anti-Lhx1/5 (mouse) | DSHB | cat #4F2; RRID: AB_2314743 | |
| Antibody | Anti-Lhx2/9 (rabbit) | Other | Gift from Thomas Jessell, Zuckerman Institute, Departments of Neuroscience, and Biochemistry and Molecular Biophysics, Columbia University, New York, NY, USA; 4% PFA fixation; dilution 1/5,000 | |
| Antibody | Anti-Lmx1b (mouse) | DSHB | cat #50.5A5; RRID:AB_2136850 | |
| Antibody | Anti-Neurogenin-1 (rabbit) | Millipore | cat #AB15616; RRID:AB_838216 | |
| Antibody | Anti-Nkx6.1 (mouse) | DSHB | cat #F55A10; RRID:AB_532378 | |
| Antibody | Anti-Pax2 (rabbit) | Zymed | cat #71–6000; RRID:AB_2533990 | |
| Antibody | Anti-Pax6 (mouse) | DSHB | Cat#pax6; RRID:AB_528427 | |
| Antibody | Anti-Pax6 (rabbit) | Covance/Biolegend | cat #901301; RRID:AB_2565003 | |
| Antibody | Anti-pH3 (rat) | Sigma Aldrich | cat #H9908; RRID:AB_260096 | |
| Antibody | Anti-RFP (rabbit) | (Herrera et al., 2014) | ||
| Antibody | Anti-Sox2 (rabbit) | Abcam | cat #ab97959; RRID:AB_2341193 | |
| Antibody | Anti-Trb1 (rabbit) | Abcam | cat #ab31940; RRID:AB_2200219 | |
| Antibody | Anti-Tbr2 (rabbit) | Abcam | cat #ab23345; RRID:AB_778267 | |
| Antibody | Anti-Tlx3 (guinea pig) | Other | Gift from Thomas Müller and Carmen Birchmeier, Max Delbrück Center for Molecular Medicine, Berlin, Germany; 4% PFA fixation; dilution 1/10,000 | |
| Antibody | Anti-Tubulin, beta (mouse) | Millipore | cat #MAB3408; RRID:AB_94650 | |
| Sequence- based reagent | Primers for ChIP of the pKE7 promoter region: | This study | #FW:CAggTgg CAggCAgg; #REV: AAgCAgAACg Tgggg | |
| Sequence- based reagent | Primers for ChIP of the pNeuroD promoter region: | This study | #FW:CTggCTTCTAA TCTCCATCAC; #REV:gTTTCCAg ATgAggTCgT | |
| Sequence- based reagent | Primers for ChIP of the Luciferase ORF: | This study | #FW:gAAgACgC CAAAAACATA; #REV:CgTATCTCT TCATAgCCTTA | |
| Commercial assay or kit | CellTrace Violet Cell Proliferation Kit | Thermo Fisher Scientific | Cat #C34557 | |
| Software, algorithm | Adobe Photoshop CS5 | Adobe | RRID:SCR_014199 | |
| Software, algorithm | FlowJo | TreeStar Inc | RRID:SCR_000410 | |
| Software, algorithm | ImageJ | (Schneider et al., 2012) | RRID: SCR_003070 | http://imagej.net/Welcome |
| Software, algorithm | Leica LAS AF Image Acquisition | Leica Microsystems | RRID:SCR_013673 |
Additional files
-
Transparent reporting form
- https://doi.org/10.7554/eLife.37267.021
Download links
A two-part list of links to download the article, or parts of the article, in various formats.
Downloads (link to download the article as PDF)
Open citations (links to open the citations from this article in various online reference manager services)
Cite this article (links to download the citations from this article in formats compatible with various reference manager tools)
E proteins sharpen neurogenesis by modulating proneural bHLH transcription factors’ activity in an E-box-dependent manner
eLife 7:e37267.
https://doi.org/10.7554/eLife.37267


