The mobility of packaged phage genome controls ejection dynamics
- College of Veterinary Medicine, University of Illinois at Urbana-Champaign, United States
- Lund University, Sweden
Figures
Figure 1
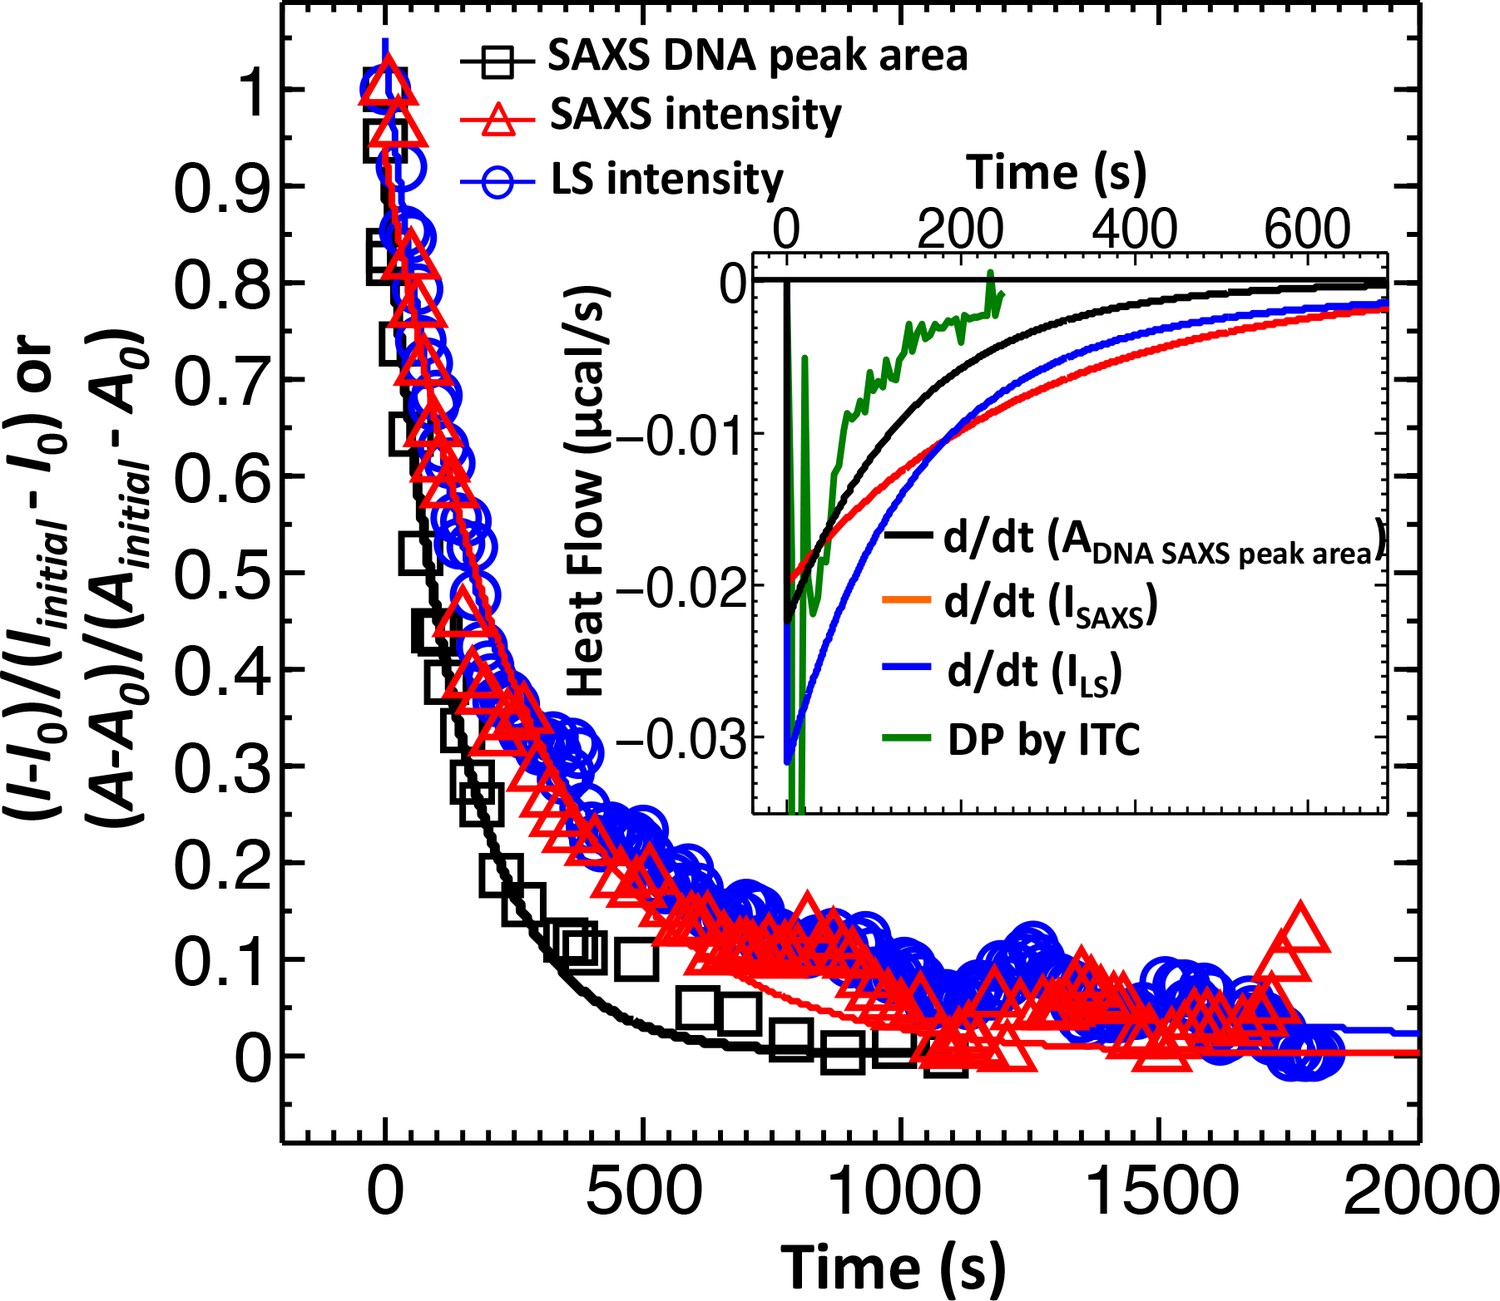
Direct comparison between LS, SAXS and ITC data for phage λ DNA ejection dynamics.
The derivative with respect to time of the LS-measured normalized forward scattering curve yields the instantaneous change in the number of ejecting phages versus time (dΔI/dt). This resulting dΔI/dt(t) curve is scaled to correspond to the ITC measured enthalpy released from a phage population during DNA ejection process. Figure shows comparison of DNA ejection dynamics for phage λ mixed with LamB receptor at 22°C measured by LS [I(0) versus time], time-resolved SAXS [I(0) versus time], and time-resolved SAXS [DNA diffraction peak area versus time]. [SAXS data is discussed in the Supplemental Meterial Section.] The lines connecting the data points are exponential fits for each data set. Figure inset shows the ITC titration DP curve (green) compared to derivatives of LS and SAXS data, which have been scaled to match the phage concentration in an ITC measurement.
Figure 2
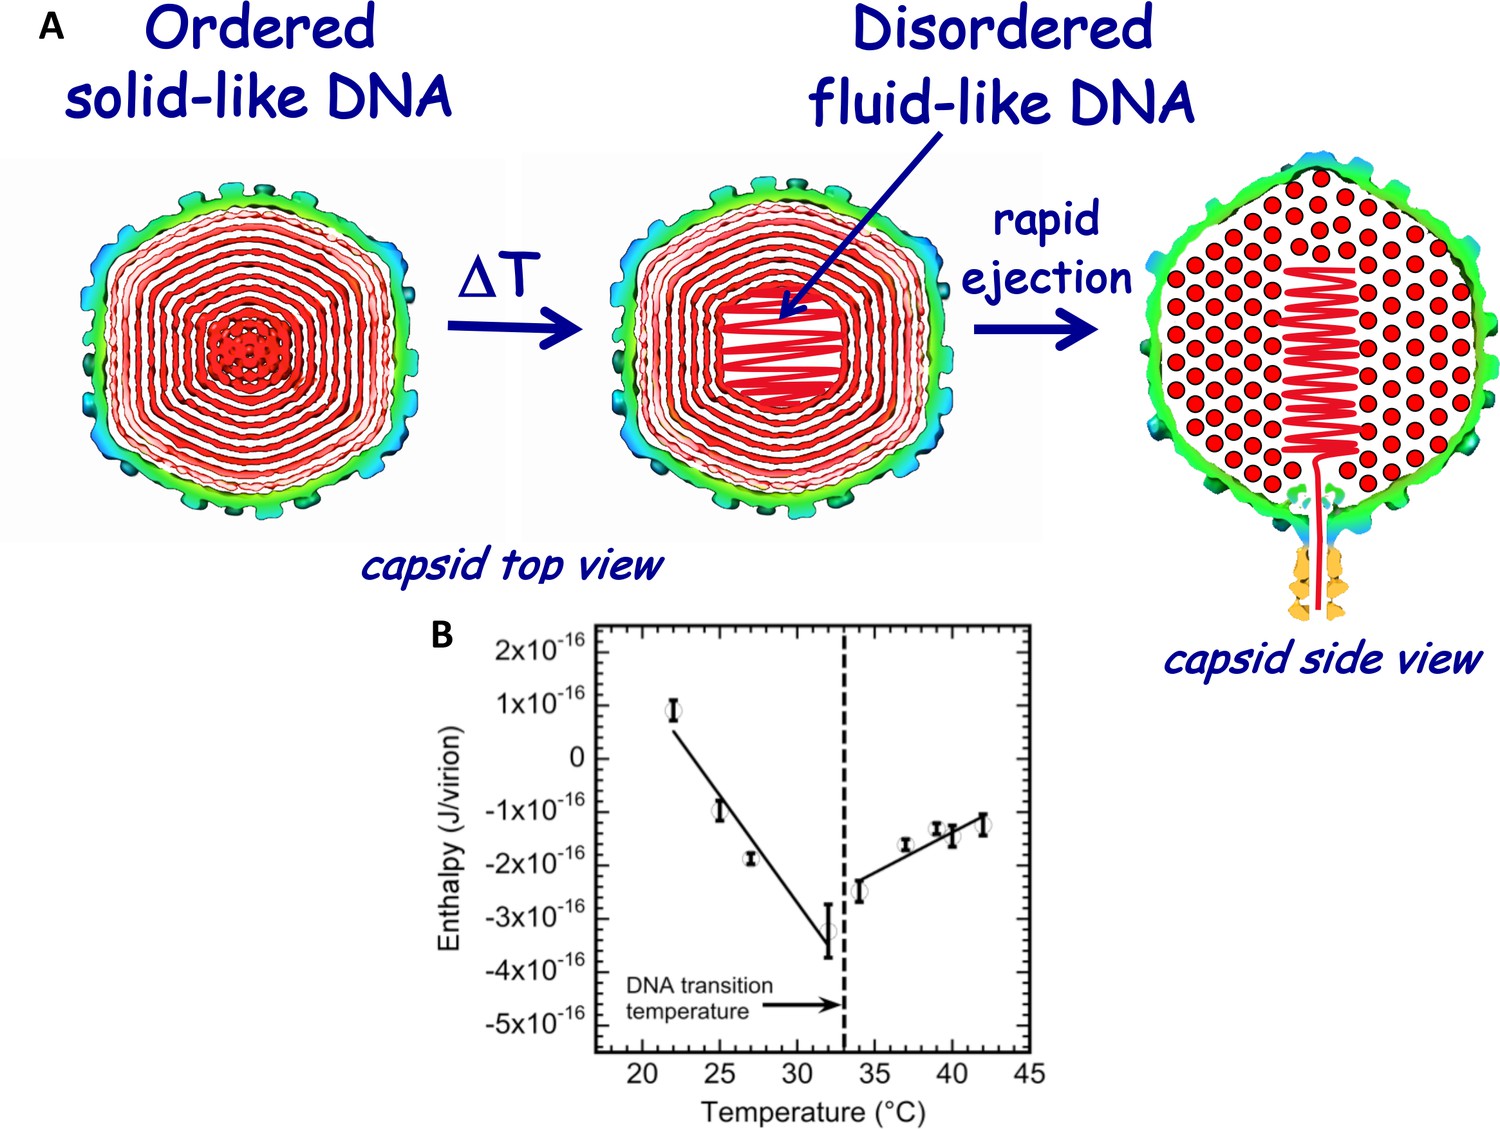
Schematic illustration of DNA disordering transition in the capsid.
Transition occurs when the temperature is increased as we first observed with isothermal titration calorimetry. (A) DNA disordering transition, which occurs when the temperature is increased, originates close to the center of the capsid, where DNA is more stressed due to stronger bending and larger packing defects. (Left) Cross-sections of the top view of the capsid. (Right) A side view cross-section of the capsid, which illustrates that DNA closer to the center of the capsid is likely to be ejected first since, due to dsDNA bending stress constraints, it is the last DNA portion to be packaged in the capsid during phage assembly. The schematic illustration of DNA inside the capsid shows the ordering of an averaged DNA structure and not the arrangement of individual DNA strands. (B) Enthalpy of DNA ejection per virion (J) versus temperature for wt-DNA phage λ titrated into LamB solution. Abrupt enthalpy change inversion with temperature at ~33°C shows transition in energetics of DNA state inside the capsid. Dashed lines are drawn to guide the eye. ∆Hej values were obtained as an average of six independent measurements for each sample. Vertical error bars are SEs.
Figure 3 with 1 supplement
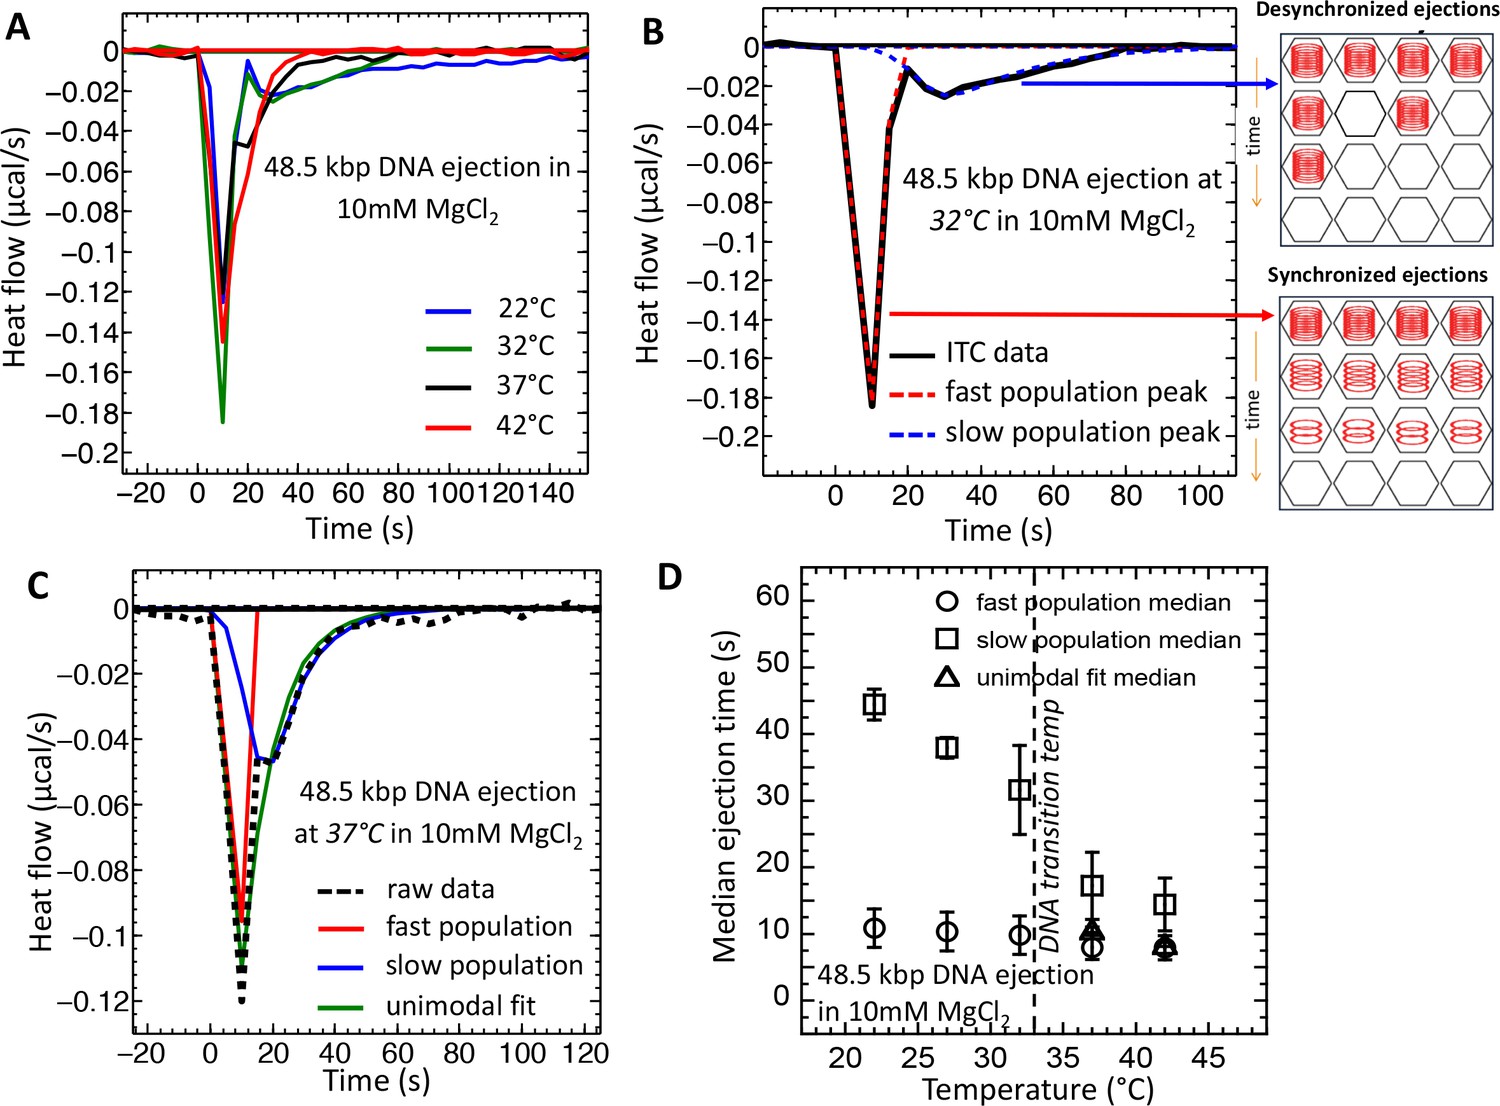
Temperature induced transition from two population (synchronized and desynchronized) to one population (synchronized) phage DNA ejection dynamics measured with ITC.
ITC-measured heat flow (μcal/s) released when wt phage λis titrated into LamB solution, triggering DNA ejection at different temperatures, in 10 mM MgCl2 Tris-buffer. (A) At temperatures below the intracapsid DNA transition (22 and 32°C), DP curve shows two exothermic peaks associated with two phage populations with fast (synchronized) and slow (desynchronized) DNA ejection dynamics. At temperatures above the intracapsid DNA transition (37 and 42°C), DP curve shows only one exothermic peak associated with one phage population with fast synchronized ejection dynamics. (B) DP curve for phage DNA ejection at 32°C (below DNA transition temperature) is fitted with deconvoluted skewed Gaussian curves, resolving peaks for both fast and slow ejection dynamics. (C) DP curve for phage DNA ejection at 37°C (above DNA transition temperature) fitted with skewed bimodal (deconvoluted) and unimodal Gaussian curves. Bimodal fit overlaps with unimodal fit, demonstrating that asymmetric unimodal Gaussian fit can be used to determine peak position and median time for ejection process above the DNA transition temperature, where one phage population with synchronized ejection dynamics is predominant. (D) Median time values derived from skewed Gaussian fit analysis for the DNA ejection process at five different temperatures (both bimodal and unimodal fits were made depending on the number of peaks). Error bars show the standard error (SE) of the width of Gaussian fit. Below the DNA transition temperature (22 and 32°C), two exothermic peaks are well resolved. Above the DNA transition temperature (37 and 42°C), deconvoluted peaks overlap and can be fitted with unimodal skewed Gaussian fit, as shown in (B).
Figure 3—figure supplement 1
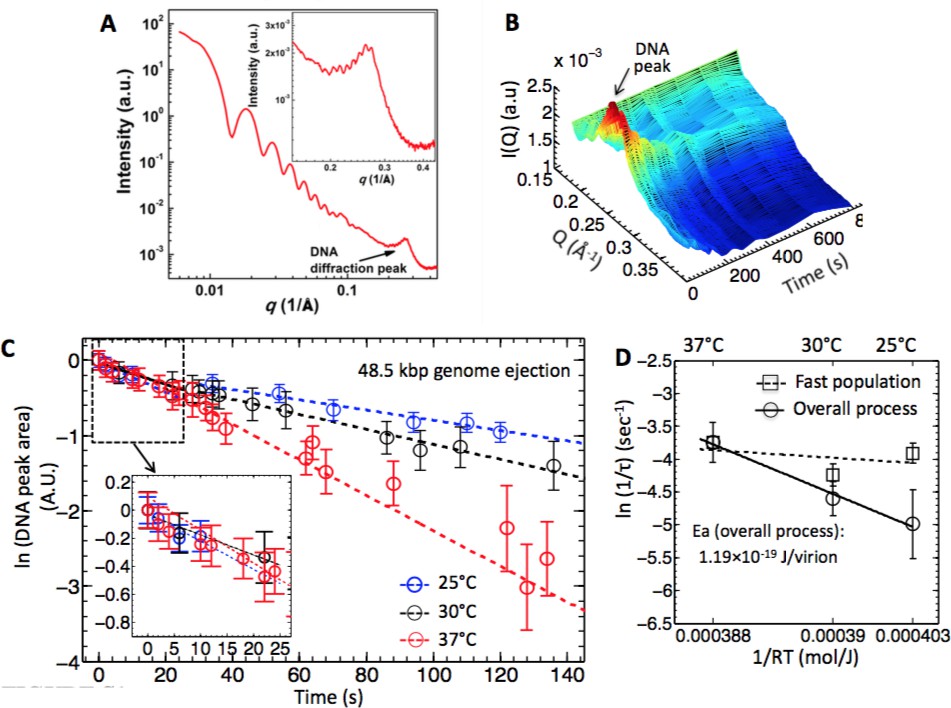
Energy of activation for synchronized and desynchronized ejections measured by time-resolved SAXS.
(A) Radially averaged SAXS scattering intensity versus scattering vector q for wt phage l at 25°C. Figure inset shows the DNA diffraction peak in detail. The scattering profile at lower q is attributed to the protein capsid. (B) Time- resolved 3D representation of the SAXS-measured change in DNA diffraction peak versus time for the wt phage l DNA ejection process in 10 mM MgCl2 Tris-buffer at 25°C. The color scale is based on the height relative to XY plane. (C) DNA ejection dynamics derived from the change in DNA diffraction peak area monitored by time-resolved SAXS for wt phage l mixed with LamB in 10 mM MgCl2 Tris-buffer at different temperatures. DNA peak area is plotted on a ln-scale. The dashed lines are the linear fits to the data. The figure inset shows the DNA peak area change during the initial 20 s, displaying no temperature dependence. This reflects synchronized DNA ejection dynamics from a phage population with DNA in a fluid-like state and negligible energy of activation to initiate the ejection process. As seen in the figure, ejection rates at times longer than 20 s show strong temperature dependence; this reflects desynchronized ejection dynamics from a phage population with DNA in a solid-like state and measurable energy of activation to initiate the ejection process. (D) Natural logarithms of ejection rate constants (k = 1/t) (corresponding to the slopes of the linear fits in (C) as a function of inverse temperature. In order to separate the rates for synchronized and desynchronized ejection dynamics, the rate constants are plotted separately for a phage population with fast ejection dynamics at time interval < 20 s, and for a phage population with slow ejection dynamics at times > 20 s. The ejection rates for the slow ejection dynamics phage population show exponential rate dependence on inverse temperature (i.e. Arrhenius dependence), evidenced by the linearity of the fit. Error bars for each ln(1/τ) value are from progression of SE values of τ. Dong Li is acknowledged for help with preparing this figure.
Figure 4
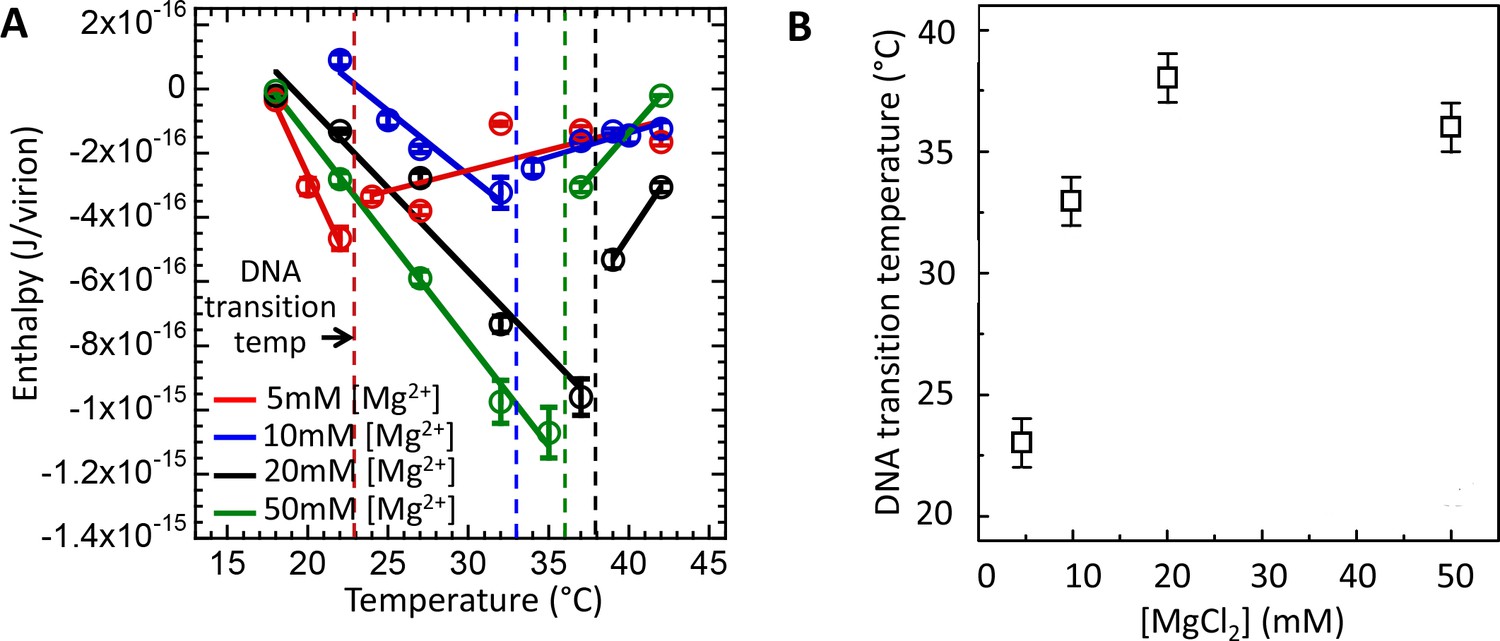
Intracapsid solid-to-fluid like DNA transition temperature as a function of Mg-concentration measured with ITC.
Transition temperature T* strongly rises with the initial increase in Mg-concentration but saturates at physiologic temperature of infection (37°C) at [Mg2+] ≥ 20 mM. (A) Enthalpy of DNA ejection per virion (J) from wt DNA phage λ versus temperature, Hej, in MgCl2 Tris-buffers with varying MgCl2 concentrations (5 to 50 mM). Dashed lines are drawn to guide the eye. The vertical dashed lines indicate the DNA transition point. Vertical error bars are SEs. (B) Comparison between DNA transition temperatures determined by ITC as a function of MgCl2 concentration in Tris-buffer.
Figure 5
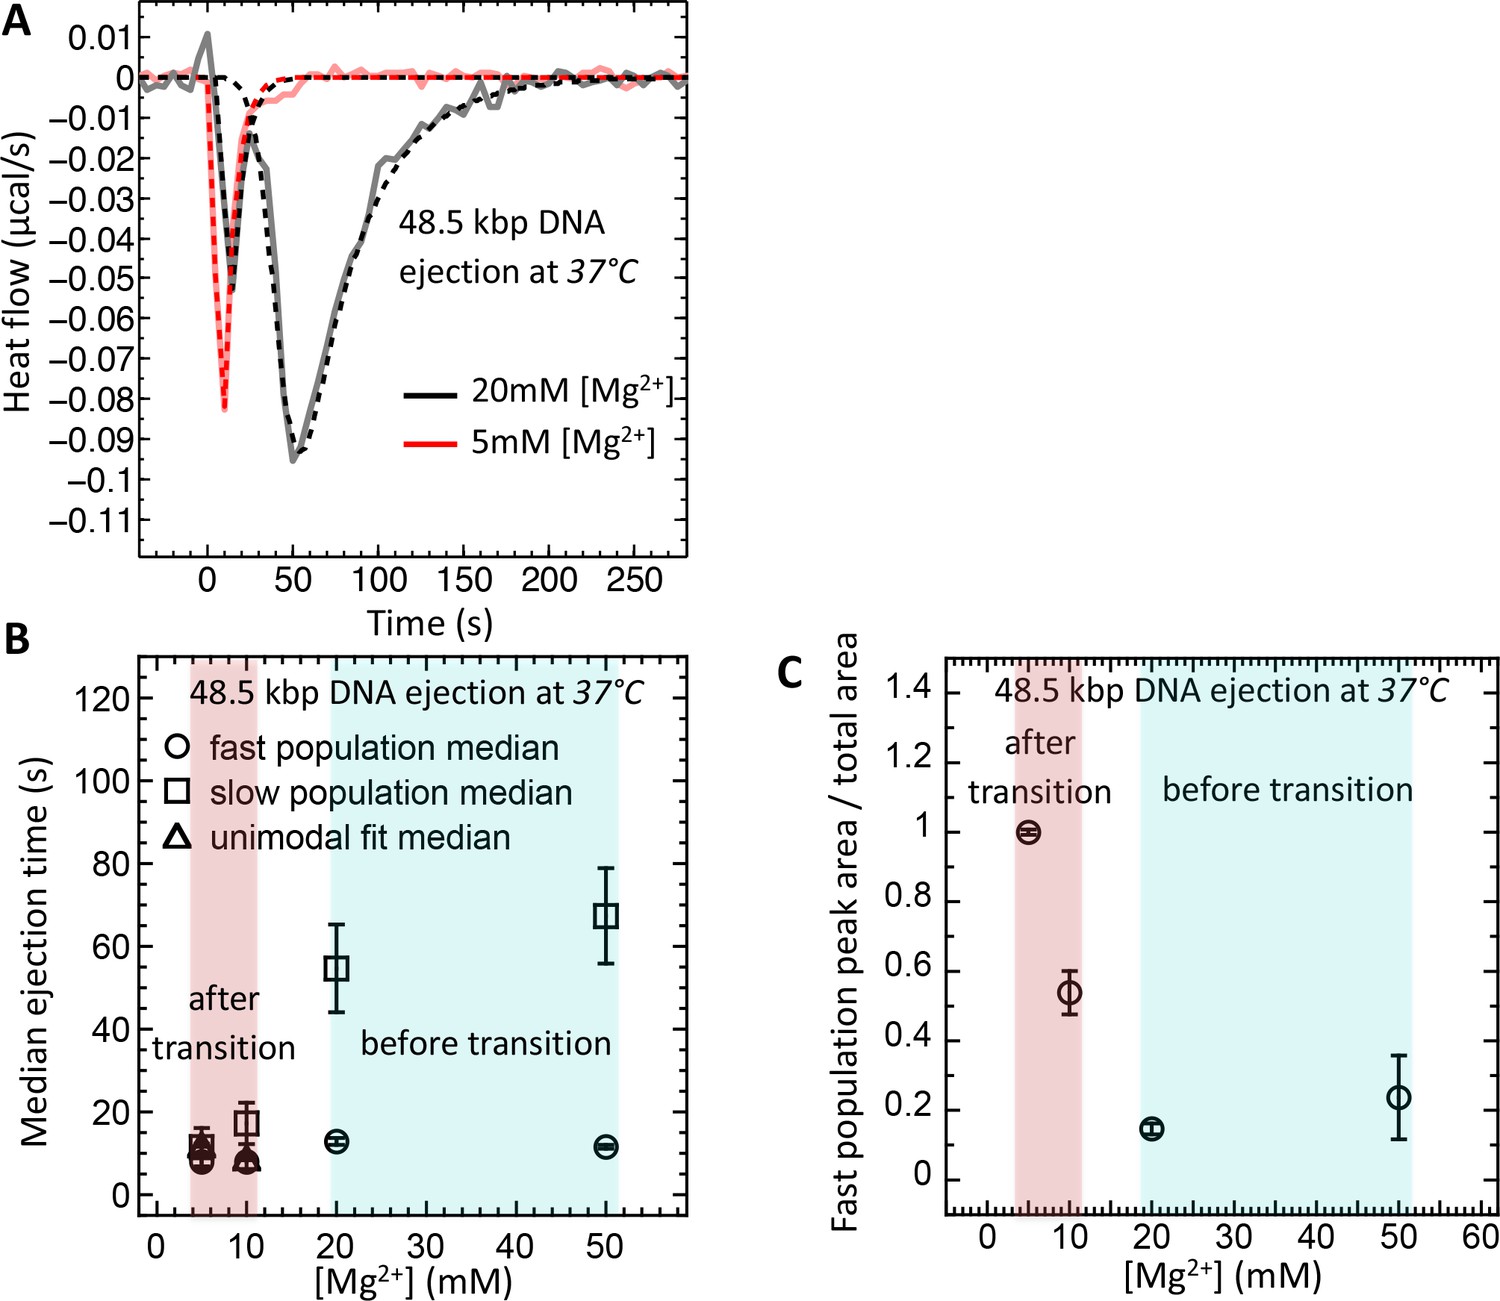
Well correlated with intracapsid DNA transition temperature, DNA ejection dynamics at physiologic temperature of infection (37°C) is fast with synchronized ejection events at low [Mg2+] of < 20 mM (where packaged DNA is in a fluid-like state).
At [Mg2+] ≥ 20 mM, there is a coexistence between phage populations with fast synchronized and slow desynchronized ejection dynamics (DNA in fluid- and solid-like states inside the capsid). Figure shows ITC measured heat flow (μcal/s) versus time for DNA ejection occurring at titration of phage λ into LamB solution at 37°C and Mg2+ concentrations between 5 and 50 mM in Tris-buffer. (A) DP titration curves at 5 mM Mg2+ Tris-buffer (above DNA transition where intracapsid DNA is in a fluid-like state at 37°C) and 20 mM Mg2+ Tris-buffer (below DNA transition where intracapsid DNA is in a solid-like state at 37°C). At 5 MgCl2, where packaged DNA is in a predominantly fluid-like state (since T* ∼23°C), only one exothermic DP peak corresponding to fast synchronized ejection dynamics is observed on the titration curve, with median ejection time of ∼10 s (corresponding to DNA translocation time from a capsid). At 20 mM MgCl2, the intracapsid DNA is at its transition temperature (T* ∼37°C) and the DP titration curve shows two distinct exothermic peaks attributed to fast and slow ejection dynamics corresponding to coexisting phage populations with intracapsid DNA in solid-like and fluid-like states. (B) Median ejection times (corresponding to average ejection times) derived from deconvoluted skewed Gaussian fits to DNA ejection DP peaks in 5–50 mM MgCl2 Tris-buffers at 37°C. (C) The ratio between fast population peak area (for synchronized ejection events) and total area of both fast and slow exothermic peaks. This plot reflects the fraction of phages (from the whole phage population) with intracapsid DNA in a fluid-like state and synchronized ejection dynamics. Figure shows how variation in Mg-concentration has a dramatic effect on ejection dynamics by switching it from all synchronized to nearly all desynchronized DNA ejection events.
Additional files
-
Transparent reporting form
- https://doi.org/10.7554/eLife.37345.009
Download links
A two-part list of links to download the article, or parts of the article, in various formats.
Downloads (link to download the article as PDF)
Open citations (links to open the citations from this article in various online reference manager services)
Cite this article (links to download the citations from this article in formats compatible with various reference manager tools)
The mobility of packaged phage genome controls ejection dynamics
eLife 7:e37345.
https://doi.org/10.7554/eLife.37345


