Anisotropic organization of circumferential actomyosin characterizes hematopoietic stem cells emergence in the zebrafish
- Institut Pasteur, France
- CNRS, UMR 3738, France
- Sorbonne Université, UPMC Paris 06, Complexité du Vivant, France
- CNRS, UMR3691, France
Figures
Figure 1 with 4 supplements
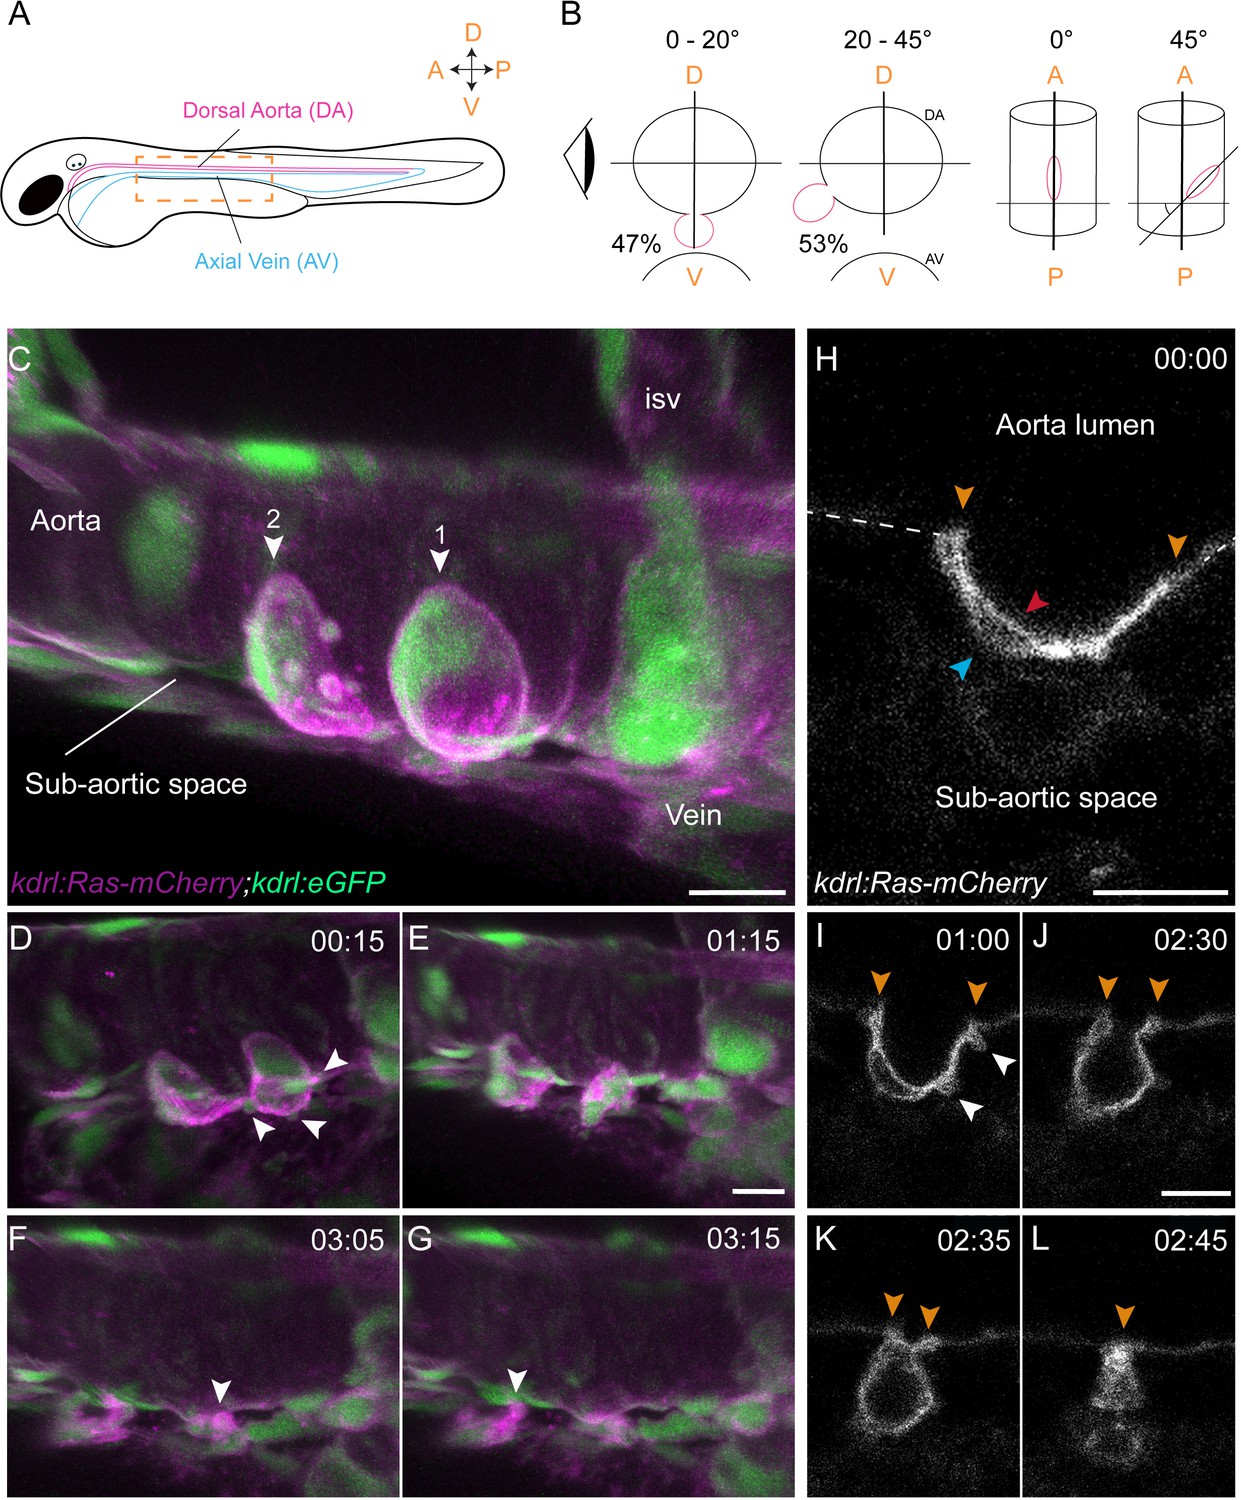
Sequential steps and morphological changes during the EHT
(A–B) The EHT is variable in space and time. Schematic representations of (A) a zebrafish embryo at 48 hpf; a yellow rectangle shows the region of imaging. (B) Left, transversal sections of the dorsal aorta showing the % of cells undergoing emergence (in red) at 0°−20° or 20°–45° angle relative to the dorso-ventral axis (N = 49 cells). The eye looks in the direction of imaging. Right, top view showing variation of the angle of emergence (with the A-P axis as reference). Note that the EHT is also characterized by variability in its time-length, see Figure 1—figure supplement 1 and main text. (C–L) Live confocal images from 48 hpf Tg(kdrl:Ras-mCherry; kdrl:eGFP) embryos. (C–G) Images extracted from a 3D-rendering TL sequence (D–G) and a Z-stack acquired 120 min before initiation of the time-lapse (C), showing the typical changes of cell shape during the EHT (see Figure 1—video 1). (C) Numbered arrowheads: rim of two cup-shaped EHT undergoing cells. Arrowheads indicate blebs in (D) and cellular foots in (F and G). isv: intersegmental vessel (see also Figure 1—video 1). (H–L) Single Z-planes corresponding to cell #2 extracted from the same TL sequence. Arrowheads: cell borders connecting with adjoining endothelial cells (in yellow), the luminal membrane (in red), the basal membrane (in blue), and blebs (in white), respectively (see Figure 1—video 2). Time is indicated in hrs:min. Scale bars, 10 μm.
Figure 1—figure supplement 1
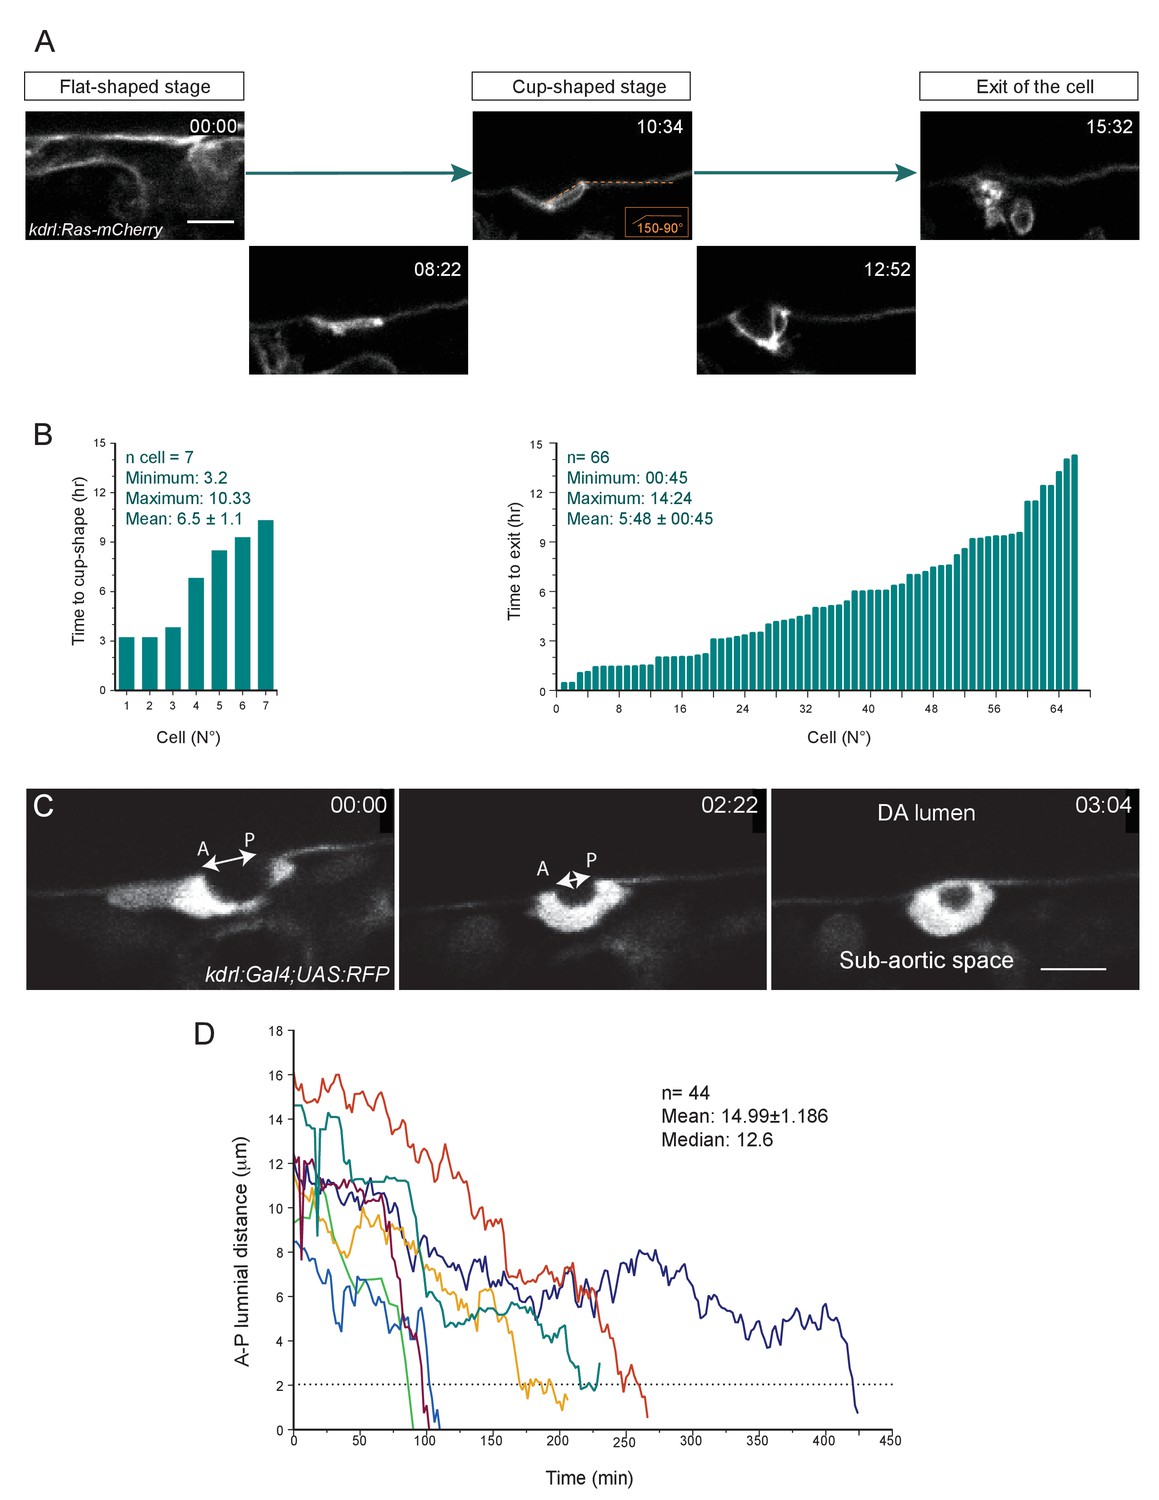
The time-length of the EHT is very heterogeneous (see text also).
(A) Optical sections (Z-planes) extracted from a spinning-disk confocal TL sequence performed on a 48 hpf Tg(kdrl:Ras-mCherry) embryo and showing the progression of the EHT, starting from a flat morphology (the cell is embedded in the hemogenic endothelium, top left panel), followed by the cup-shaped stage (top middle panel) and the emergence (top right panel). Bottom panels show intermediate stages. Time is indicated in hrs:min. (B) Left panel: Time taken by cells to reach the cup-shaped stage, starting from the flat-shaped stage (n = 7 cells). Right panel: Time-to-exit of EHT cells imaged starting at the cup-shaped stage and followed in the 66 TL confocal imaging sequences exploited in this study. See Materials and methods for details. (C) Optical sections (Z-planes) extracted from a spinning-disk confocal TL sequence performed on a 48 hpf Tg(fli1:Gal4;UAS:RFP) embryo, showing a cell undergoing EHT. The double-headed white arrow indicates the Antero-Posterior luminal distance (A-P luminal distance) that separates the two opposite poles of the EHT cell contacting the endothelial neighbors. Time is indicated in hrs:min. Scale bars, 10 μm. (D) Time progression of the A-P luminal distances for seven individual cells (each cell depicted by a specific color). The dotted line highlights the critical A-P luminal distance (approx. 2 μm) beyond which cells rapidly perform their exit.
Figure 1—video 1
EHT at high spatio-temporal resolution.
Confocal TL sequence obtained from a 48 hpf Tg(kdrl:Ras-mCherry; kdrl:eGFP) embryo showing a 3D-rendering view of a portion of the dorsal aorta and the underlying axial vein (see also Figure 1C–G for a decomposition of the main steps). Numbered arrowheads point at 3 EHT undergoing cells that emerge in the sub-aortic space where they start their typical hematopoietic amoeboid migration. ISV: intersegmental vessel. Time is indicated in hrs:min.
Figure 1—video 2
Luminal/apical membrane invagination of an EHT undergoing cell.
Single confocal Z-plane obtained from a 48 hpf Tg(kdrl:Ras-mCherry; kdrl:eGFP) embryo showing a cell undergoing EHT and emerging from the dorsal aorta (see also Figure 1H–L for a decomposition of the main steps). Yellow arrowheads point at cell borders connecting with adjoining endothelial cells. White arrowheads point at highly dynamic basal membrane blebs. The white arrow highlights the membrane foot corresponding to the very last portion of the cell remaining attached to the aortic floor. Time is indicated in hrs:min.
Figure 1—video 3
The EHT- from the flat hemogenic endothelium to the emergence in the sub-aortic space.
Maximum projection of Z-planes (main field) and single Z-plane (top left white rectangle) from a scanning confocal TL sequence performed on a 48 hpf Tg(kdrl:Ras-mCherry) embryo showing a cell undergoing EHT from the flat shape stage, to the exit, with the intermediate cup-shaped stage (starting at t = 10:34). The white arrow points at the cell undergoing EHT that divides at t = 06:30 and with one of the daughter cells that emerges at t = 15:32. Time is indicated in hr:min. Scale bars, 10 μm.
Figure 2 with 2 supplements
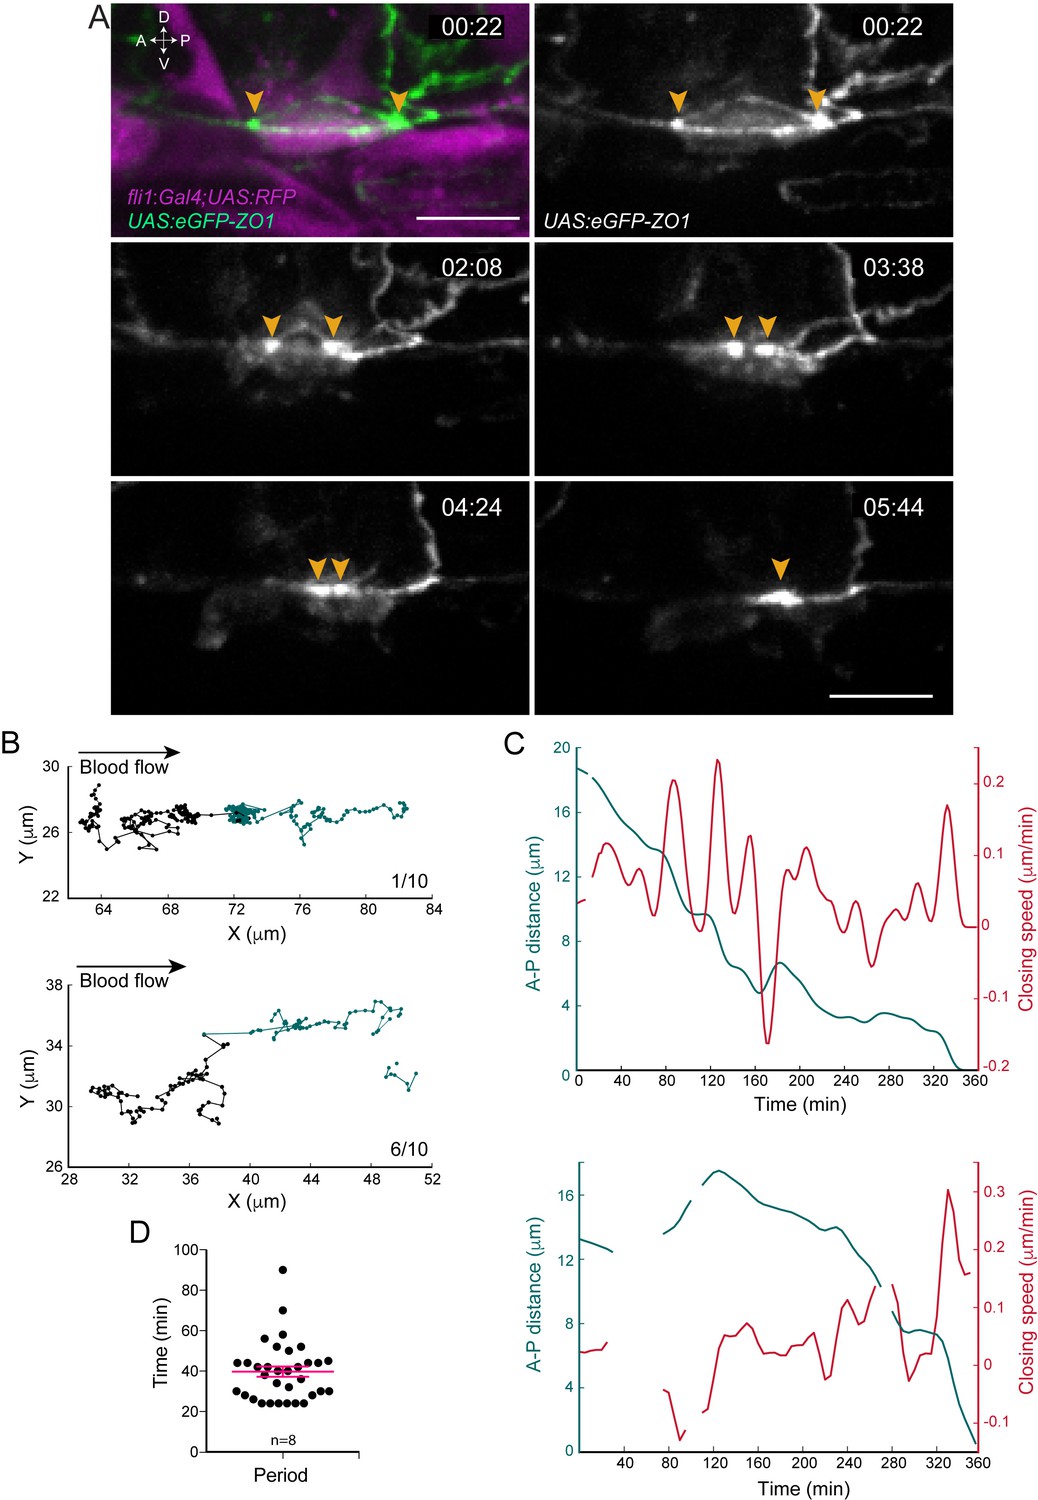
Apical constriction undergoes pulsatile activity.
(A) Maximum projection of Z-planes extracted from a spinning-disk confocal TL sequence performed on a 48 hpf Tg(fli1:Gal4; UAS:RFP; UAS:eGFP-ZO1) embryo. Yellow arrowheads: regions enriched with eGFP-ZO1, at the two opposite poles of the EHT cell contacting endothelial neighbors and converging until coalescence (see Figure 2—video 1). Time is indicated in hr:min. Scale bars, 10 μm. (B–C) Spatio-temporal analysis of two cells (see also Source code 1). Top panels obtained from the cell visualized in (A) and bottom ones from a second cell. (B) Tracking of two spots delineating regions of eGFP-ZO1 densification, after maximum projection. Top and bottom panels are showing tracks of antero (black) and posterior (green) eGFP-ZO1 spots for a single cell each. X and Y correspond to the antero-posterior and dorso-ventral axis, respectively. Each point corresponds to the position in X,Y of the spot at a given time point. The lines link two successive time points. Note that when one spot is not detected, the line is interrupted. The anterior track is the longest track in 30% of cases, n = 10 (not shown); The posterior track is the longest track in 60% of cases, n = 10 (bottom panel); note that in 1/10 cells, the displacement of the antero and posterior spots were virtually equal (top panel). (C) Evolution as a function of time of distances (green) and closing speeds (red) of the two eGFP-ZO1 spots. Note that breaking of tracks and lines result from sporadic loss of signal. (D) Representation of the calculated periods of oscillatory closing speeds (39.7 min ±2.6 min). Error bars represent mean values ± SEM (n = 8 TL sequences).
Figure 2—figure supplement 1
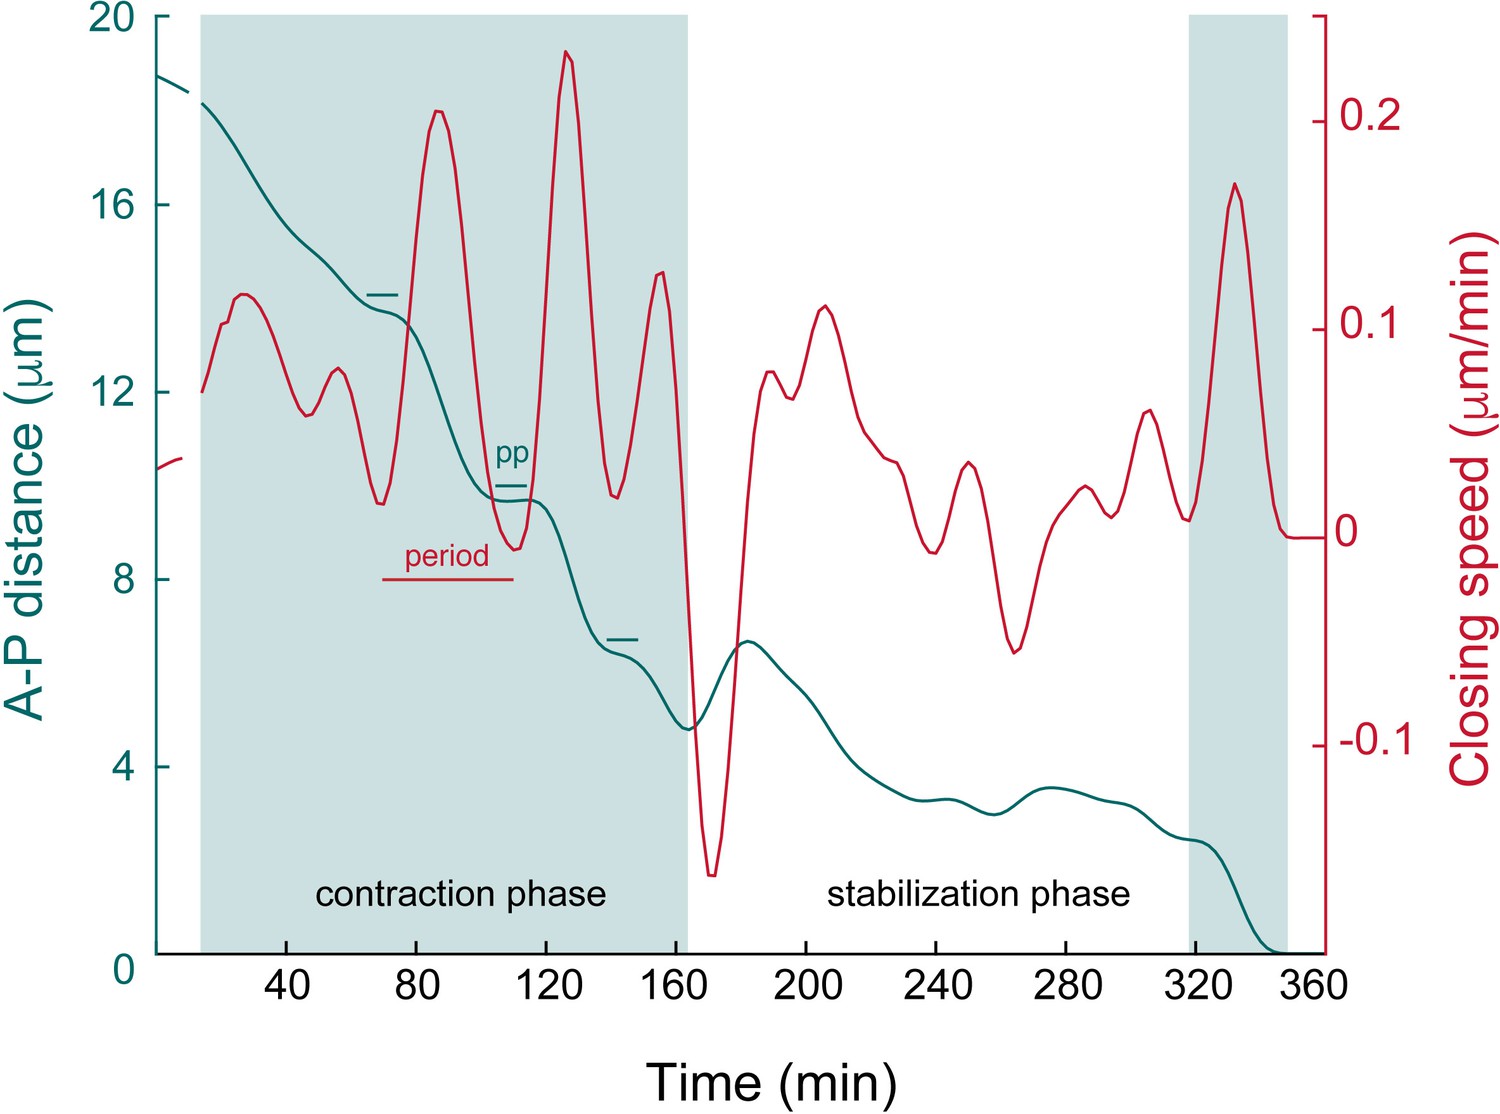
Bbiomechanical parameters of the apical closure.
Magnification of the upper panel of Figure 2C illustrating: (1) a contraction phase (shaded area, left part of the graph) with the steep decrease of the A-P luminal distance (green line), made of alternating acceleration and deceleration phases (oscillations with relatively homogenous periods and large amplitudes, red lines); (2) a stabilization phase (white area, middle part of the graph) with relatively little progression of the A-P luminal distance and oscillations of relatively homogenous periods and smaller amplitudes in comparison to the contraction phase. Note the final step of contraction (shaded area, right part) with the steep decrease at approx. 2 μm. PP: pseudo-plateau (estimated duration: 21 min). Note that the lengths of the contraction and stabilization phases are stochastic (see also Figure 1—figure supplement 1D).
Figure 2—video 1
Dynamics of the apical constriction followed by eGFP-ZO1.
Maximum projection of Z-planes from a spinning-disk confocal TL sequence performed on a 48 hpf Tg(fli1:Gal4; UAS:RFP; UAS:eGFP-ZO1) embryo showing a cell undergoing EHT. White arrowheads point at densification of eGFP-ZO1 at cell borders connecting with adjoining endothelial cells and converging to reach coalescence. White arrows point at large membrane extensions with tips enriched with eGFP-ZO1 (clearly observable from t = 02:00) showing that EHT cells undergo an amoeboid behaviour within the subaortic space long before their release. Time is indicated in hrs:min. Scale bar, 10 μm.
Figure 3 with 1 supplement
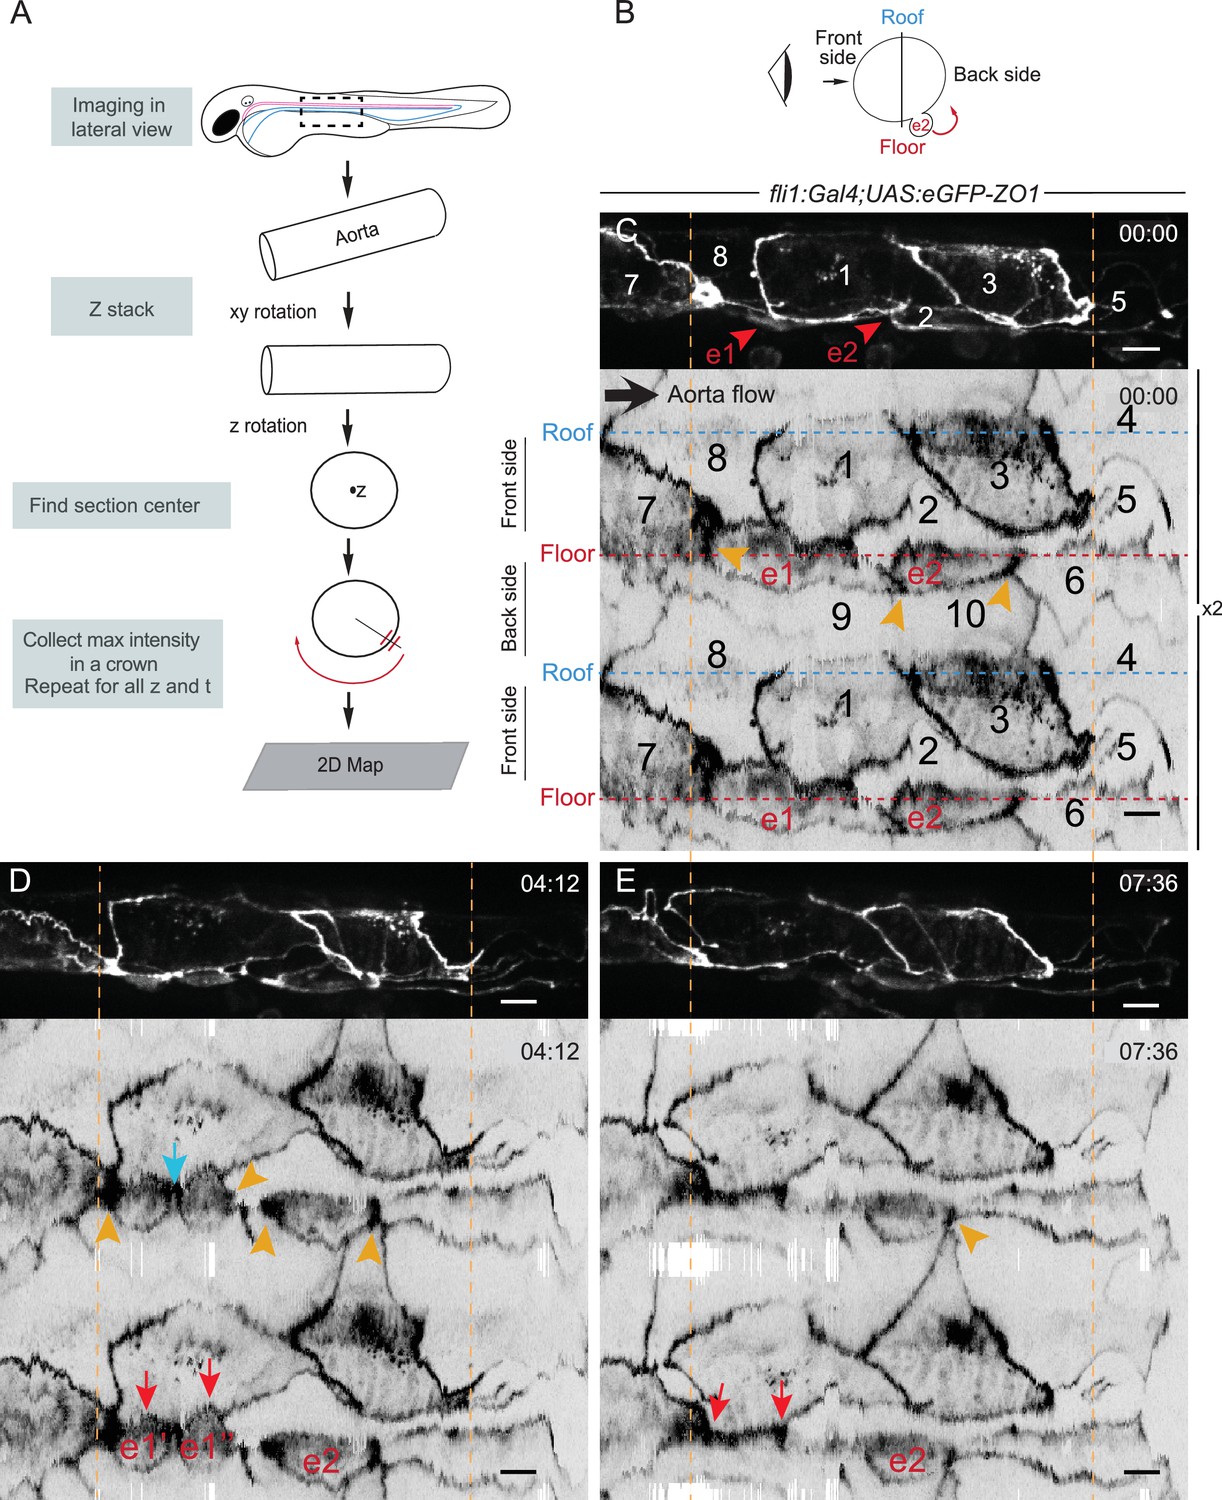
The EHT cellular landscape unravelled by 2D-projection.
Schematic representations of: (A) Successive steps leading to the 2D projection (see text, Materials and methods and Source code 2), (B) The angle at which the Z-projections in the top panels (C–E) are visualized (eye) and indicating the back-sided exit of the EHT cell e2. (C–E) Top panels are maximum projections of Z-planes extracted from a spinning-disk confocal time-lapse performed on a 48 hpf Tg(fli1:Gal4; UAS:RFP; UAS:eGFP-ZO1) embryo. Bottom panels have been obtained after duplication (x2) of the corresponding 2D-maps (see Materials and methods and Figure 3—video 1). Numbers indicate individual cells. e1, e2: EHT cells (in red, with e1 dividing into e1’, e1’’ by symmetric division, panel D red arrows) are located on the aorta floor. Cells 6, 9 and 10 are exclusively on the backside. All the others span mainly the front side. Yellow arrowheads: Increased density of eGFP-ZO1 at contacting regions between EHT or endothelial cells that are oriented perpendicular to blood flow (antero-posterior axis). Blue arrow: space between the two daughter cells. Note that in panel (E), the daughter cells have emerged (red arrows). Time is indicated in hr:min. Scale bars, 10 μm.
Figure 3—video 1
Dynamics of the EHT in the aortic landscape using 2D-maping-1.
Top panel; maximum projection of Z-planes from a spinning-disk confocal TL sequence performed on a 48 hpf Tg(fli1:Gal4; UAS:RFP; UAS:eGFP-ZO1) embryo. The bottom panel was obtained after duplication of the corresponding 2D-map. For all, only the green channel (eGFP-ZO1) is shown. Numbers indicate individual cells. e1, e2 EHT cells (in red), are located on the floor of the aorta. Cells 6, 9 and 10 are exclusively on the backside. All the others span mainly the front side. EHT cell e1, divides into e1’, e1’’ daughters by symmetric division (yellow asterisks point at the mitosis of cell e1 and resulting daughter cells; t = 00:50-01:14); yellow arrowheads point at eGFP-ZO1-enriched at small junctional regions orientated more or less perpendicularly to the antero-posterior (blood flow axis). Time is indicated in hr:min. Scale bars, 10 μm.
Figure 4 with 1 supplement
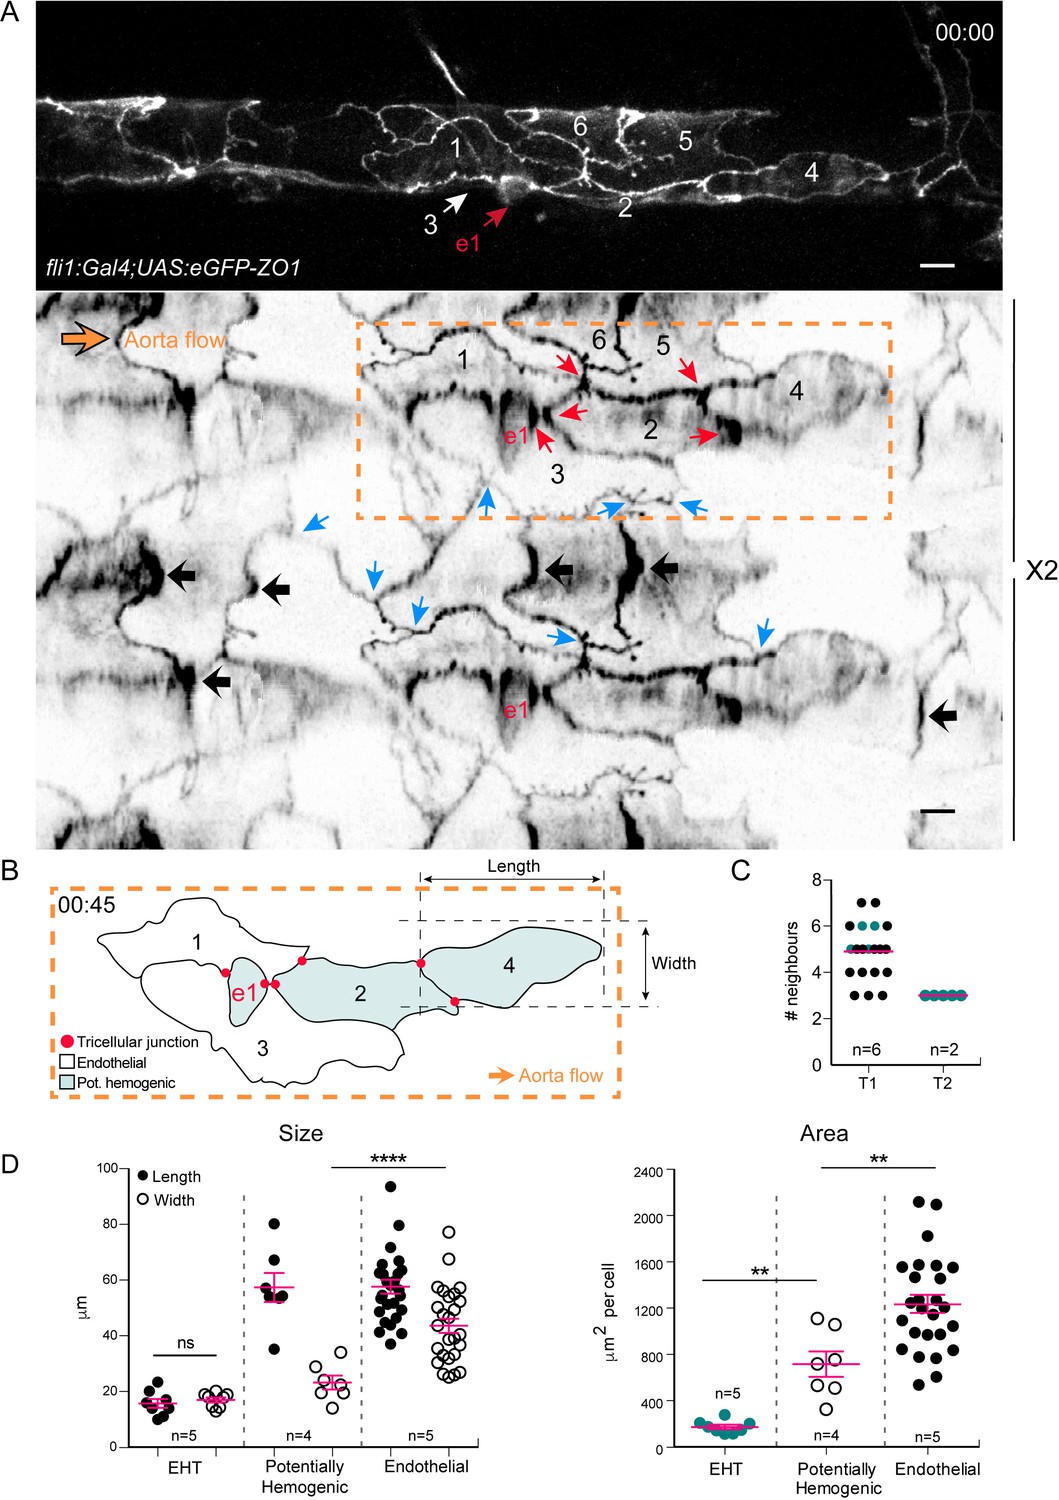
Intercellular contacts between hemogenic cells are reinforced.
(A) Top panel: maximum projection of Z-planes extracted from a confocal TL sequence performed on a 48 hpf Tg(fli1:Gal4; UAS:RFP; UAS:eGFP-ZO1) embryo. e1; EHT cell, red arrow. Cell three localises on the back-side and partly surrounds the EHT cell (white arrow) (see also the 2D-map, bottom panel). Bottom panel: black arrows point at bicellular interfaces between endothelial cells, enriched with eGFP-ZO1 and perpendicular to the aorta flow. Blue arrows: tricellular junctions between endothelial cells. In the hemogenic region (yellow dotted rectangle), the red arrows point at tricellular junctions between potentially hemogenic cells and the EHT cell (e1, red) that are enriched with eGFP-ZO1 (see Figure 4—video 1). Scale bars, 10 μm. (B) Schematic representation of the hemogenic region in (A) emphasizing on the localization of tricellular junctions mainly between the EHT cell and a neighboring potentially hemogenic cell (e1, 2) and between two potentially hemogenic cells (2, 4). See Materials and methods for the definition of cell categories. (C) Number of cells surrounding EHT cells calculated from 2D-maps (see Materials and methods) at an early time point of the process (beginning of the TL sequence; T1, n = 6 maps), and at a late time point contemporary to emergence (T2, n = 2 maps). The green points represent values calculated from the 2 TL sequences for which emergence could be captured. Red bars, median. (D) Morphometric analysis of EHT cells at advanced cup-shaped stage, potentially hemogenic and endothelial cells calculated from 2D-maps (see also Figure 4—source data 1). Left: Size. The EHT cells advanced in the process exhibit nearly equal length (15.7 ± 1.6 μm) and width (17.0 ± 0.9 μm), potentially hemogenic cells that are elongated in the antero-posterior axis (length and width of (57.4 ± 5.2 μm) and (23.2 ± 2.5 μm)) and endothelial ones that have a larger width (length and width of (57.7 ± 2.5 μm) and (43.6 ± 2.6 μm)). Right: Area. Error bars represent mean values ± SEM. Unpaired t test (**) p<0.01; (****) p<0.0001 (n = number of maps).
-
Figure 4—source data 1
Figure 4D Numerical data (width, length and area) and corresponding 2D-Maps with the contours of EHT cells (red), hemogenic cells (blue) and endothelial cells (green).
- https://doi.org/10.7554/eLife.37355.014
Figure 4—video 1
Dynamics of the EHT in the aortic landscape using 2D-maping-2.
Top panel; maximum projection of Z-planes from a confocal TL sequence performed on a 48 hpf Tg(fli1:Gal4; UAS:RFP; UAS:eGFP-ZO1) embryo. The bottom panel was obtained after duplication of the corresponding 2D-map. For all, only the green channel (eGFP-ZO1) is shown. e1 EHT cell (in red), is located on the floor of the aorta and numbers indicate individual hemogenic cells in contact with e1. Yellow arrows point at eGFP-ZO1 densifications reaching coalescence by the end of the EHT. Time is indicated in hr:min. Scale bars, 10 μm.
Figure 5 with 1 supplement
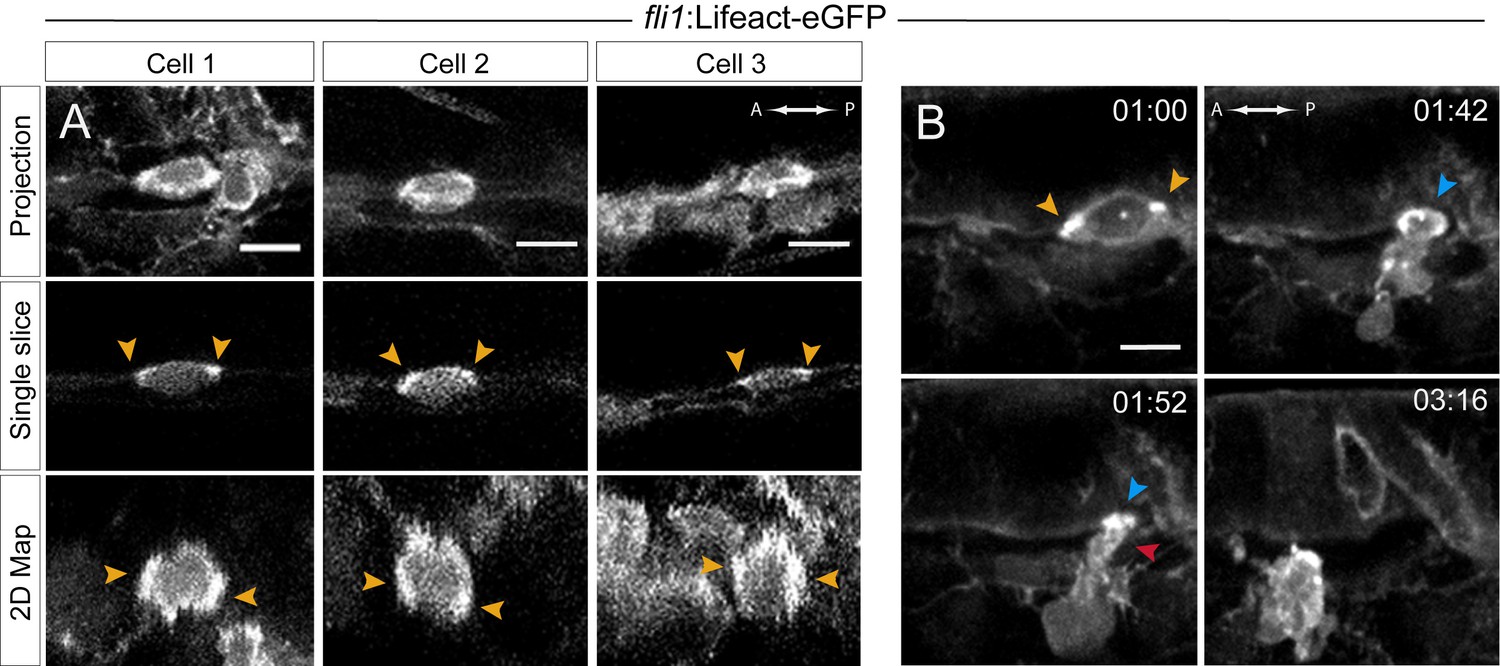
Actin localization and dynamics.
(A–B) Lifeact-eGFP expressing 48 hpf embryos were imaged by spinning-disk confocal microscopy to obtain maximum projections of Z-planes (A, top and B), single Z planes (A, middle), or 2D-map projections (A, bottom; note that cells #2 and #3 are from the same aorta; see also Figure 5—source data 1). Yellow arrowheads: spots enriched with F-actin and aligned with the antero-posterior axis. (B) Images extracted from Figure 5—video 1. F-actin is enriched at the level of the contracting circumferential belt (top left) that converts into a ring (top right, blue arrowhead), and subsequently in the foot (red arrowhead). Time is indicated in hr:min. Scale bars, 10 μm.
-
Figure 5—source data 1
Figure 5A: Z-projections (on top) and full 2D-Maps (bottom) from which the images presented in the bottom panels of Figure 5A were extracted.
- https://doi.org/10.7554/eLife.37355.018
Figure 5—video 1
Actin dynamics during the EHT.
Spinning-disk TL confocal sequence performed on a 48 hpf Tg(fli1:Lifeact-eGFP; kdrl:Ras-mCherry) embryo. The top panel shows a maximum projection of Z-planes. The white rectangle surrounds an EHT cell that emits highly dynamics blebs enriched in Lifeact-eGFP (top panel). Middle and bottom panels have been obtained after a maximum projection of corresponding substacks. White arrowheads point at Lifeact-eGFP densifications at the two opposite poles of the EHT cell connecting with the adjoining endothelial cells and converging to reach coalescence. A white arrow highlights the last steps of the luminal actin ring closure that seems to lead to the formation of the membrane foot (yellow arrow, t = 02:14, structure enriched with actin). Once free in the sub-aortic space, the cell displays a typical amoeboid migration. Time is indicated in hr:min. Scale bars, 10 μm.
Figure 6 with 3 supplements
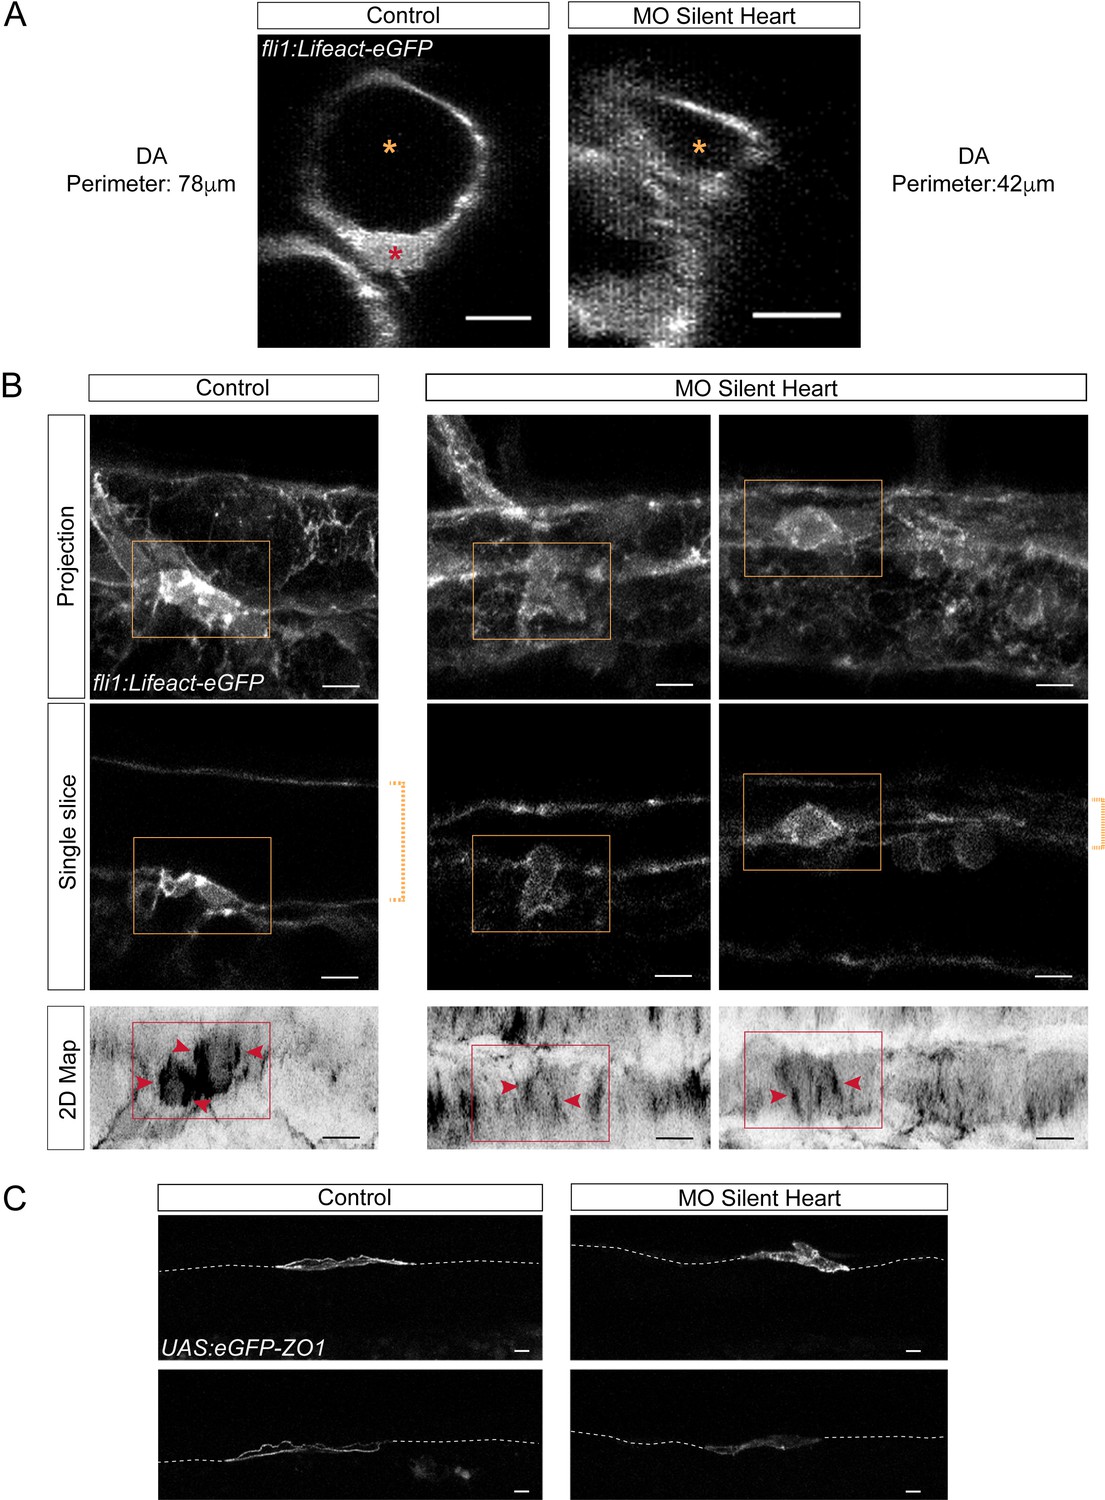
Blood flow influences the morphology as well as the cytoskeletal and junctional organization of hemogenic and emerging cells.
Lifeact-eGFP (A,B) or eGFP-ZO1 (C) expressing 48 hpf embryos (A,B) were imaged by confocal microscopy after injection of sih or control morpholinos. (A) Transversal views of control and sih morphants show the flattening of the aorta and the decrease in perimeter when blood flow is abrogated. Yellow stars indicate the aortic lumen and the red star an EHT cell emerging from the ventral floor. (B) Maximum projections of Z-planes (top panels), single Z planes (middle panels and see Figure 6—video 1), or 2D-map projections (lower panels). Dashed yellow brackets highlight the thickness of the aorta. Yellow rectangles surround EHT undergoing cells. The same cells visualized after 2D projections are surrounded by red rectangles. Red arrowheads point at actin densification, in EHT cells, aligned with the antero-posterior axis of the dorsal aorta. (C) Maximum projections showing eGFP-ZO1 localization in two hemogenic control and sih morphants cells lying on the aortic floor. Note the mosaicism owing to transient expression of the UAS:eGFP-ZO1 transgene (for a 3D-rendering view and visualizing the aortic contours, see Figure 6—video 3). Dashed lines indicate the position of the aortic floor. Scale bars, 10 μm.
Figure 6—video 1
Aortic phenotype in sih morphants.
Single Z-stacks obtained by scanning confocal microscopy of 48 hpf Tg(fli1:Lifeact-eGFP) embryos. Control embryos (top panel) or injected embryos with sih morpholinos (three bottom panels) showing the flattening of the aorta and the accumulation of ovoid cells within the dorsal aorta floor in sih morphants (white arrows in the bottom panel (sih morphant 3)). Note that this type of cell, not annotated, is also visible in the two middle panels (sih morphants 1 and 2). Orange arrows point at cells that are presented in Figure 6B. Blue arrows (top panel) point at cells that have already emerged and accumulate in the sub-aortic space, nearby the aortic wall. Red arrows point at cells in the aortic lumen, most probably having emerged from the surrounding aortic wall (bottom panel). Scale bars, 10 μm.
Figure 6—video 2
Morphodynamics of the emergence in sih morphants.
TL sequence obtained with scanning confocal microscopy performed on a 48 hpf Tg(kdrl:Ras-mCherry; kdrl:eGFP) embryo injected with sih morpholinos showing the dynamics and orientation of cell extrusion (top panels show mCherry and GFP channels, bottom panels show only the mCherry channel). The right panel (a single Z-plane) corresponds to a magnification of the yellow rectangle on the left panel (maximal projection). The right panel shows the emergence of a cell toward the aortic lumen (white arrow). The left panel shows ovoid cells accumulated within the aortic floor (yellow arrows), the emergence of a cell (right white arrow) that bursts into pieces at t = 11:10 and the remaining fragments of another cell (left white arrow). Note that for none of the two types of emergences, the cells exhibit invagination of the apical/luminal membrane. Time is indicated in hr:min. Scale bars, 10 μm.
Figure 6—video 3
Alteration of ZO1 localization in sih morphants.
3D-rendering, using the Imaris software, of the aortic regions of 48 hpf Tg(fli1:Gal4; UAS:RFP) embryo injected with UAS:eGFP-ZO1 encoding plasmid for transient expression and, in addition, either a control or the sih morpholino. Note the well delimited sub-plasmalemmal recruitment of eGFP-ZO1 in the controls (left panels) and the alteration in the sub-plasmalemmal recruitment in the sih morphants (right panels), with increase of the eGFP-ZO1 cytoplasmic pool. Note as well the differences in cellular morphologies. Scale bars, 20 μm.
Figure 7 with 1 supplement
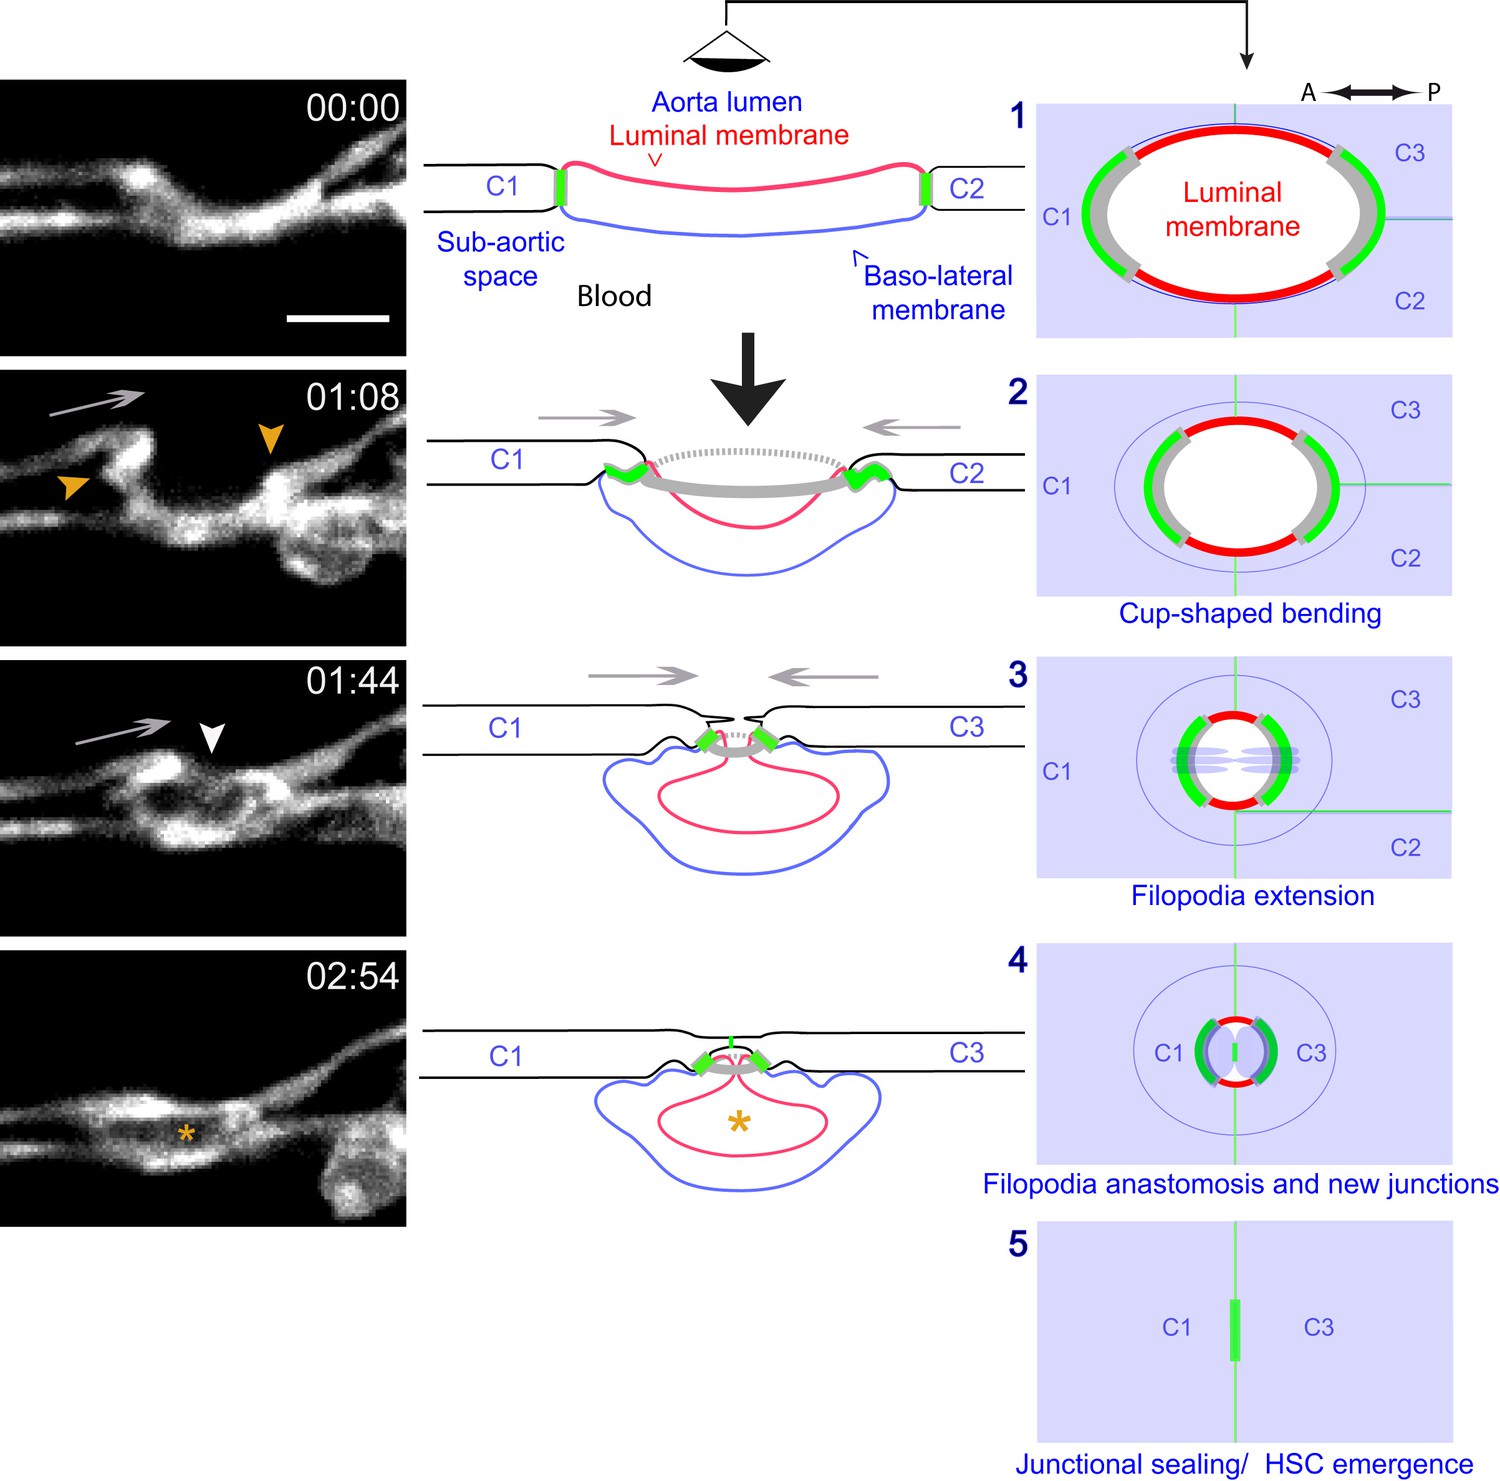
Modeling of the EHT process.
Left panels: Lifeact-eGFP expressing 48 hpf embryo imaged by spinning-disk confocal microscopy to obtain single Z planes. Images were extracted from Figure 7—video 1. Grey arrows: evidence for the deployment of pushing forces by adjoining endothelial cells. Yellow arrowheads: Lifeact-eGFP densifications. White arrowhead: extension and convergence of filopodia hypothetically emanating from an endothelial cell. Asterisk: intracellular cavity resulting from invagination of the luminal membrane. Middle and right panels (lateral views and ‘en face’ views (with the eye positioned in the aorta lumen)): schematic drawings representing five sequential steps of the EHT deduced from the localization of eGFP-ZO1 (green lines: junctional interfaces), Ras-mCherry (red and blue: luminal and basal membrane, respectively), Lifeact-eGFP (grey, F-actin circumferential belt. Note that the junctional circumferential belt is not drawn for simplicity). Grey arrows: putative pushing forces deployed by adjoining endothelial cells. Black arrow: hemodynamic force (perpendicular to the aortic plane). Note that in the ‘en face’ views, the luminal membrane should appear as a red surface (depicted by red lines only), and that the circumferential junctional and F-actin belts are only depicted at their sites of increased density, that is membrane interfaces at the A-P poles of the EHT cell, bound by tricellular junctions oriented perpendicular to blood flow, as revealed by 2D-maps. See the main text for additional comments. C1-C4: adjoining endothelial cells. Time is indicated in hr:min. Scale bar, 10 μm.
Figure 7—video 1
Evidence for forces deployed during the EHT.
Single Z-plane of a spinning-disk confocal TL sequence performed on a 48 hpf Tg(fli1:Lifeact-eGFP; kdrl:Ras-mCherry) embryo, showing evidence for pushing forces deployed from an endothelial neighbour (white arrow, t = 01:12-01:50). White arrowheads point at filopodia most probably emerging from the neighboring cells and aimed at sealing the aorta floor before the complete detachment of the EHT cell. Time is indicated in hr:min. Scale bar, 10 μm.
Figure 8 with 2 supplements
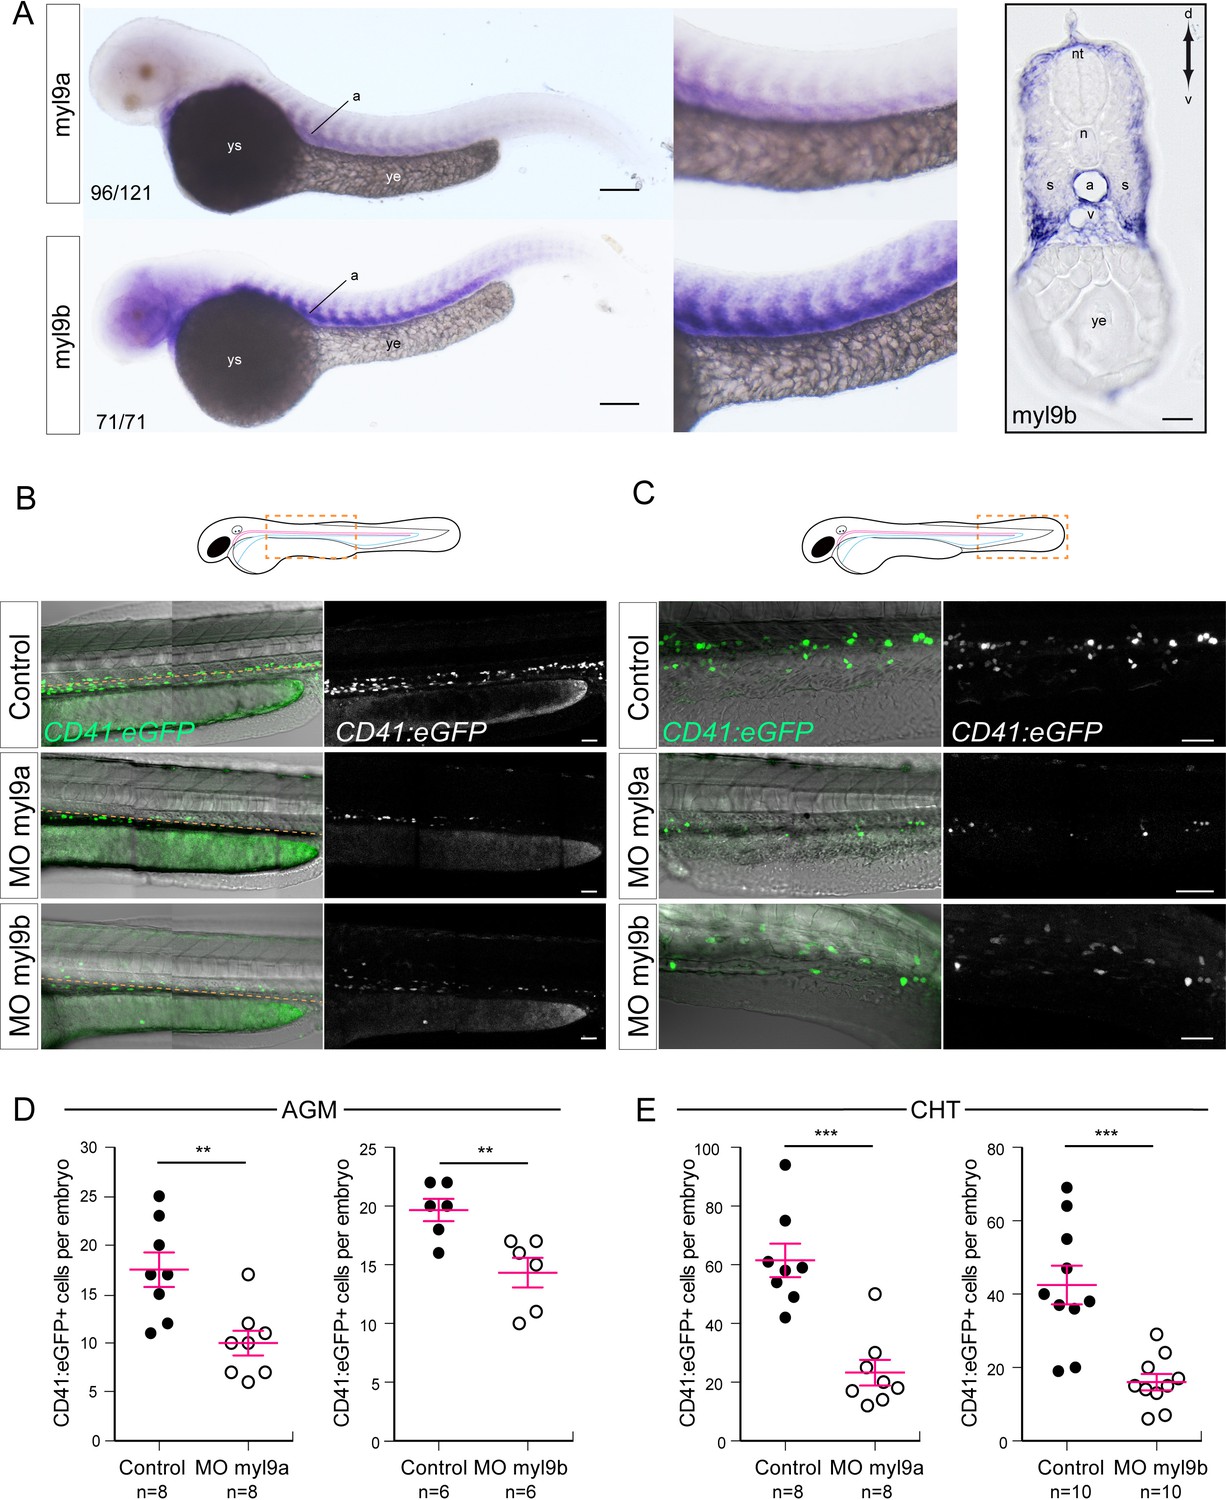
Myosin regulatory light chains 9a and 9b are required for definitive hematopoiesis.
(A) In situ hybridizations of 48 hpf embryos. Left panels, whole mount; right panel, transversal section. a, aorta; n, notochord; nt, neural tube; s, somites; v, vein; ye, yolk extension; ys, yolk sac. Results were obtained from four independent experiments. Note that for the 25/125 embryos in the top panel, the myl9a signal in the aorta was weaker and masked by the somitic staining. (B,C) Maximum projection of Z-planes obtained from 48 hpf Tg(CD41:eGFP) embryos, focusing either on the AGM region (B), or on the CHT (C). Scales bars, 50 μm (B); 100 μm (C). Only the CD41:eGFP+ cells above the yellow dashed line were counted (C), as those beneath are not necessarily hematopoietic cells (Kissa et al., 2008). (D,E) Effect of myl9a and myl9b morpholinos (e2i2 and e3i3, respectively, see Materials and methods for details and Figure 8—figure supplement 1) based knockdown on the number of CD41:eGFP+ cells in the AGM (D) and the CHT (E). Similar results, in the AGM and in the CHT, were obtained at lower quantities of morpholinos (see Figure 8—figure supplement 2). n = indicate the numbers of embryos. (B, E, F) Error bars represent mean values ± SEM. Unpaired t test (**) p<0.01; (***) p<0.001.
Figure 8—figure supplement 1
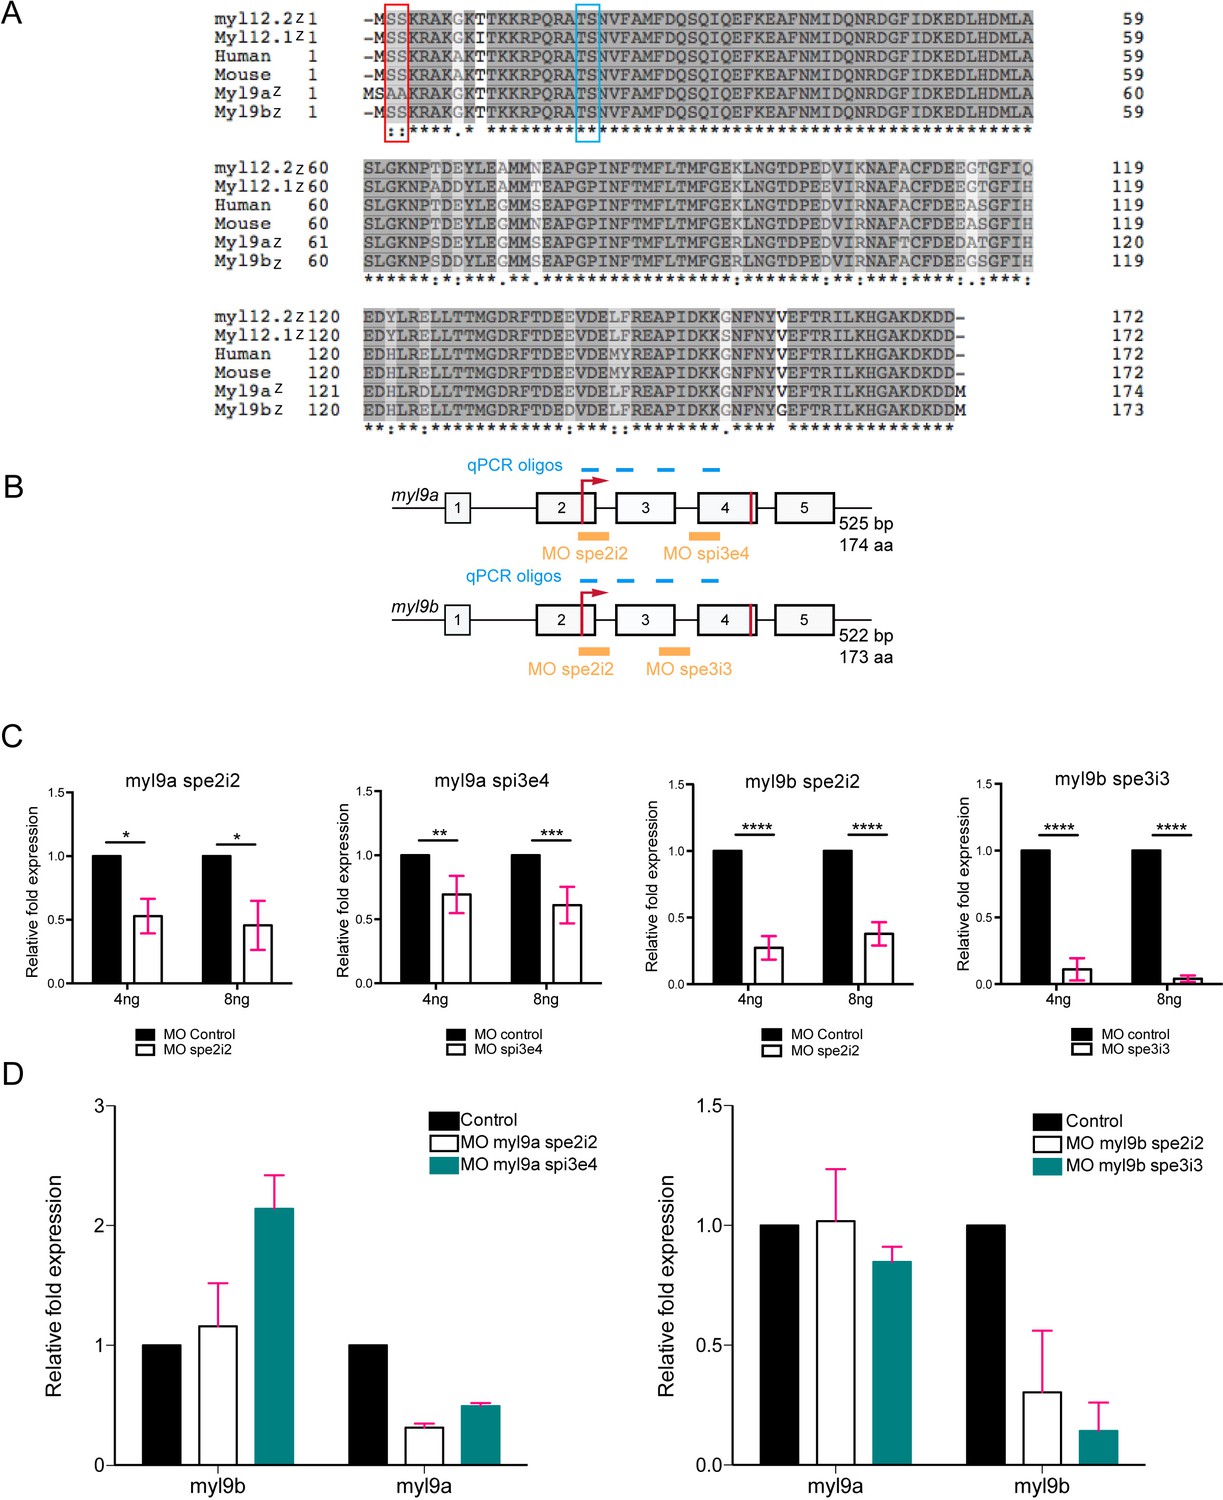
Quantitative analysis of the effects of myl9a and b splicing morpholinos (see also text).
(A) Protein sequence alignment of zebrafish Myl9a, 9b, 12.1 and 12.2 (Myl9az, Myl9bz, Myl12.1z and Myl12.2z, respectively), human and mouse Myl9 (referred to as Human and Mouse, respectively). Grey levels indicate the level of amino acid conservation among sequences and the red rectangle surrounds the N-terminal PKC phosphorylation site (absent in Myl9a). The blue rectangle surrounds the canonical ROCK/MLCK phosphorylation site. (B) Schematic representation of the myl9a and myl9b genes with exons indicated by numbers, the start/stop codons depicted with red lines, the localization of splice morpholinos by yellow lines. The position of qRT-PCR oligos are indicated with blue lines. (C) Quantification of myl9a and myl9b relative expression by qRT-PCR in whole 48 hpf embryos injected either with myl9a (spe2i2 or spi3e4) or myl9b (spe2i2 or spe3i3) morpholinos (each experiment was performed twice, each in triplicates). Red bars represent Mean ± SEM. (*) p<0.05; (**) p<0.01; (***) p<0.001; (****) p<0.0001. (D) Analysis of potential off-target effects of morpholinos. Quantification of myl9a and myl9b relative expressions by qRT-PCR in whole 48 hpf embryos injected either with myl9a (spe2i2 or spi3e4) or myl9b (spe2i2 or spe3i3) morpholinos. Left panel shows the impact of myl9a morpholinos on myl9b expression. Note that the myl9a morpholino spi3e4 triggers a compensatory response of myl9b and the absence of off-target effect. Right panel shows the impact of myl9b morpholinos on myl9a expression. Note the absence of off-target effect. This experiment corresponds to two independent experiments carried out in triplicates. Due to the low n number (n = 2), this graph indicates a tendency. Red bars represent Mean ± SD.
Figure 8—figure supplement 2
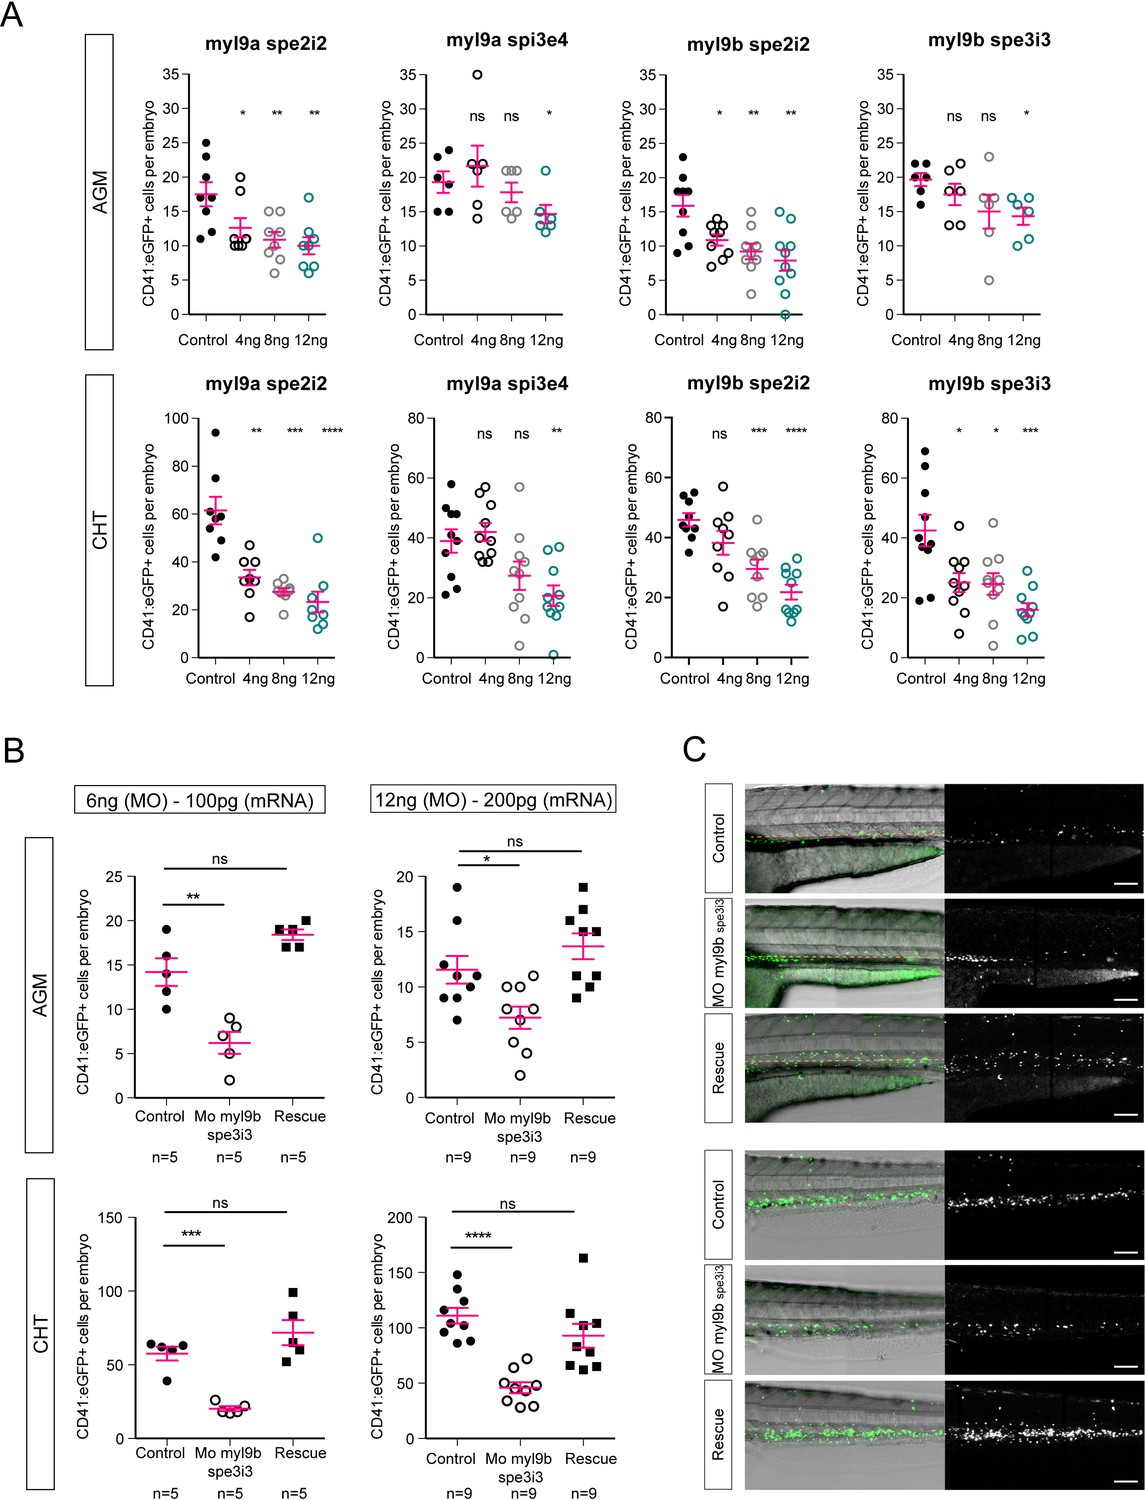
Myl9a and myl9b morpholinos phenocopy of hematopoietic phenotype and myl9b morpholino rescue.
(A) CD41:eGFP positive cell numbers in the AGM (top panel) and the CHT (bottom panel) after myl9a and myl9b morpholinos at the concentrations of 4, 8 and 12 ng. (B) CD41:eGFP positive cell numbers in the AGM (top panel) and the CHT (bottom panel) after injections of 100 pg (left panel, n = 5) and 200 pg (right panel, n = 9) of myl9b mRNAs (rescue). (C) Maximum projection of Z-planes obtained from 50 hpf Tg(CD41:eGFP) embryos, focusing either on the AGM region (top panel), or on the CHT (bottom panel). Only the CD41:eGFPpositive cells above the yellow dashed line were counted (top panel), as those beneath are not necessarily hematopoietic cells (Kissa et al., 2008). Red bars represent Mean ± SEM. (*) p<0.05; (**) p<0.01; (***) p<0.001; (****) p<0.0001.
Figure 9 with 3 supplements

The amino-terminal phosphorylation site on Myl9b is essential for definitive hematopoiesis.
(A) Maximum projection of Z-planes obtained from 40 hpf and 50 hpf embryos expressing either Myl9b-eGFP or Myl9bA2A3-eGFP under the control of the runx’1 + 23’ enhancer that allows expression in hematopoietic stem cells (see also Figure 9—figure supplement 1). White dotted lines delineate the embryo. Scale bars, 100 μm. (B) Quantification of the number of Myl9b-eGFP or Myl9bA2A3-eGFP positive cells in the AGM and CHT at 40 hpf or 50 hpf. Error bars represent mean values ± SEM. Unpaired t test (***) p<0.001; (****) p<0.0001 (n = 11 and n = 12 embryos; the data are representative of two independent experiments, both performed at 40 hpf and 50 hpf). (C–D) Maximum projection of Z-planes extracted from spinning-disk confocal TL sequences performed on 40 hpf Tg(kdrl:Ras-mCherry) embryos expressing the indicated forms of Myl9b-eGFP. Scale bars, 10 μm. Time is indicated in hr:min. (C) White arrowheads, cell debris resulting from bursting (see Figure 9—video 2). Similar phenotype was observed in three independent experiments. (D) White arrowheads, Myl9b-eGFP accumulation at the rear of a migrating cell (top panel) or at multiple cell extensions lacking Myl9bA2A3-eGFP accumulation (bottom panel). Similar phenotype was observed in four independent experiments. Yellow arrowhead, another migrating cell within the imaging field (see Figure 9—video 1).
Figure 9—figure supplement 1
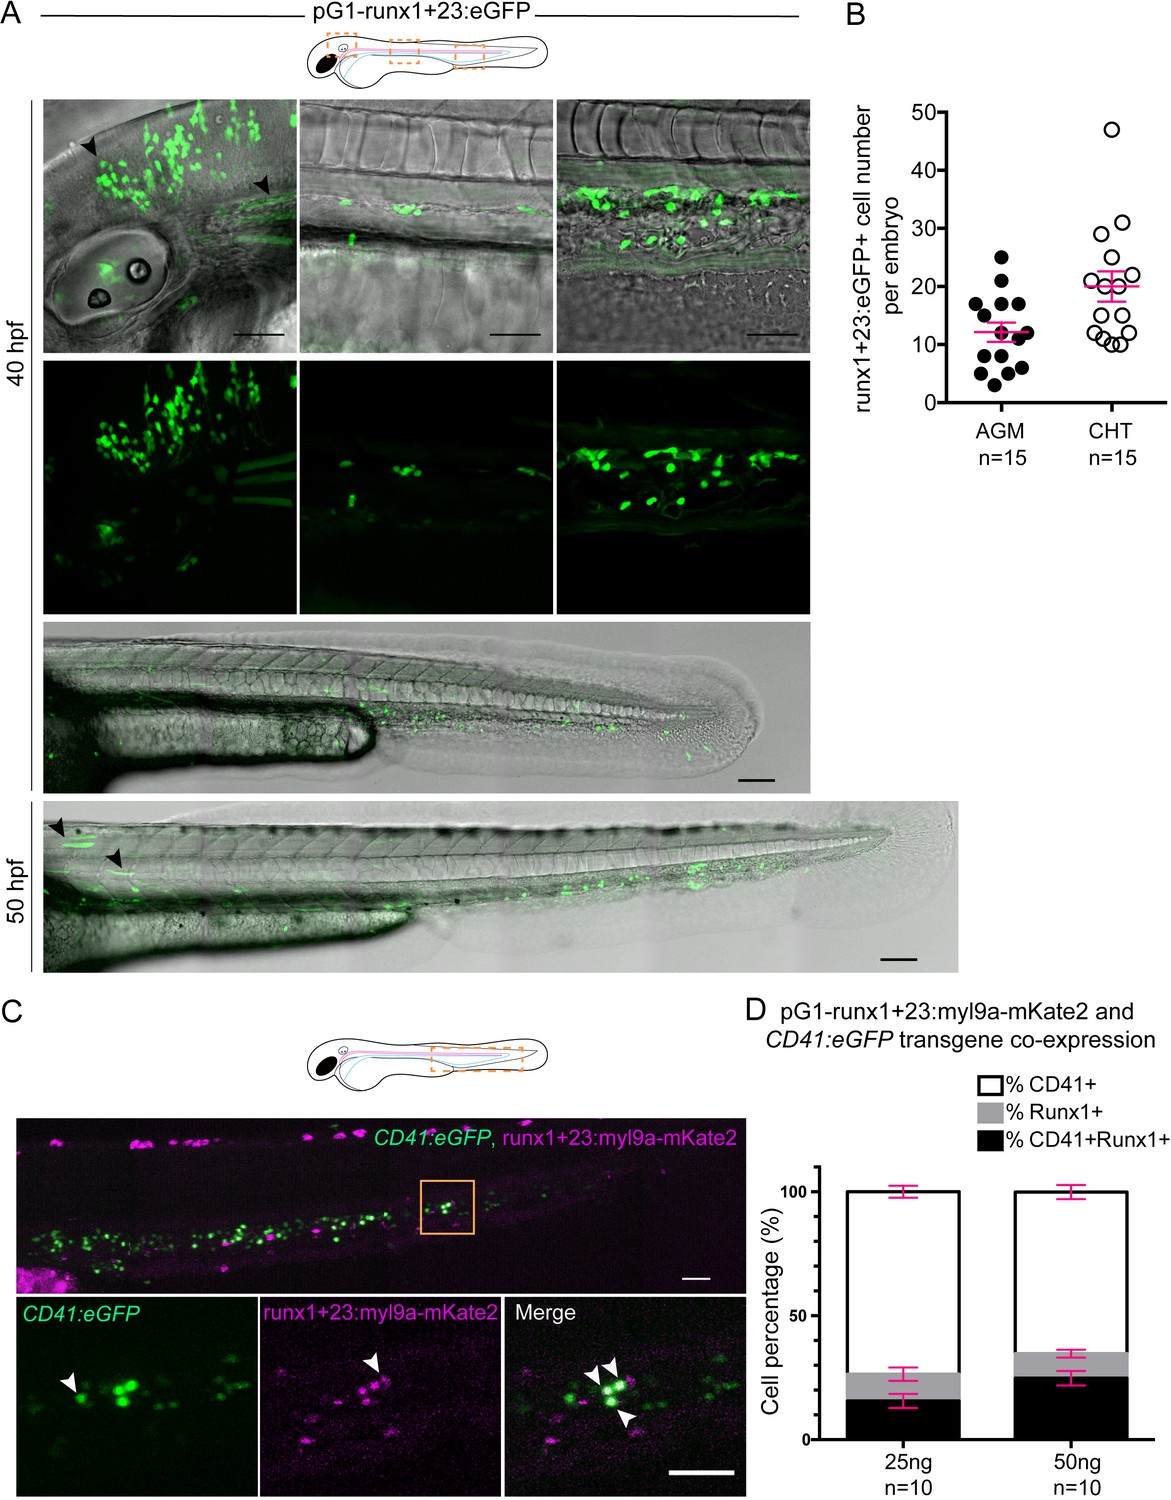
The runx’1 + 23’ enhancer allows expression of Myl9 in hematopoietic stem cells (see also text).
(A) Top panels; maximum projection of Z-planes of the head, AGM and CHT (left to right) performed on a 40 hpf embryo expressing the runx’1 + 23’:eGFP transgene. Black arrows point at ectopic runx'1 +23':eGFP expression in neurons (observed in a minority of embryos), and muscle fibers. Scale bars, 50 μm. Bottom panels show trunks and tails of 40 hpf or 50 hpf embryo expressing the runx’1 + 23’:eGFP transgene in the AGM (area of HSC emergence) and in the CHT (Caudal Hematopoietic Tissue). Scale bars, 50 μm. (B) Quantification of eGFP expressing cells in the AGM or the CHT of 40 hpf embryos (n = 15 embryos; similar results were obtained at 50 hpf). Red bars represent Mean ± SEM. (C) Maximum projection of Z-planes of the CHT performed on a 48 hpf Tg(CD41:eGFP) embryo expressing the runx'1 +23':Myl9a-mKate2 transgene. Bottom panels correspond to the region highlighted by the yellow box and the white arrowheads point at eGFP (left panel), Myl9a-mKate2 (middle panel) and eGFP/Myl9a-mKate2 co-expressing cells (right panel). Scale bars, 50 μm. (D) Quantification of eGFP (%CD41+), Myl9a-mKate2 (%Runx1+) or eGFP/Myl9a-mKate2 (%CD41+Runx1+) expressing cells, according to the amount of injected DNA plasmid (n = 10 embryos). Red bars represent Mean ± SEM.
Figure 9—video 1
Phenotype of Myl9b phosphorylation mutant −1.
Maximum projection of Z-planes of spinning-disk confocal TL sequences performed on 40 hpf Tg(kdrl:Ras-mCherry) embryos expressing either Myl9b-eGFP (left panels) or Myl9bA2A3-eGFP (right panels), both under the control of the runx’1 + 23’ enhancer and showing migrating cells in the sub-aortic space. While the Myl9b-eGFP expressing cell exhibits a typical amoeboid migration (with Myl9b-eGFP accumulating at the rear of the cell), Myl9bA2A3-eGFP spreads throughout the entire cytoplasm of the cell that appears to have multiple migration fronts at a given time.Time is indicated in hr:min. Scale bars, 10 μm.
Figure 9—video 2
Phenotype of Myl9b phosphorylation mutant −2.
Maximum projection of Z-planes of a spinning-disk confocal TL sequence performed on a 40 hpf Tg(kdrl:Ras-mCherry) embryo expressing the runx’1 + 23’:Myl9bA2A3-eGFP transgene. Note the bursting of the cell localized beneath the aorta floor and the released fragments (arrowheads, t = 06:10). Time is indicated in hr:min. Scale bars, 10 μm.
Author response image 1

Runx1 morpholino analysis.
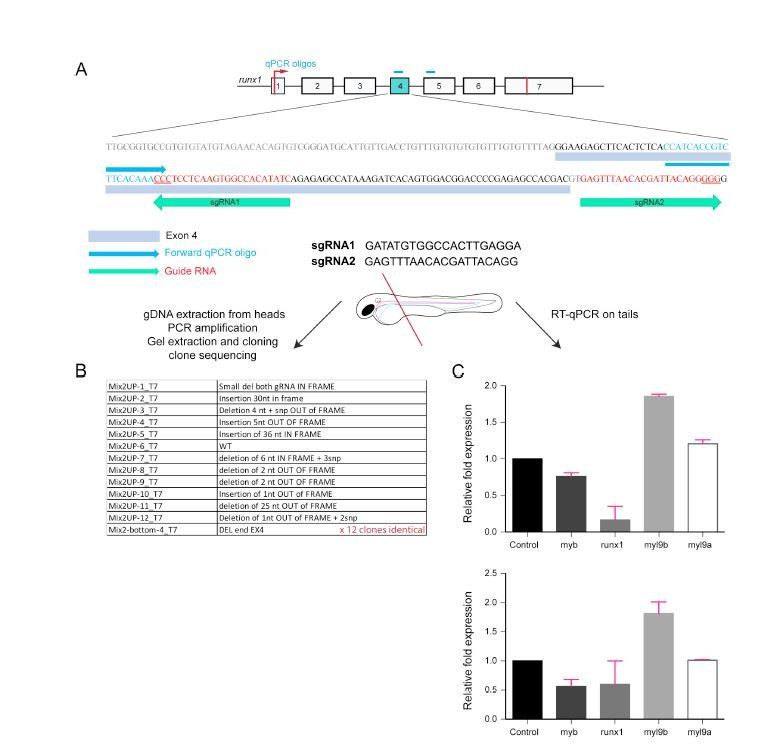
This figure shows the several experiments that were performed to characterize the runx1 morpholino that was used in this study (first submission). The panel C was originally in the previous Figure 6B. Panels A and B were originally in Figure 6—figure Supplement 1. A and B show the localization of myl9a and myl9b qPCR oligos and amplified products.
Author response image 2
Analysis of Myl9b and Myl9a expression after deletion of part of the Runx1 sequence encoded by exon 4 (Runx1 crispants).
This is the first of the 2 strategies that we have used to challenge the phenotypes obtained using the Runx1 morpholino.
Author response image 3
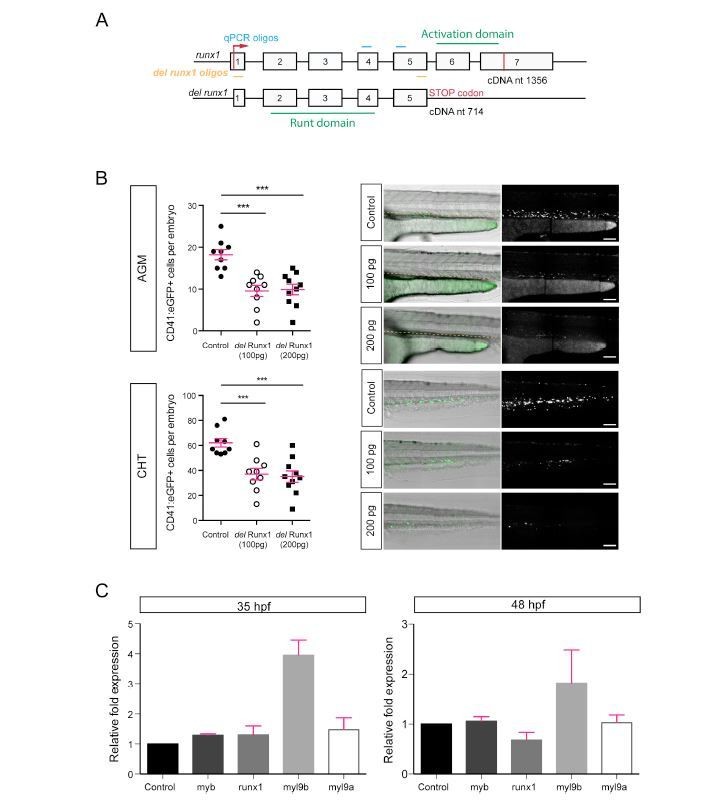
Analysis of Myl9b and Myl9a expression after expression of a deleted form of Runx1.
https://doi.org/10.7554/eLife.37355.041Videos
Video 1
Dynamic 2D-maping of the apical constriction followed by eGFP-ZO1.
Spinning-disk TL confocal sequence performed on a 48 hpf Tg(fli1:Gal4; UAS:RFP; UAS:eGFP-ZO1) embryo, showing a cell undergoing the EHT and processed with the 2D-algorithm. Only the eGFP channel is shown. Note that this is a particular example of an EHT whose axis of emergence diverges by an angle of approximately 45°, from the A-P axis. Yellow arrowheads point at regions of high eGFP-ZO1 density (well visible at t = 03:02). Regions of high eGFP-ZO1 density converge (t = 03:32) to reach coalescence (t = 04:14). At the end of the process, the junctional contacts between adjoining endothelial cells merge into a single eGFP-ZO1-enriched line oriented perpendicular to blood flow. Time is indicated in hr:min. Scale bars, 10 μm.
Video 2
Dynamics of Myl9a and Myl9b during the EHT.
Top panels: Maximum projection of Z-planes of a laser scanning confocal TL sequence performed on a 48 hpf Tg(kdrl:Ras-mCherry; kdrl:Myl9a-eGFP) embryo focusing on the localization of Myl9a-eGFP at the circumferential belt and its accumulation at the two opposite poles aligned with the A-P axis (t = 01:25). Note the progression of belt closure (t = 01:50) and the coalescence of the two points at the end of the EHT (t = 02:30). Note the independent migrating cell coming into contact with the EHT cell (t = 01:40). Note also that the cell divides after the release and that Myl9a-eGFP is recruited to the cytokinesis ring (white arrow, t = 02:55). Time is indicated in hr:min. Scale bars, 10 μm. Bottom panels: Maximum projection of Z-planes of a spinning-disk confocal TL sequence performed on a 48 hpf Tg(kdrl:Gal4; UAS:RFP; kdrl:Myl9b-eGFP) embryo focusing on accumulation of Myl9b-eGFP at the cell borders connecting with neighboring cells (t = 00:12) and at a luminal circumferential belt that coalesces at the end of the EHT (t = 00:36 and 03:06 respectively, yellow arrowheads). Note that the cell divides after the release and that Myl9b-eGFP is recruited to the cytokinesis ring (white arrow at t = 08:56). Time is indicated in hr:min. Scale bars, 10 μm.
Video 3
Dynamics of the contractile and anisotropic actin and myosin rings.
Spinning-disk confocal TL sequence showing 3D rendering ‘en face’ views of EHT cells from 48 hpf Tg(fli1:Lifeact-eGFP) (top panel), Tg(kdrl:Myl9a-eGFP) (middle panel) and Tg(kdrl:Myl9b-eGFP) (bottom panel) embryos. White arrows point at Lifeact-eGFP (t = 01:46), Myl9a-eGFP (t = 01:30) and Myl9b-eGFP (t = 02:22) accumulations at the two opposite poles of the EHT cells that are more or less perpendicular to blood flow and aligned with the A-P axis (white arrowheads are positioned parallel to that axis). Note the conserved anisotropy of the belt through time and the dynamics of its closure. Time is indicated in hr:min. Scale bars, 5 μm (top and bottom panels) and 10 μm (middle panel).
Tables
Key resources table
| Reagent type (species) or resource | Designation | Source or reference | Identifiers | Additional information |
|---|---|---|---|---|
| Strain, strain background (Zebrafish) | Zebrafish: AB | Zebrafish International Resource Center (ZIRC) | ZFIN: ZDB-GENO-960809–7 | |
| Strain, strain background (Zebrafish) | Zebrafish Tg(kdrl:HsHRAS -mCherry): s916Tg | Chi et al. (2008) | ZFIN ID: ZDB-ALT-090506–2 | referred to as Tg(kdrl:Ras-mCherry) |
| Strain, strain background (Zebrafish) | Zebrafish: Tg(fli1a:LIFEACT-eGFP): zf495Tg | Phng et al. (2013) | ZFIN ID: ZDB-ALT-140610–8 | |
| Strain, strain background (Zebrafish) | Zebrafish: Tg(5xUAS:RFP): nkuasrfp1aTg | Asakawa et al. (2008) | ZFIN ID: ZDB-ALT-080528–2 | |
| Strain, strain background (Zebrafish) | Zebrafish: Tg(fli1ep:Gal4ff): ubs3Tg | Zygmunt et al. (2011) | ZFIN ID: ZDB-ALT-120113–6 | |
| Strain, strain background (Zebrafish) | Zebrafish: Tg(UAS:EGFP-ZO1): ubs5Tg | Herwig et al. (2011) | ZFIN ID: ZDB-ALT-120113–7 | |
| Strain, strain background (Zebrafish) | Zebrafish: Tg(kdrl:EGFP): s843Tg | Jin et al. (2005) | ZFIN ID: ZDB-ALT-050916–14 | |
| Strain, strain background (Zebrafish) | Zebrafish: Tg(kdrl:gal4;UAS:RFP) | NA | NA | |
| Strain, strain background (Zebrafish) | Zebrafish Tg(−6.0itga2b:EGFP): la2Tg | Lin et al., 2005 Traver | ZFIN ID: ZDB-ALT-051223–4 | referred to as Tg(CD41:eGFP) |
| Strain, strain background (Zebrafish) | Zebrafish Tg(kdrl:myl9a-eGFP): ip5Tg | This Paper | N/A | |
| Strain, strain background (Zebrafish) | Zebrafish Tg(kdrl:myl9b-eGFP): ip6Tg | This paper | N/A | |
| Antibody | Sheep Anti-Digoxigenin Fab fragments, POD Conjugated | Roche | Cat# 11207733910; RRID: AB_514500 | 1:5000 |
| Recombinant DNA reagent | Transposase pCS-zT2TP | Suster et al. (2011) | N/A | |
| Recombinant DNA reagent | pUAS:eGFP-hs-ZO1 | Herwig et al. (2011) | N/A | |
| Recombinant DNA reagent | pEGFP-C1 | Clontech | N/A | |
| Recombinant DNA reagent | pmKate2-f-mem | Evrogen | Cat#: FP186 | |
| Recombinant DNA reagent | pG1-flk1-MCS-tol2 | Jin et al. (2005) | Addgene plasmid # 26436 | |
| Recombinant DNA reagent | PG1-flk-MCS-tol2-kdrl- myl9a-eGFP | This paper | N/A | |
| Recombinant DNA reagent | PG1-flk-MCS-tol2-kdrl- myl9b-eGFP | This paper | N/A | |
| Recombinant DNA reagent | p5E-Runx1 + 23-betaglobin | Tamplin et al. (2015) | Addgene plasmid # 69602 | |
| Recombinant DNA reagent | pTol2-Runx1 + 23×1- betaglobin:eGFP | This paper | N/A | |
| Recombinant DNA reagent | pTol2-Runx1 + 23×1-betaglobin -myl9b-eGFP | This paper | N/A | |
| Recombinant DNA reagent | pTol2-Runx1 + 23×1-betaglobin -myl9bA2A3-eGFP | This paper | N/A | |
| Recombinant DNA reagent | pTol2-Runx1 + 23×1-betaglobin -myl9a-mKate2 | This paper | N/A | |
| Chemical compound, drug | Tricaine | Sigma Aldrich | Cat#: A5040 | |
| Chemical compound, drug | Methylen Blue | Sigma Aldrich | Cat#: M4159 | |
| Chemical compound, drug | N-Phenylthiourea (PTU) | Sigma Aldrich | Cat#: P7629 | |
| Chemical compound, drug | Low Melting Point, Analytical Grade | Promega | Cat#: V2111 | |
| Chemical compound, drug | Formaldehyde (FA) | Polysciences | Cat#:04018–1 | |
| Chemical compound, drug | Proteinase K | Ambion | Cat#: AM2546 | |
| Chemical compound, drug | Digoxigenin labeled nucleotides | Jena Bioscence | Cat#: NU-803-DIGX | |
| Chemical compound, drug | Wester Blotting Reagent (WBR) | Roche | Cat#: 11921673001 | |
| Chemical compound, drug | NBT | Sigma Aldrich | Cat#: N6639 | |
| Chemical compound, drug | BCIP | Sigma Aldrich | Cat#: B-8503 | |
| Chemical compound, drug | Tissue Freezing Medium, Blue | Electron Microscopy Sciences | Cat#: 72592-B | |
| Chemical compound, drug | Aqua-Poly/Mount | Biovalley | Cat#: 18606–5 | |
| Chemical compound, drug | Immersol W 2010, oil | Zeiss | Cat#: 444969-0000-000 | |
| Chemical compound, drug | AquaSound Clear ultrasound gel | Free-Med | Cat#: FU00071 | |
| Commercial assay or kit | Cloning Gibson Assembly | NEB | Cat#: E2611S | |
| Commercial assay or kit | cDNA synthesis for cloning Super Script III | Thermo Fisher | Cat#: 8080093 | |
| Commercial assay or kit | Expand High Fidelity polymerase | Sigma Aldrich | Cat#:11732641001 | |
| Commercial assay or kit | RNA synthesis mMESSAGE mMACHINE SP6 Transcription | Ambion | Cat#: AM1340 | |
| Commercial assay or kit | Poly(A) Tailing Kit | Ambion | Cat#: AM1350 | |
| Commercial assay or kit | DNA purification for injection NucleoBond Xtra Midi EF | Macherey Nagel | Cat#: 740420.10 | |
| Commercial assay or kit | T7 RNA polymerase | Promega | Cat#: P2075 | |
| Commercial assay or kit | RNA extraction RNeasy Plus Mini Kit | QIagen | Cat#: 74134 | |
| Commercial assay or kit | cDNA synthesis for qPCR M-MLV Reverse Transcriptase | Invitrogen | Cat#: 28025013 | |
| Commercial assay or kit | RNAse Out | Invitrogen | Cat#: 10777019 | |
| Commercial assay or kit | qPCR Takyon Rox SYBR Master mix blue dTTP | Eurogenetec | Cat#: UF-RSMT-B0701 | |
| Commercial assay or kit | NucAwayTM d’AmbionTM | Invitrogen | Cat#: AM10070 | |
| Software, algorithm | Acquisition-Imaging analysis-LAS X | Leica | http://www.Leica-microsystems.com | |
| Software, algorithm | Acquisition-Volocity | Perkin Elmer | http://www.perkinelmer.com/ | |
| Software, algorithm | Imaging analysis-Imaris 8.4.1 | Bitplane | http://www.bitplane.com/ | |
| Software, algorithm | Imaging analysis-Matlab R2017a/R2017b | MathWorks | https://fr.mathworks.com | |
| Software, algorithm | Image Analysis-Prism 6 | Graph Pad | https://www.graphpad.com/ | |
| Software, algorithm | Image Analysis-Fiji | NIH | https://imagej.net/Fiji | |
| Software, algorithm | Image Analysis TrackMate plugin for Fiji | Tinevez et al. (2017) | https://imagej.net/TrackMate | |
| Software, algorithm | Image Analysis Icy | de Chaumont et al., 2012 | http://icy.bioimageanalysis.org/ | |
| Software, algorithm | Image Analysis TubeSkinner plugin for Icy | This paper | This Paper | |
| Software, algorithm | Figures-Photoshop CC 2017.1.1 | Adobe | http://www.adobe.com/cn/ | |
| Software, algorithm | Figures-Illustrator CC 2017.1.1 | Adobe | http://www.adobe.com/cn/ | |
| Recombinant DNA reagent | Morpholino Standard Control | Gene Tools | N/A | CCTCTTACCTCAGTTACAATTTATA |
| Recombinant DNA reagent | Morpholino sih | Sehnert et al. (2002) | ZDB-MRPHLNO -060317–4 | CATGTTTGCTCTGATCTGACACGCA |
| Recombinant DNA reagent | Morpholino Myl9aspe2i2 | Gene Tools; This paper | N/A | ATTCAGCTTGTATATCTCTCACCCA |
| Recombinant DNA reagent | Morpholino Myl9aspi3e4 | Gene Tools; This paper | N/A | CCCTGGTACAAACACACCGCAGATT |
| Recombinant DNA reagent | Morpholino Myl9bspe2i2 | Gene Tools; This paper | N/A | CTATTATTTCACCCAGACTCACCCA |
| Recombinant DNA reagent | Morpholino Myl9bspe3i3 | Gene Tools; This paper | N/A | TTGTTGTTGTTTTTACCAGATCCCT |
| Recombinant DNA reagent | Oligo: Rescue-SP6-myl9b forward | This paper | N/A | atttaggtgacactatagaagngATGT CCAGCAAAAGAGCAAAGGGG |
| Recombinant DNA reagent | Oligo: Rescue-myl9b reverse | This paper | N/A | CTACATGTCGTCTTTGTCTTT GGCTCCG |
| Recombinant DNA reagent | Oligo: qPCR myl9a forward | This paper | N/A | CACCTGCTTCGATGAGGACGCCA |
| Recombinant DNA reagent | Oligo: qPCR myl9a reverse | This paper | N/A | CCGAGATCTGCTGACCACTATGG GCGATC |
| Recombinant DNA reagent | Oligo: qPCR myl9b forward | This paper | N/A | GCCTGCTTCGATGAGGAGGGATC |
| Recombinant DNA reagent | Oligo: qPCR myl9b reverse | This Paper | N/A | CTGACCACCATGGGAGACC |
| Recombinant DNA reagent | Oligo: qPCR splicemyl9asp22 forward | This paper | N/A | CACGTCCAATGTCTTCGCCA |
| Recombinant DNA reagent | Oligo: qPCR splicemyl9asp22 reverse | This paper | N/A | TGGGTTCTTCCCCAGAGAGG |
| Recombinant DNA reagent | Oligo: qPCR splicemyl9asp34 forward | This Paper | N/A | GGACGCCACTGGGTTCATCC |
| Recombinant DNA reagent | Oligo: qPCR splicemyl9asp34 reverse | This paper | N/A | GTTTCCTTTCTTGTCGATGGGCGC |
| Recombinant DNA reagent | Oligo: qPCR splicemyl9bsp22 forward | This paper | N/A | GCATCTTTGGGTAAGAACCCGTCTG |
| Recombinant DNA reagent | Oligo: qPCR splicemyl9bsp22 reverse | This paper | N/A | TCAGCCGCTCTCCAAACATG |
| Recombinant DNA reagent | Oligo: qPCR splicemyl9bsp33 forward | This paper | N/A | GAGGAGGGATCTGGTTTCATCC |
| Recombinant DNA reagent | Oligo: qPCR splicemyl9bsp33 reverse | This paper | N/A | CCCTTCTTGTCAATGGGAGCC |
| Recombinant DNA reagent | Oligo: Probe myl9a forward | This paper | N/A | GATAAGGAGGATCTGCATGA CATGCTCG |
| Recombinant DNA reagent | Oligo: Probe T7 myl9a reverse | This paper | N/A | gaaattaatacgactcactatagg GTGAAGCGATCGCCCATAGTGG |
| Recombinant DNA reagent | Oligo: Probe myl9b forward | This paper | N/A | GCACGATATGCTAGCATCTTTGGG |
| Recombinant DNA reagent | Oligo: Probe T7-myl9b reverse | This paper | N/A | gaaattaatacgactcactataggg CATGGTGGTCAGCAGCTCCC |
| Recombinant DNA reagent | Oligo for Cloning: PG1-flk-MCS-tol2-myl9a- eGFP-myl9a-for | This paper | N/A | TATTTTAACAGACAAGGGCGATGT CTGCAGCCAAACGCGCCAAAGGAAAG |
| Recombinant DNA reagent | Oligo for Cloning: PG1-flk-MCS-tol2-myl9a- eGFP-myl9a-rev | This paper | N/A | CCTTGCTCACCATGTCGTCCTTG TCTTTGGCTCCGTGCTTTAG |
| Recombinant DNA reagent | Oligo for Cloning: PG1-flk-MCS-tol2-myl9a- eGFP-eGFP-for | This paper | N/A | GGACGACATGGTGAGCAAGGGCG AGGAGCTGTTCACCGGG |
| Recombinant DNA reagent | Oligo for Cloning: PG1-flk-MCS-tol2-myl9a- eGFP-eGFP-rev | This paper | N/A | CGATATCCTCGAGGGTACCGTTATCTA GATCCGGTGGATCCCGGGCCCGC |
| Recombinant DNA reagent | Oligo for Cloning: PG1-flk-MCS-tol2-myl9b- eGFP-myl9b-for | This paper | N/A | GACGTTATTTTAACAGACAAGGGCG ATGTCCAGCAAAAGAGCAAAGGGG AAGACC |
| Recombinant DNA reagent | Oligo for Cloning: PG1-flk-MCS-tol2-myl9b- eGFP-myl9b-rev | This paper | N/A | CGCCCTTGCTCACCATGTCGTCTTTGT CTTTGGCTCCGTGTTT |
| Recombinant DNA reagent | Oligo for Cloning: PG1-flk-MCS-tol2-myl9b- eGFP-eGFP-for | This paper | N/A | CAAAGACGACATGGTGAGCAAGGGCG AGGAGCTGTTCACCGGG |
| Recombinant DNA reagent | Oligo for Cloning: PG1-flk-MCS-tol2-myl9b- eGFP-eGFP-rev | This paper | N/A | GGATCCGATATCCTCGAGGGTACCG TTATCTAGATCCGGTGGATCCCG GGCCCGC |
| Recombinant DNA reagent | Oligo for Cloning: pTol2-Runx1 + 23-betaglobin- myl9a-mKate2-myl9a-for | This paper | N/A | ATCCCGCGGTGGAGCTCCAGAATTCAT GTCTGCAGCCAAACGCGCCAAAGG |
| Recombinant DNA reagent | Oligo for Cloning: pTol2-Runx1 + 23-betaglobin- myl9a-mKate2-myl9a-rev | This paper | N/A | GCATGTTCTCCTTAATCAGCTCGCTC ACCATGTCGTCCTTGTCTTTGGCTCC |
| Recombinant DNA reagent | Oligo for Cloning: pTol2-Runx1 + 23-betaglobin- myl9a-mKate2-mKate2-for | This paper | N/A | GAGCCAAAGACAAGGACGACATGGT GAGCGAGCTGATTAAGGAGAACATGC |
| Recombinant DNA reagent | Oligo for Cloning: pTol2-Runx1 + 23-betaglobin- myl9a-mKate2-mKate2-rev | This paper | N/A | GGATCCGATATCCTCGAGGGTACCGTC ATCTGTGCCCCAGTTTGCTAGGG |
| Recombinant DNA reagent | Oligo for Cloning: pTol2-Runx1 + 23×1- betaglobin-myl9b-eGFP- myl9a-for | This paper | N/A | CAGACATCCCGCGGTGGAGCTCC AGGTCGCCACCATGTCCAGCAAAAG AGCAAAGGGGAAGACCACCAAG |
| Recombinant DNA reagent | Oligo for Cloning: pTol2-Runx1 + 23×1- betaglobin-myl9b-eGFP- myl9a-rev | This paper | N/A | CGCCCTTGCTCACCATggtggcgacGAA TTCCATGTCGTCTTTGTCTTTGG CTCCGTG |
| Recombinant DNA reagent | Oligos for mutagenesis: pTol2-Runx1 + 23×1- betaglobin-myl9b-eGFP- myl9aA2A3-for | This paper | N/A | CAGACATCCCGCGGTGGAGCTCCA GgtcgccaccAtggccgccaaaagagca aaggggaagaccaccaag |
| Recombinant DNA reagent | Oligo for mutagenesis: pTol2-Runx1 + 23×1 betaglobin- myl9b-eGFP- myl9aA2A3-rev | This paper | N/A | CGCCCTTGCTCACCATggtggcgac GAATTCcatgtcgtctttgtctttg gctccgtg |
Additional files
-
Source code 1
Matlab code for tracking, A-P distances through time and closing speeds.
- https://doi.org/10.7554/eLife.37355.035
-
Source code 2
Code of the plugin AortaTracker (used for Figures 3, 4 and 5a-bottom panel, and see Method section).
- https://doi.org/10.7554/eLife.37355.036
-
Transparent reporting form
- https://doi.org/10.7554/eLife.37355.037
Download links
A two-part list of links to download the article, or parts of the article, in various formats.
Downloads (link to download the article as PDF)
Open citations (links to open the citations from this article in various online reference manager services)
Cite this article (links to download the citations from this article in formats compatible with various reference manager tools)
Anisotropic organization of circumferential actomyosin characterizes hematopoietic stem cells emergence in the zebrafish
eLife 7:e37355.
https://doi.org/10.7554/eLife.37355


