Evolution of cation binding in the active sites of P-loop nucleoside triphosphatases in relation to the basic catalytic mechanism
- University of Osnabrück, Germany
- Lomonosov Moscow State University, Russia
- Russian Academy of Sciences, Russia
- National Center for Biotechnology Information, National Library of Medicine, National Institutes of Health, United States
Figures
Figure 1
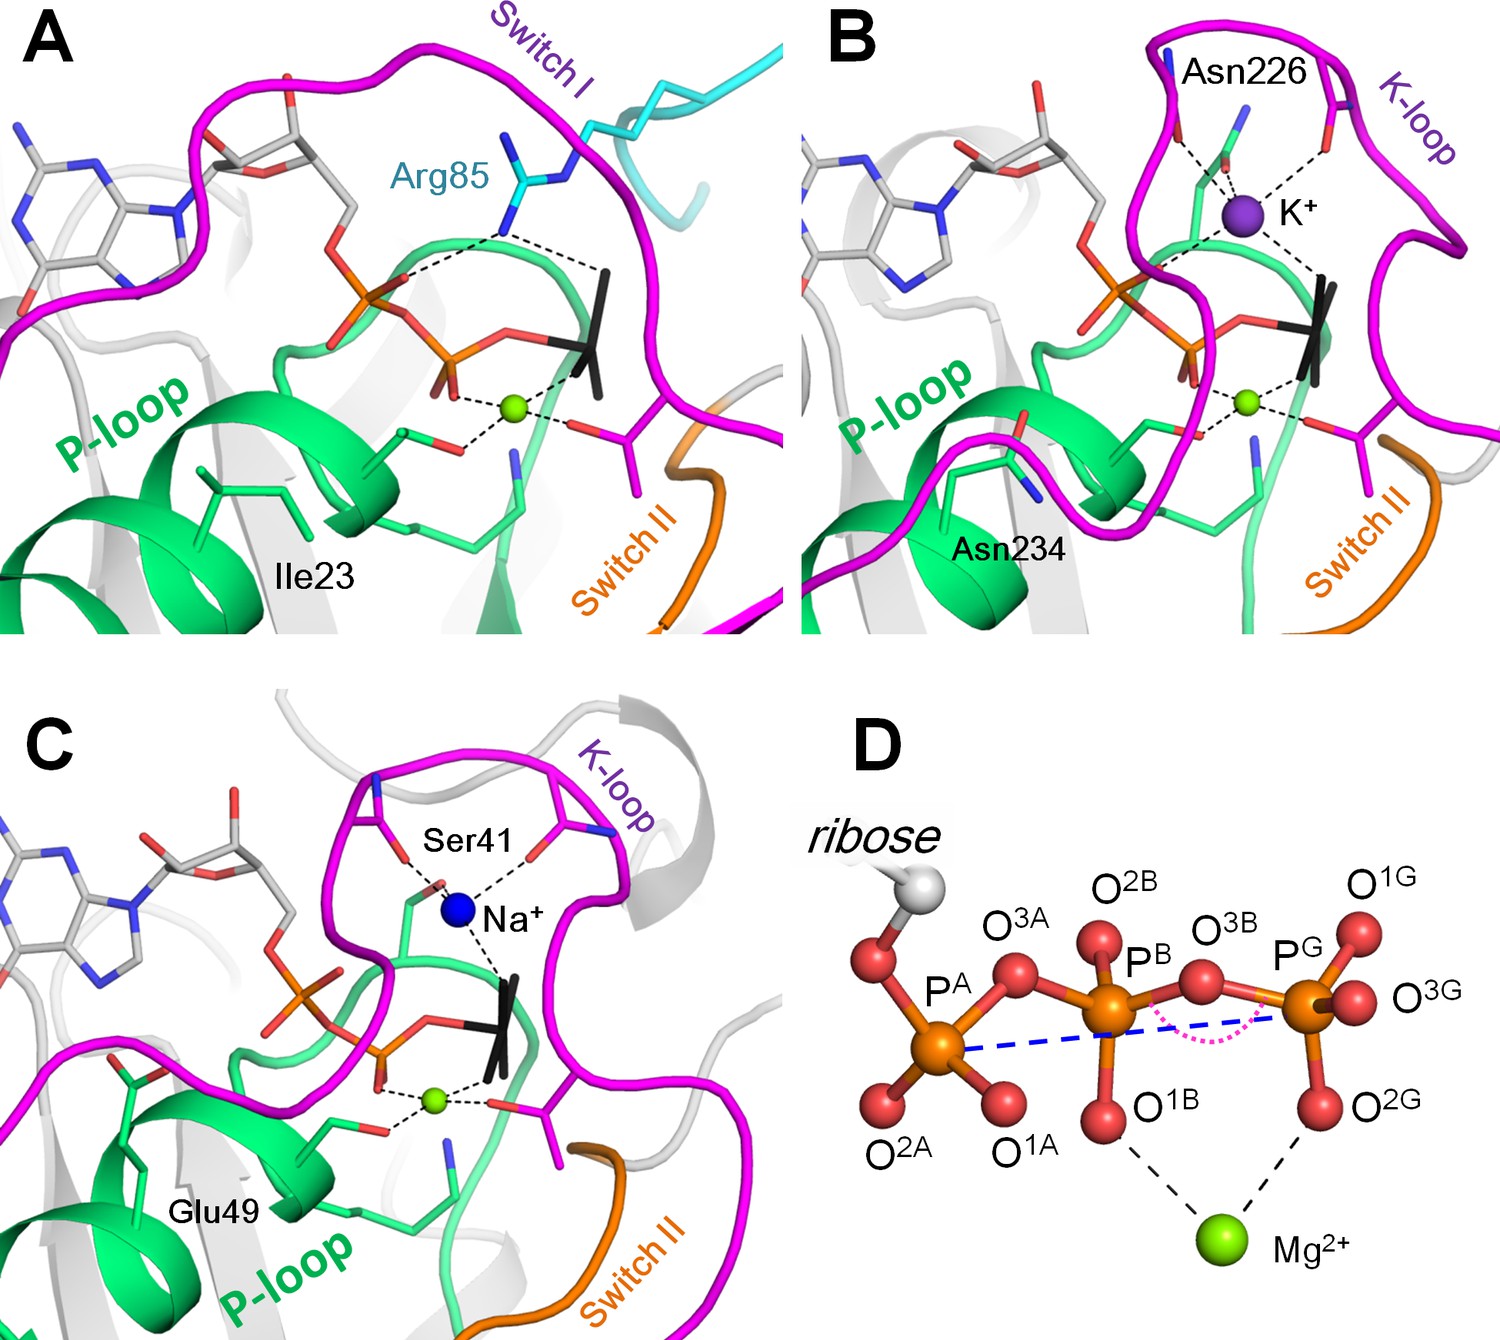
Mg-NTP complexes and their binding in the active sites of P-loop NTPases.
Phosphate chains of NTP molecules and their analogs are colored by atoms: oxygen atoms in red, phosphorus in orange. The K+ ion is shown as a purple sphere, Na+ ion is shown as a blue sphere, Mg2+ ions are shown as green spheres. Phosphate chain is shown in stick representation with oxygens in red and phosphorus atoms in orange; γ-phosphate mimicking groups (AlF4- and MgF3-) are shown in black, coordination and hydrogen bonds are shown as black dashed lines. (A) Active site of the small Ras-like GTPase RhoA in complex with the activating protein RhoGAP [PDB entry 1OW3]; the bound GDP-MgF3- mimics the transition state. The P-loop with the preceding α-helix is shown as green cartoon; Switch I motif with the conserved Mg2+-binding Thr residue is shown in magenta; Switch II motif (DxxG motif, which starts from the conserved Asp of the Walker B motif) is shown in orange; the Arg finger of RhoGAP is colored turquoise. (B) Active site of the K+-dependent GTPase MnmE with bound GDP-AlF4- [PDB: 2GJ8]. Switch I region and the K-loop are shown in magenta. (C) The active site of dynamin, a Na+-adapted GTPase with bound GDP-AlF4- [PDB: 2X2E]. The P-loop and K-loop (Switch I region) are colored as in panels A and B. (D) Structure of the NTP triphosphate chain with Mg2+ ion in a bidentate coordination, referred to as the βγ conformation. The pink dotted arch indicates the PB-O3B-PG angle; the blue dashed line indicates the PA-PG distance. The atom names are in accordance with the CHARMM naming scheme (Vanommeslaeghe et al., 2010) and the recent IUPAC recommendations (Blackburn et al., 2017).
Figure 2 with 3 supplements
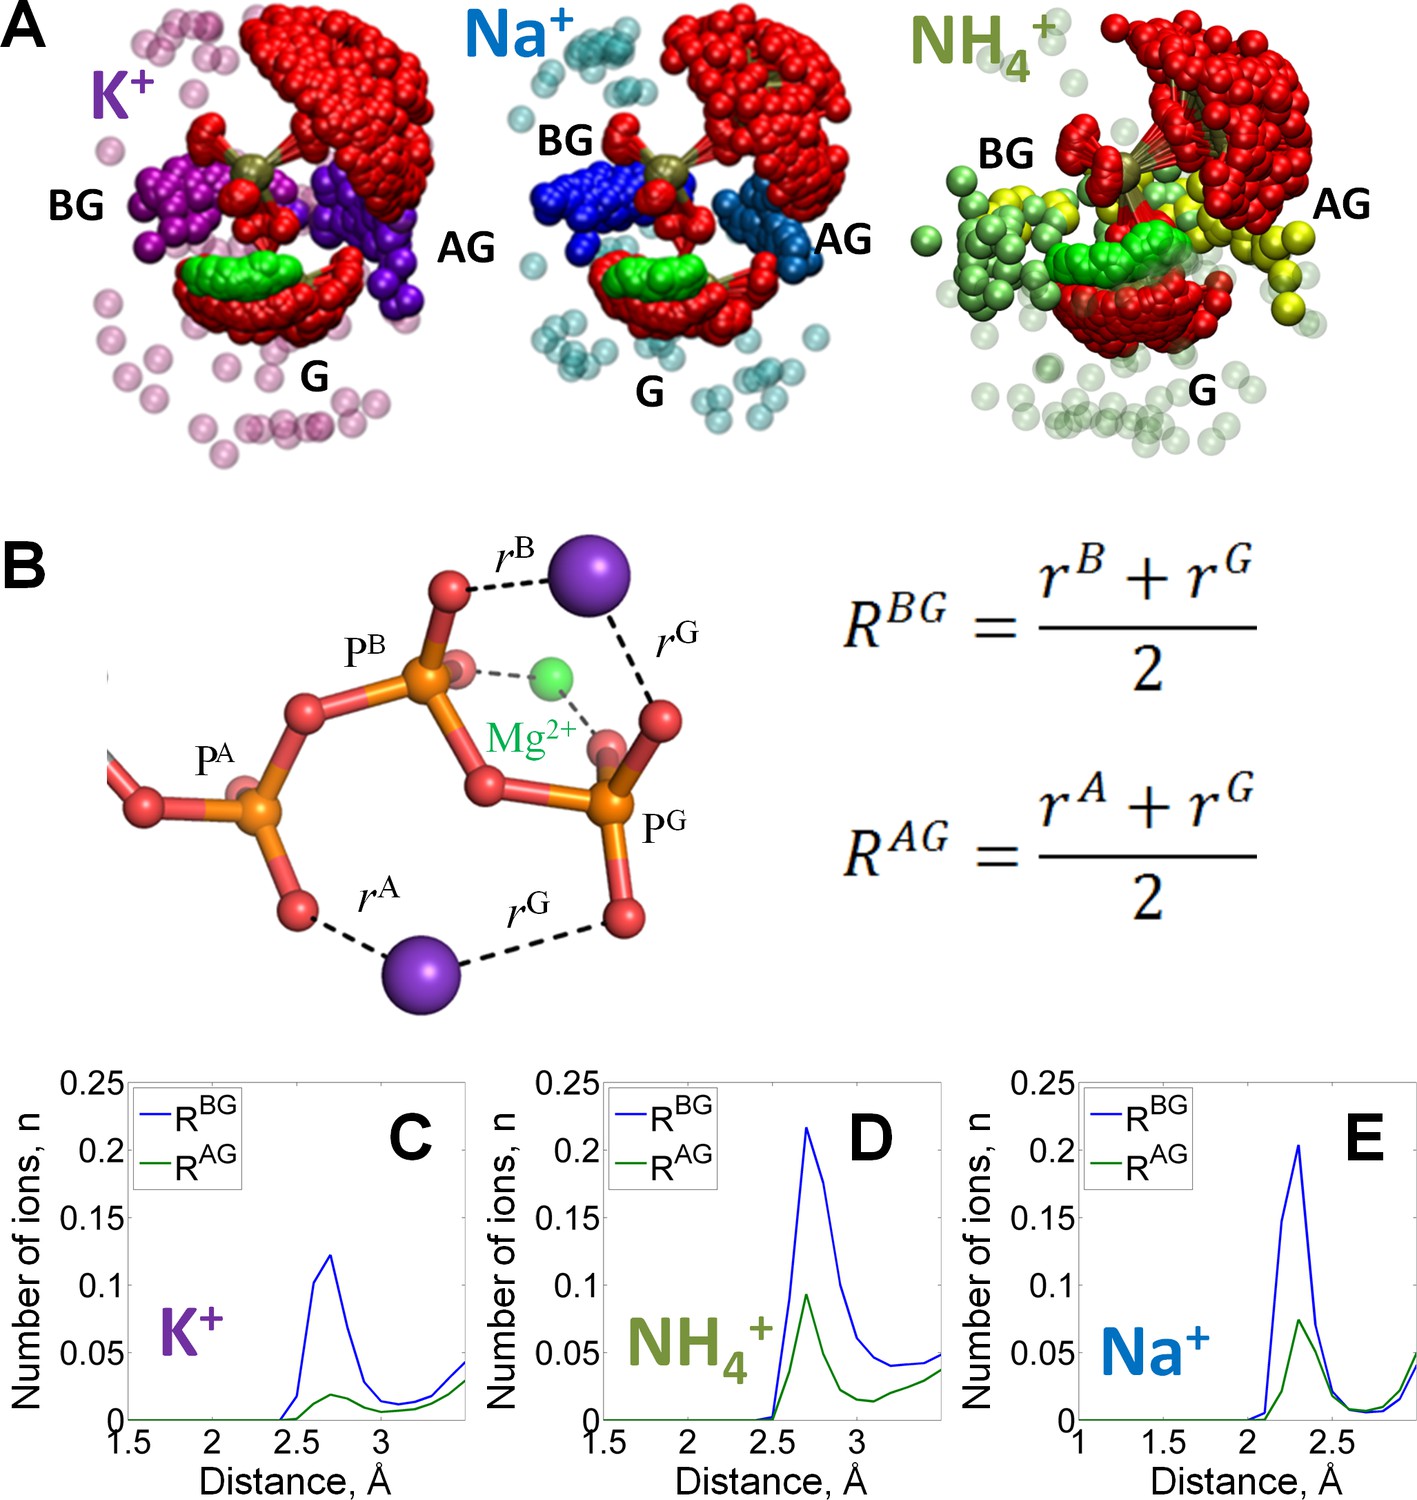
Binding of monovalent cations to the Mg-ATP in water.
The color scheme is as in Figure 1. (A) Superposition of the ATP phosphate chain conformations observed in the MD simulations in the presence of K+ ions (shown in purple); Na+ ions (shown in blue) and NH4+ ions (nitrogen atoms of NH4+ ions are shown in yellow/green). The ribose and adenine moieties are not shown, the phosphate chain is shown with PA on top and PG at the bottom. All cations within 5 Å from the phosphate chain are shown and colored in different shades depending on the nearby oxygen atoms to illustrate the distinction between binding in the AG and BG sites (see text for details). Transparent spheres signify the ions outside the AG and BG sites. The constellation of ions in the vicinity of γ-phosphate is referred to as the site G. For the visualization, we have selected every 100th simulation frame to sample the conformational states of the Mg-ATP complex with 5-ns intervals. The conformations were superposed to achieve the best possible match between coordinates of the phosphorus and ester oxygen atoms of the ATP phosphate chain. (B) Geometry of the Mg-ATP complex with two monovalent cations bound, one in the AG site and one in the BG site. Distances to the AG and BG binding sites (RAG and RBG) were calculated as averages of the distances to the two corresponding oxygen atoms. The distances to the oxygen atoms (e.g. rA) were defined as the shortest distances between a particular M+ ion and any oxygen atom of the respective phosphate group (including the bridging oxygen atoms). (C-E) distance distributions for K+, NH4+, and Na+ ions in the AG and BG sites.
Figure 2—figure supplement 1
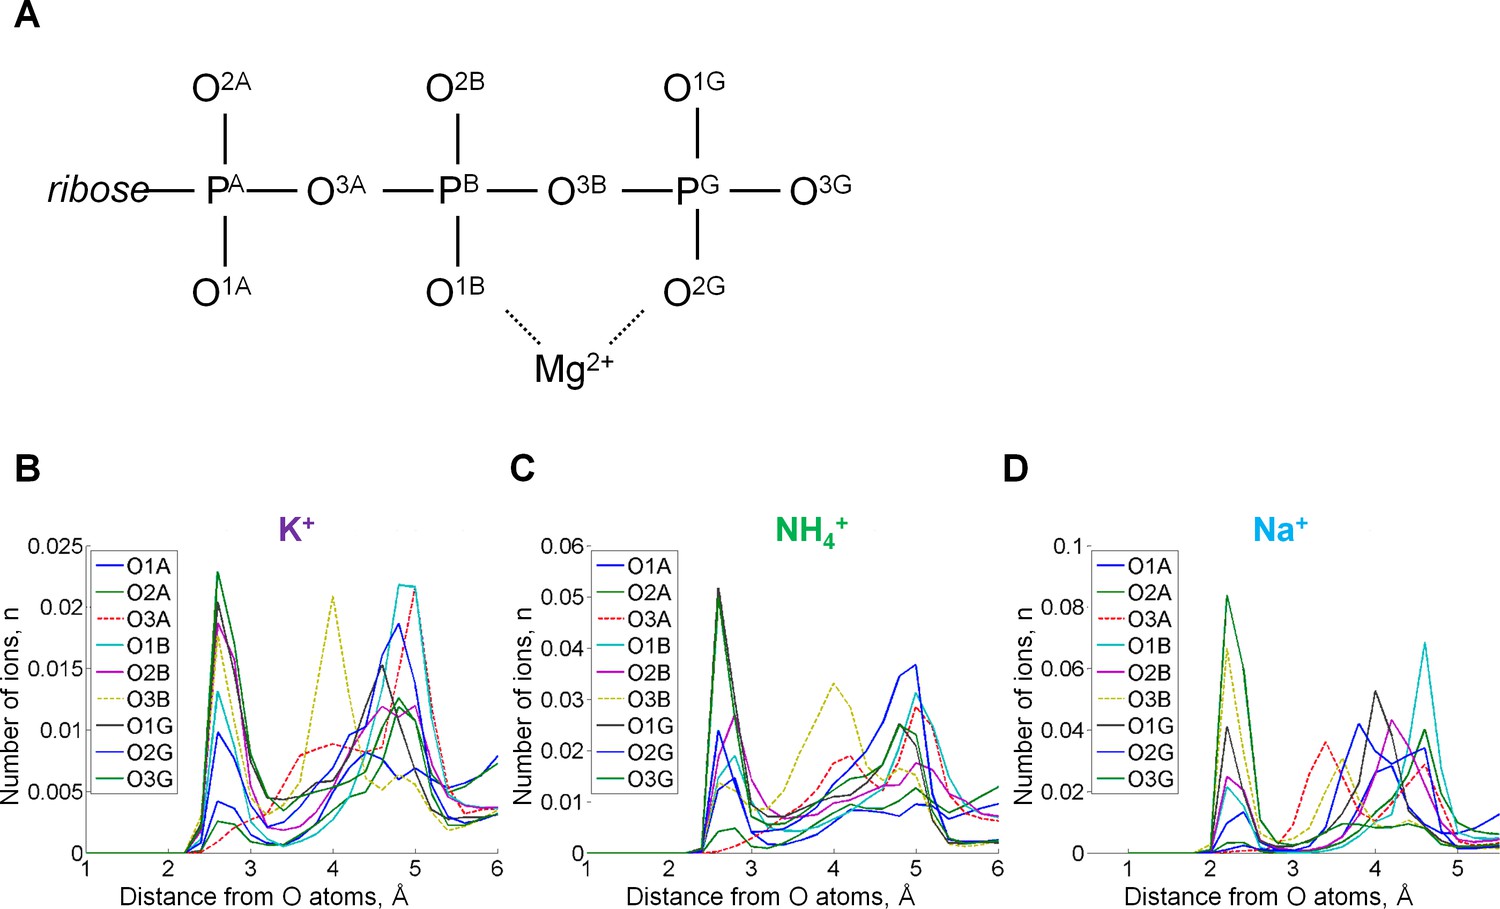
Radial distribution of cations in the proximity of each oxygen atom.
Radial distributions are shown for all atoms of the ATP phosphate chain. (A) Atom names are in accordance with the CHARMM naming scheme (Vanommeslaeghe et al., 2010) and the recent IUPAC recommendations (Blackburn et al., 2017). (B) Radial distributions of cations around individual oxygen atoms. The distributions of cations around ester bond oxygen atoms O3A and O3B are shown by dashed lines. The peak distances from the cation to the oxygen atoms were the same 2.7 Å for K+ and NH4+ ions, while for Na+ this distance was 2.2 Å. For the NH4+ ion, the distance was measured from each oxygen atom to the nitrogen atom of NH4+. There are two ester bond oxygens in the phosphate chain, but only the oxygen (O3B) that connects β- and γ-phosphates was seen involved in the cation binding, it interacted more often with K+ and Na+ than with NH4+. Monovalent cations were found near oxygen atoms of γ-phosphate more often than near oxygens of β- and α-phosphates.
Figure 2—figure supplement 2

Properties of cation binding to the ATP as derived from MD simulations.
(A) Probability distribution functions for cations around the phosphate chain. We have plotted the number of atoms inside the area centered on phosphorus atoms of the ATP phosphate chain as a function of the radius of the selected area. This number was estimated by measuring the distance between each cation in the system and the nearest phosphorus atom of ATP during MD simulations. The plot indicates the presence of 1.5 cations on average in the 4 Å radius around the phosphate chain in the case of Na+ and NH4+, and 0.75 ions on average in the case of K+. For all three ions, the first inflection occurs at the distances shorter than 4 Å and a less prominent second inflection can be seen at around 6 Å. (B) Free energy of the cation binding as a function of the distance from the phosphate chain, as estimated from the probability data in panel A. In addition to the two binding sites at the distances of approx. 4 Å and 6 Å, the free energy plot revealed a less pronounced third binding site at a distance of approx. 8–9 Å from the phosphorus atoms. The most prominent is the first peak, corresponding to cation binding around the phosphate chain, within the 4 Å distance of at least one of the phosphorus atoms, so further focus was specifically on cation binding around the phosphate chain.
Figure 2—figure supplement 3
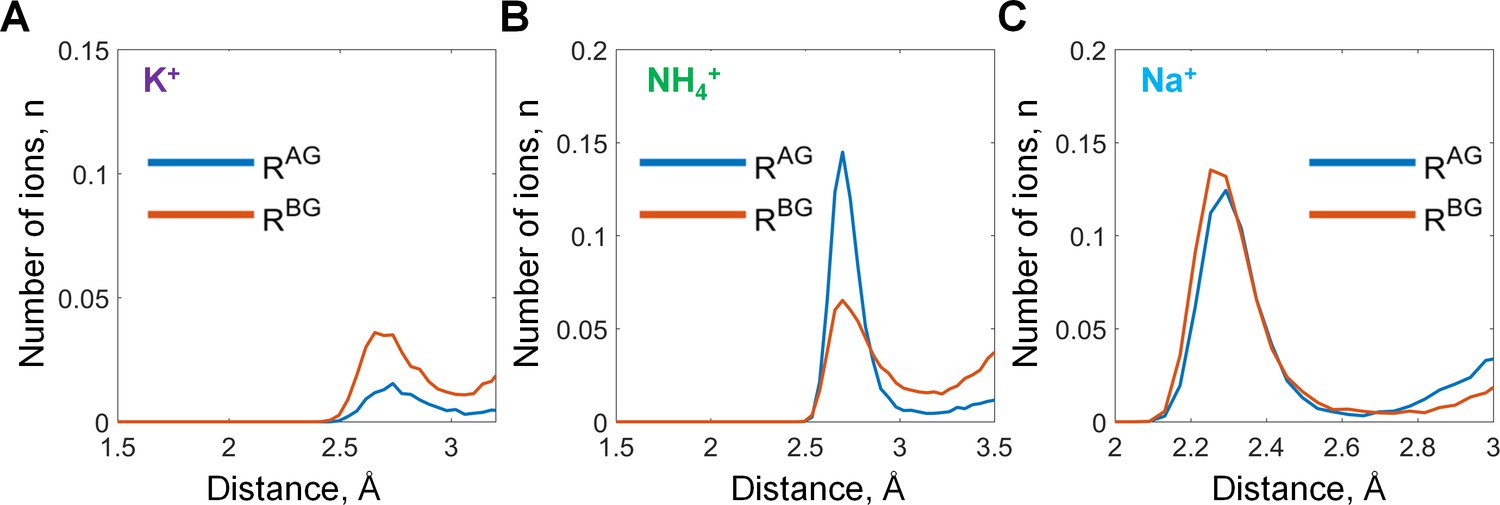
Binding of monovalent cations to the Mg-GTP in water.
Distances to the AG and BG binding sites (RAG and RBG) were calculated as averages of the distances to the two corresponding oxygen atoms (see Figure 2 in the main text). The distances to the oxygen atoms (e.g. rA) were defined as the shortest distances between a particular M+ ion and any oxygen atom of the respective phosphate group (including ester oxygen atoms). (A-C) distance distributions for K+, NH4+, and Na+ ions in the AG and BG sites.
Figure 3 with 1 supplement
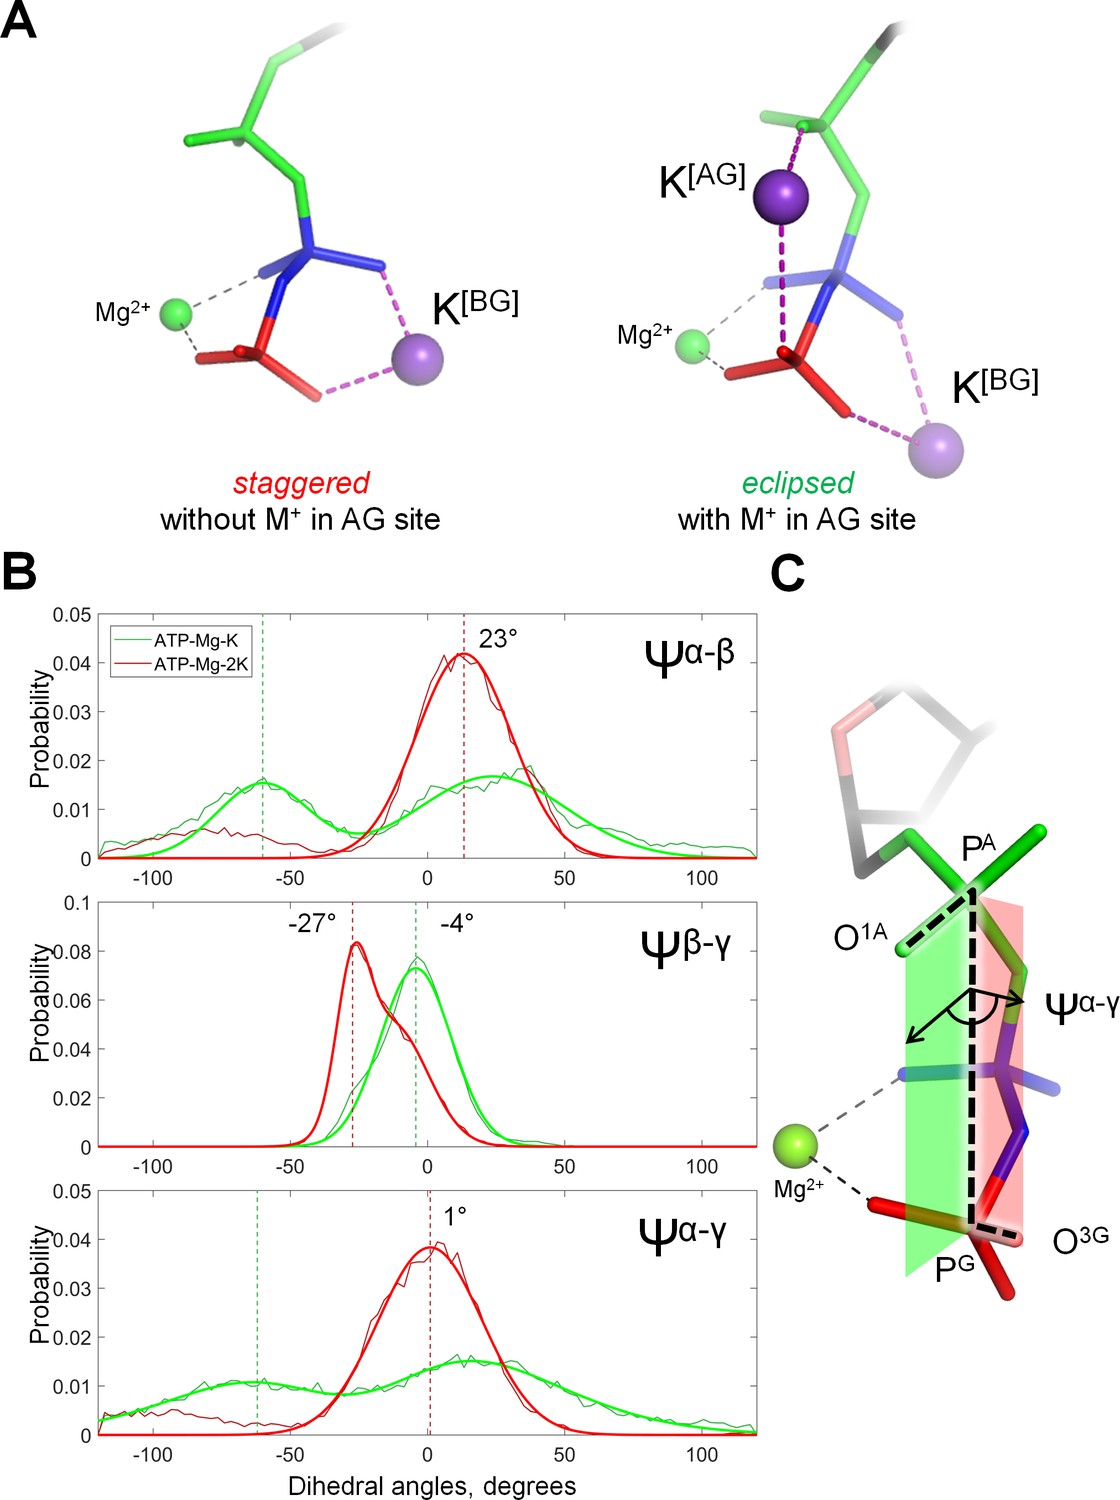
Cation binding induces eclipsed conformation of the phosphate chain.
(A) Conformations of Mg-ATP complexes with one and two K+ ions bound as inferred from MD simulations; left structure, no K+ ion bound in the AG site; right structure, a K+ ion is bound in the AG site. The α-phosphate is in on the top, β- and γ-phosphates are below; the α-phosphate is shown in green, β-phosphate in blue, γ-phosphate in red. (B) Distribution histograms for dihedral angles between phosphate groups in ATP, calculated from MD simulations of Mg-ATP with one K+ cation bound in the BG site (green) and with two cations bound in the AG and BG sites (red). Normalized histograms of dihedral angle distribution (thin lines) were calculated from MD trajectories and fitted with normal distribution function (thick lines). Dashed lines indicate the centroid values of the fits by Gaussian function. All distributions were fitted with one-term Gaussian models, except for the Ψβ-γ angle in case of Mg-ATP with two cations bound, this distribution was fitted with a two-term Gaussian, parameters for the highest peak are shown. (C) The phosphate chain of GTP, illustrating the dihedral angle Ψα-γ. Dihedral angle is an angle between two planes and is defined by four atoms. In this case, the angle Ψα-γ is an angle between the plane that contains atoms PG, PA and O1A (green), and the plane that contains atoms PA, PG and O3G (red). In the fully eclipsed conformation, both P-O bonds are coplanar, so that the two planes overlap and the dihedral angle between them is 0°.
Figure 3—figure supplement 1
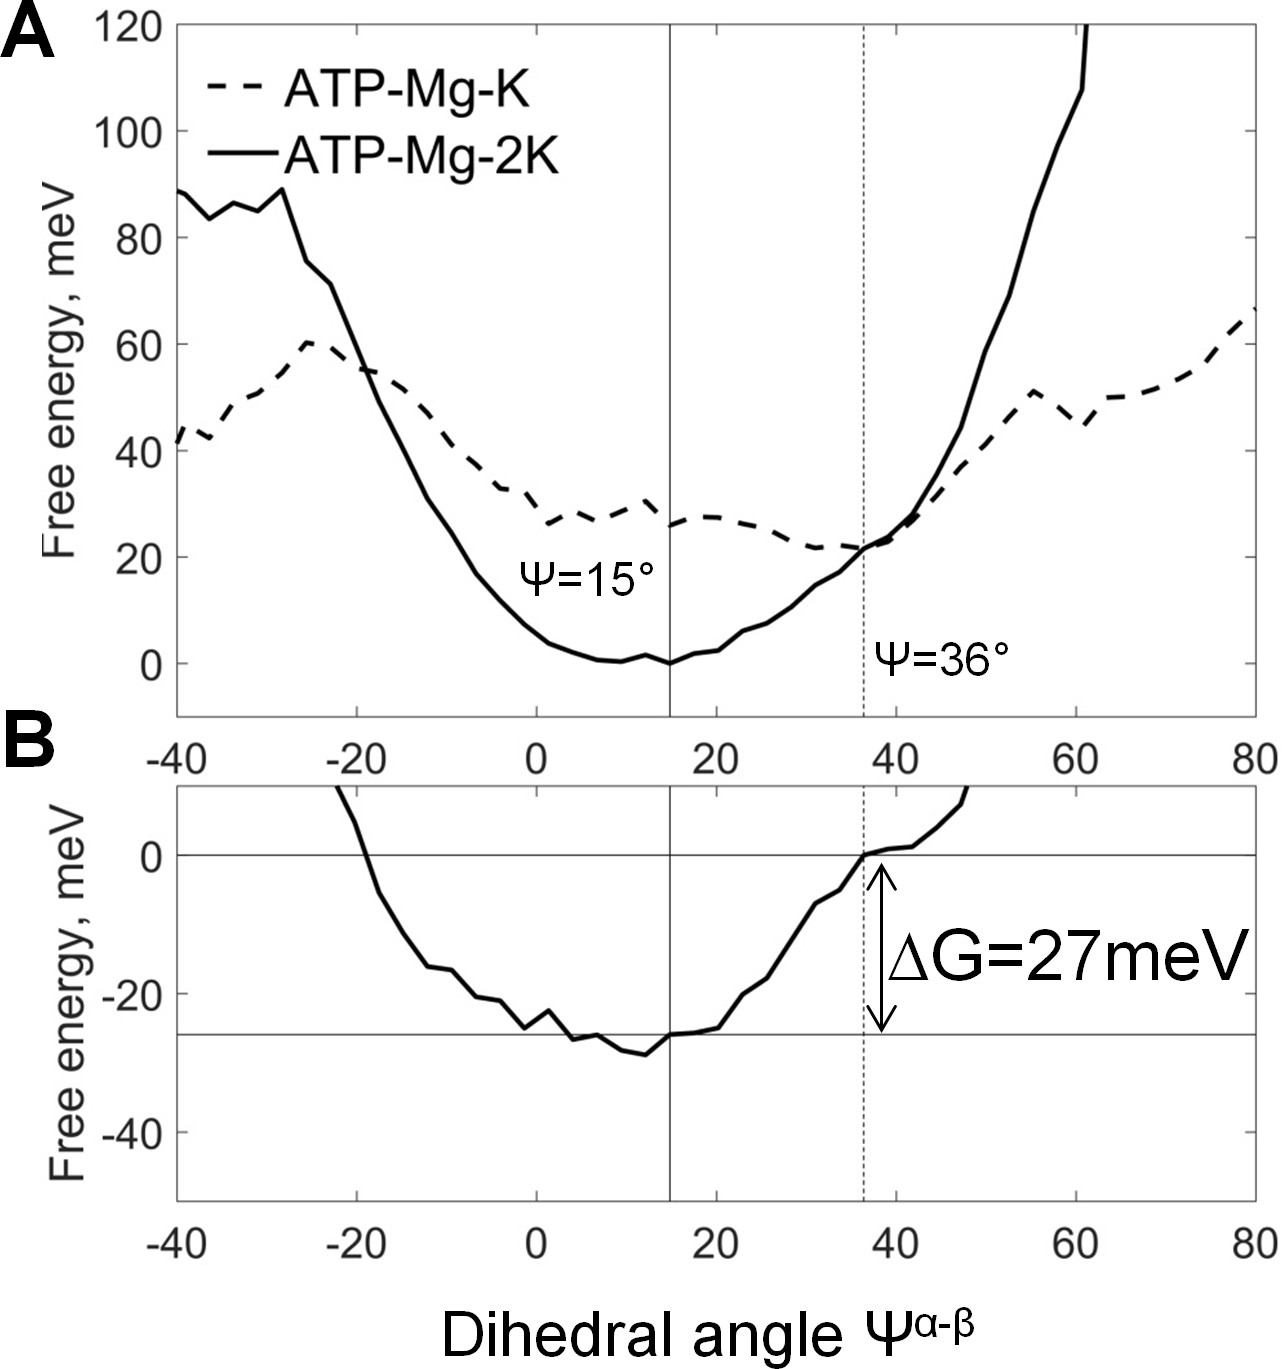
Coupling between cation binding in the AG site and rotation of γ-phosphate relative to α- and β-phosphates.
Data from MD simulations with restraints on the positions of K+ ions (see the text and Supplementary file 1C). The top graph shows free energy calculated from normalized probabilities of ATP conformations and plotted as function of the dihedral angle between γ- and β-phosphates. The bottom plot displays free energy of coupling the binding of the second K+ ion with the γ-phosphate rotation, calculated as the difference between the free energy plots shown on the top graph. The lowest energy value was set to zero. These plots show that the presence of second K+ ion in the AG site induces a near-eclipsed state of the phosphate chain, by bringing both Ψα-β and Ψα-γ angles close to 0°, at the expense of Ψβ-γ, which increases slightly (see Supplementary file 1D). Binding of the second K+ ion in the AG site stabilizes this almost eclipsed state by ~27 meV.
Figure 4 with 3 supplements
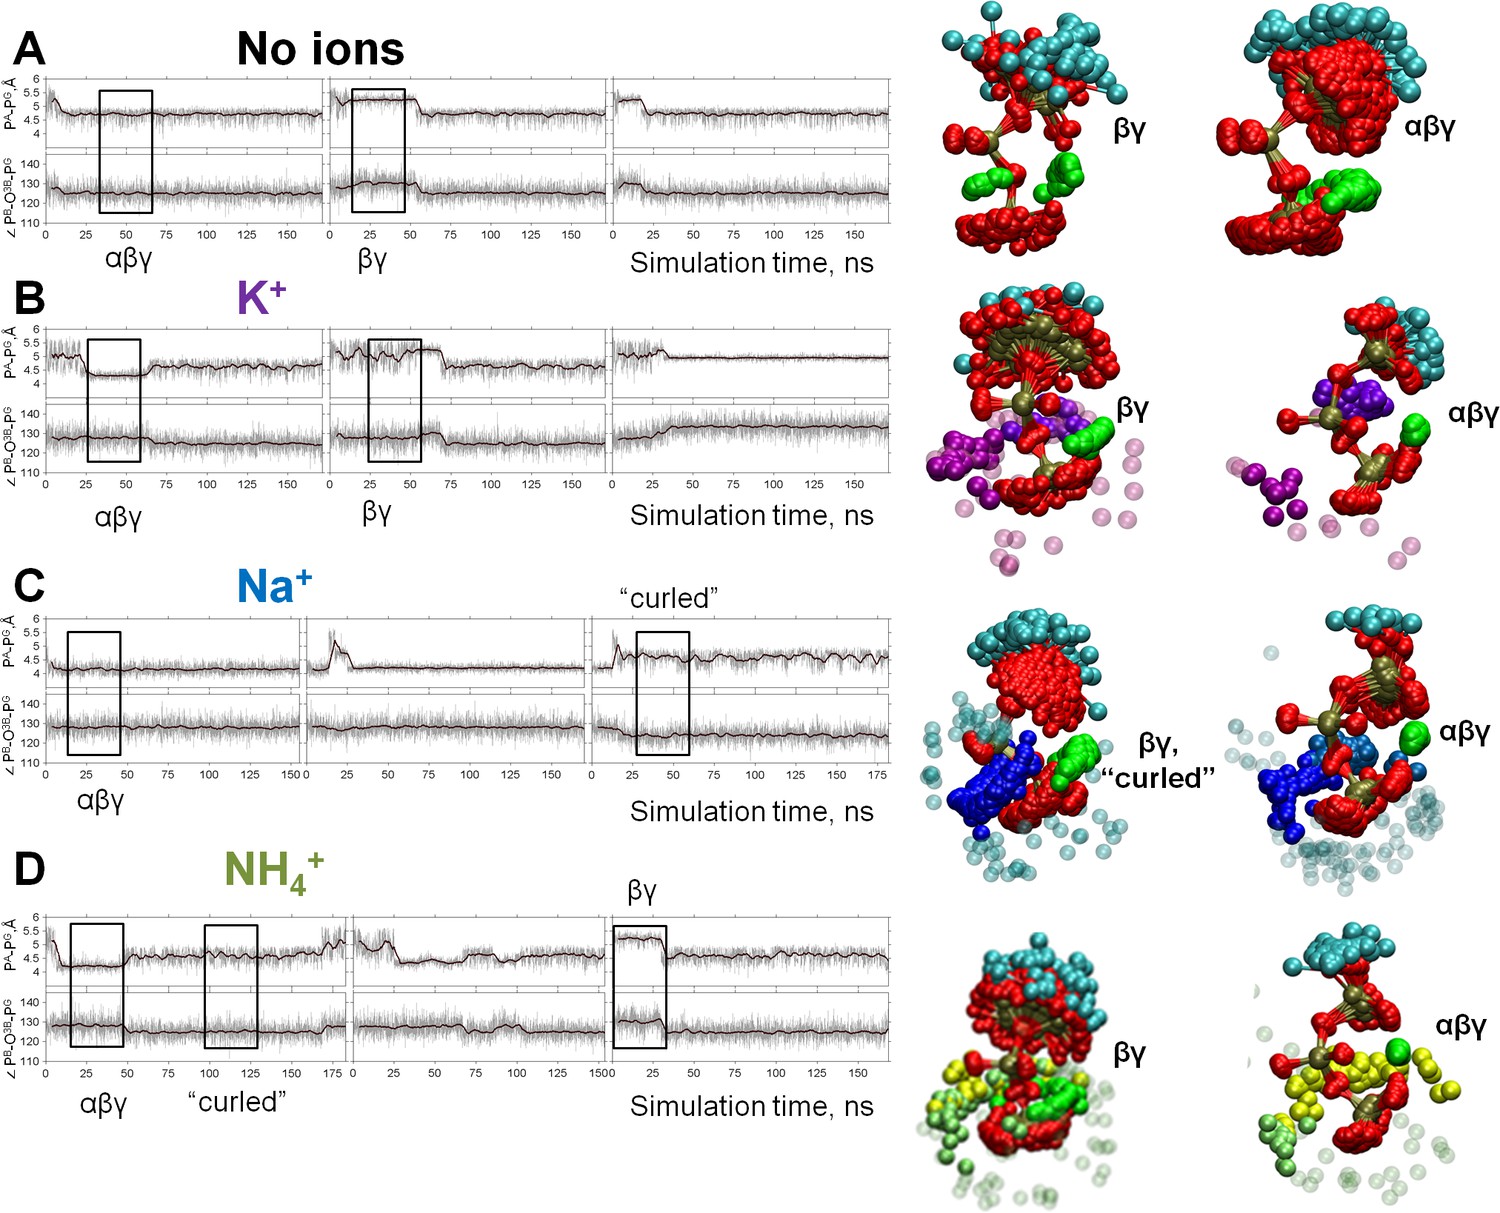
Dynamics of the phosphate chain of the Mg-ATP complex with and without monovalent cations.
Each left panel shows the PA-PG distance (upper trace) and the PB-O3B-PG angle (bottom trace) in the course of MD simulations. Thin gray lines show actual values measured from each frame of the MD simulation, the bold black lines show moving average with a 2-ps window. Black boxes indicate fragments of simulations chosen for the analyses of particular types of interaction between the Mg2+ ion and the triphosphate chain; the respective conformations of Mg-ATP are shown on the right. The analysis was performed as shown in Figure 2B. The color scheme is as in Figure 1. (A) no added ions; (B–D) MD simulations in the presence of K+, Na+, and NH4+, respectively.
Figure 4—figure supplement 1
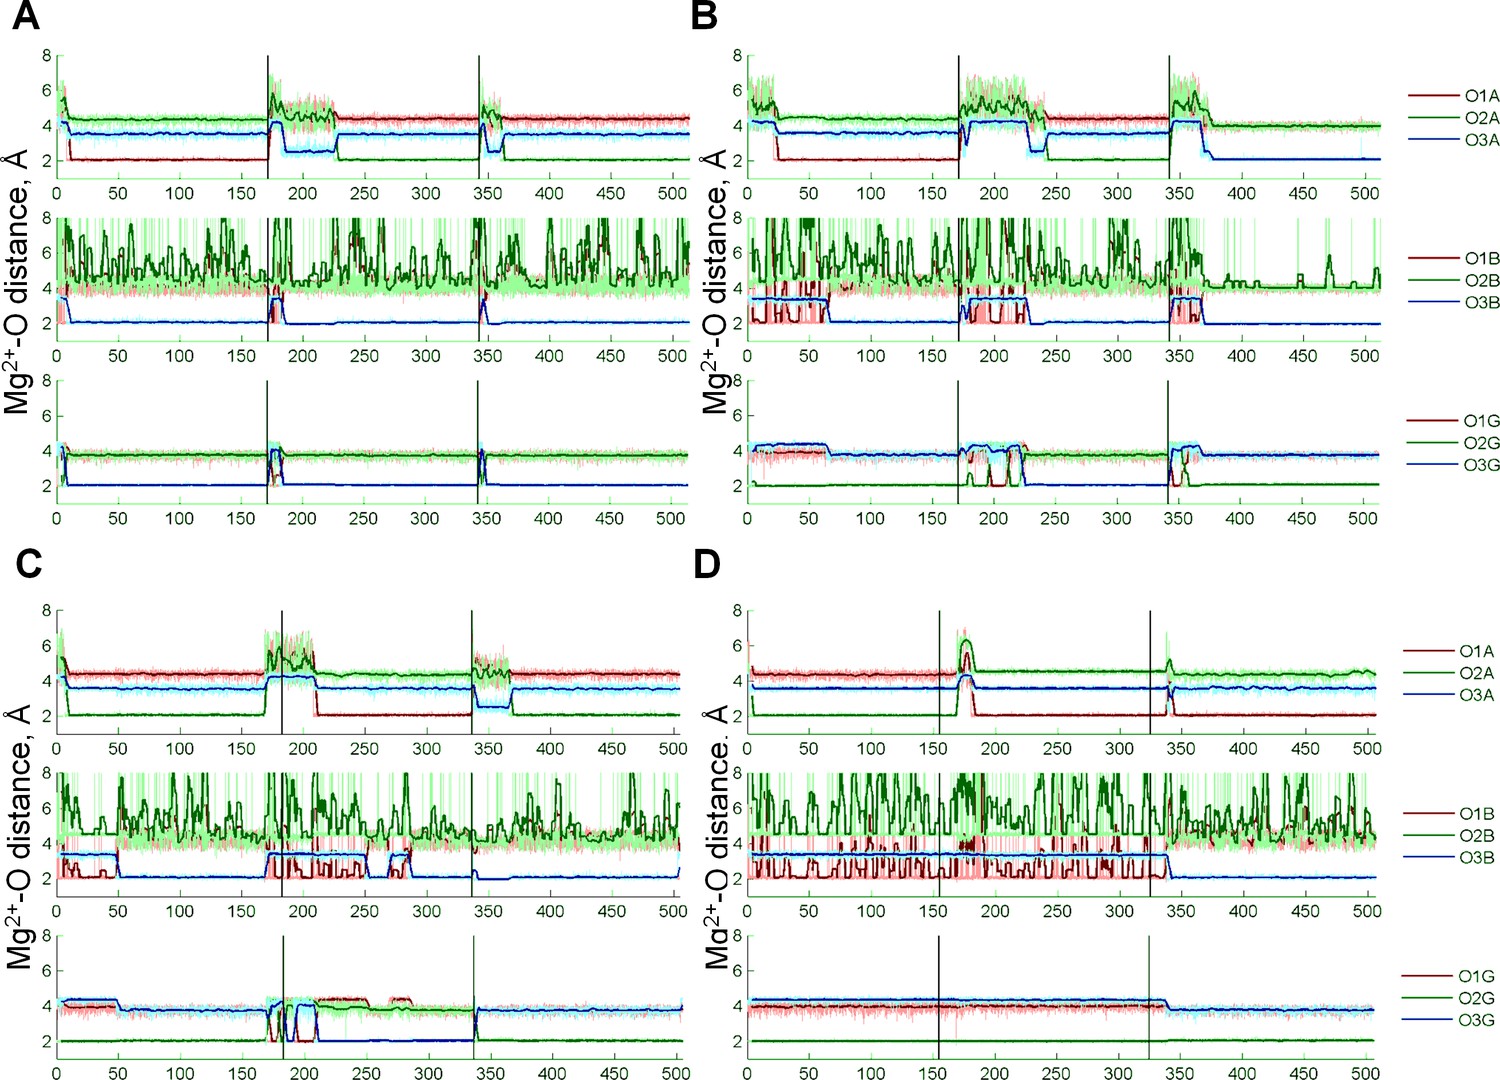
Coordination of the Mg22+ion by the oxygen atoms of the ATP phosphate chain during MD simulations.
Black vertical lines indicate borders between independent simulations, thick colored lines show moving averages of distances measured during MD simulations. Oxygen atoms are labeled as in Figure 1D. The most populated conformation in each of the four systems is characterized by the Mg2+ ion coordinated by three oxygen atoms: one of the free oxygens of the α-phosphate (O1A or O2A), O3B atom, and an oxygen atom from the γ-phosphate (O1G, O2G, or O3G). This conformation resembles the αβγ conformation of the Mg-ATP complex seen in other studies but differs in the inclusion of an ester oxygen atom in the Mg2+ coordination sphere.
Figure 4—figure supplement 2
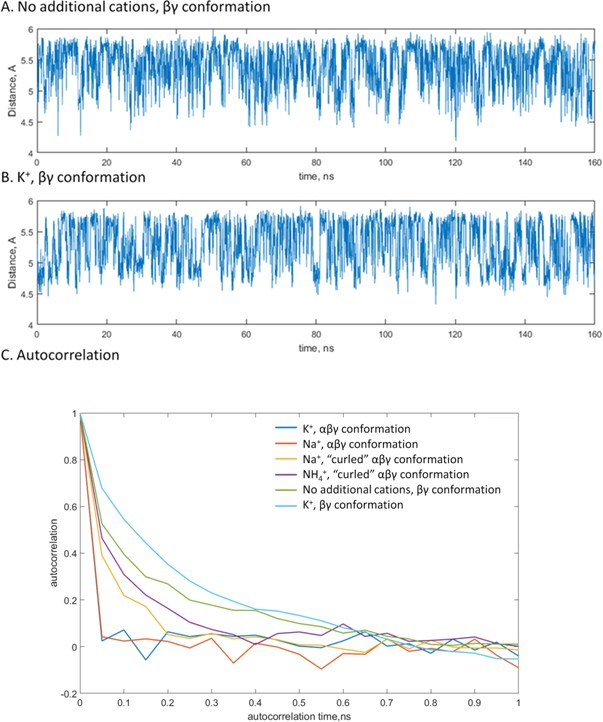
Estimation of correlation times for the PA-PG distances.
A,B, Changes of the distance value upon MD simulations of βγ-coordinated Mg-ATP complexes with no additional monovalent cations (A) and with K+ ions (B) provided as examples. (C) Autocorrelation values plotted as functions of the time lag. Based on this plot, the correlation time of 1 ns of simulation time was anticipated for the all types of interactions between the Mg2+ ion and the triphosphate chain and in the presence of all tested M+ ions.
Figure 4—figure supplement 3
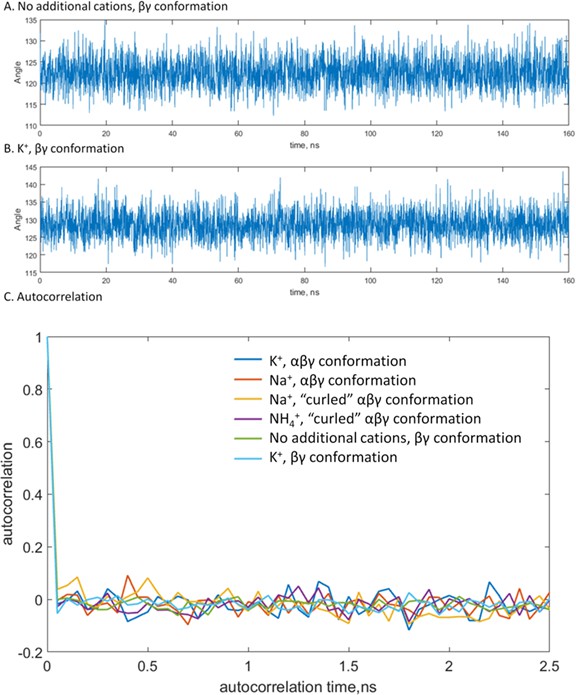
Estimation of correlation times for the PB-O-PG angles.
A, B, Changes of the angle value upon MD simulations of βγ-coordinated Mg-ATP complexes with no additional monovalent cations (A) and with K+ ions (B) provided as examples. (C) Autocorrelation values plotted as functions of the time lag. Compared to the distance measurements, the angle values oscillated on a much shorter timescale and accordingly had shorter correlation times. From this plot, the correlation time of 5 frames or 250 ps of simulation time was estimated. The general shape of the autocorrelation function was the same for all types of interactions between the Mg2+ ion and the triphosphate chain and in the presence of all tested M+ ions.
Figure 5 with 2 supplements
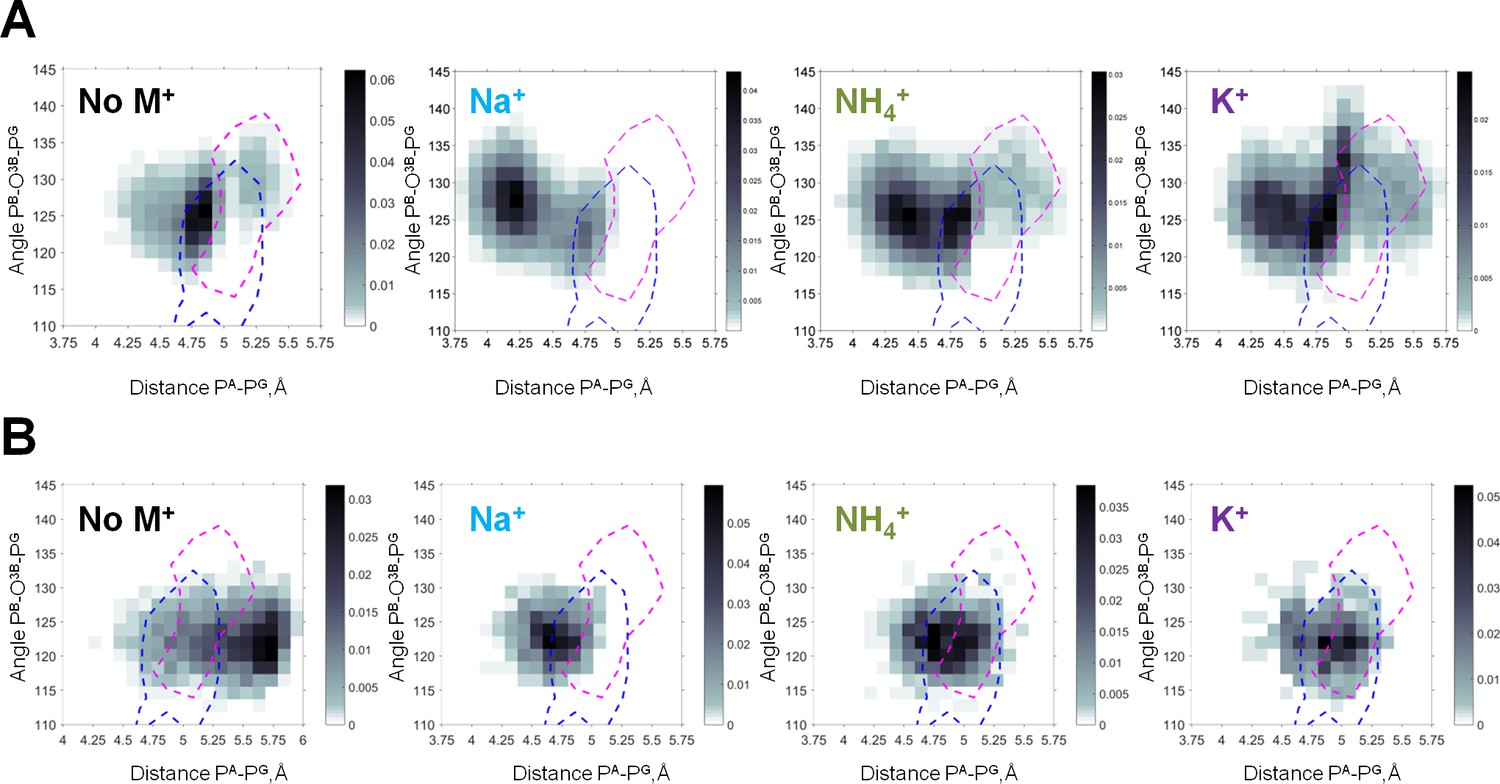
Heat maps of the Mg-ATP phosphate chain conformations distribution characterized by the PA-PG distances (X-axis) and PB-O3B-PG angles (Y-axis).
Heat maps for systems with monovalent cations include only conformations of Mg-ATP complexes with at least one cation present within 4 Å radius. The color intensity is proportional to the probability (normalized frequency) of the respective conformation. Magenta dashed lines outline the areas corresponding to the conformations of transition state analogs; blue dashed lines outline the areas corresponding to the conformations of the non-hydrolyzable analogs, calculated from crystal structures of P-loop NTPases (Figure 5—figure supplement 2). (A) Data from the 3 × 170 ns simulations (no. 1–4 in Supplementary file 1C). (B) Data from 4 × 20 ns simulations of Mg-ATP in βγ conformations (no. 5–8 in Supplementary file 1C).
Figure 5—figure supplement 1
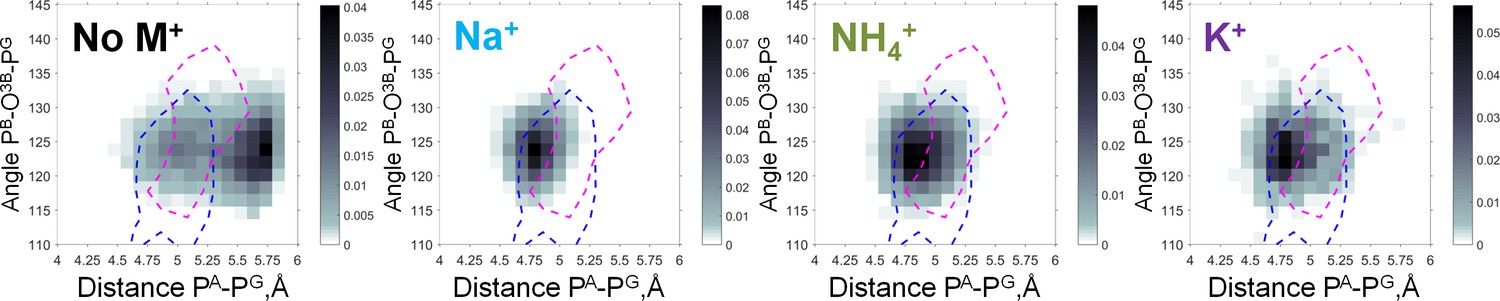
Heat maps of the Mg-GTP phosphate chain conformations distribution characterized by the PA-PG distances (X-axis) and PB-O3B-PG angles (Y-axis).
Heat maps for systems with monovalent cations include only conformations of Mg-GTP complexes with at least one cation present within 4 Å area, and with Mg2+ in βγ coordination. The color intensity is proportional to the probability (normalized frequency) of the respective conformation. Magenta dashed lines outline the areas corresponding to the conformations of transition state analogs; blue dashed lines outline the areas corresponding to the conformations of the non-hydrolyzable analogs, calculated from crystal structures of P-loop NTPases, see text.
Figure 5—figure supplement 2

Phosphate chain shape of ATP and GTP analogs in the X-ray structures of P-loop NTPases.
PDB entries for structures of P-loop NTPases were extracted from InterPro database entry IPR027417 ‘P-loop containing nucleoside triphosphate hydrolase’ and filtered to contain only those X-ray structures that contain Mg2+ ions, resulting in a list of 1,333 PDB IDs. Selected structures were analyzed with custom MATLAB scripts to select only those structures which contain either an NTP molecule, or its non-hydrolyzable analog, or a transition state analog. Additionally, we only considered NTP-like molecules bound in the proximity of at least one Lys residue (with less than 4.5 Å distance from NZ atom of Lys to any of the phosphate chain P atoms or the corresponding atoms in mimicking groups). In total, 1,357 NTP-like molecules from 670 PDB entries were used in the measurements. Isotherms for the heat map of the structure shape distribution are shown to indicate the most and least populated areas. Bold lines indicate isotherms chosen to represent crystallographic data in comparison with the MD results. (A) Shapes of ATP and GTP molecules. Native ATP and GTP molecules are most likely to be crystallized with inactive proteins, so the majority of them represent non-productive conformations of the phosphate chain. (B) Shapes of non-hydrolyzable analogs (PDB IDs: ANP, GNP, ACP, GCP, AGS, GSP). Non-hydrolyzable analogs cover lower values of the angle that is analogous to the PB-O3B-PG angle, since in such molecules, the ester oxygen between PB and PG is replaced with another atom (N in ANP, GNP; C in ACP, GCP); or one of free oxygens of γ-phosphate is replaced with S (GSP, AGS).
Figure 6 with 4 supplements
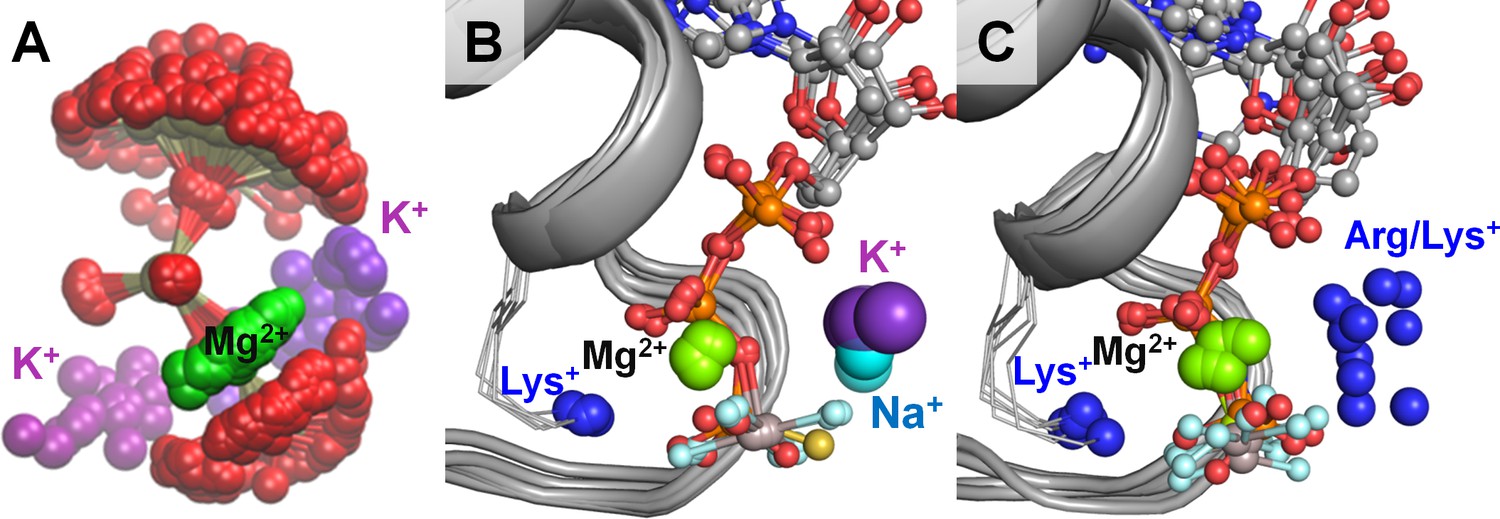
Location of positive charges around the phosphate chain of Mg-NTP complexes in solution and in protein structures.
The color scheme is as in Figure 1; dark blue spheres indicate positions of positively charged side-chain nitrogen atoms of Lys and Arg residues, P-loop regions are shown as cartoons in grey. (A) Superposition of phosphate chain conformations observed in MD simulations with K+ ions. Only conformations with βγ coordination of Mg2+ are shown. (B) Superposition of P-loop regions of crystal structures of cation-dependent P-loop NTPases: GTPase MnmE [PDB: 2GJ8], Fe transporter FeoB [PDB: 3SS8], dynamin-like protein [PDB: 2X2E], and translation factor eIF-B5 [PDB: 4TMZ], see Table 3 for details. (C) Superposition of P-loop regions of crystal structures of cation-independent P-loop NTPases: Ras/RasGAP complex [PDB: 1WQ1], septin [PDB: 3FTQ], atlastin [PDB: 4IDQ], Gα12 protein [PDB: 1ZCA], DNA polymerase III subunit τ [PDB: 3GLF], F1-ATPase [PDB: 2JDI].
Figure 6—figure supplement 1
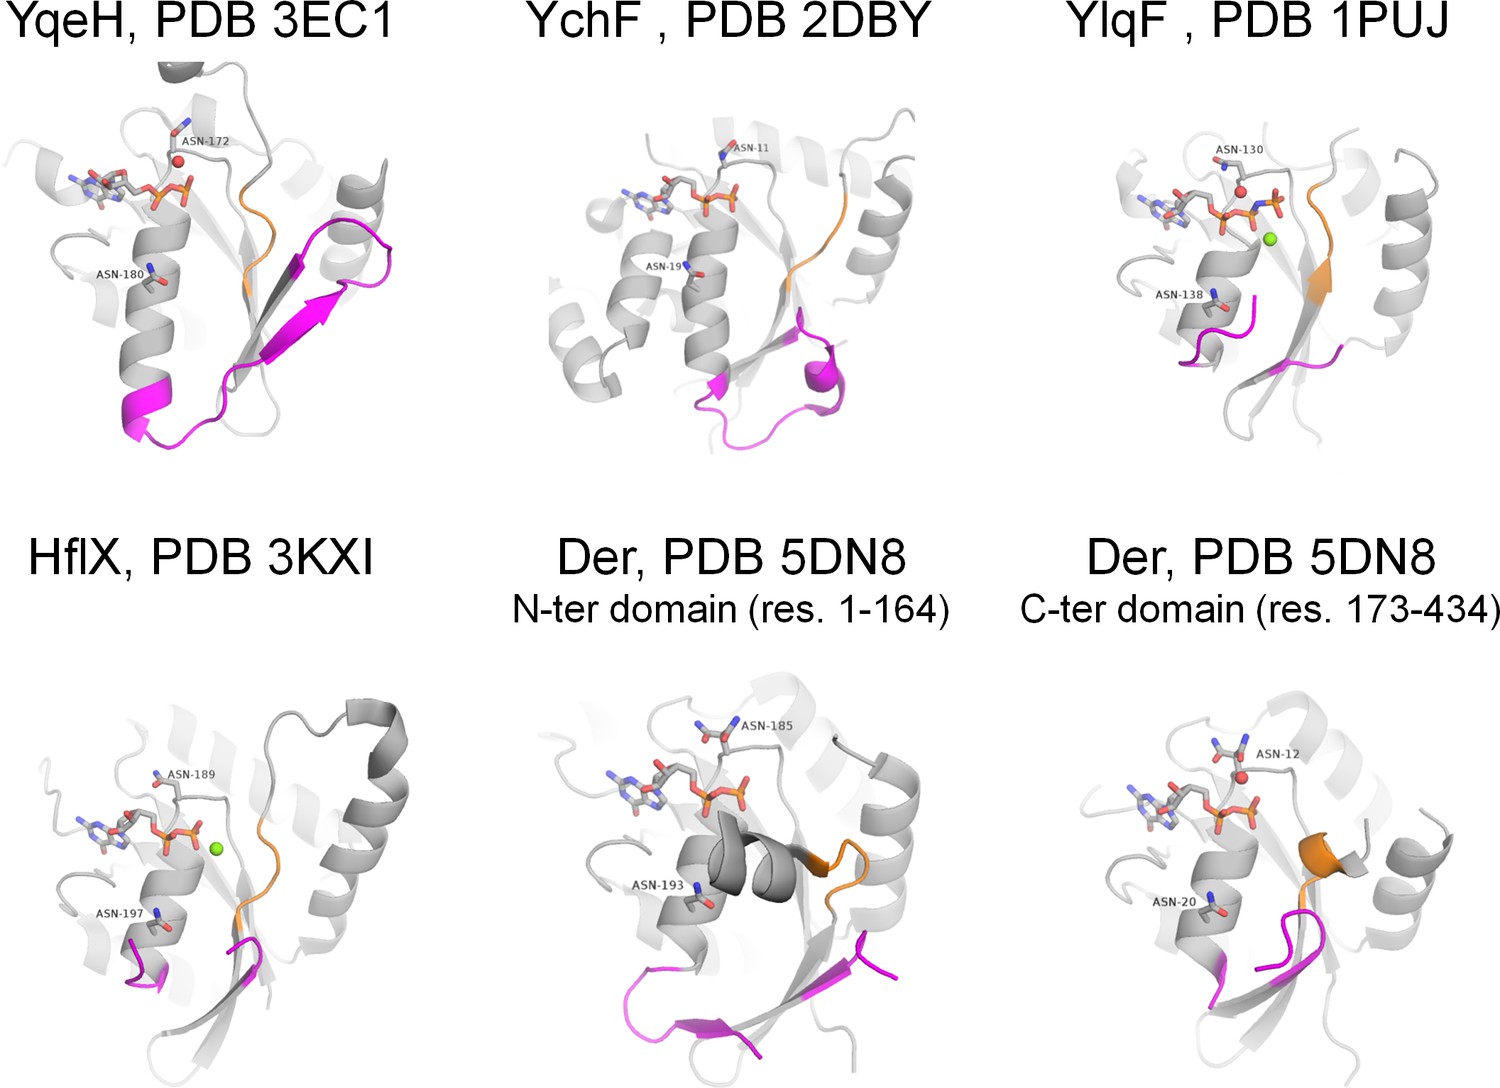
Active sites of P-loop NTPases with established K+-dependent activity (see Supplementary file 1A for the full list and references).
Each of the proteins shown has both Asn residues that were shown to be associated with binding of monovalent cations in related proteins (Ash et al., 2012). Switch I, including the K-loop, and its flanking regions are shown in magenta, switch II motif DxxG is shown in orange. NTP-like molecules are shown as sticks, Mg2+ ions are shown as green spheres, water molecules in the area of supposed cation binding are shown as red spheres.
Figure 6—figure supplement 2
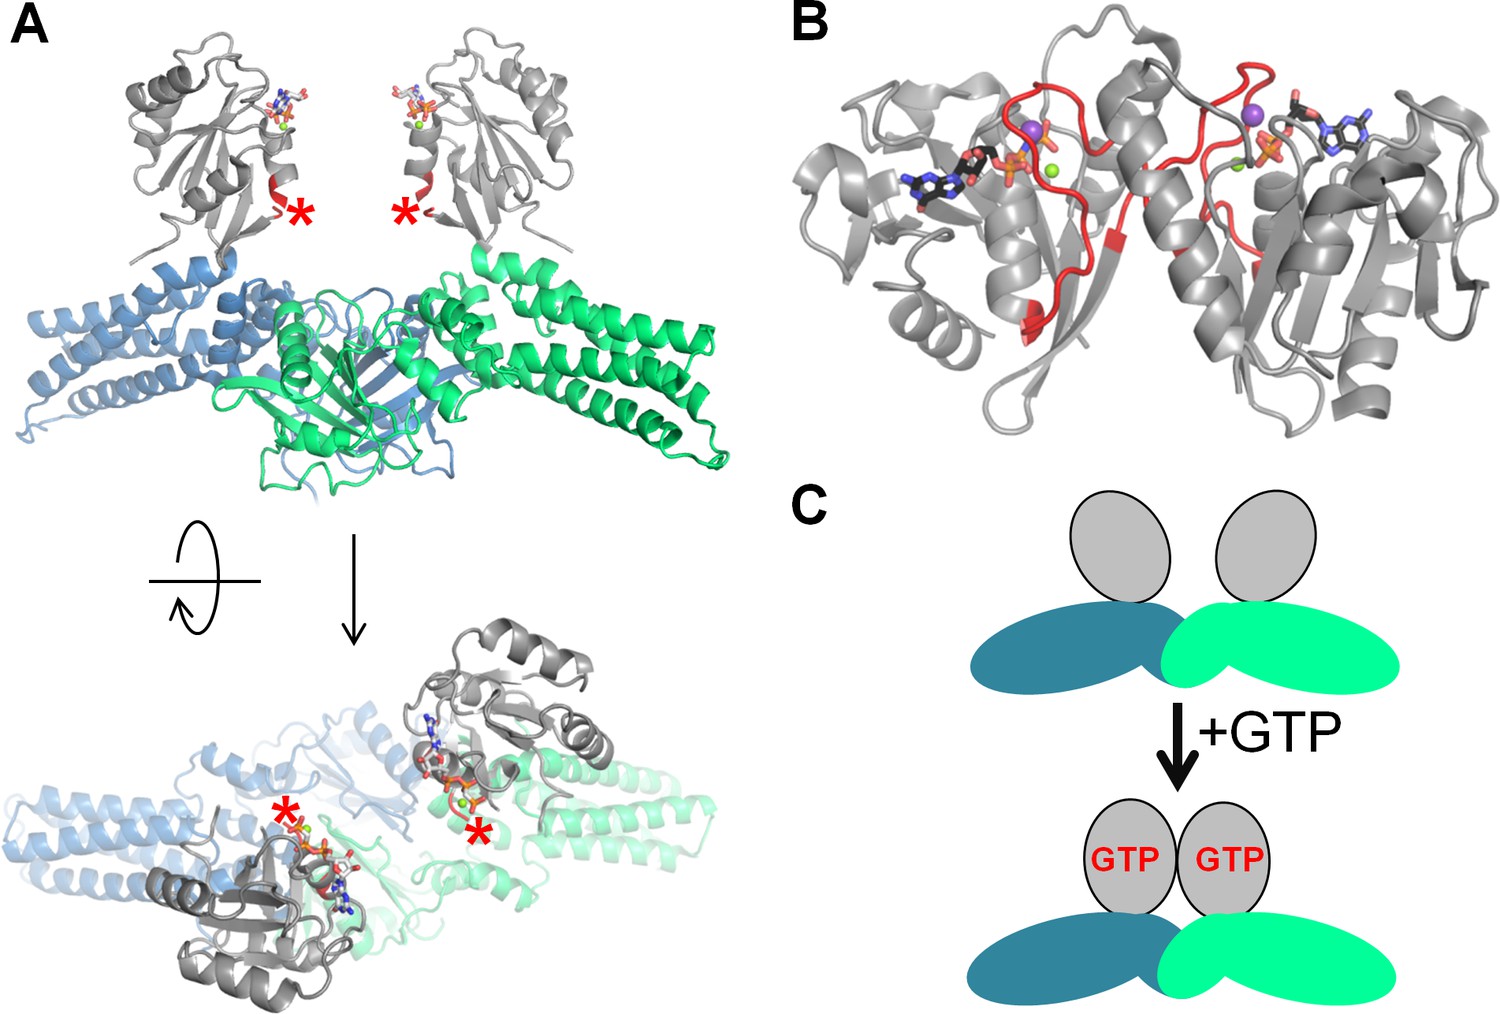
Activation of the MnmE GTPase upon dimerization.
(A) Inactive dimer of the full-length MnmE in the GTP-bound form (the structure (PDB: 3GEI) was resolved with non-hydrolyzable GTP analogs). The P-loop domain is shown in grey, the K-loop is not resolved (its position is indicated by red asterisks), the N-terminal and helical domains are shown in blue and green for different monomers. (B) An active dimer of isolated G-domains of MnmE, as resolved in complex with a transition state analog and K+ ion (PDB: 2GJ8). The K-loops are shown in red, K+ ions are shown as purple spheres. (C) Schematic representation of the conformational changes in MnmE dimers, reproduced after (Klare, 2013), domains are colored the same way as on panel A.
Figure 6—figure supplement 3
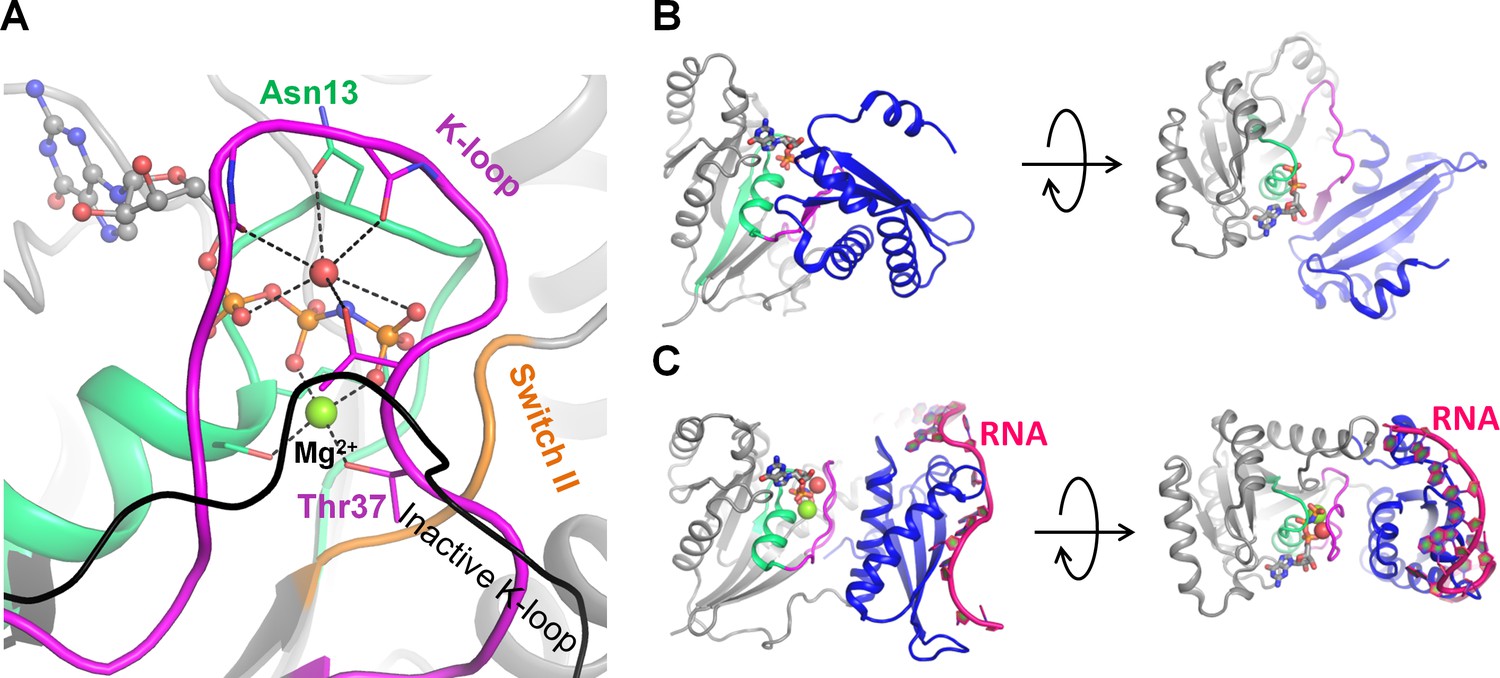
Activation of the GTPase Era upon RNA binding.
(A) Inactive Era in the GDP-bound form [PDB: 3IEU] (Tu et al., 2009) in two projections. (B) Active Era in complex with nucleotides 1506–1542 of 16S rRNA and a non-hydrolyzable analog of GTP [PDB: 3R9W] (Tu et al., 2011) in two projections. (C) Cation-binding site of active Era, occupied by a water molecule (shown as a red sphere) [PDB: 3R9W] (Tu et al., 2011). The black line indicates, for comparison, the position of the K-loop in the inactive structure [PDB: 3IEU] (Tu et al., 2009). The P-loop domain is shown in grey, the P-loop region shown in green, the K-loop region shown in magenta, nucleotide analogs are shown as sticks, Mg2+ ions are shown as green spheres.
Figure 6—figure supplement 4
Positively charged moieties in the active site of RecA-like recombinases.
(A) Cation-dependent RadA recombinase from Methanococcus voltae [PDB: 2F1H] (Qian et al., 2006). (B) Cation-independent RecA recombinase from E. coli [PDB: 3CMX] (Chen et al., 2008). The protein structure is shown as grey cartoon, the adjacent monomer is shown in blue, the P-loop region is shown in green; catalytic Glu residues are shown as orange sticks, conserved Asp residues of the Walker B motif are shown as red sticks. Functionally relevant residues from adjacent monomers are shown as blue sticks. Mg2+ ions are shown as green spheres, K+ ions as purple spheres.
Figure 7 with 2 supplements
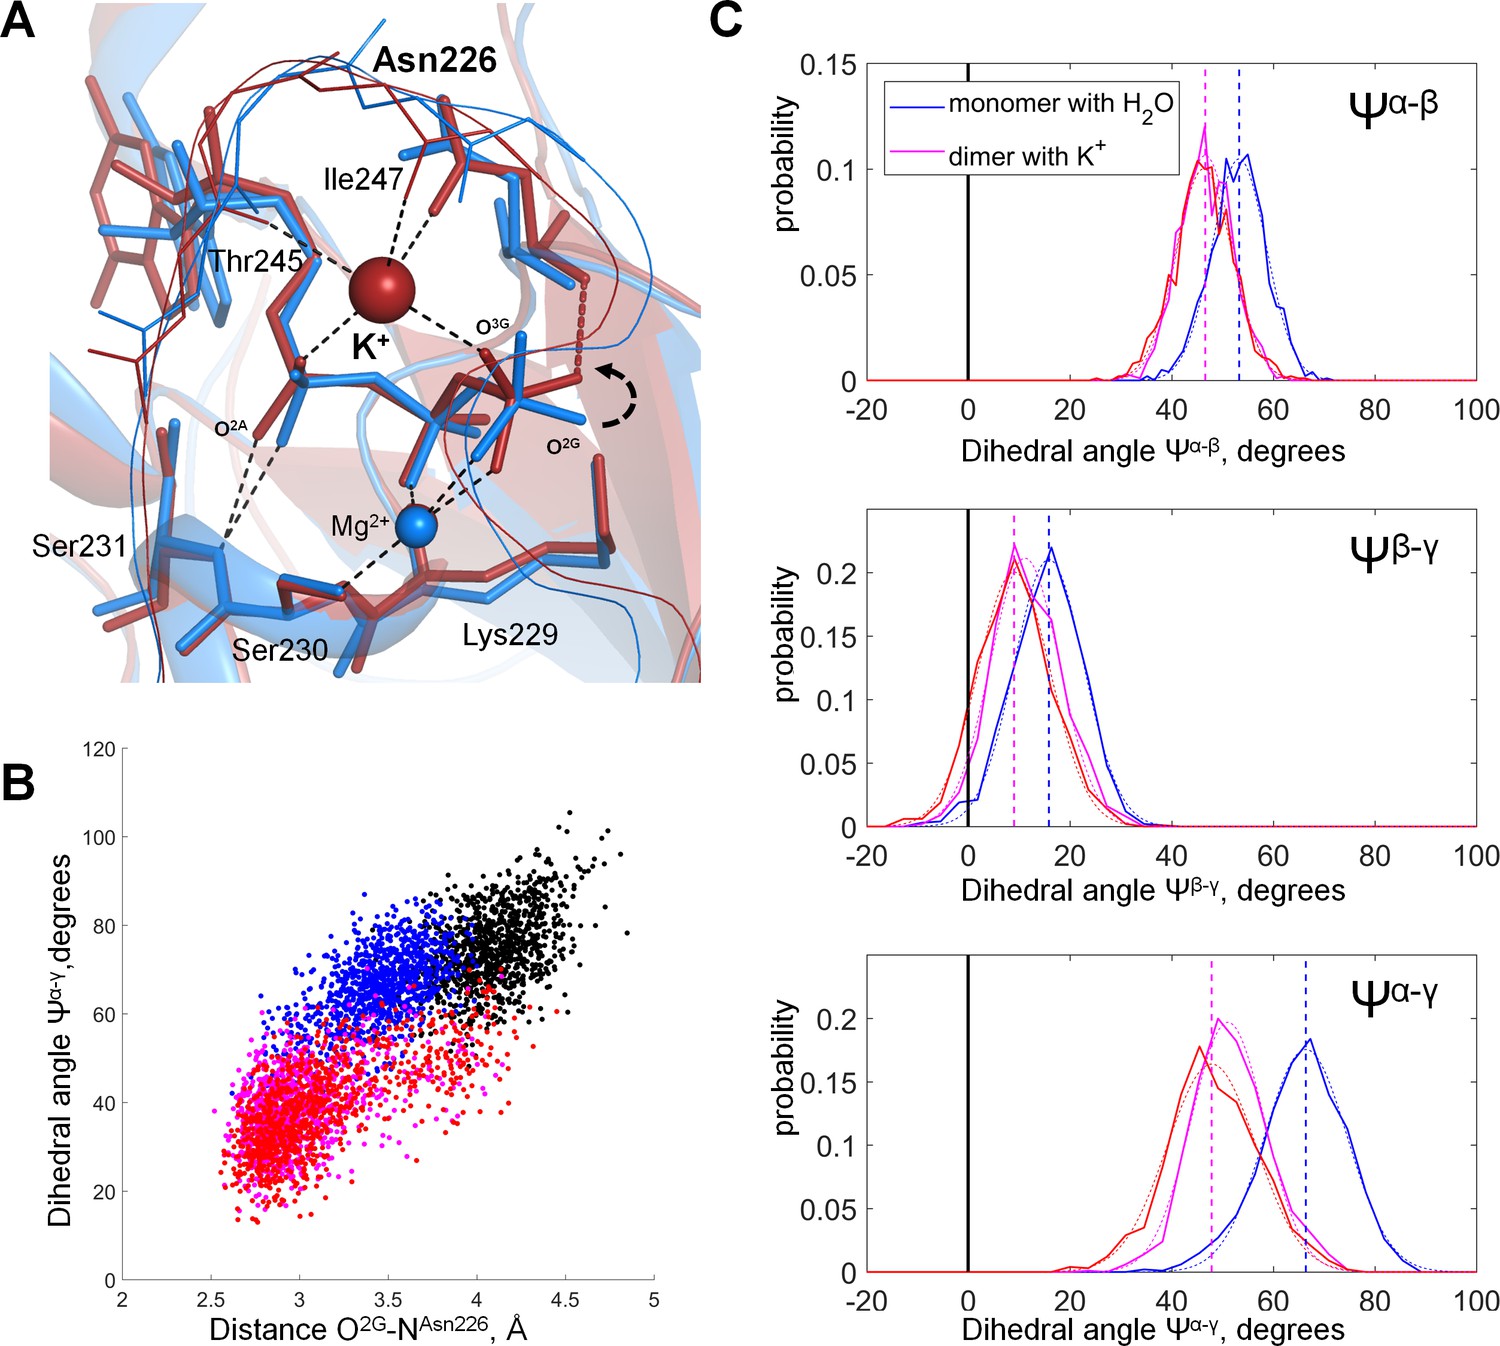
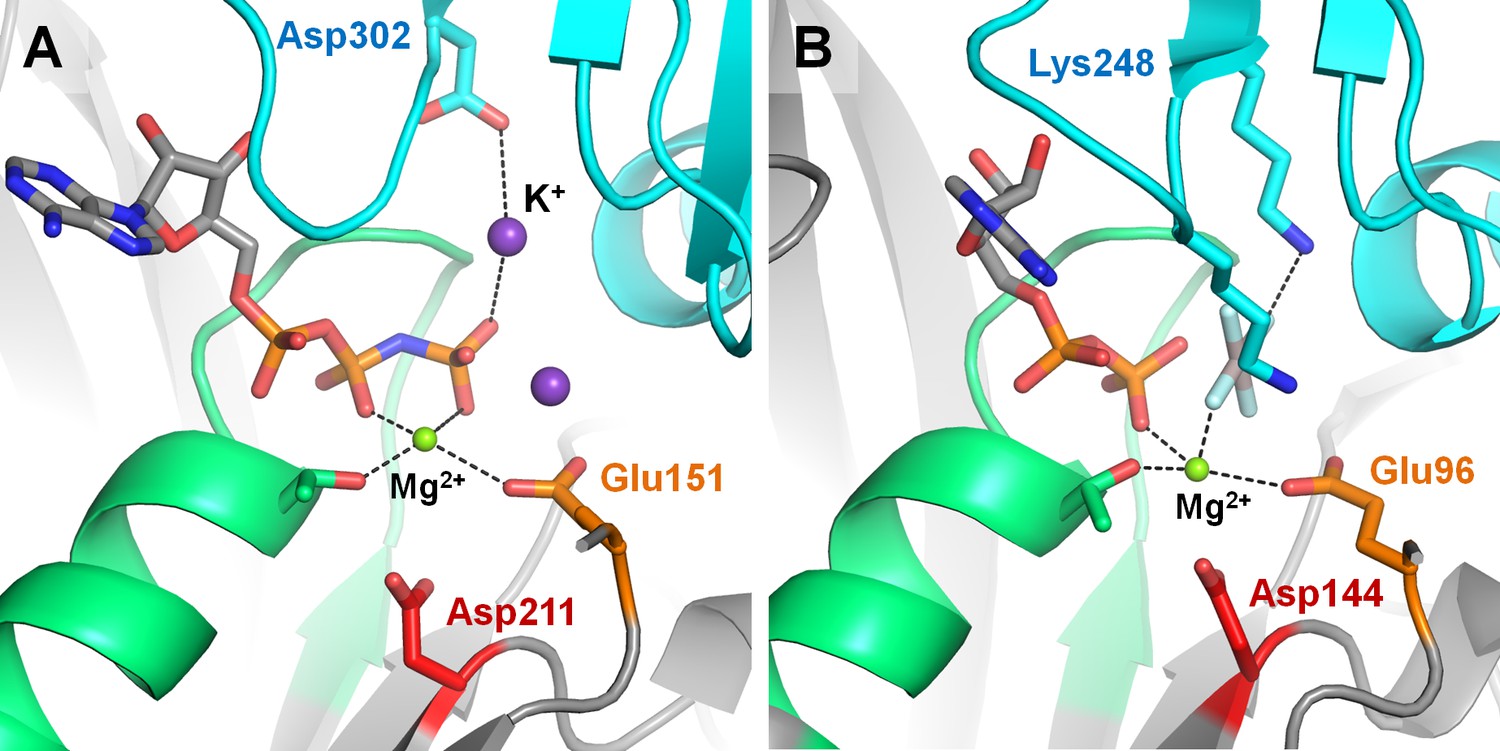
Molecular dynamics of MnmE GTPase.
(A) Superposition of the GTP-binding sites of the inactive, monomeric G-domain of MnmE (the 2GJ8W system, blue) and the active K+-bound dimer of G-domains (the 2GJ8K system, red); representative structures were sampled from the last 10 ns of 100 ns simulations. The protein backbones are shown as cartoons; GTP and surrounding amino acid residues are shown as sticks; Mg2+ and K+ ions are shown as spheres. Black dashed lines indicate hydrogen bonds and coordination bonds for cations that are present in both structures; the red dashed line indicates the H-bond that is present only in the K+-containing 2GJ8K system. (B) Conformational space of GTP in different states of MnmE GTPase. Scatter plot of the Ψα-γ dihedral angle (Y-axis) against the length of the hydrogen bond between the O2G atom and the backbone nitrogen of Asn226 (X-axis) as sampled from the MD simulations of three systems: (1) red/orange, active dimer of G-domains with K+ ions bound (the 2GJ8K system, red and orange for individual monomers); (2) blue, monomeric G-domain of MnmE with the K+ ion replaced by a water molecule (the 2GJ8W system); and (3) black, inactive monomer G-domain of MnmE without a full-fledged K-loop (the 3GEI system). (C) Distribution histograms for dihedral angles between the phosphate groups in GTP, calculated from MD simulations of the dimeric G-domain of MnmE with bound K+ ions (the 2GJ8K system, red and magenta colors represent individual monomers in the dimer) and the monomeric G-domain with the K+ ion replaced by a water molecule (the 2GJ8W system, blue). Normalized histograms of dihedral angle distribution (solid lines) were calculated from MD trajectories and fitted with normal distribution function (dotted lines). Vertical lines indicate the centroid values of the fits by Gaussian function. Black vertical lines indicate Ψ = 0°, which corresponds to the fully eclipsed conformation, while Ψ =± 60° corresponds to the fully staggered conformation.
Figure 7—figure supplement 1

Hydrogen bonds lengths during MD simulations of the G-domain of MnmE.
Distances between phosphate chain oxygen atoms and surrounding amino acid residues were measured in the course of 100-ns MD simulations. (A) inactive monomer without a full-fledged K-loop (the 3GEI system), (B) inactive, monomeric G-domain of MnmE with the K+ ion replaced by a water molecule (the 2GJ8W system), (C) active dimer of G-domains with K+ ions bound (the 2GJ8K system, the blue and black traces correspond to individual monomers in the dimer.
Figure 7—figure supplement 2
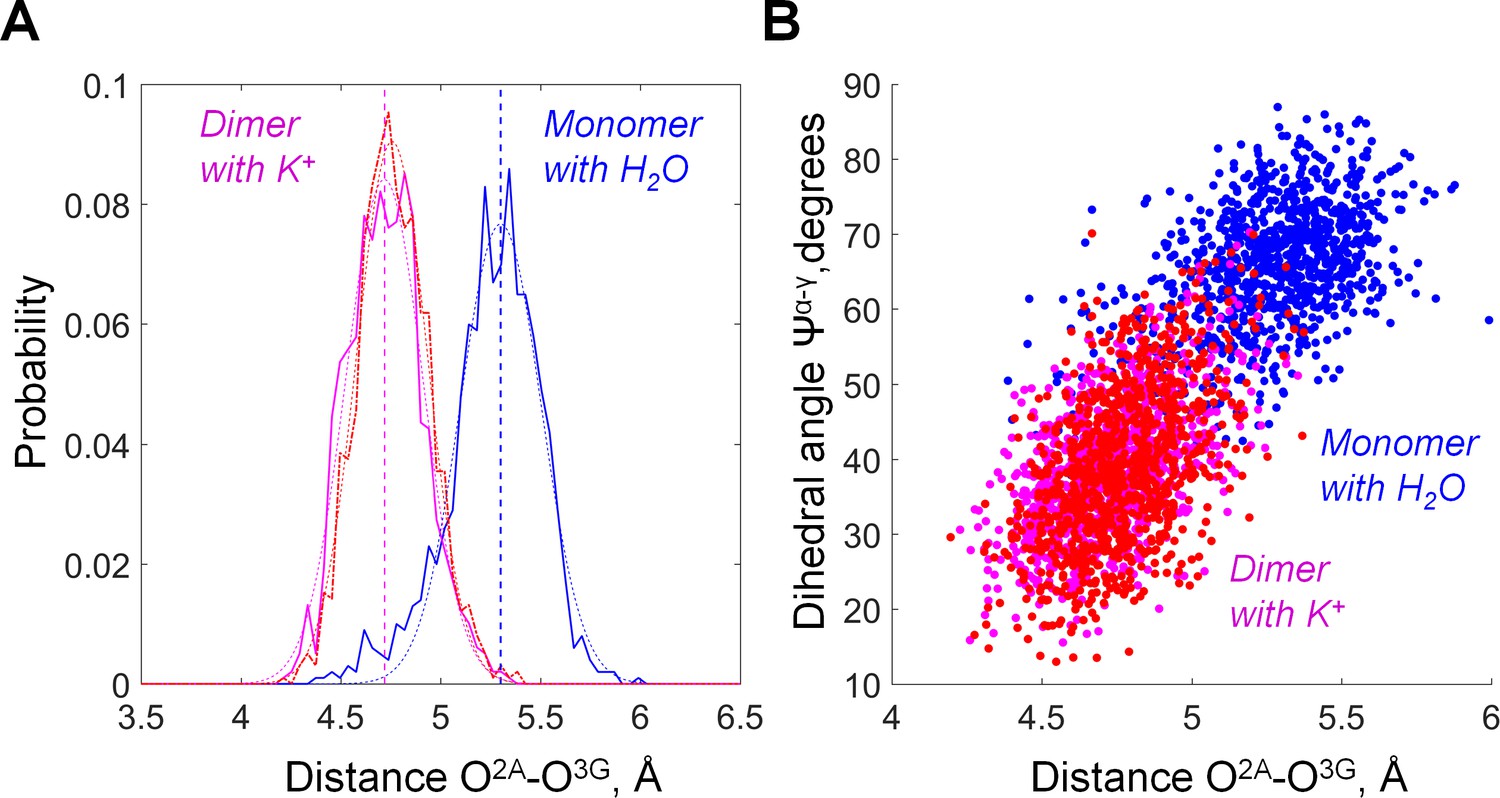
The distance between O2A and O3G in GTP bound to MnmE as inferred from MD simulations.
Plotted are data for the active dimer of G-domains with K+ ions bound (the 2GJ8K system, red and magenta for individual monomers) and inactive, monomeric G-domain of MnmE with the K+ ion replaced by a water molecule (the 2GJ8W system, blue). (A) Distribution histograms of the O2A-O3G distances. The distribution histograms were fitted with Gaussians by using MATLAB software, the fitted curves and the corresponding average values are shown as dashed lines. (B) Correlation between the O2A-O3G distance (X axis) and the value of dihedral angle Ψα-γ (Y axis). Individual conformations observed in MD simulations are plotted as dots.
Figure 8
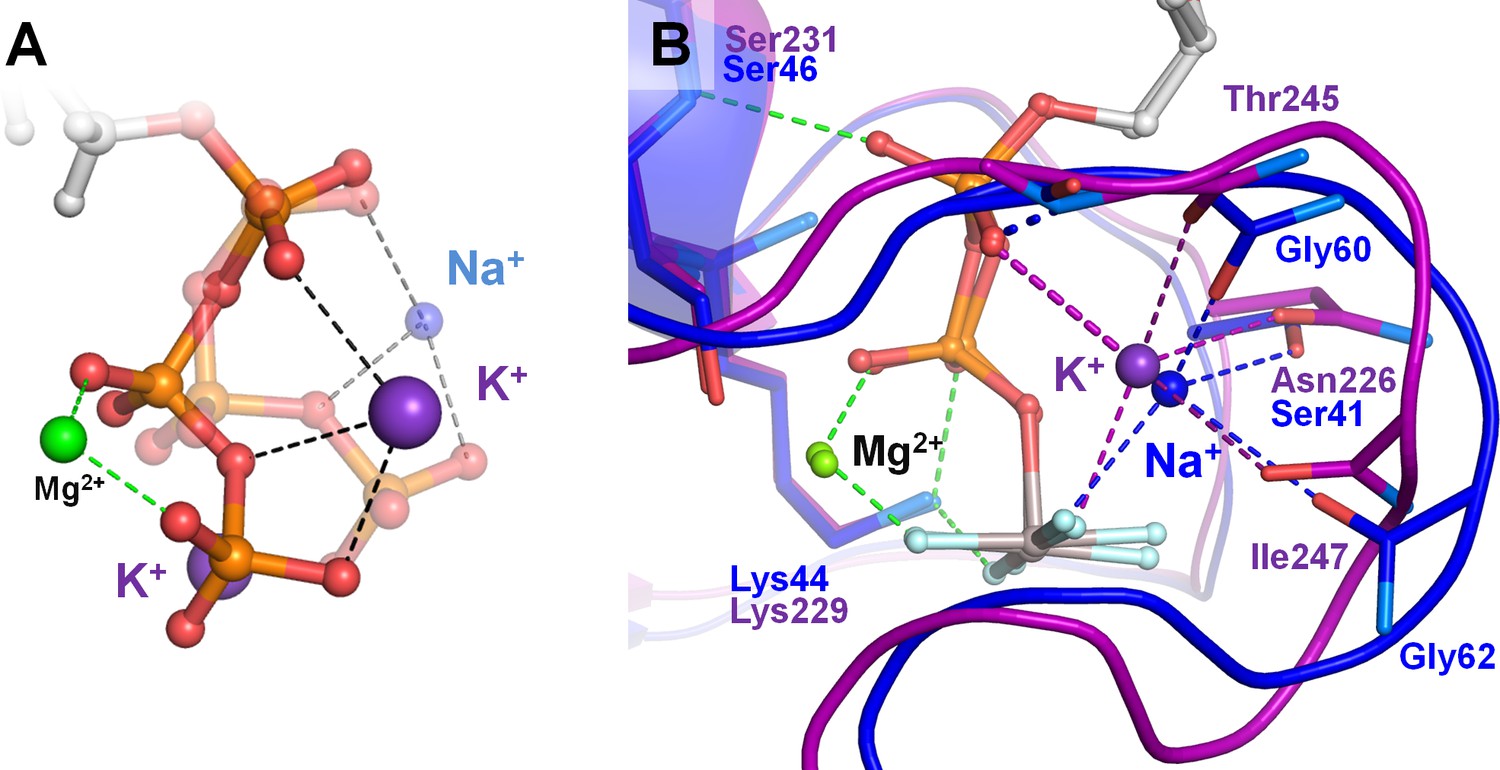
Effects of Na+ binding on the shape of phosphate chain in solution and in Na+-adapted P-loop NTPases.
The color scheme is as in Figure 1, except that Al and F atoms in the GDP-AlF4- complexes are colored grey and cyan, respectively. (A) Superposition of the K+-bound (solid structure) and Na+-bound (transparent structure) conformations of the triphosphate chain as obtained from MD simulations of an ATP molecule in water. Data from MD simulations 4–8 in Supplementary file 1C. (B) Superposition of the P-loop NTPase structures with a bound K+ ion (MnmE GTPase, PDB: 2GJ8 (Scrima and Wittinghofer, 2006), purple) and Na+ ion (dynamin, PDB: 2X2E (Chappie et al., 2010), blue). Proteins are shown as a cartoon. Dashed lines indicate hydrogen bonds and coordination bonds. Bonds that occur in all P-loop NTPases are shown in green, those that occur in K+-binding proteins are in purple, those bonds that occur in Na+-binding dynamin-like proteins are in blue. The thick dashed purple line indicates the bond between the K+ ion and the oxygen atom of α-phosphate, which is absent in dynamins. The thick dashed blue line indicates the dynamin-specific H-bond between O2A atom and the backbone amide group of the shortened K-loop.
Tables
Table 1
Effects of monovalent cations on the shape of the triphosphate chain of the Mg-ATP complex in water, as inferred from the MD simulation data.
https://doi.org/10.7554/eLife.37373.013| Added cation | Conformation of the triphosphate chain of Mg-ATP* | |||||
|---|---|---|---|---|---|---|
| βγ-coordination | βγ-coordination, ‘curled’ phosphate chain | αβγ-coordination | ||||
| PA-PG distance, Å | PB-O3B-PG angle | PA-PG distance, Å | PB-O3B-PG angle | PA-PG distance, Å | PB-O3B-PG angle | |
| None | 5.46 ± 0.34 | 122.3 ± 3.5 | N/A | 4.76 ± 0.18 | 124.9 ± 3.3 | |
| K+ | 4.91 ± 0.24 | 122.0 ± 3.3 | N/A | 4.32 ± 0.24 | 128.0 ± 3.5 | |
| Na+ | 4.69 ± 0.22 | 122.9 ± 3.2 | 4.60 ± 0.22 | 124.0 ± 3.3 | 4.26 ± 0.37 | 127.7 ± 3.6 |
| NH4+ | 4.85 ± 0.22 | 122.3 ± 3.3 | 4.56 ± 0.21 | 124.6 ± 3.3 | 4.22 ± 0.16 | 127.8 ± 3. |
-
*The conformations of the Mg-ATP complex were determined as described in the text. Mean values and standard deviations of PA-PG distance (in Å) and the PB-O3B-PG angle (in degrees) were measured over the respective parts of the simulations. Simulation periods corresponding to βγ and αβγ conformations were identified by tracking distances between Mg2+ and non-bridging oxygen atoms of the phosphate chain (Figure 4—figure supplement 1); simulation periods corresponding to the ‘curled’ conformation were identified from PA-PG distance tracks and visual inspection of the phosphate chain shape (Figure 4). Data for the αβγ coordination of the Mg-ATP complex and conformations with curled phosphate chain were calculated from simulations 1–4 in Supplementary file 1C; characterization of the βγ-coordination was based on simulations 5–8 in Supplementary file 1C, see Supplementary file 1E for further details.
Table 2
Activation mechanisms within the classes of P-loop NTPases that contain both cation-dependent and cation-independent enzymes.
https://doi.org/10.7554/eLife.37373.022| Superfamily | Family | Activating charge | Activation mechanism |
|---|---|---|---|
| Kinase-GTPase division, TRAFAC class | |||
| Classic translation factor GTPases | EF-G/EF-2 | K+ | Functional interaction with ribosomal RNA/other protein(s)/other domain(s) of the same protein (Hwang and Inouye, 2001;Moreau et al., 2008; Tomar et al., 2011; Achila et al., 2012;Fasano et al., 1982; Ebel et al., 1992; Dubnoff and Maitra, 1972;Kuhle and Ficner, 2014; Manikas et al., 2016; Daigle and Brown, 2004; Foucher et al., 2012;Rafay et al., 2012; Pérez-Arellano et al., 2013; Villarroya et al., 2008) |
| EF-Tu/EF-1A | K+ | ||
| EIF2G | K+ | ||
| ERF3 | K+ | ||
| IF-2 | K+ | ||
| LepA | K+ | ||
| OBG-HflX-like GTPases | HflX | K+ | |
| OBG | K+ | ||
| NOG | K+ | ||
| YchF/OLA1 | K+ | ||
| YlqF/YawG GTPases | NOG2 | K+ | |
| RsgA | K+ | ||
| TrmE-Era-EngA-EngB-Septin-like GTPases | EngA (Der) | K+ | |
| EngB | K+ | ||
| Era | K+ | ||
| FeoB | K+ | Dimerization (e.g. mRNA-associated in the case of MnmE) (Chappie et al., 2010; Koenig et al., 2008; Gasper et al., 2009) | |
| MnmE | K+ | ||
| Septin | Arg finger | ||
| Toc34-like | Arg finger | ||
| Dynamin-like GTPases | hGBP | Arg finger | |
| Dynamin | K+/Na+ | ||
| Extended Ras | Ras family | Arg finger | Interaction with a specialized activating protein or domain(Bos et al., 2007; Cherfils and Zeghouf, 2013) |
| Gα subunits | Arg finger | ||
| Myosin/kinesin | Myosin | Arg finger | |
| Kinesin | Arg finger | ||
| ASCE division, RecA/F1-like class | |||
| DNA-repair and recombination ATPases | RecA | Lys finger | DNA/RNA-dependent oligomerization(Chen et al., 2008) |
| RadA | K+ | ||
| Rho helicases | Rho | Arg finger | Interaction with the neighboring subunit within a conformationally coupled hexamer (Komoriya et al., 2012; Walker, 1998;Senior et al., 2002; Skordalakes and Berger, 2006) |
| T3SS ATPases | YscN | Arg finger | |
| Flil | Arg finger | ||
| F-/V-type ATPases | V-type A | Arg finger | |
| F-type β | |||
| V-type B | |||
| F-type α | |||
Table 3
Monovalent cation binding in crystal structures of P-loop NTPases.
https://doi.org/10.7554/eLife.37373.023| Protein | PDB entry | Bound NTP analog | Occupation of the AG site | Phosphate chain shape | |||
|---|---|---|---|---|---|---|---|
| Cation | Distance to the closest O atom of PA, Å* | Distance to the closest O atom of PG, Å*,† | PA-PG distance, Å* | PB-O3B-PG angle, degrees† | |||
| TRAFAC class NTPases | |||||||
| GTPase MnmE(TrmE) | 2gj8 | GDP AlF4- | K+ | 2.8 | 2.6 | 5.4 | 136.3 |
| 2gja | GDP AlF4- | NH4+ | 2.9 | 2.5 | 5.4 | 136.9 | |
| 2gj9 | GDP AlF4- | Rb+ | 2.9 | 2.8 | 5.5 | 131.6 | |
| GTPase FeoB | 3ss8 | GDP AlF4- | K+ | 2.8 | 2.6 | 5.4 | 144.9 |
| Dynamin-like proteins | 2x2e | GDP AlF4- | Na+ | 4.0 | 2.5 | 5.3 | 131.2 |
| 2x2f | GDP AlF4- | Na+ | 4.1 | 2.6 | 5.3 | 133.6 | |
| 3w6p | GDP AlF4- | Na+ | 4 | 2.4 | 5.5 | 135.3 | |
| 3t34 | GDP AlF4- | Na+ | 3.8 | 2.4 | 5.6 | 149.3 | |
| GTPase Era | 3r9w | GNP | H2O‡ | 3 | 3.4 | 5.1 | 129.2 |
| Eukaryotic translation initiation factor eIF5B | 4ncn | GTP | Na+ | 2.4 | 2.4 | 5.0 | 126.6 |
| 4tmv | GSP | Na+ | 2.4 | 2.8 (S)§ | 4.9 | 126.3 | |
| 4tmw | GTP | Na+ | 2.4 | 2.4 | 4.9 | 125.9 | |
| 4tmz | GSP | K+ | 2.7 | 3.3 (S)§ | 4.9 | 122.1 | |
| RecA/F1-like class NTPases | |||||||
| DNA recombinase RadA | 3ew9 | ANP | K+ | 6.2 | 3.3 | 5.1 | 124.5 |
| 2f1h | ANP | K+ | 6.6 | 3.5 | 5.3 | 125.3 | |
| 2fpm | ANP | K+ | 5.9 | 2.6 | 5.1 | 124.2 | |
| 1xu4 | ANP | K+ | 6.1 | 2.7 | 5.2 | 125.0 | |
-
*The values were measured directly in the respective protein structures displayed in PyMOL.
† If the γ-phosphate was replaced by an AlF4- complex, the distance was measured to the closest F atom
-
‡ While GTPase Era has been shown to be K+-dependent (Rafay et al., 2012; Meier et al., 2000), the crystallization solution contained no K+, only Na+, so that the likely cation-binding site is occupied by a water molecule, which forms hydrogen bonds with K+ ligands.
§ Non-hydrolyzable GTP analog GDP-monothiophosphate (GSP) contains a sulfur atom in the place of the O1G atom of γ-phosphate; this atom in involved in coordination of monovalent cations in respective structures.
Additional files
-
Supplementary file 1
(A) Monovalent cation requirements of P-loop GTPases and ATPases. (B) Properties of monovalent cations and their interactions with the Mg2+-ATP complex. (C) Molecular dynamics simulations performed in this work. (D) Values of dihedral angles of the phosphate chains of Mg-ATP in the presence of K+ ions. (E) Lifetimes of the βγ-conformation of Mg-ATP complex during MD simulations. (F) Characteristics of the triphosphate chain for different interactions between the Mg2+ ion and ATP. (G) Comparison of the PA-PG distance measurements of the βγ-coordinated Mg-ATP complexes. (H) Comparison of the PA-PG distance measurements of the αβγ-coordinated Mg-ATP complexes. (I) Comparison of the PA-PG distance measurements for the αβγ-coordinated and ‘curled’ βγ-coordinated Mg-ATP complexes in different systems. (J) Comparison of the PB-O3B-PG angle measurements for the βγ-coordinated Mg-ATP complexes. (K) Comparison of the PB-O3B-PG angle measurements for the αβγ-coordinated Mg-ATP complexes. (L) Comparison of the PA-PG distance measurements for the αβγ-coordinated and ‘curled’ βγ-coordinated Mg-ATP complexes.
- https://doi.org/10.7554/eLife.37373.028
-
Transparent reporting form
- https://doi.org/10.7554/eLife.37373.029
Download links
A two-part list of links to download the article, or parts of the article, in various formats.
Downloads (link to download the article as PDF)
Open citations (links to open the citations from this article in various online reference manager services)
Cite this article (links to download the citations from this article in formats compatible with various reference manager tools)
Evolution of cation binding in the active sites of P-loop nucleoside triphosphatases in relation to the basic catalytic mechanism
eLife 7:e37373.
https://doi.org/10.7554/eLife.37373


