Cerebellar implementation of movement sequences through feedback
- The University of Texas at Austin, United States
Figures
Figure 1
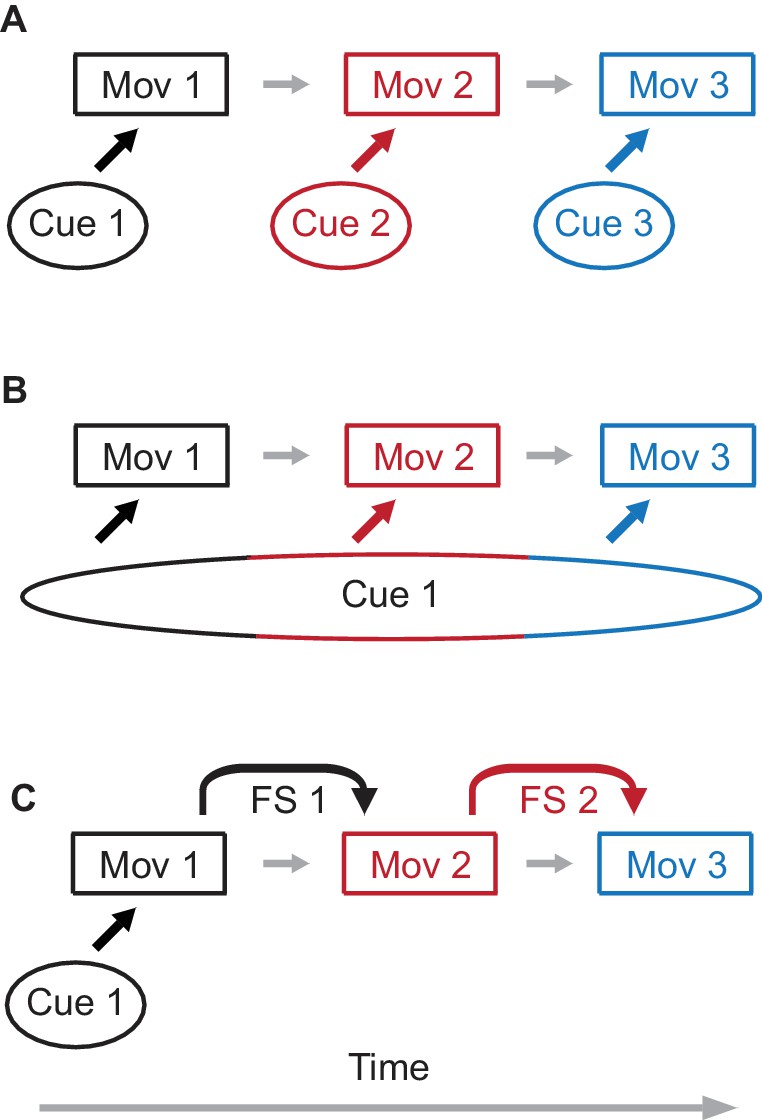
Possible mechanisms of sequence learning.
(A) A sequence of three movement components is learned through association of each movement component with a separate external cue. (B) A single cue is present, but the duration of the cue persists through all three components of the sequence. In this case, different time epochs of the cue serve as effective separate cues from panel (A). (C) Only the first movement component is learned from the external cue. For the following movement components, feedback signals (FS) from a preceding movement are used to learn the next movement component, assembling the sequence of movements.
Figure 2 with 1 supplement
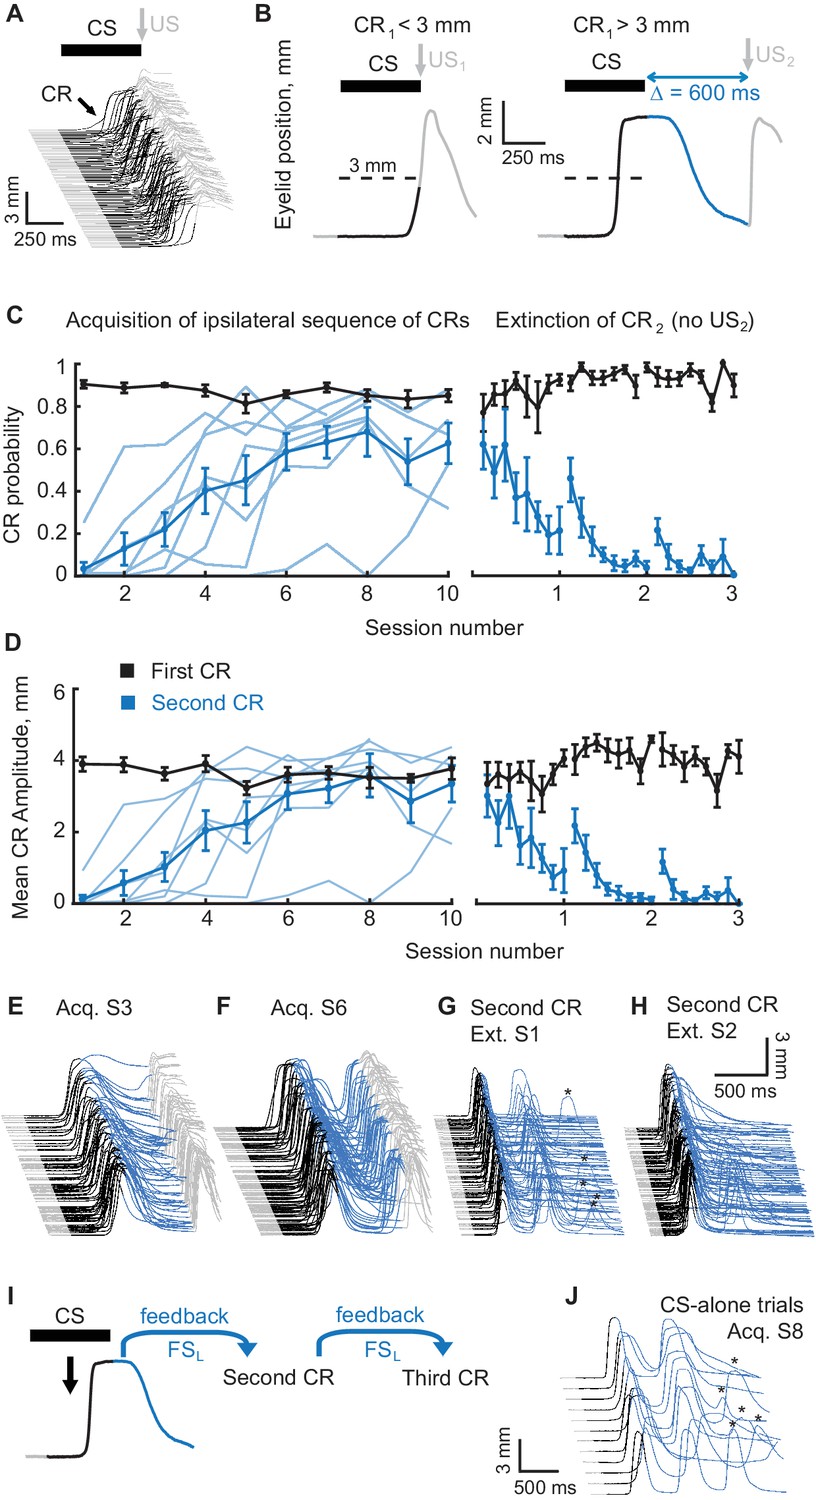
Acquisition and extinction of an ipsilateral sequence of CRs.
(A) The waterfall plot shows eyelid position as a function of time on each trial with trials from one training session arranged chronologically from bottom to top. Upward deflection indicates closure of the eyelid. The black portion of each trace indicates the CS duration. Predictive eyelid closures beginning during the CS and before the US are cerebellar-driven conditioned responses. Reflexive (unconditioned) eyelid responses occurring after the US are not mediated by the cerebellum (light grey portion of traces). (B) A schematic representation of the ipsilateral sequence training protocol. Left panel shows an example trial with first CR amplitude smaller than the 3 mm target (dotted line). In these instances the US1 is delivered. Right panel shows a trial with first CR amplitude larger than 3 mm. In these instances the US1 is omitted and the US2 is delivered. As before, the duration of the mossy fiber stimulation CS is shown in black, the interval between CS offset and the US2 is shown in blue, grey portions of the sweep are the pre-CS and post US2 periods. (C) CR probability as a function of session number. Left panel shows acquisition curves of second CR in ipsilateral sequences. The probability of first CRs is shown in black, the probability of second CRs in blue. Thin lines represent individual subjects, whereas thick lines show group averages. The right panel shows data from three sessions of second CR extinction. Data in extinction sessions was broken down into eight equal portions to evaluate the time course of extinction through the session. (D) Same as (C), but for average amplitude of CRs in ipsilateral sequence training. (E–H) Example raw data from acquisition and extinction sessions of ipsilateral sequence of CRs. In all cases only trials with first CR amplitude larger than 3 mm are shown. (I) Schematic of rationale why subjects trained at ipsilateral sequence of CRs should produce a third CR on CS-alone trials without it being explicitly reinforced during training. (J) Example CS-alone trials from late acquisition session. The third CRs in a sequence are indicated by asterisks above.
-
Figure 2—source data 1
Behavioral data during acquisition of ipsilateral sequence of CRs.
- https://doi.org/10.7554/eLife.37443.006
Figure 2—figure supplement 1
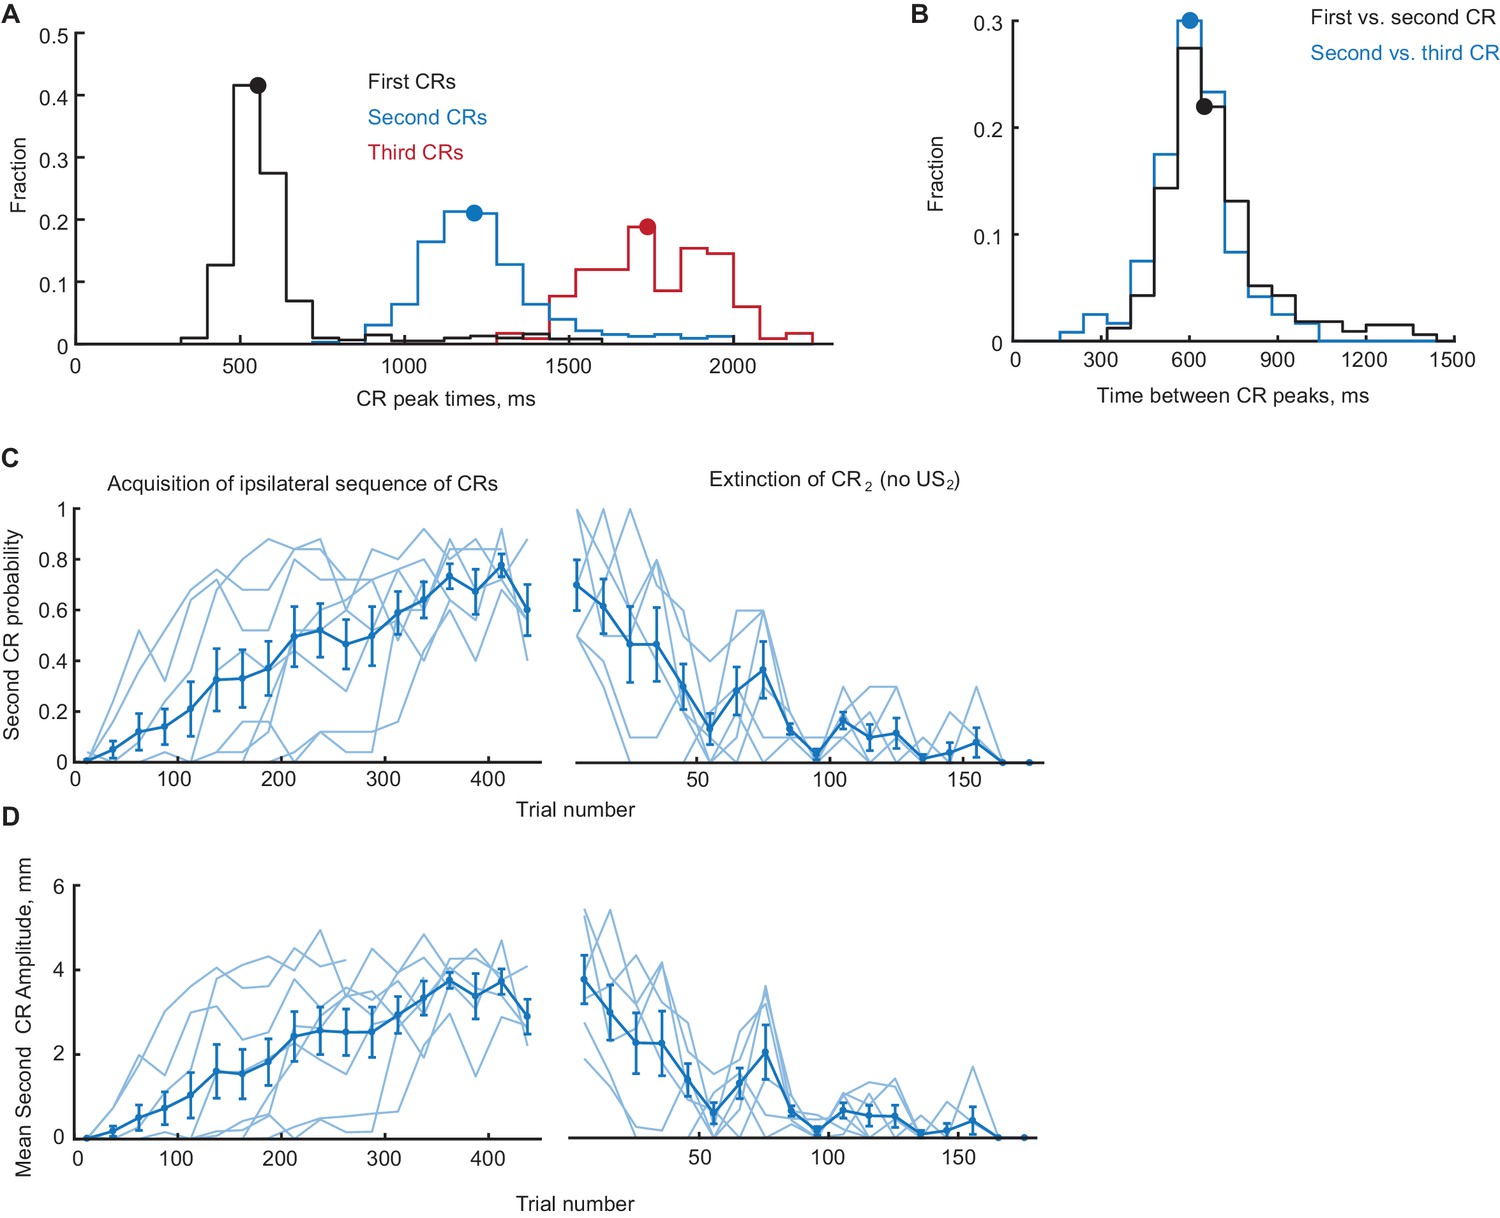
Timing, acquisition and extinction of CRs in ipsilateral sequence training.
(A) Distribution of peak times (from CS onset) of ipsilateral CRs on sessions with robust second CR performance (second CR probability >0.4). Distributions of peak times of first, second and third CRs are shown in black, blue and red color, respectively. Median peak times are indicated by correspondingly colored dots on distributions. (B) Distributions of inter-peak times between first versus second CRs (black line) and second versus third CRs (blue line). Median inter-peak times are indicated by dots. (C) Second CR probability as a function of trial number, concatenated across several sessions. Only trials with first CR amplitude larger than 3 mm were used. Thin lines represent individual subjects, whereas thick line shows group average. Left panel shows acquisition curves of second CR in ipsilateral sequence, right panel shows data from three sessions of second CR extinction. (D) Same as (C), but for average amplitude of second CRs in ipsilateral sequence training.
Figure 3 with 1 supplement
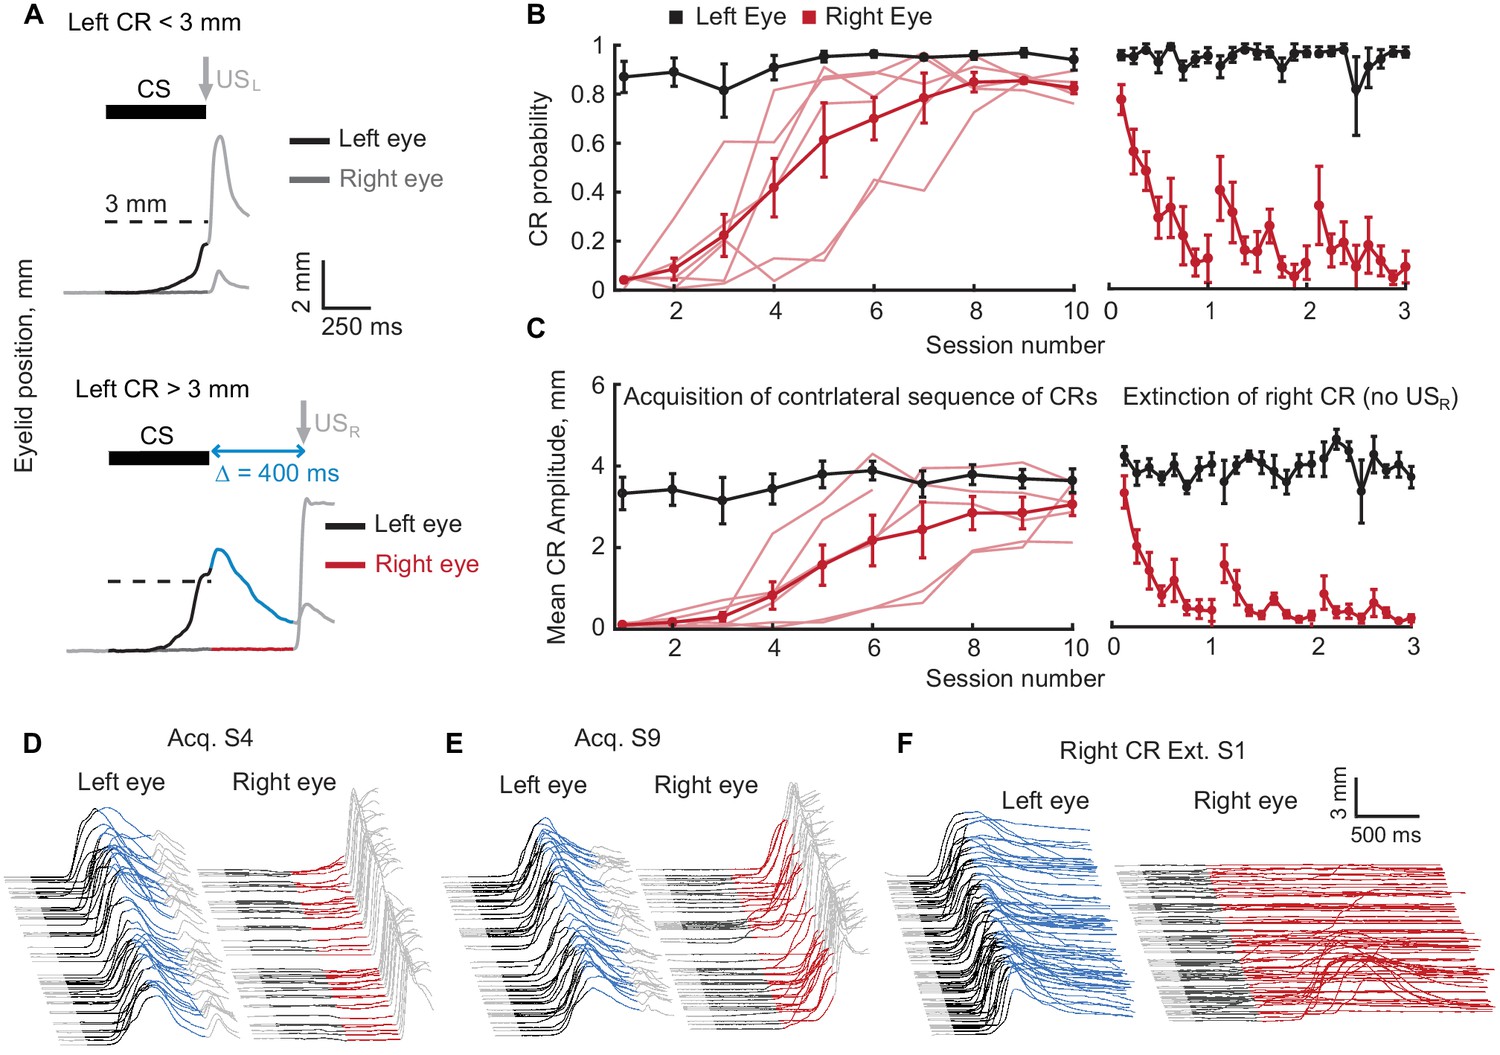
Acquisition and extinction of contralateral sequences of CRs.
(A) A schematic representation of the contralateral sequence training protocol. Top panel shows an example trial with left eye CR amplitude smaller than target 3 mm value (dotted line) and where USL is delivered to the left eye. The bottom panel shows a trial with left CR amplitude larger than 3 mm. In these instances, USL is omitted and USR is delivered to the right eye. Color-coding of left eyelid position is the same as in Figure 1. For right eyelid position CS duration is indicated by a dark grey color, the interval between CS offset and USR is shown in red. (B) CR probability as a function of session number. Left panel shows acquisition curves of right eye CR in contralateral sequence. Probability of left eye CR is shown in black, right eye CR – in red. Thin lines represent individual subjects, thick lines – group averages. Right panel shows data from three sessions of right eye CR extinction. Data in each session were broken down into eight equal portions to evaluate the time profile of extinction through the session. (C) Same as (B), but for average amplitude of CRs in ipsilateral sequence. (D–F) Examples of acquisition and extinction sessions of contralateral sequence of CRs. For each session left eye responses are shown on the left, right eye responses – on the right. In all cases only trials with left eye CR amplitude larger than 3 mm are shown.
-
Figure 3—source data 1
Behavioral data during acquisition of contralateral sequence of CRs.
- https://doi.org/10.7554/eLife.37443.009
Figure 3—figure supplement 1
Timing, acquisition and extinction of CRs in contralateral sequence training.
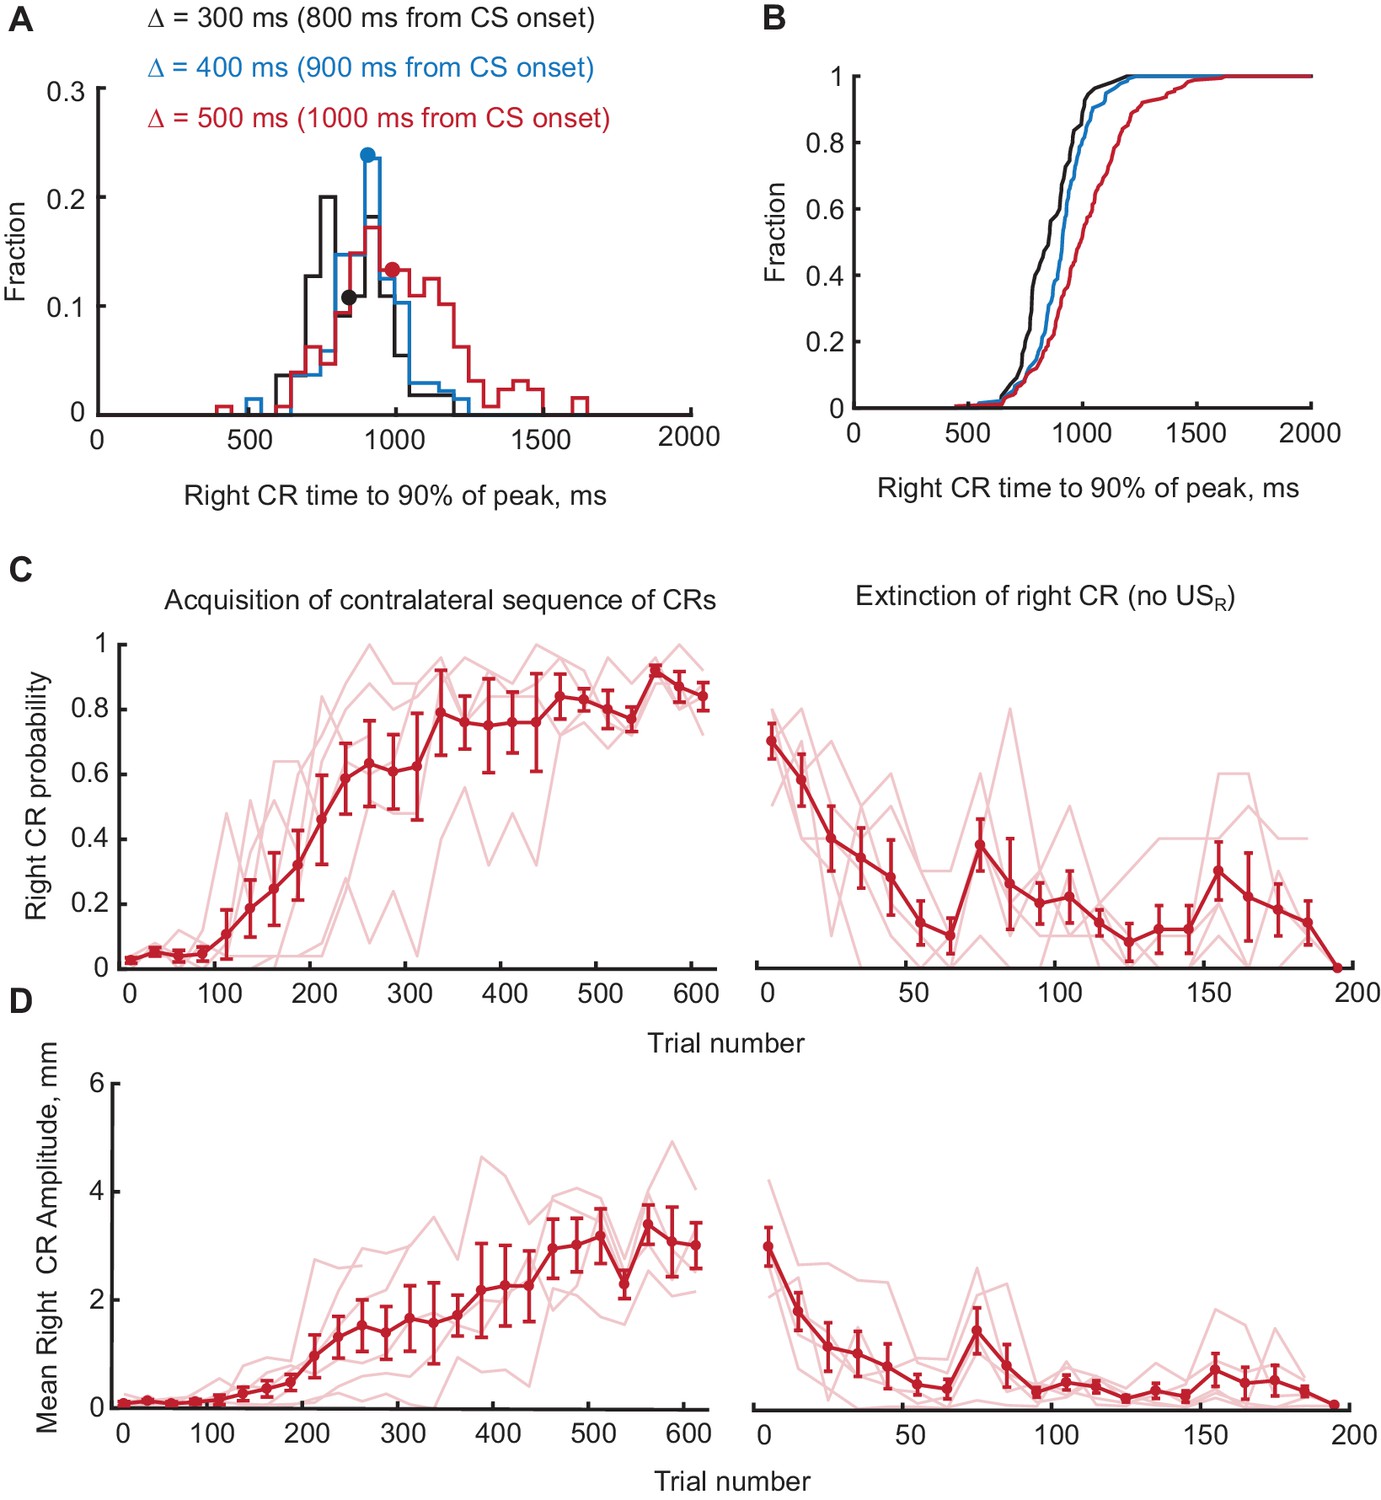
(A) Distributions of times to 90% of peak value for right eyelid CRs during contralateral sequence training. Data from different gap intervals between CS offset and USR are indicated by the color (black for Δ = 300 ms, blue for Δ = 400 ms and red for Δ = 500 ms). Median values are indicated as dots on each distribution. (B) CDFs of distributions shown in panel (A), demonstrating that right CRs are adaptively timed depending on gap interval used in training (p<0.01, Kolmogorov-Smirnov test, comparing data from Δ = 300 ms versus Δ = 400 ms and Δ = 500 ms versus Δ = 400 ms). (C) Right eyelid CR probability as a function of trial number, concatenated across several sessions. Only trials with left CR amplitude larger than 3 mm were used. Thin lines represent individual subjects, whereas thick line shows group average. Left panel shows acquisition curves of right CR in contralateral sequence, right panel shows data from three sessions of right CR extinction. (D) Same as (C), but for average amplitude of right eyelid CRs in contralateral sequence training.
Figure 4 with 1 supplement
Extinction of the first CR in the sequence eliminates the following CRs.
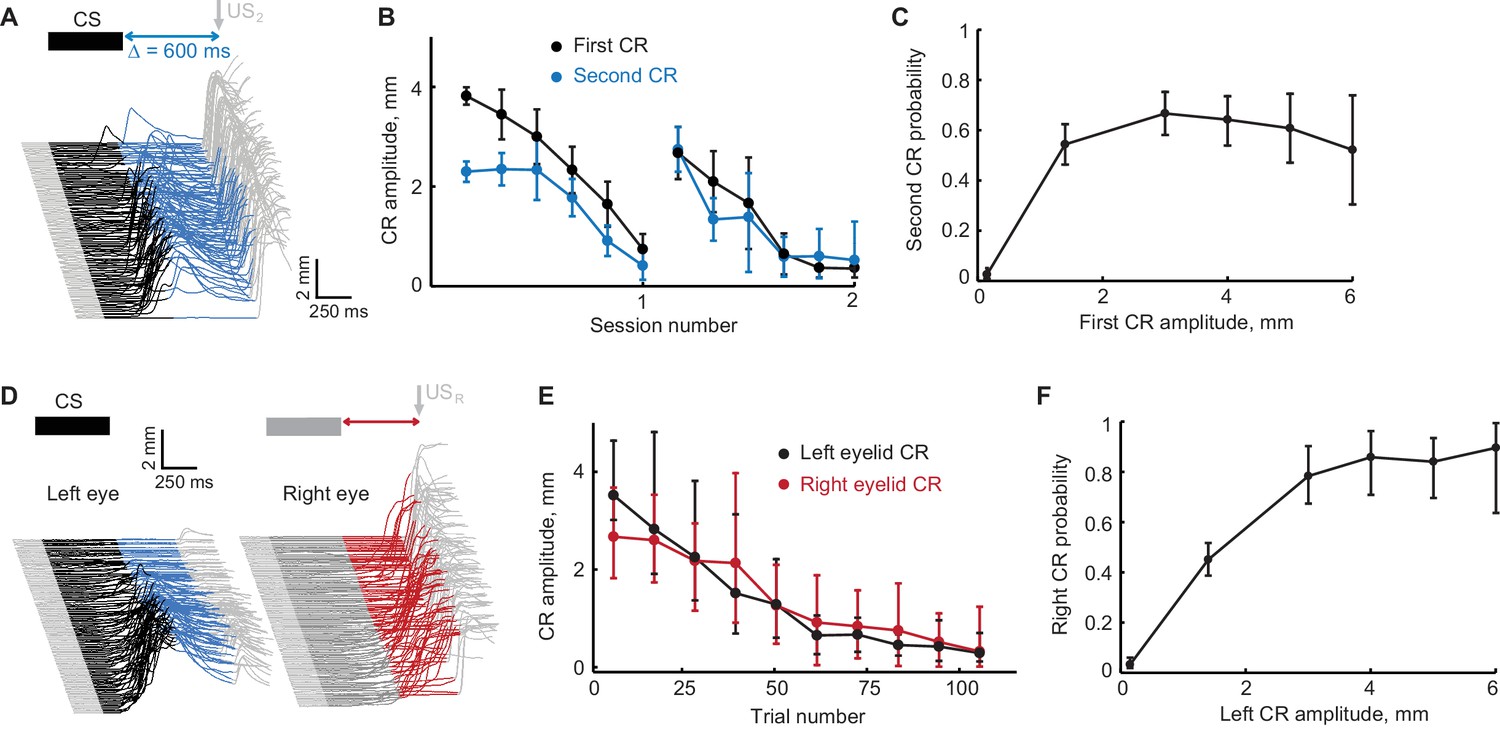
(A) Schematic representation of stimulus sequence and example session from subject with ipsilateral sequence training. On all paired trials the US1 was never presented and US2 was always presented, regardless of first CR amplitude. (B) First and second CR amplitudes over two consecutive sessions of first CR extinction. Each point is an average across one sixth of trials in the session, error-bars represent standard error. (C) Second CR probability as a function of first CR amplitude. Error-bars show 95% confidence intervals (obtained by bootstrapping with 0.3 mm non-CR threshold, 2000 repetitions). (D–F) Similar analysis for subjects trained in contralateral sequence protocol where black traces represent left eye (first) CRs and red traces represent right eye (second) CRs.
-
Figure 4—source data 1
Behavioral data from the first control experiment: extinction of the first CR while reinforcing the second CR.
- https://doi.org/10.7554/eLife.37443.012
Figure 4—figure supplement 1
Extinction of the first CR in the sequence eliminates the following CRs.
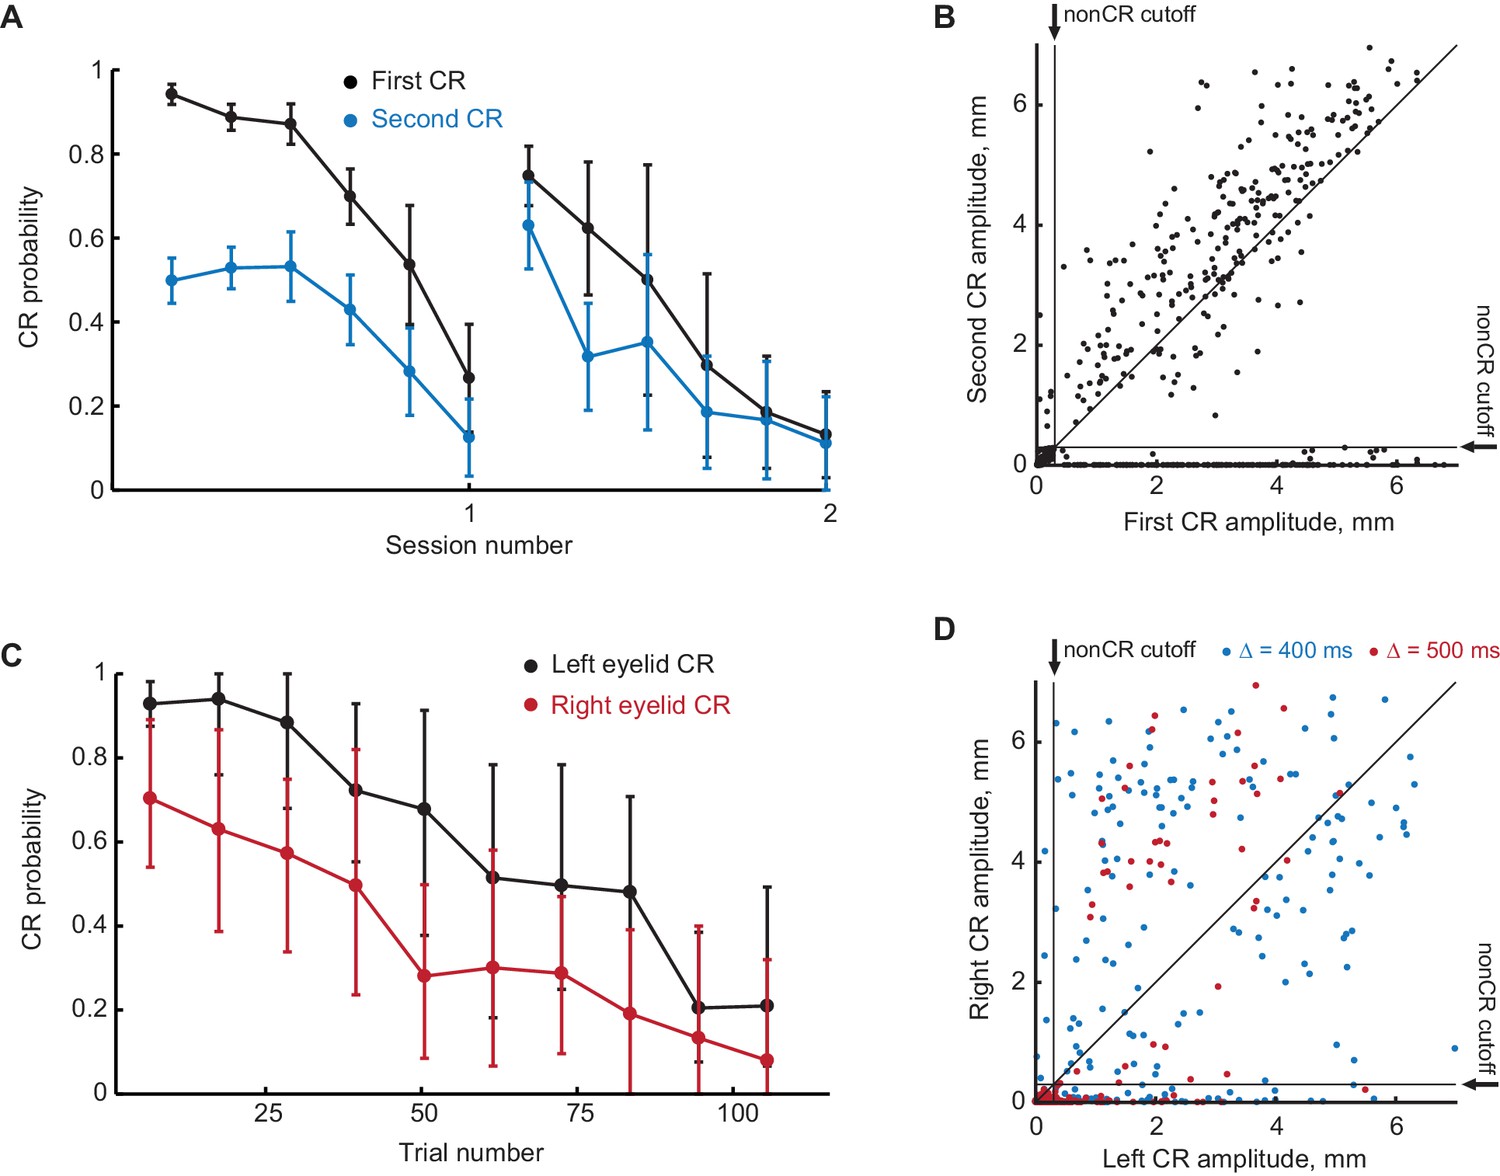
(A) First and second CR probabilities over two consecutive sessions of first CR extinction. Each point is an average across one sixth of trials in the session, error-bars represent standard error. (B) Scatter plot representing the amplitude of the second CR versus the amplitude of the first CR in first CR extinction sessions. Each dot represents a single trial. Vertical and horizontal solid black lines represent non-CRs cutoffs, dotted black line shows a diagonal where second CR amplitude equals that of the first CR. (C–D) Similar to (A–B), but for subjects trained in contralateral sequence protocol.
Figure 5

Sequence of CRs is present regardless of CS type that drives the first CR.
(A) Schematic representation of stimuli during all types of trials in the session. (B) Example session showing eyelid responses on CS2-alone trials of subject trained in ipsilateral sequence with CS1. Brown color indicates CS2 duration. (C) Second CR is present on either CS1 or CS2 trials only if first CR is present. Each dot represents average second CR probability over corresponding trial type during one session, bars show a global average across all CS2 test sessions. Error-bars indicate 95% confidence intervals (bootstrap with 2000 repetitions). (D) Second CR probability on trials with first CRs, elicited either by CS1 or CS2, co-varies between sessions. The data are the same as in blue and brown bars in panel (C). Each dot represents a single session, showing second CR probability on trials with first CRs elicited by either CS1 (X axis) or CS2 (Y axis). (E–H) Similar analysis for subjects trained in contralateral sequence protocol.
-
Figure 5—source data 1
Behavioral data from the second control experiment: CS2 test
- https://doi.org/10.7554/eLife.37443.014
Figure 6
Evidence that the expression of a first CR is necessary for expression of subsequent second CR.
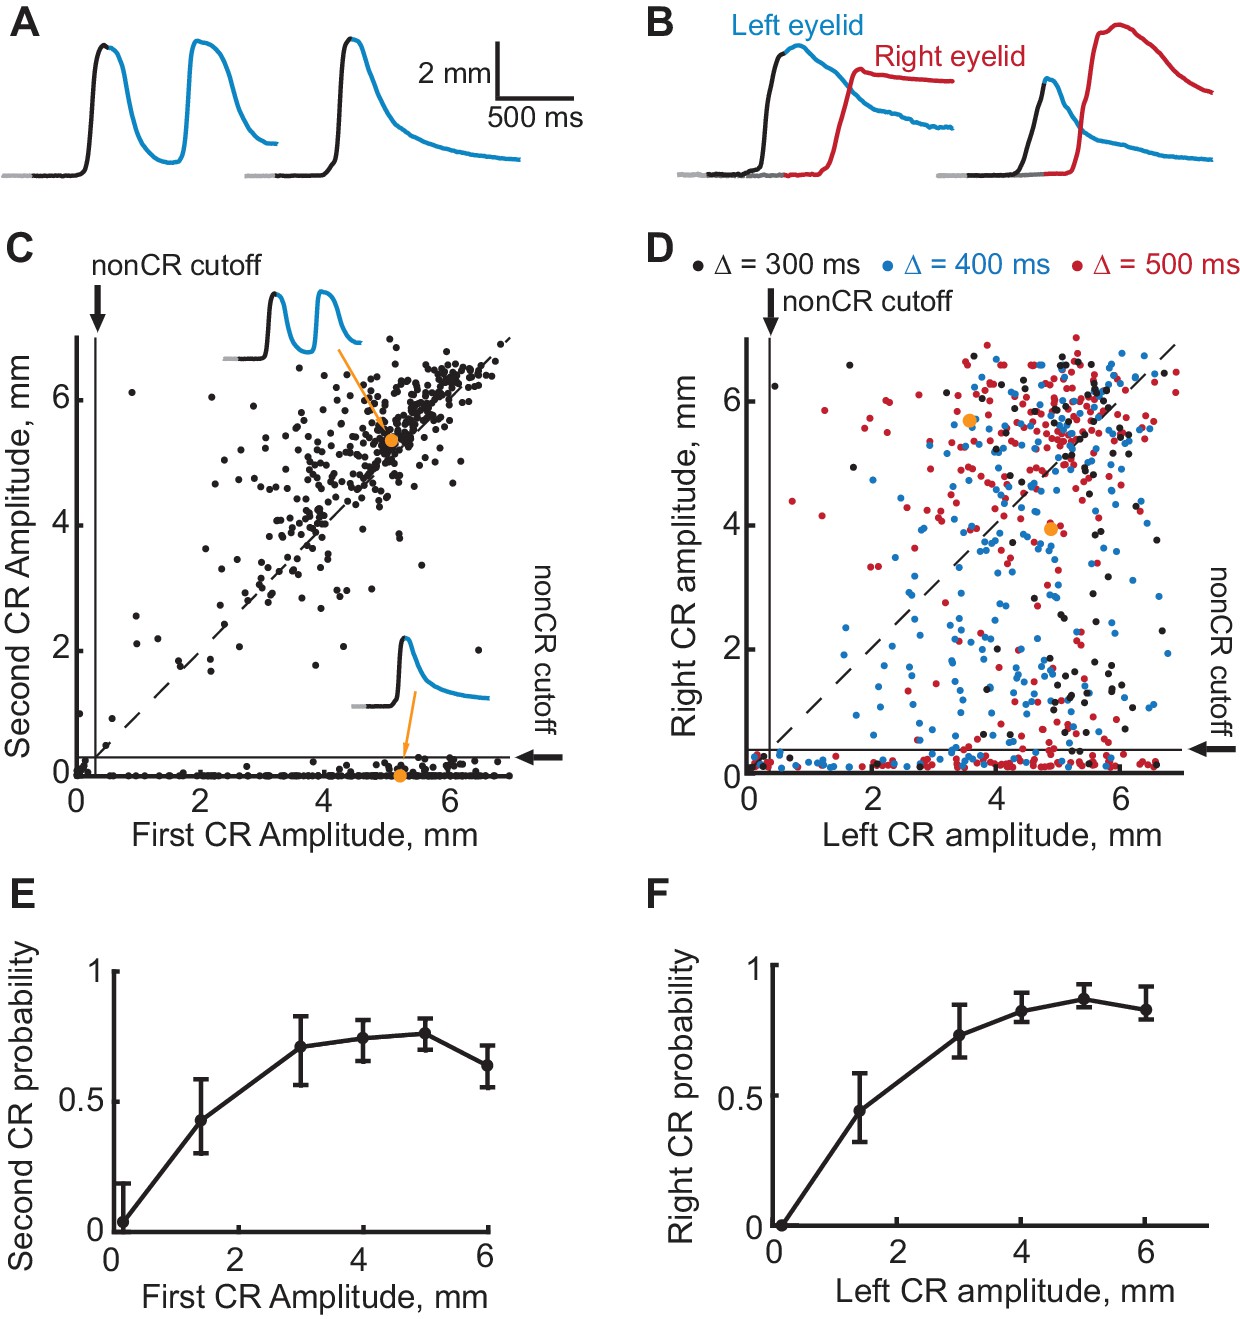
(A–B) Eyelid CRs on two example trials from ipsilateral and contralateral sequence training sessions respectively. Color-coding of time intervals is preserved from Figures 2 and 3. (C) Scatter plot representing the amplitude of the second CR versus the amplitude of the first CR in ipsilateral sequence training. Each dot represents a single CS-alone trial. Vertical and horizontal solid black lines represent non-CRs cutoffs, dotted black line shows a diagonal where second CR amplitude equals that of the first CR. Dots corresponding to example trials from panels (A–B) are shown in orange. (D) Similar to (C), but for subjects trained in contralateral sequence protocol. Data obtained from sessions with different gap intervals are color-coded as indicated in legend. (E) Average probability of the second CR as a function of first CR amplitude. Error-bars show 95% confidence intervals (obtained by bootstrapping with 0.3 mm nonCR threshold, 2000 repetitions). (F) Same as (E), but for subjects trained at contralateral sequence of CRs. Here we combined data from sessions with different gap intervals.
-
Figure 6—source data 1
Behavioral data on CS-alone trials from sessions with robust expression of CR sequences.
- https://doi.org/10.7554/eLife.37443.016
Figure 7 with 1 supplement
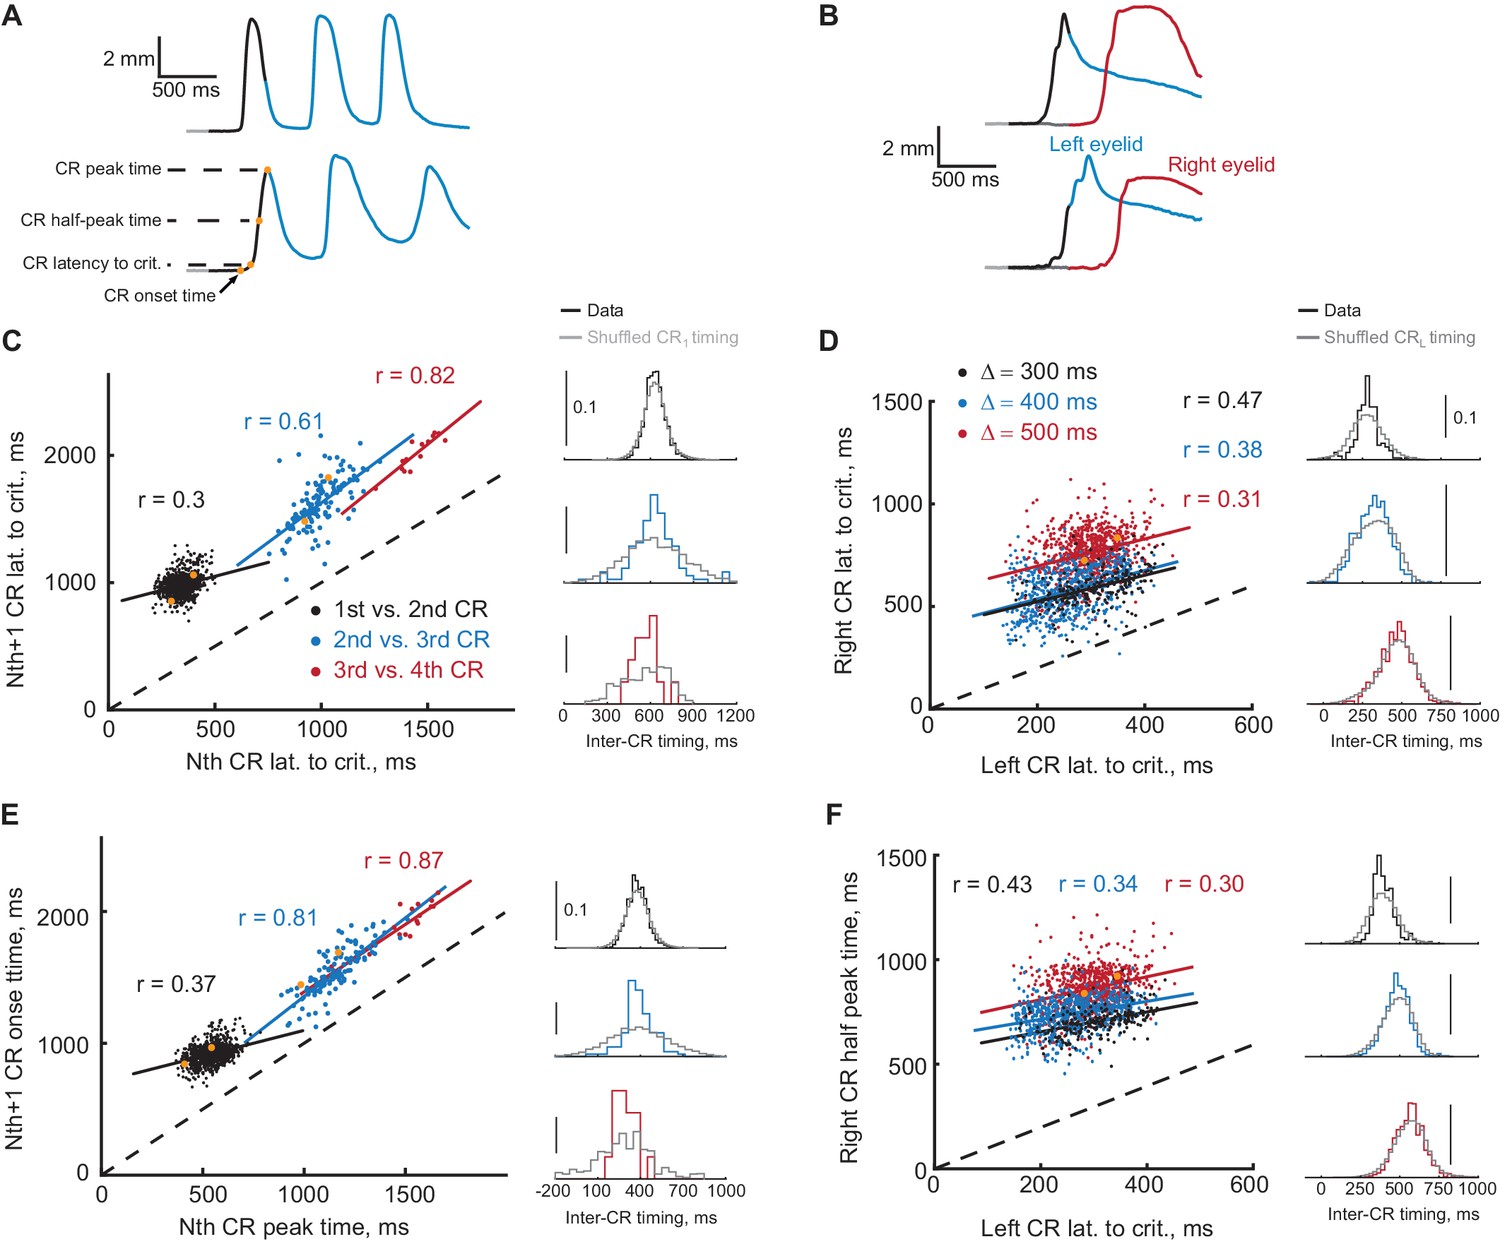
Timing of first and second CRs in sequence co-varies from trial-to-trial.
(A) Two example trials showing eyelid CRs from subjects trained in ipsilateral sequence. Orange dots indicate times of different CR timing measures, specified on the left. (B) Similarly, responses on two example trials from subjects trained in contralateral sequence. (C) Latency to criterion of following versus previous CR in ipsilateral sequence training. Each dot represents a single trial, dotted black line shows the diagonal. Colored lines show a linear regression fit for corresponding pairs of CRs as in the legend. Colored distributions on the right show distribution of time-intervals between timing measures (CR lat. to crit. versus CR lat. to crit. for C) of corresponding CRs pairs on different trials. Distributions in grey show the same data with timing of first CR shuffled across trials (2000 repetitions). (D) Similar plot for latency to criterion of CRs in contralateral sequence. Here colors indicate different gap intervals, as in the legend. Panels on the right show distributions of timing between left and right CRs data on the left. (E) Same for CR onset time versus peak time of the previous CR in ipsilateral sequence. (F) Same for the time to half peak amplitude of right CR versus latency to criterion of the left CR in contralateral sequence. For panels (C–F) dots corresponding to example trials from panels (A–B) are shown in orange.
-
Figure 7—source data 1
Statistical results of comparison between actual and shuffled distributions of inter-CR timing.
- https://doi.org/10.7554/eLife.37443.019
Figure 7—figure supplement 1
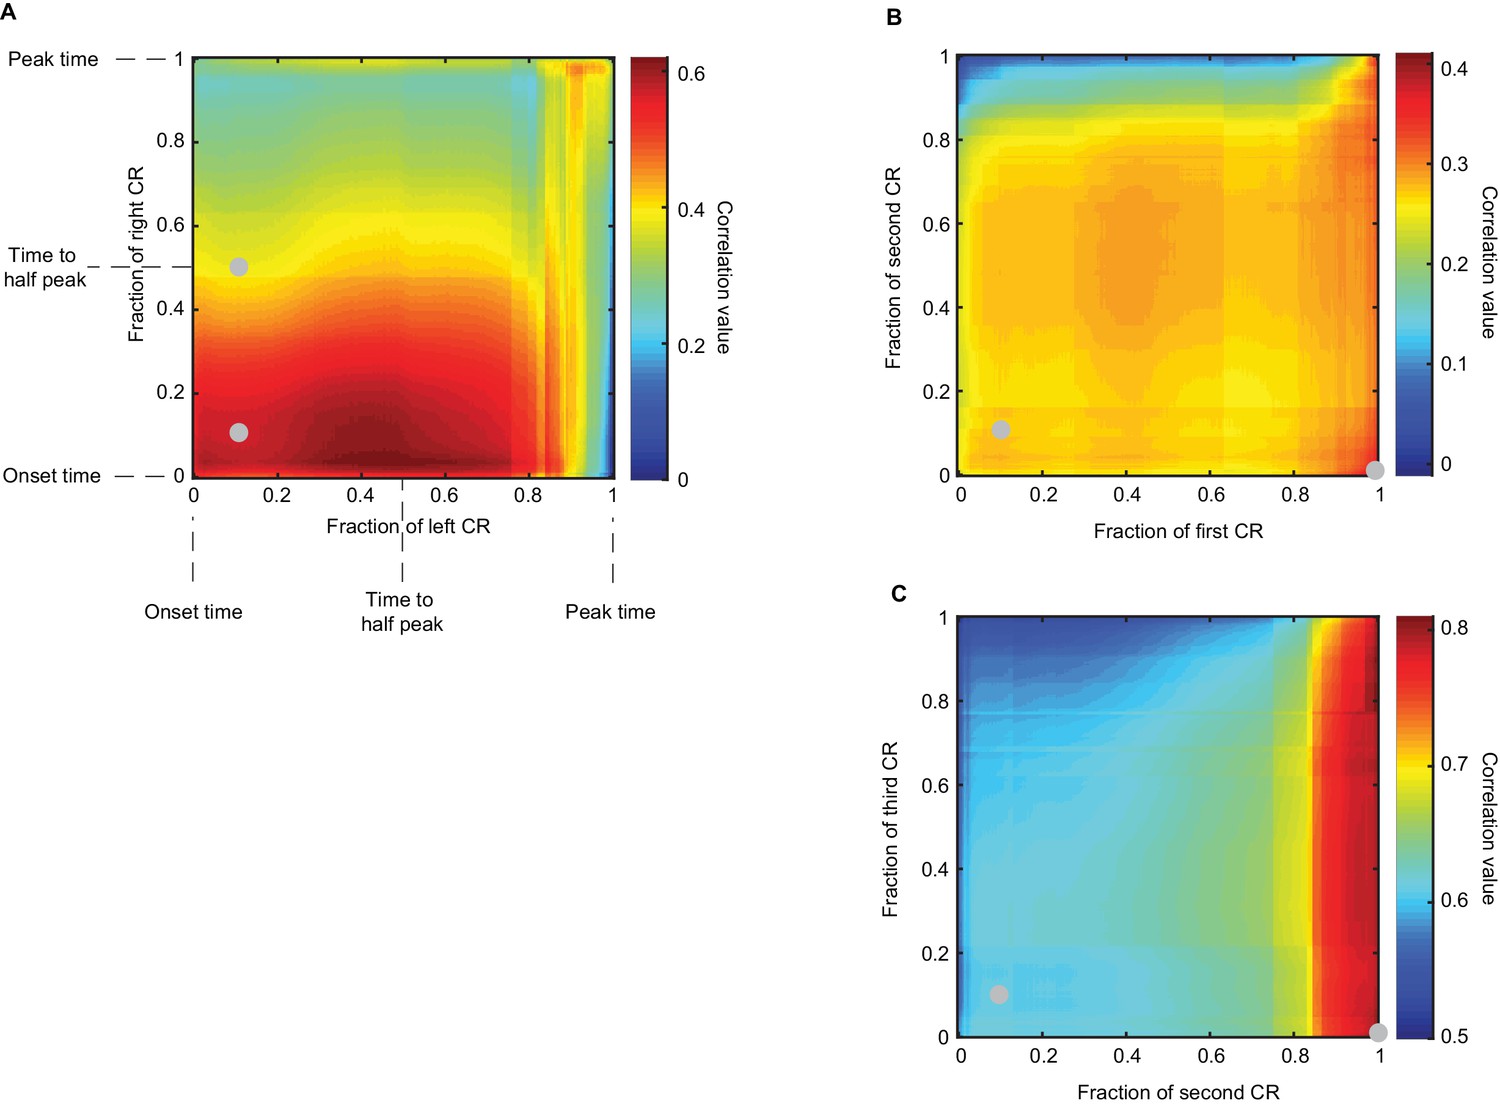
Co-variation of timing measures of CRs in sequence.
Heatmaps show Pearson correlation coefficient of timing of different portions of CRs in the sequence (see Materials and methods). (A) Panel shows results for contralateral sequence of CRs (Δ = 300 ms). Eyelid position values were normalized between zero and one, such that CR onset time corresponds to zero, CR peak time corresponds to one and intermediate CR values are in between. X axis corresponds to the left CR, Y axis – to the right CR, color indicates the value of correlation coefficient as stated in the legend. Grey dots indicate points that correspond to panels in Figure 7 (approximately for CR latency to criterion). For contralateral sequence, the highest correlation is observed between timing of the middle portion of left CR and early portion of the right CR. (B-C) A similar analysis for ipsilateral sequence, timing of first versus second CRs and second versus third CRs. Here the highest correlation is observed between timing of the late portion of first CR and both early and late portions of the second CR. Interestingly, the timing of close to peak values of the second CR has a high correlation with the whole profile of the third CR.
Figure 8
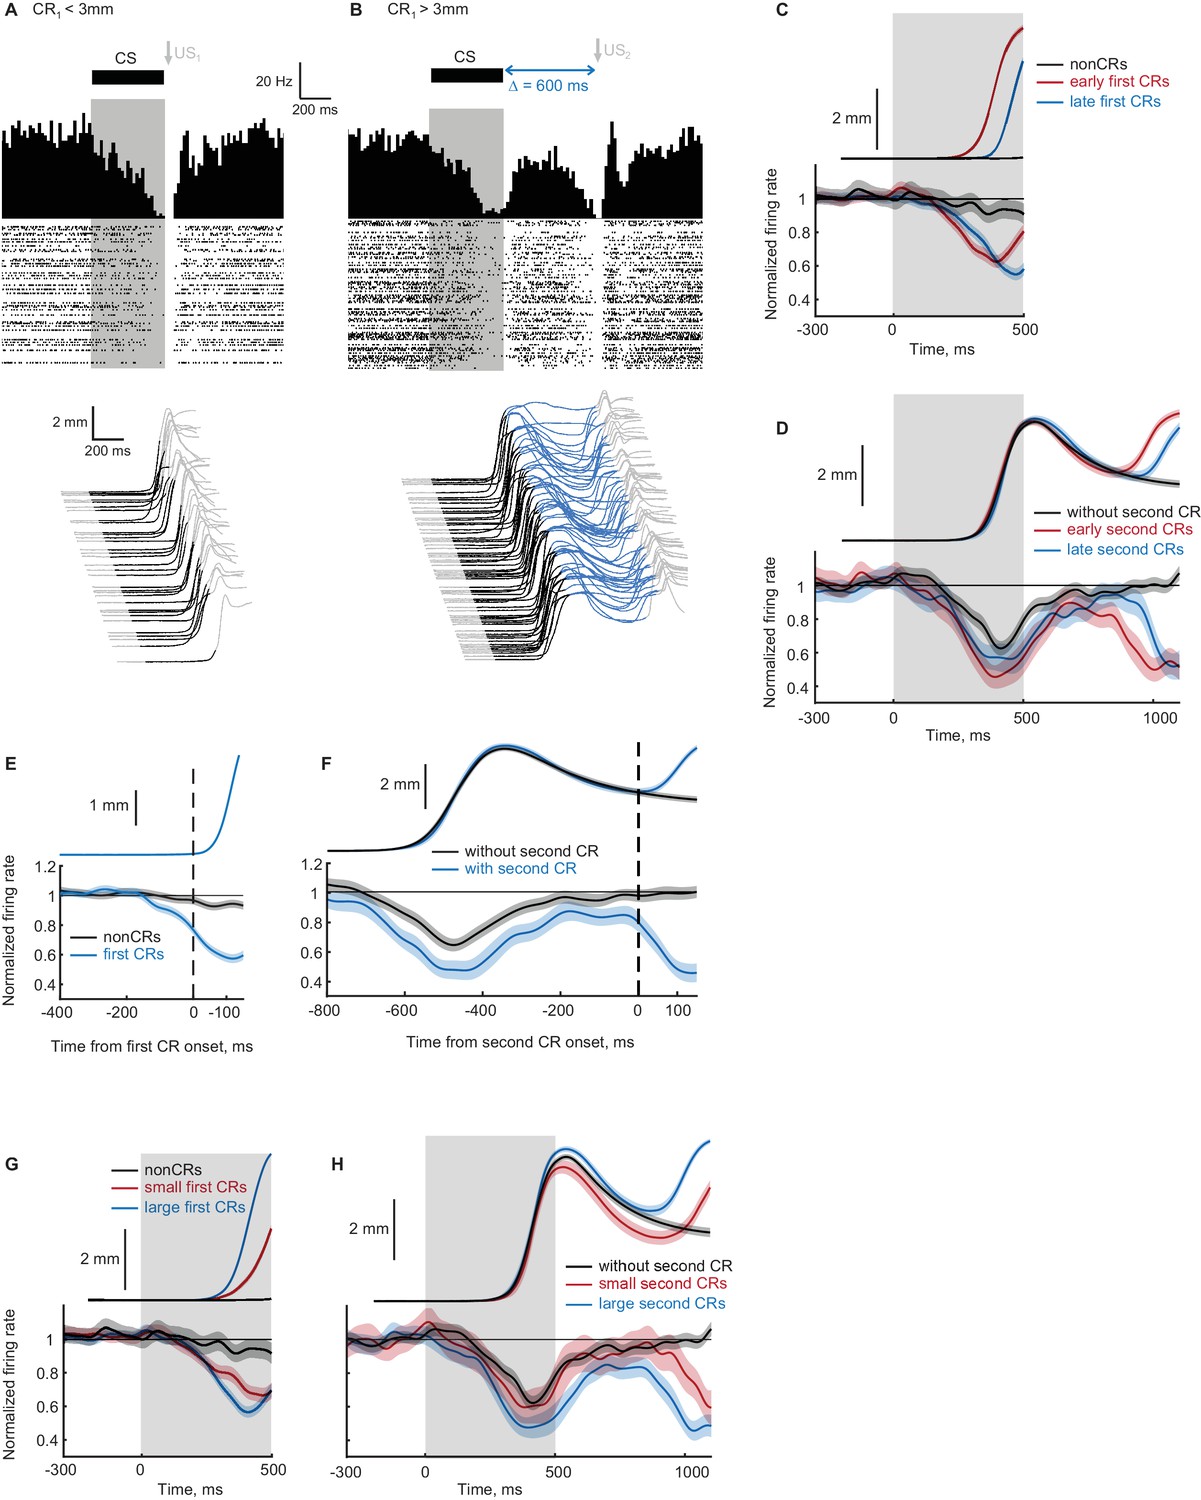
Recordings from eyelid Purkinje cells during ipsilateral sequence sessions.
(A–B) Example eyelid PC recording during an ipsilateral sequence training session. (A) Behavioral responses on trials with first CR amplitude smaller than 3 mm are shown at the bottom, corresponding PSTH and a raster plot of eyelid PC simple spikes are shown at the top. CS duration is indicated by a black color in behavioral waterfall plots and by a grey shaded area in the raster plot. (B) The same format as in panel (A), showing data on trials with first CR amplitude larger than 3 mm and consequently US2 delivery. (C) Average eyelid response profiles on trials sorted by the onset time of first CR are shown on top, corresponding average eyelid PCs firing rate normalized by the baseline level is shown at the bottom. Non-CR trials are shown in black, trials with early and late CR onset times are shown in red and blue respectively. Behavioral responses and eyelid PCs activity are truncated at US1 onset, shaded regions represent 95% confidence intervals. (D) Similar to (C), but for trials with first CR present and sorted by the onset times of second CRs. Color-coding is similar to (C), behavioral responses and eyelid PCs activity are truncated at US2 onset. (E) Eyelid PCs activity aligned by first CR onset times (vertical black dotted line) is shown at the bottom; aligned CRs profile is shown on top. Eyelid PCs activity on CR trials is shown in blue color, on non-CR trials – in black. (F) Behavioral responses and eyelid PCs activity aligned to the onset time of second CR (vertical black dotted line). First CRs are present in all trials, results from trials with second CRs present are shown in blue color, without second CRs – in black. (G) Average eyelid response profiles on trials sorted by first CR amplitude are shown on top, corresponding average eyelid PCs firing rate is shown at the bottom. Non-CR trials are shown in black, trials with small and large first CR amplitudes are shown in red and blue respectively. (H) Similar to (G), but for trials with first CR present and sorted by the second CR amplitude.
-
Figure 8—source data 1
Normalized eyelid Purkinje cell firing rate and corresponding behavioral data during expression of ipsilateral sequence of CRs.
- https://doi.org/10.7554/eLife.37443.021
Additional files
-
Transparent reporting form
- https://doi.org/10.7554/eLife.37443.022
Download links
A two-part list of links to download the article, or parts of the article, in various formats.
Downloads (link to download the article as PDF)
Open citations (links to open the citations from this article in various online reference manager services)
Cite this article (links to download the citations from this article in formats compatible with various reference manager tools)
Cerebellar implementation of movement sequences through feedback
eLife 7:e37443.
https://doi.org/10.7554/eLife.37443


