Host autophagy machinery is diverted to the pathogen interface to mediate focal defense responses against the Irish potato famine pathogen
- Norwich Research Park, United Kingdom
- Vienna Biocenter, Austria
- Imperial College London, United Kingdom
- INGEBI-CONICET, Ciudad Autonoma de Buenos Aires, Argentina
Figures
Figure 1 with 2 supplements
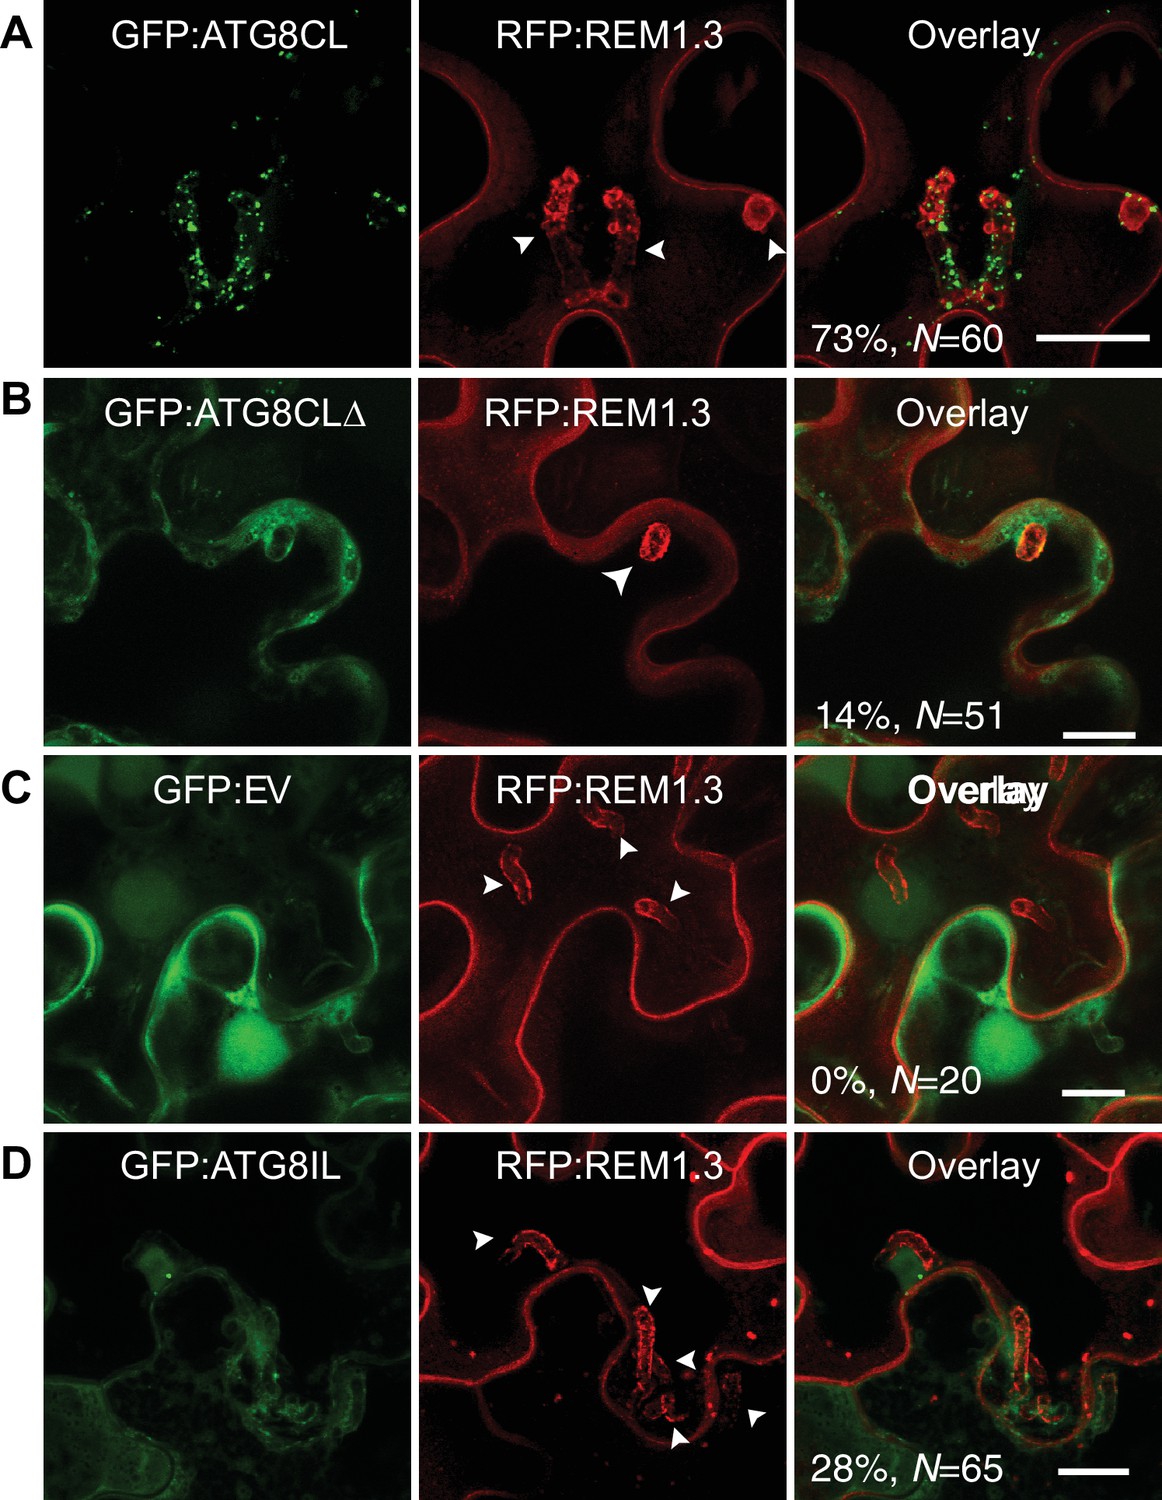
ATG8CL-autophagosomes accumulate around the haustoria.
GFP:ATG8CL, GFP:ATG8CLΔ, GFP:EV (empty vector) or GFP:ATG8IL are co-expressed with the EHM marker RFP:REM1.3 via agroinfiltration in N. benthamiana leaves infected with P. infestans. Confocal laser scanning microscopy (CLSM) was used to monitor the autophagosomes in haustoriated cells 3–4 days post infection (dpi). (A) GFP:ATG8CL frequently showed perihaustorial puncta whereas (B) autophagy deficient GFP:ATG8CLΔ appeared as randomly distributed puncta, which failed to accumulate around haustoria (C) GFP:EV did not show any punctate localisation and only labelled perihaustorial cytoplasm (D) GFP:ATG8IL, a divergent member of the ATG8 family, remained mostly cytoplasmic and rarely labelled perihaustorial puncta. Multiple optical sections that fully cover the haustoria are obtained to monitor perihaustorial puncta. Images shown are maximal projections of 16, 10, 15, and 11 frames with 1 μm steps for the top, upper middle, lower middle and bottom rows, respectively. Arrowheads point to haustoria. Scale bars, 10 μm.
Figure 1—figure supplement 1
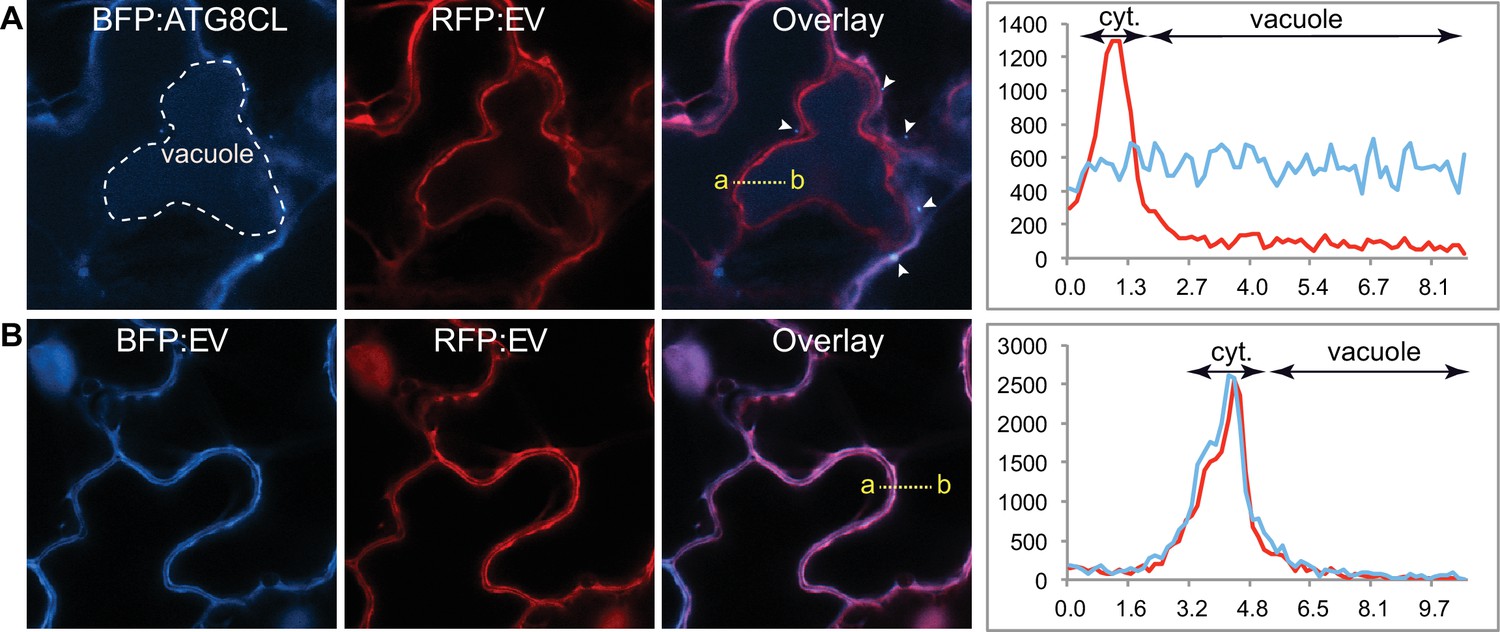
ATG8CL traffics vacuole in uninfected cells.
(A–B) In uninfected N. benthamiana epidermal cells BFP:ATG8CL labels randomly distributed puncta (Arrowheads) and central vacuole (engulfed by dotted white lines) (A), unlike BFP and RFP vector controls (B). Images were obtained three dpi. The intensity plots demonstrate relative BFP and RFP fluorescence signals along the dotted line connecting points a-b; BFP:ATG8CL fluorescence intensity is detected throughout central vacuole unlike RFP:EV, which peaks at cytoplasm (cyt.) (top right panel). In contrast. BFP:EV only shows a peak at the cytoplasm overlapping with the RFP:EV signal (bottom right panel).
Figure 1—figure supplement 2
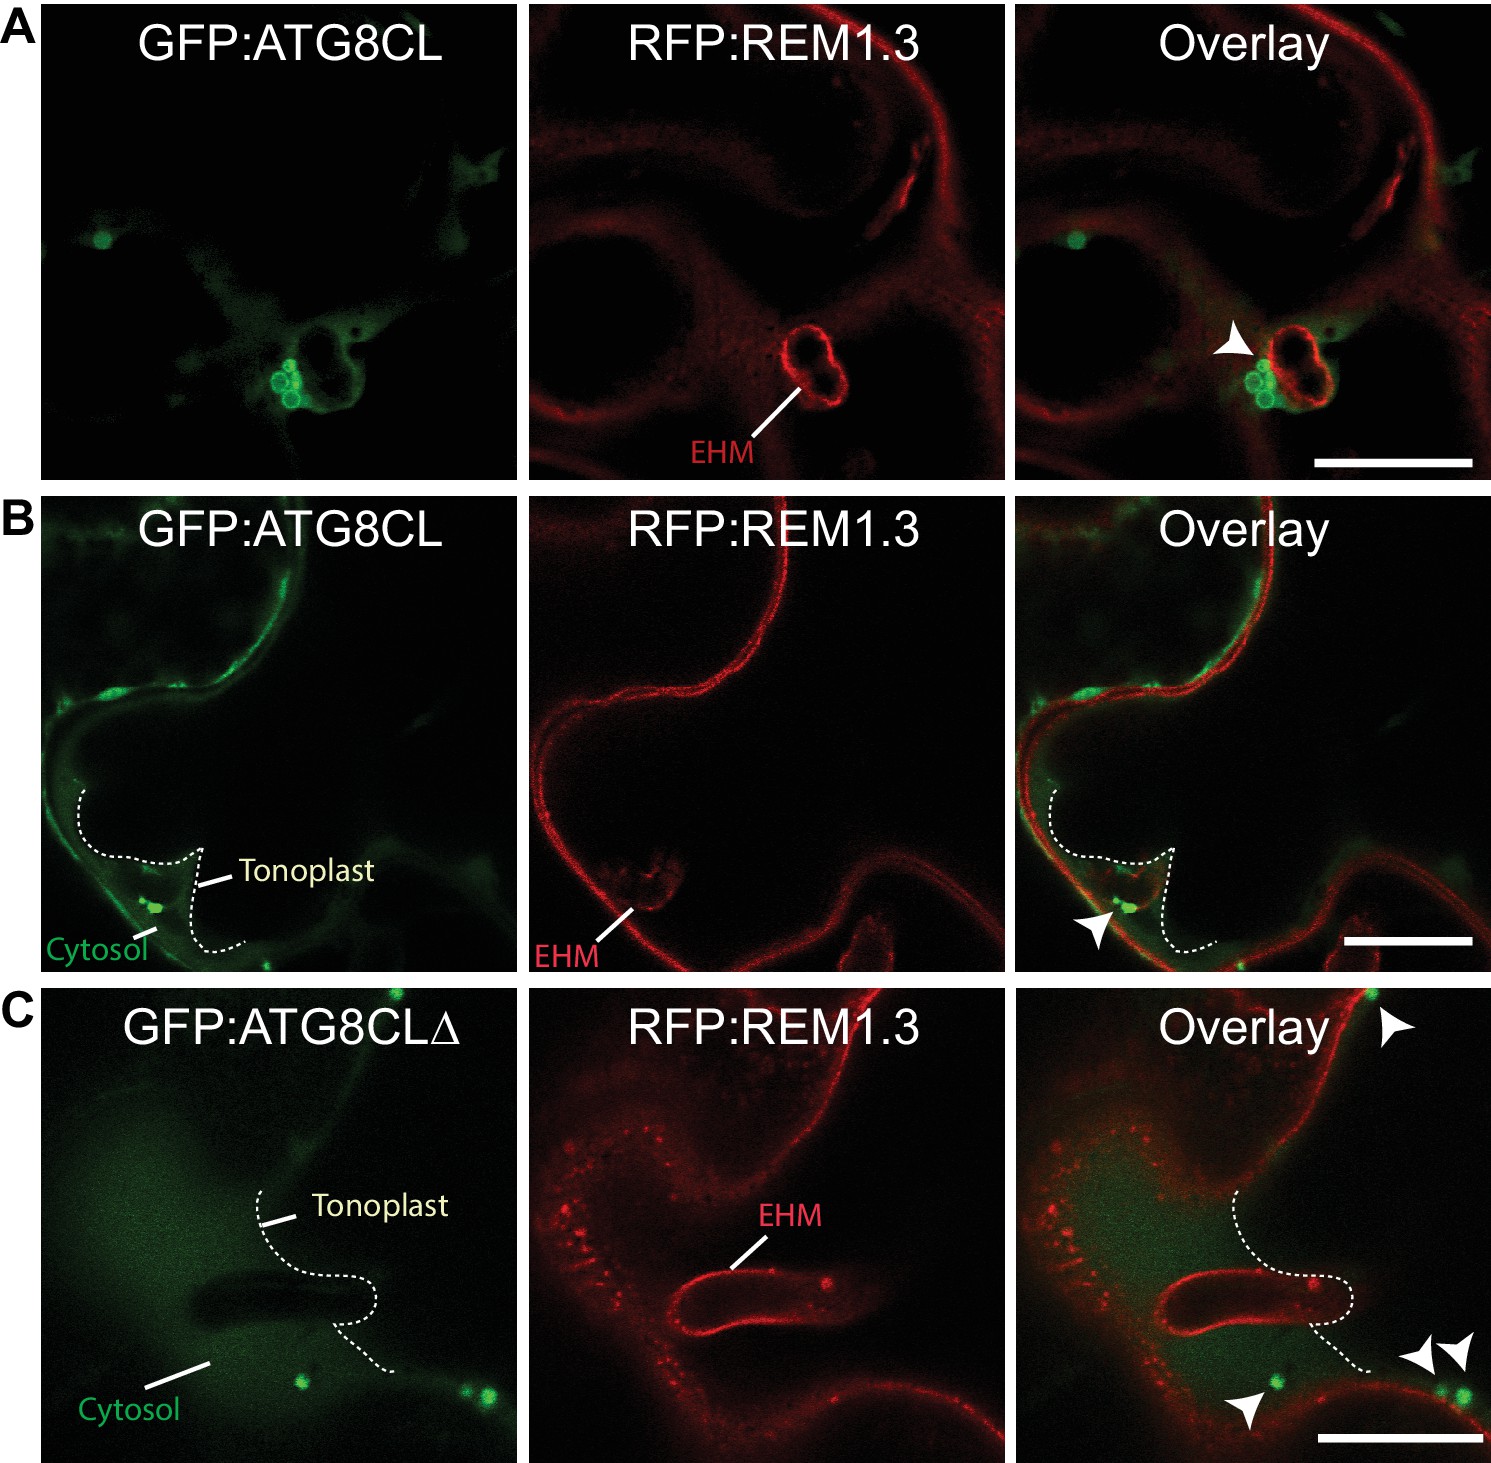
ATG8CL-autophagosomes associate with the EHM.
(A-C) Single focal plane CLSM images show regions where the EHM and the tonoplast (dotted white line in B and C) are parted away and the cytosol is no longer a thin layer between the two membranes. (A–B) GFP:ATG8CL labelled autophagosomes with varying size and shape associated with the EHM marked by RFP:REM1.3, (C) unlike the GFP:ATG8CLΔ mutant. Images were obtained three dpi. Arrowheads point to autophagosomes in contact with the EHM.
Figure 2 with 1 supplement
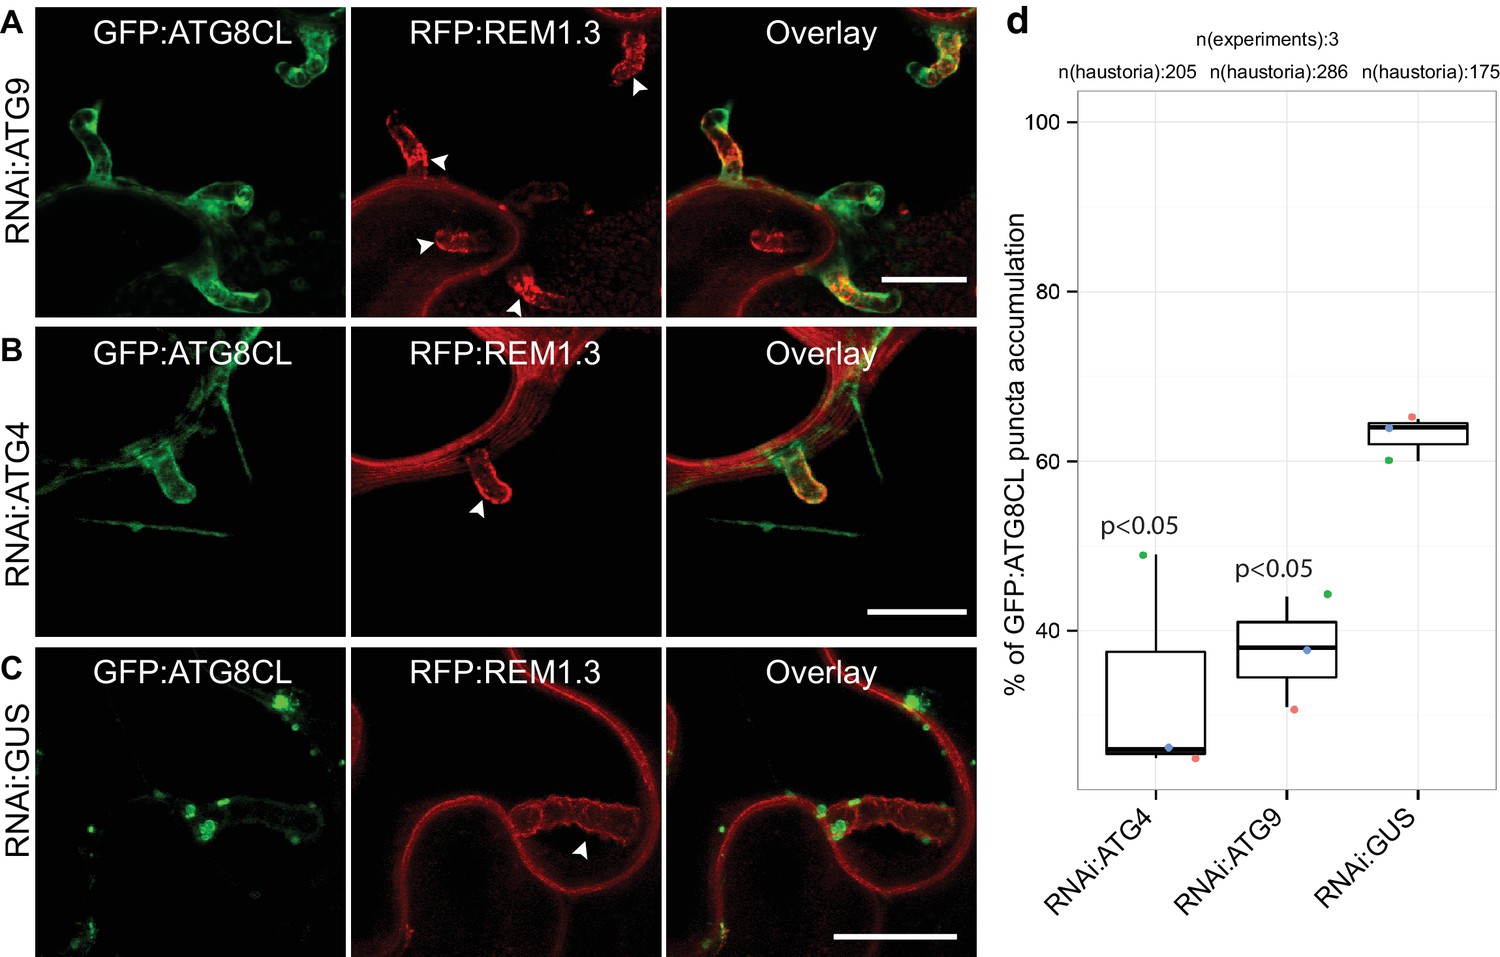
ATG4 and ATG9 are required for perihaustorial accumulation of ATG8CL autophagosomes.
(A–D) In infected leaf patches, GFP:ATG8CL is co-expressed with RFP:REM1.3 in the presence of hairpin RNAi constructs targeting ATG4, ATG9 or control GUS. CSLM analyses of three independent experiments revealed that perihaustorial accumulation of autophagosomes are significantly reduced when ATG9 (A) or ATG4 (B) is silenced compared to GUS (C) silencing. Images shown are maximal projections of 12, 10 and 9 frames with 1 μm steps from top to bottom rows, respectively. Arrowheads point to haustoria. Scale bars, 10 μm. Images were obtained 3–4 dpi. (D) Quantification of perihaustorial ATG8CL-puncta upon ATG9, ATG4 or GUS silencing.
Figure 2—figure supplement 1

Validation of ATG4 and ATG9 knockdowns.
Constructs carrying hairpin plasmids (pRNAi-GG) targeting NbATG4, NbATG9a/b or GUS were infiltrated to N. benthamiana and the expression of targeted genes was assessed by RT-PCR at three days post silencing. RT-PCR verified efficient gene silencing of NbATG4, NbATG9a and NbATG9b. Glyceraldehyde 3-phosphate dehydrogenase (GAPDH) was used as internal control for silencing. RT-PCR band sizes are 431, 330, 424, and 220 base pairs for ATG4, ATG9A, ATG9B, and GAPDH respectively.
Figure 3 with 4 supplements
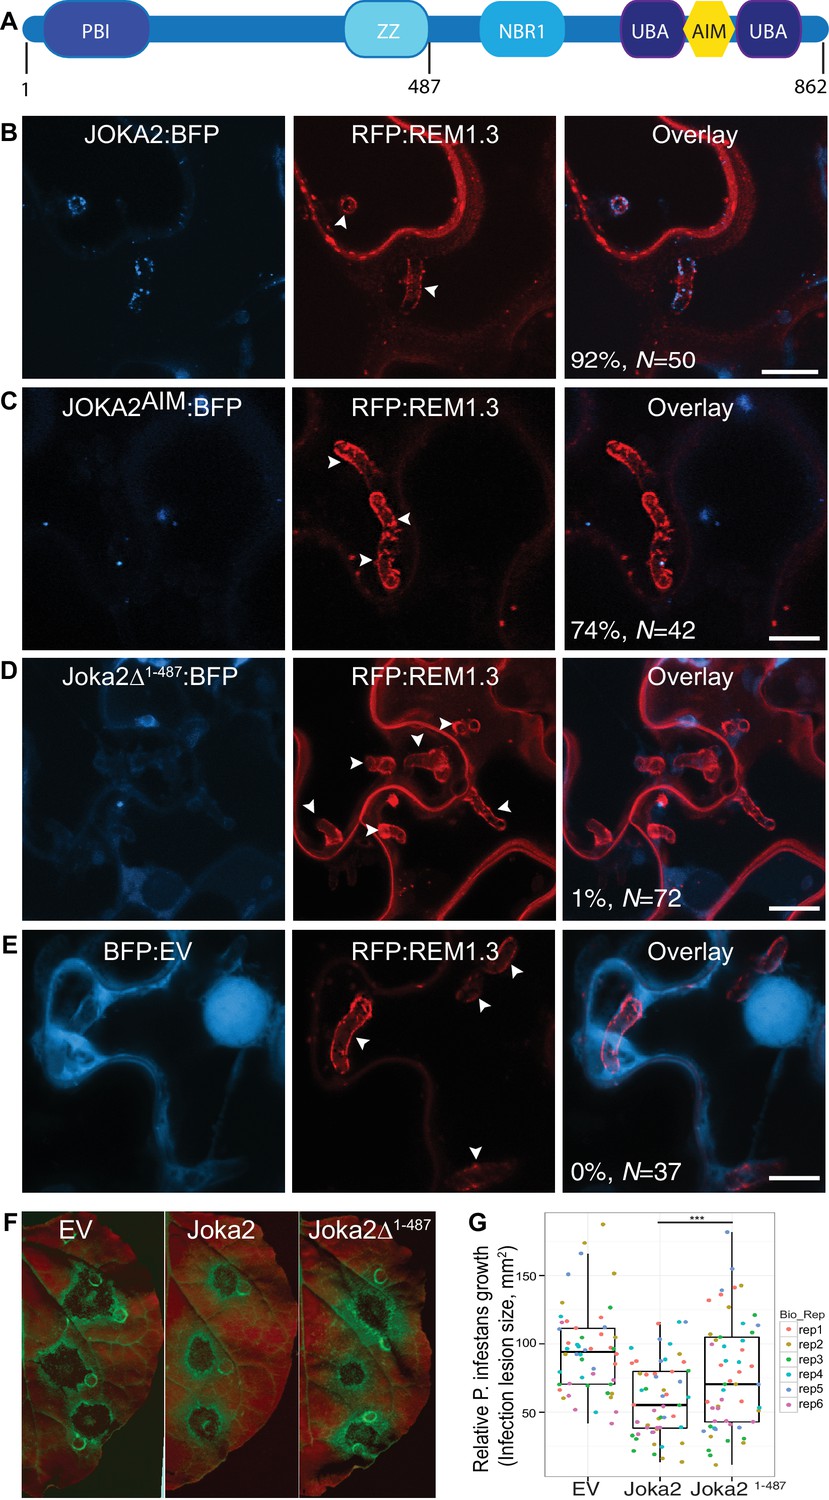
Joka2-mediated antimicrobial autophagy is directed toward the haustoria.
(A) Joka2 domain architecture (B–E) Confocal microscopy of P. infestans infected N. benthamiana leaf epidermal cells expressing Joka2:BFP, Joka2AIM:BFP mutant, Joka2Δ1-487:BFP or BFP:EV control. Both Joka2:BFP (top panel) and Joka2AIM:BFP (mid panel) displayed perihaustorial puncta although the frequency of the later was much lower. Consistently, Joka2Δ1-487:BFP mainly showed cytoplasmic distribution similar to BFP:EV control and rarely marked perihaustorial puncta (1.3% of imaged haustoria). Images shown are maximal projections of 10, 14, 10 and 7 frames with 1 μm steps from top to bottom rows, respectively. Arrowheads point to haustoria. Scale bars, 10 μm. Images were obtained 3–4 dpi. (F–G) Full length Joka2 enhances disease resistance against P. infestans, whereas Joka2Δ1-487, which does not accumulate around haustoria (D), only provides partial resistance. (F) N. benthamiana leaves expressing Joka2, Joka2Δ1-487 and empty vector (EV) control were infected with P. infestans and pathogen growth was determined by measuring infection lesion size eight days post-inoculation. (G) Categorical scatter plots illustrate infection lesion size of 8–10 infections sites from six independent biological replicates pointed out by six different colours. Welch Two Sample t-test revealed a significant difference (***p=0.0126) in disease resistance conferred by Joka2 compared to Joka2Δ1-487.
Figure 3—figure supplement 1
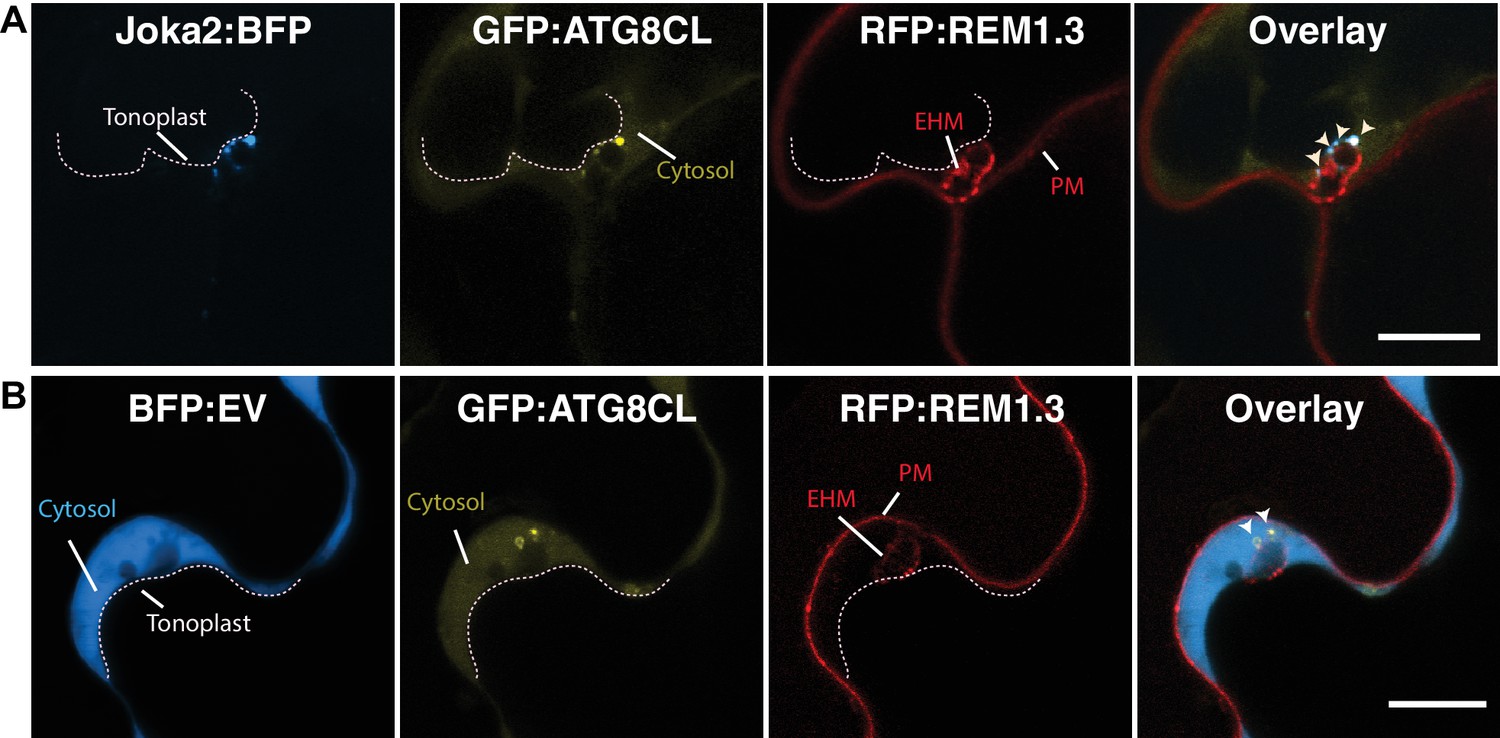
Joka2/ATG8CL-autophagosomes associate with the EHM.
(A) Single focal plane CSLM image of a haustoriated plant cell marked by RFP:REM1.3 in which Joka2:BFP/GFP:ATGCL co-labelled autophagosomes accumulate across the EHM. Arrowheads point to autophagosomes in contact with the EHM. Scale bar, 10 μm. Image is obtained three dpi. (B) Across the EHM, BFP:EV control do not produce any punctate signal that overlap with GFP:ATG8CL-autophagosomes. Arrowheads point to GFP:ATG8CL labelled autophagosomes in contact with the EHM. Scale bars, 10 μm. Images are obtained three dpi. PM: plasma membrane.
Figure 3—figure supplement 2
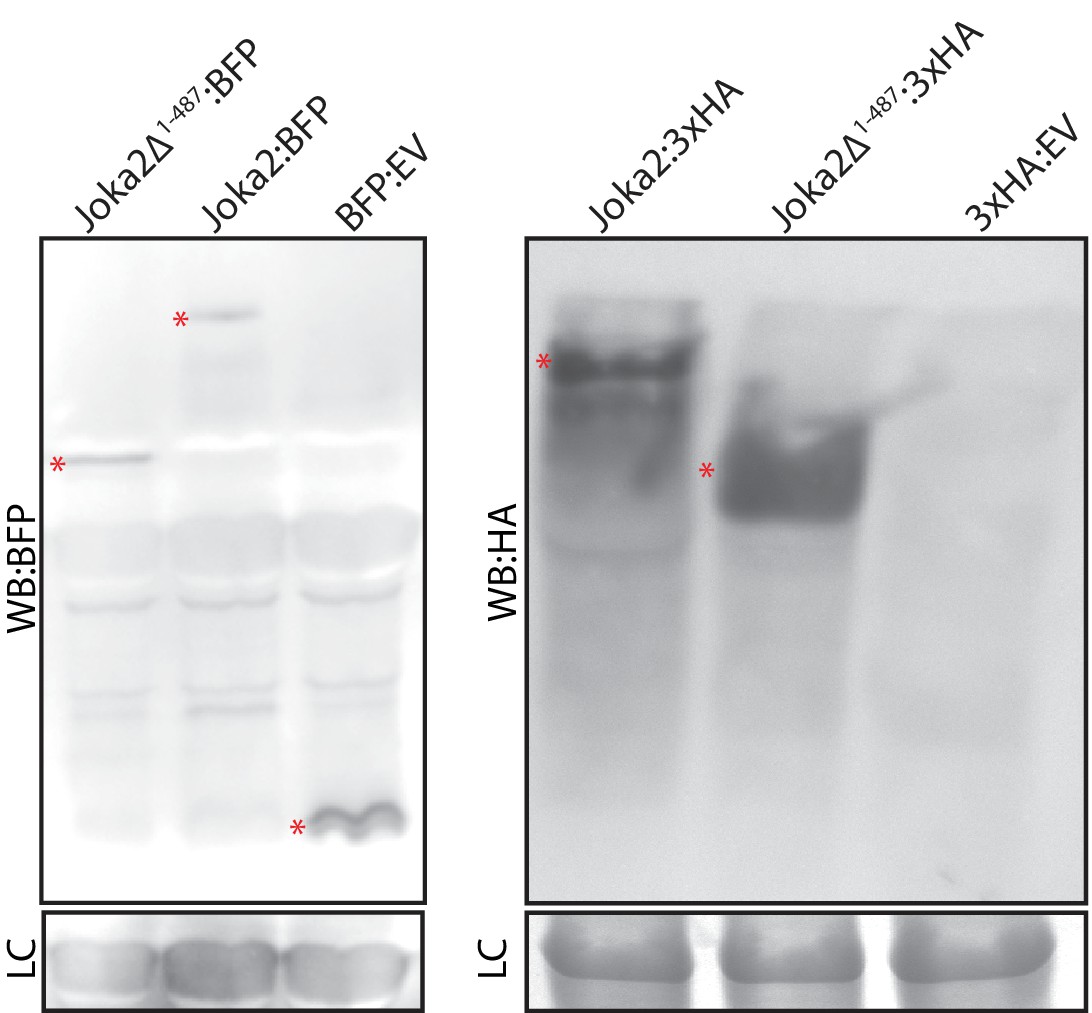
Joka2Δ1-487 is stably expressed.
Western blot detection of Joka2Δ1-487 and Joka2 constructs using anti Anti-tRFP antibody (Evrogen) and anti-HA antibody (Chromotek) from total protein extracts of N. benthamiana leaves two days after agroinfiltration. * indicates expected protein band (Joka2:BFP, 120 kDa; Joka2Δ1-487:BFP, 68 kDa; BFP:EV, 27 kDa; Joka2:3xHA, 98 kDa; Joka2Δ1-487:3xHA, 45 kDa; 3xHA:EV, 3.6 kDa). LC: loading control.
Figure 3—figure supplement 3
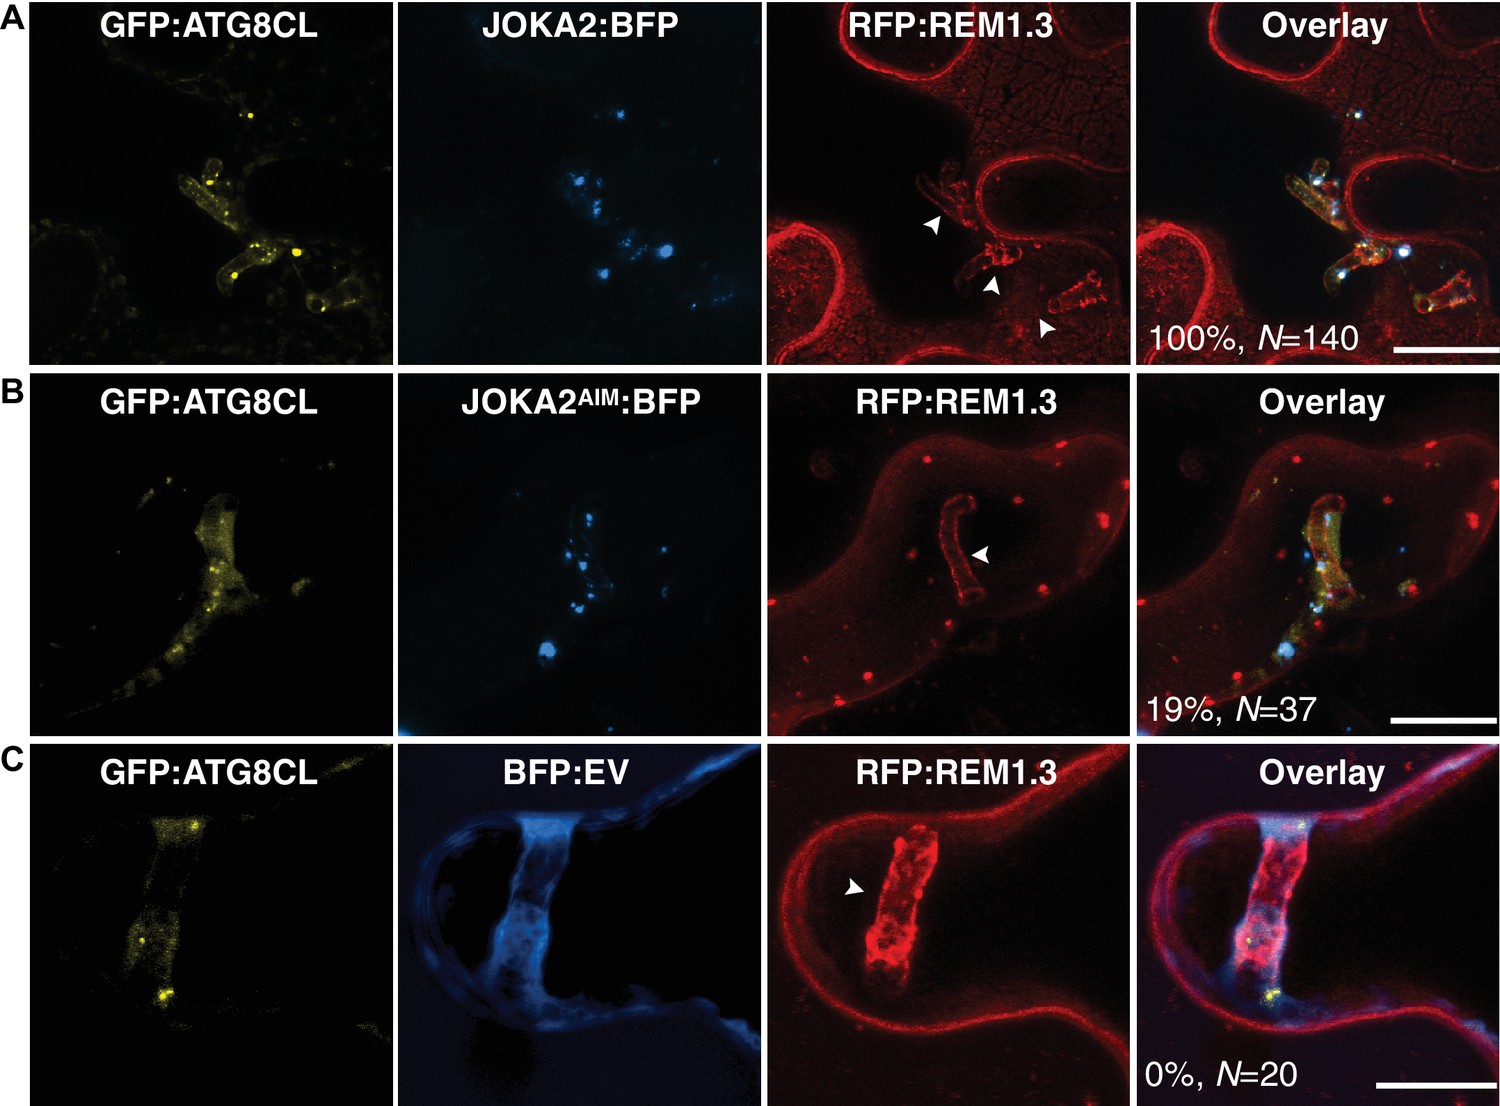
Joka2 localizes to ATG8CL-autophagosomes around the haustoria.
GFP:ATG8CL labelled perihaustorial autophagosomes fully overlapped with the Joka2:BFP labelled puncta (A), whereas Joka2AIM:BFP generally did not label GFP:ATG8CL autophagosomes (B) similar to BFP:EV control (C). Images shown are maximal projections of 11, 10 and 8, frames with 1 μm steps from top to bottom panels, respectively. Arrowheads point to haustoria. Scale bars, 10 μm. Images are obtained three dpi.
Figure 3—figure supplement 4
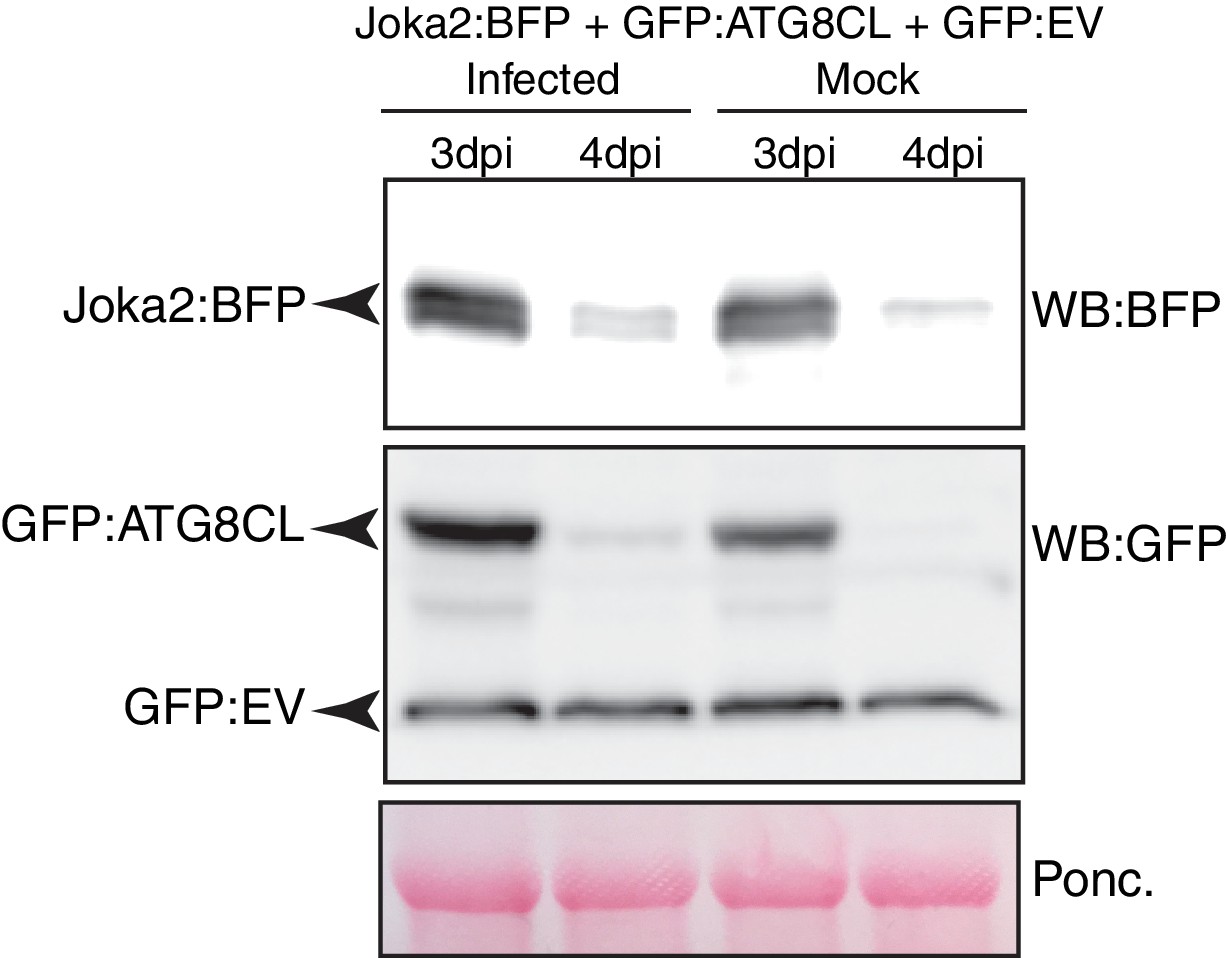
Joka2 degradation slows down during P. infestans infection.
P. infestans infection is associated with a decrease in Joka2 degradation. Joka2:BFP, GFP:ATG8CL and GFP:EV are co-expressed together in N. benthamiana leaves which are then infected (few hours post agroinfiltration) with P. infestans. Joka2:BFP and GFP:ATG8CL protein levels were higher in leaf patches that are infected compared to mock-infected leaves in both 3 and 4 days post infection (dpi). However, no such difference was detected in GFP:EV control in infected versus mock-infected samples. BFP detection was achieved using Anti-tRFP antibody (Evrogen) and GFP was detected by using a monoclonal anti-GFP antibody (Chromotek). Arrow heads point to the expected band sizes (Joka2:BFP, 120 kDa; GFP:EV, 27 kDa; GFP:ATG8CL, 42 kDa).
Figure 4

PexRD54 accumulates at perihaustorial autophagosomes.
(A–C) Confocal images of haustoriated plant cells marked by REM1.3. GFP:PexRD54 showed frequent perihaustorial puncta (A) unlike its ATG8 interaction motif mutant PexRD54AIM2 (B), which rarely labelled perihaustorial puncta and showed cytoplasmic distribution similar to GFP:EV (C). (D–F) In haustoriated cells marked by RFP:REM1.3, GFP:ATG8CL labelled autophagosomes fully overlapped with perihaustorial BFP:PexRD54 puncta (D). In contrast, BFP:PexRD54AIM2 mainly remained cytoplasmic and mostly did not show perihaustorial puncta that overlap with ATG8CL autophagosomes (E), similar to BFP:EV control (F). Images shown are maximum projections of 8, 12, 10, 8, 5, and 9 frames with 1 μm steps from top to bottom rows, respectively. White arrowheads point to haustoria. Scale bars, 10 μm. Images are obtained 3–4 dpi. (G) PexRD54/ATG8CL labelled autophagosomes accumulate across the EHM. Single focal plane CLSM images show regions where the EHM and the tonoplast (dotted line) are parted away and the cytosol is no longer a thin layer between the two membranes. Autophagosomes co-labelled by BFP:PexRD54 and GFP:ATG8CL associate with the EHM marked by RFP:REM1.3. Green arrowheads in overlay panel point to BFP:PexRD54 labelled autophagosomes that associate with the EHM marked by RFP:REM1.3. Scale bar, 10 μm.
Figure 5 with 1 supplement
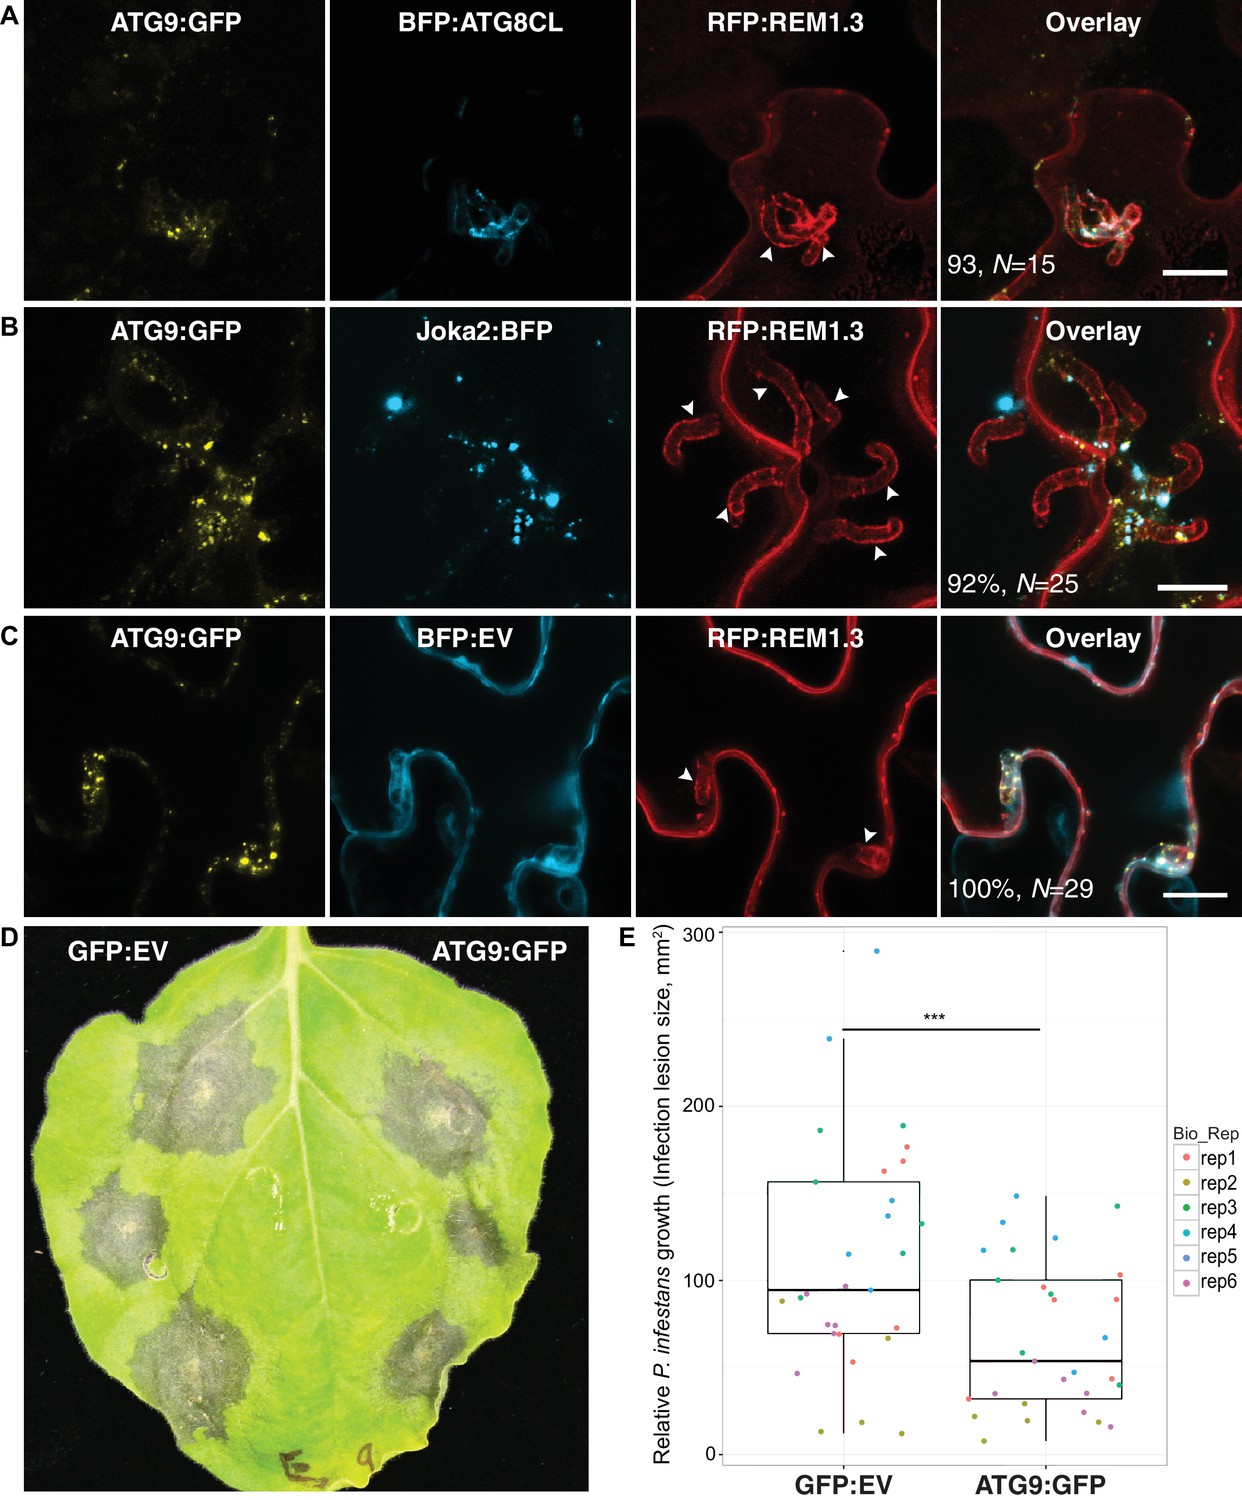
ATG9 accumulates around the haustoria and contributes to immunity.
(A–C) ATG9 localizes to ATG8CL-autophagosomes around the haustoria. ATG9:GFP labelled puncta frequently observed around the haustoria (>%92 of the imaged haustoria in (A), (B, C) which partially overlapped with the perihaustorial autophagosomes marked by BFP:ATG8CL and Joka2:BFP (A, B), but not with BFP:EV control (C). Images shown are maximal projections of 16, 15 and 7, frames with 1 μm steps from top to bottom panels, respectively. Arrowheads point to haustoria. Scale bars, 10 μm. Images are obtained three dpi.(d–e) ATG9 overexpression enhances disease resistance against P. infestans. (D) N. benthamiana leaves expressing on each half either ATG9:GFP or GFP empty vector (GFP:EV) control were infected with P. infestans and pathogen growth was determined by measuring infection lesion size eight days post-inoculation. (E) Categorical scatter plots illustrate infection lesion size of 6 infections sites (except rep2 with five infection sites) from six independent biological replicates pointed out by six different colours. ATG9 significantly (***p<0.01) enhanced disease resistance against P. infestans.
Figure 5—figure supplement 1
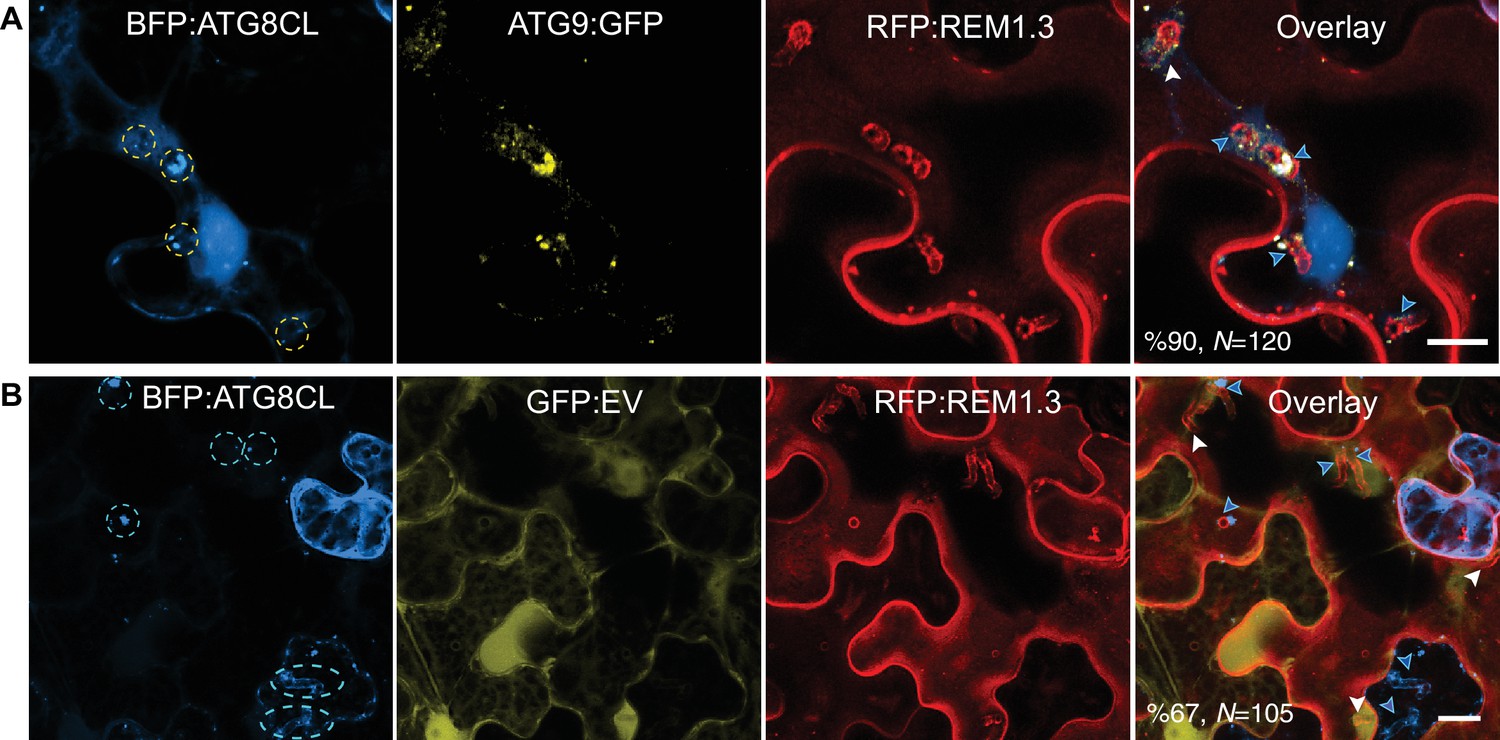
ATG9 overexpression enhances the frequency of haustoria that associate with ATG8CL-autophagosomes.
(A–B) The number of haustoria (marked by RFP:REM1.3) that associate with BGP:ATG8CL labelled autophagosomes substantially increases when ATG9:GFP is overexpressed (%90, N = 120) compared to GFP:EV control (%67, N = 105). Blue arrows point to haustoria that accommodate BFP:ATG8CL-autophagosomes whereas white arrows point to haustoria that lack BFP:ATG8CL-autophagosomes. Images shown are maximal projections of 10, and 22 frames with 1 μm steps from top to bottom rows, respectively. Scale bars, 10 μm.
Videos
Video 1
ATG8CL-autophagosomes accumulate around the haustoria and remain associated with the EHM.
GFP:ATG8CL is co-expressed with the EHM marker RFP:REM1.3 via agroinfiltration in N. benthamiana leaves infected with P. infestans. Confocal laser scanning microscopy was used to monitor the autophagosomes in haustoriated cells three dpi (days post infection). The movie represents time-lapse of maximal projections of 9 frames with 1.5 μm steps acquired during 15 min (Frame interval: 27 s).
Additional files
-
Supplementary file 1
Primers used in this study.
- https://doi.org/10.7554/eLife.37476.016
-
Transparent reporting form
- https://doi.org/10.7554/eLife.37476.017
Download links
A two-part list of links to download the article, or parts of the article, in various formats.
Downloads (link to download the article as PDF)
Open citations (links to open the citations from this article in various online reference manager services)
Cite this article (links to download the citations from this article in formats compatible with various reference manager tools)
Host autophagy machinery is diverted to the pathogen interface to mediate focal defense responses against the Irish potato famine pathogen
eLife 7:e37476.
https://doi.org/10.7554/eLife.37476


