Maturing Mycobacterium smegmatis peptidoglycan requires non-canonical crosslinks to maintain shape
- Harvard TH Chan School of Public Health, United States
- Harvard Medical School, United States
- National University of Singapore, Singapore
- Swiss Federal Institute of Technology in Lausanne, Switzerland
- Texas A&M University, United States
- Yale University School of Medicine, United States
Figures
Figure 1 with 4 supplements
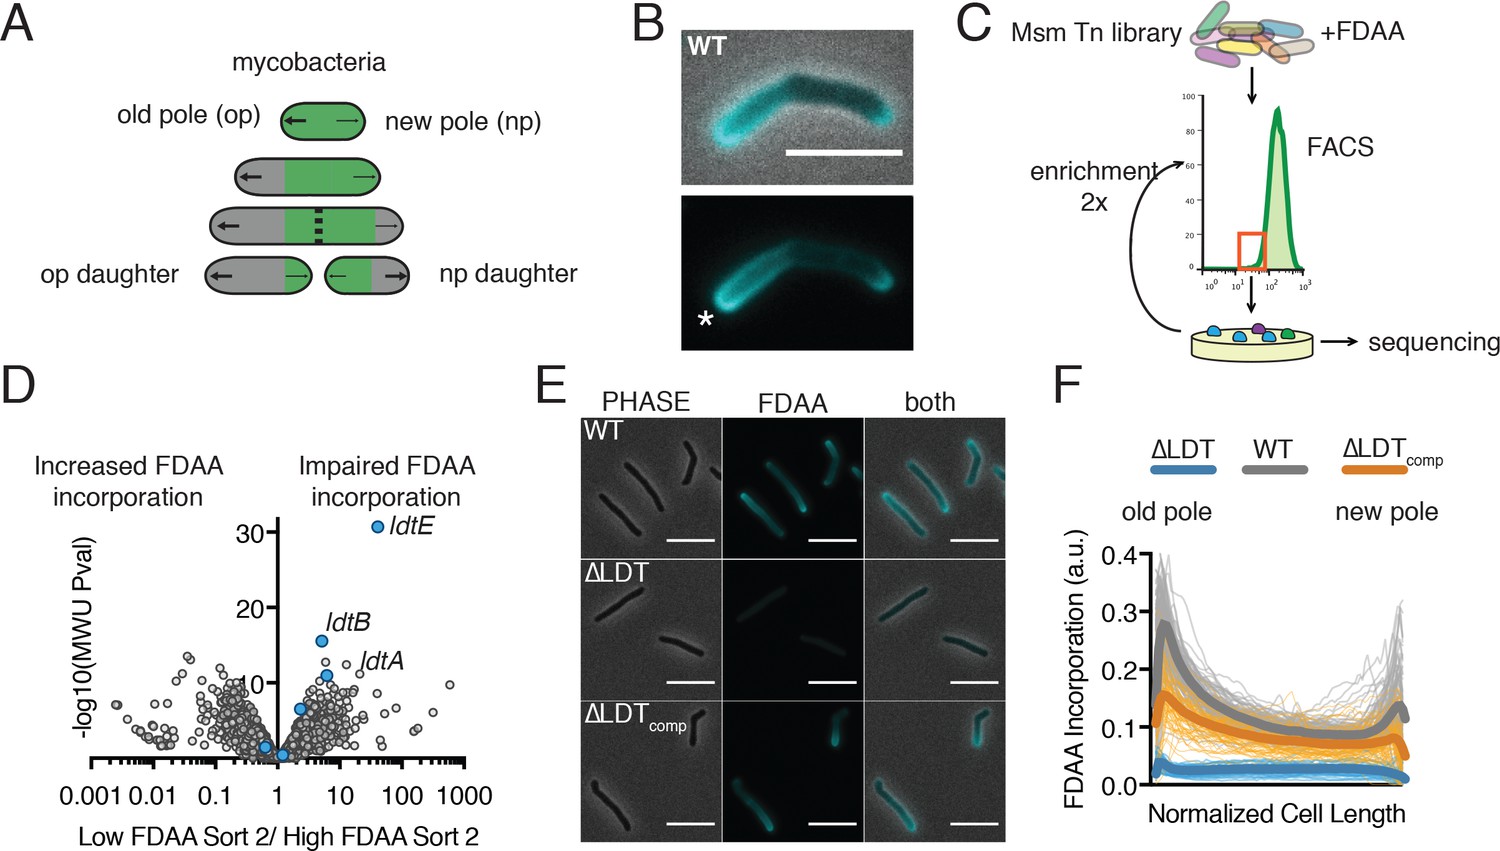
FDAAs are incorporated asymmetrically by L,D-transpeptidases.
(A) Schematic of mycobacterial asymmetric polar growth. Green, old cell wall; grey, new material; dotted line, septum; large arrows, old pole growth; small arrows, new pole growth. (B) FDAA incorporation in log-phase WT Msm cell after 2 min incubation. Scale bar = 5 µm. Old pole marked with (*). (C) Schematic of Fluorescence Activated Cell Sorting (FACS)-based FDAA transposon library enrichment. An Msm transposon library was stained with FDAAs, the dimmest and brightest cells were sorted, grown, sorted again to enrich for transposon mutants that are unable or enhanced for FDAA incorporation. (D) Results from 1C screen. For each gene, the contribution to low or high staining population was calculated from transposon reads per gene. Plotted is the ratio of the population contribution from the second sort of low FDAA staining (L2) over the second sort of high FDAA staining (H2) cells compared to the Mann-Whitney U p-value. (E) Representative image of FDAA incorporation in log-phase WT, ∆LDT and ∆LDTcomp cells. Scale bar = 5 μm. (F) Profiles of FDAA incorporation in log-phase WT (N = 98), ∆LDT (N = 40), and ∆LDTcomp (N = 77) cells. Thick lines represent mean incorporation profile, thin lines are FDAA incorporation in single cells.
-
Figure 1—source data 1
FDAA FACs screen data used for Figure 1D.
- https://doi.org/10.7554/eLife.37516.009
-
Figure 1—source data 2
FDAA incorporation distribution data used for Figure 1F.
- https://doi.org/10.7554/eLife.37516.010
Figure 1—figure supplement 1
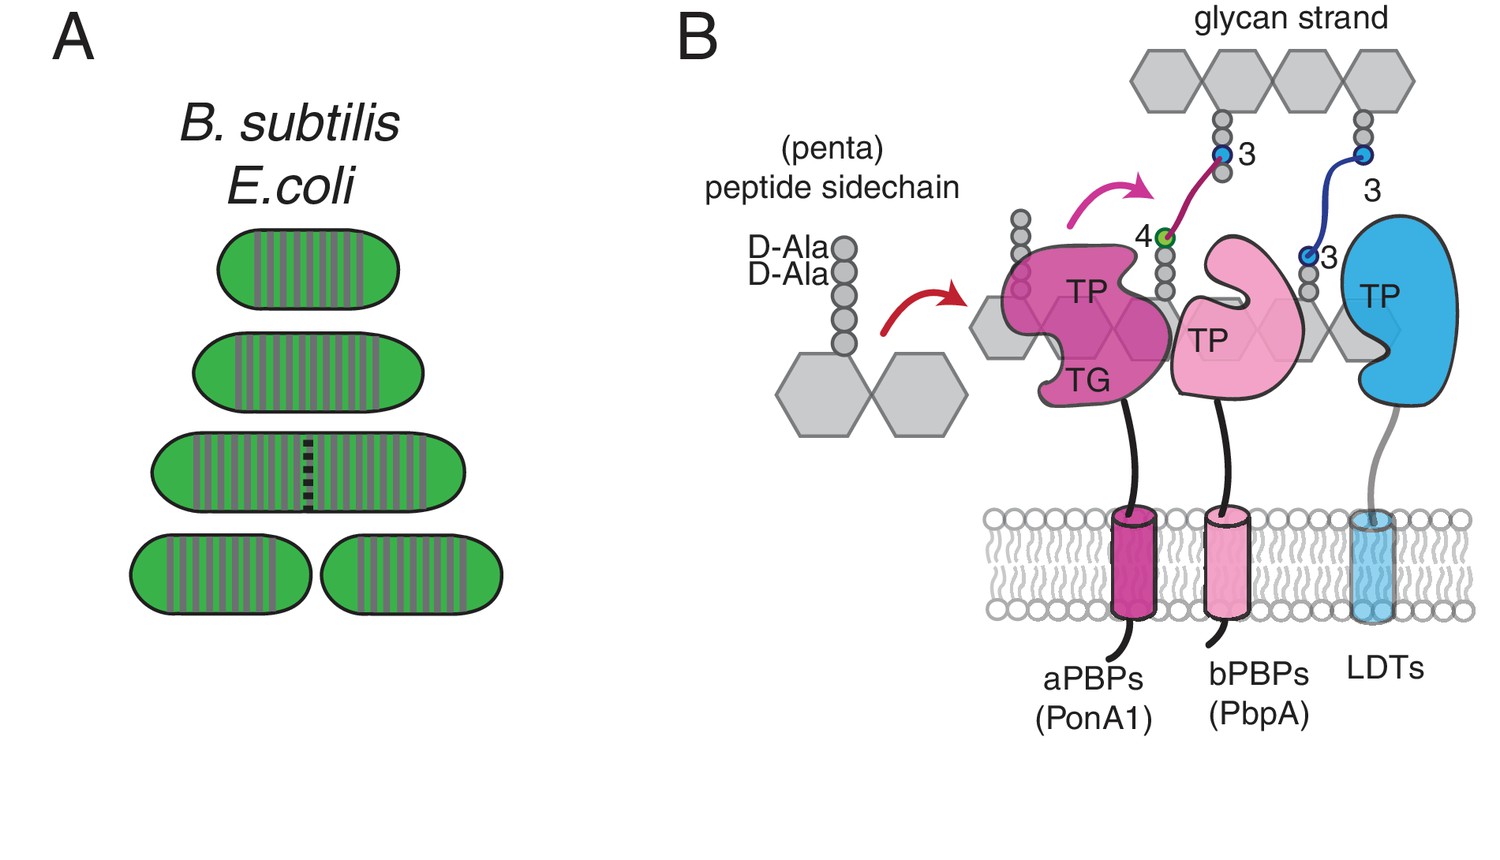
Peptidoglycan synthesis overview.
(A) Escherichia coli and Bacillus subtilis lateral cell wall growth. Unlike mycobacteria, E. coli and B. subtilis insert new cell wall along the lateral cell body, mixing old and new peptidoglycan. Green portion represents old cell wall; grey portion represents new material. (B) Cartoon of penicillin-binding proteins (PBPs), L,D-transpeptidases (LDTs), and both 4–3 and 3–3 crosslinking. PBPs utilize a pentapeptide substrate found on new peptidoglycan, ending in D-Alanine-D-Alanine. Class A PBPs (aPBPs), like PonA1, have ability to polymerize glycan strands (transglycosylation) and to crosslink (transpeptidation). Class B PBPs (bPBPs) are only capable of transpeptidation. LDTs utilize a tetrapeptide substrate found on processed peptidoglycan. TP, transpeptidase; TG, transglycosylase.
Figure 1—figure supplement 2
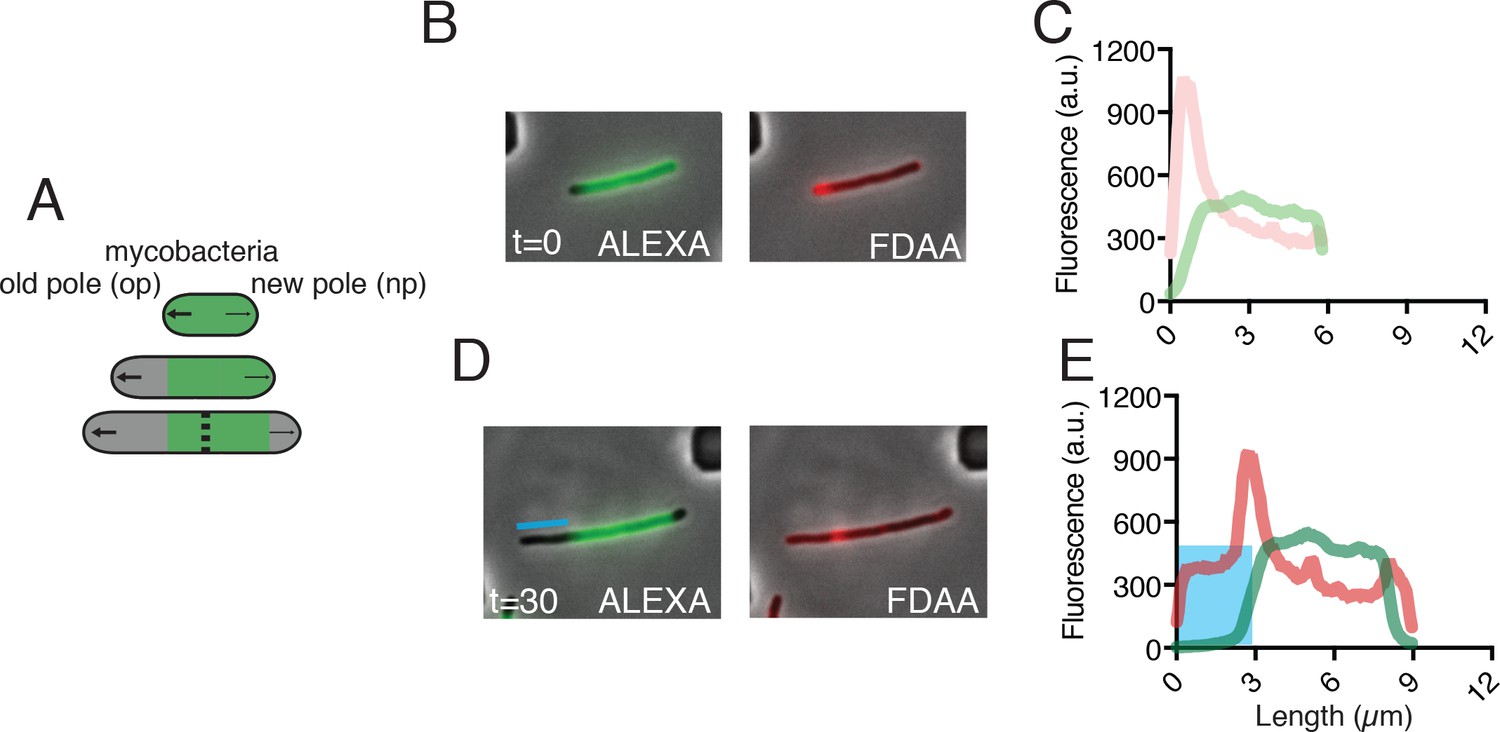
Time-lapse microscopy maps FDAA incorporation pattern to old and new poles.
(A) Schematic of asymmetric polar growth in mycobacteria, where green portion corresponds to Alexa FluorTM 488 NHS ester (ALEXA) stained cell wall, and grey portion represents outgrowth of new, unstained cell wall. (B) Image of WT Msm cell stained with ALEXA and FDAA at time = 0 min. (C) Graph quantifying FDAA and ALEXA incorporation along the length of the cell in (B). (D) Image of the same cell as (B) at 30 min. The blue line highlights the growth from the old pole. (E) As in C, a graph of the distribution of FDAA and ALEXA. The blue box corresponds to the blue line in (D), where the old pole has grown out.
-
Figure 1—figure supplement 2—source data 1
Fluorescence values for panels C and E.
- https://doi.org/10.7554/eLife.37516.006
Figure 1—figure supplement 3
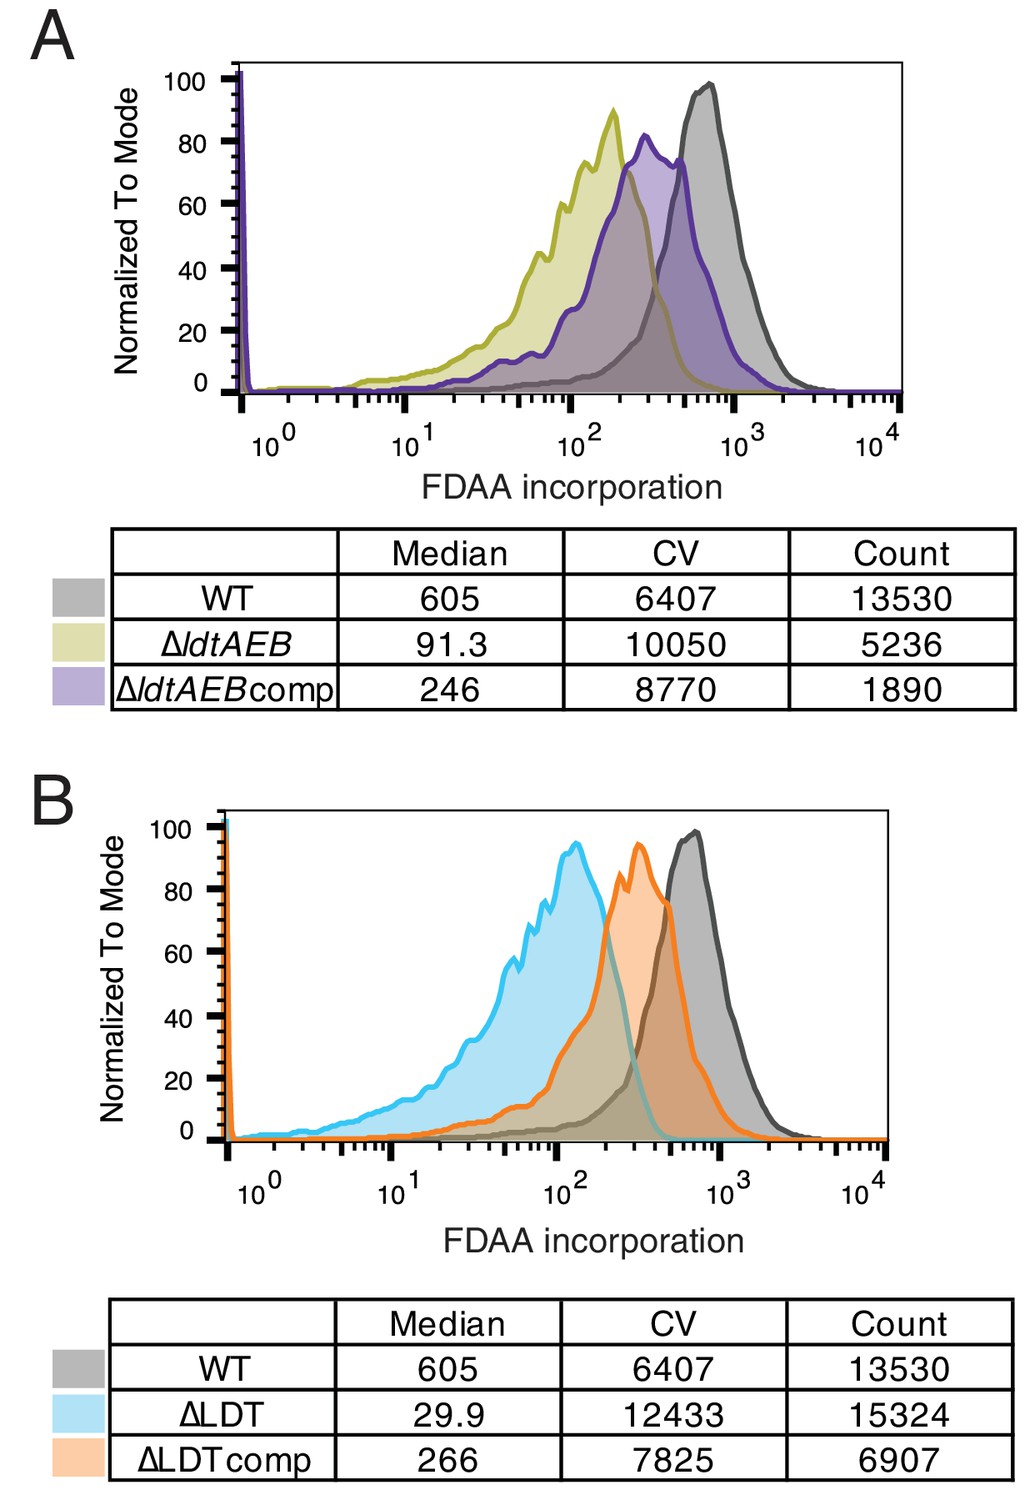
Fluorescent D-amino acid screen validation.
(A) FDAA incorporation in WT, ∆ldtAEB, and ∆ldtAEB complemented with LdtE-mRFP as measured by flow cytometry. (B) FDAA incorporation in WT, ∆LDT, and ∆LDT complemented with LdtE-mRFP (∆LDTcomp).
Figure 1—figure supplement 4
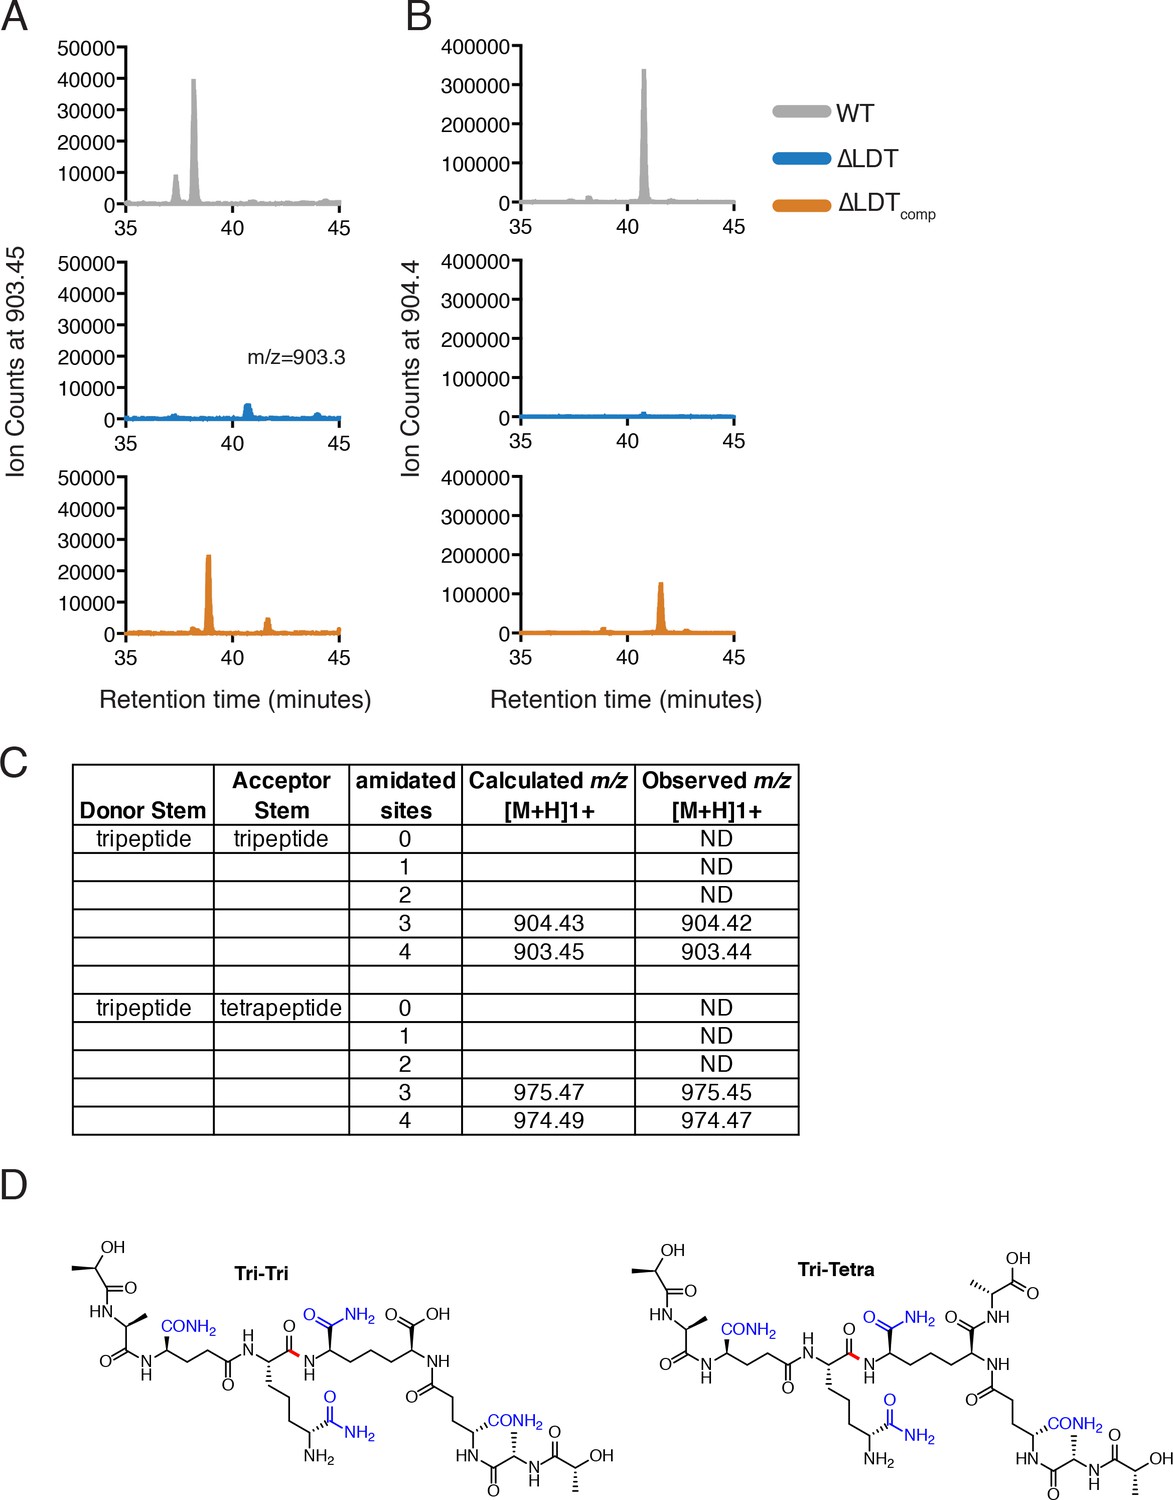
3–3 crosslinks are not detectable in ∆LDT cells.
Peptidoglycan from M. smegmatis ∆LDT cells was isolated, hydrolyzed in NH4OH, and analyzed by LC-MS/MS (see Materials and methods). Peaks corresponding to 3–3 crosslinks were identified by mass (Kumar et al., 2012). (A,B) Extracted ion chromatograms of 3–3 crosslinks from WT, ∆LDT and ∆LDTcomp peptidoglycan where both donor and acceptor stems are tripeptides. (C) Table of observed 3–3 crosslink masses. ND = not detected. (D) Proposed structures of the detected 3–3 crosslinks with all four possible sites of amidation shown in blue. Tri-tri refers to the 3–3 crosslink where both donor and acceptor peptides are tripeptides (903.45; with three sites amidated- 904.43). Tri-tetra refers to the 3–3 crosslink where the donor stempeptide is a tripeptide, and the acceptor is a tetrapeptide (974.49; with three sites amidated- 975.47). The crosslink amide bond is shown in red.
Figure 2 with 4 supplements
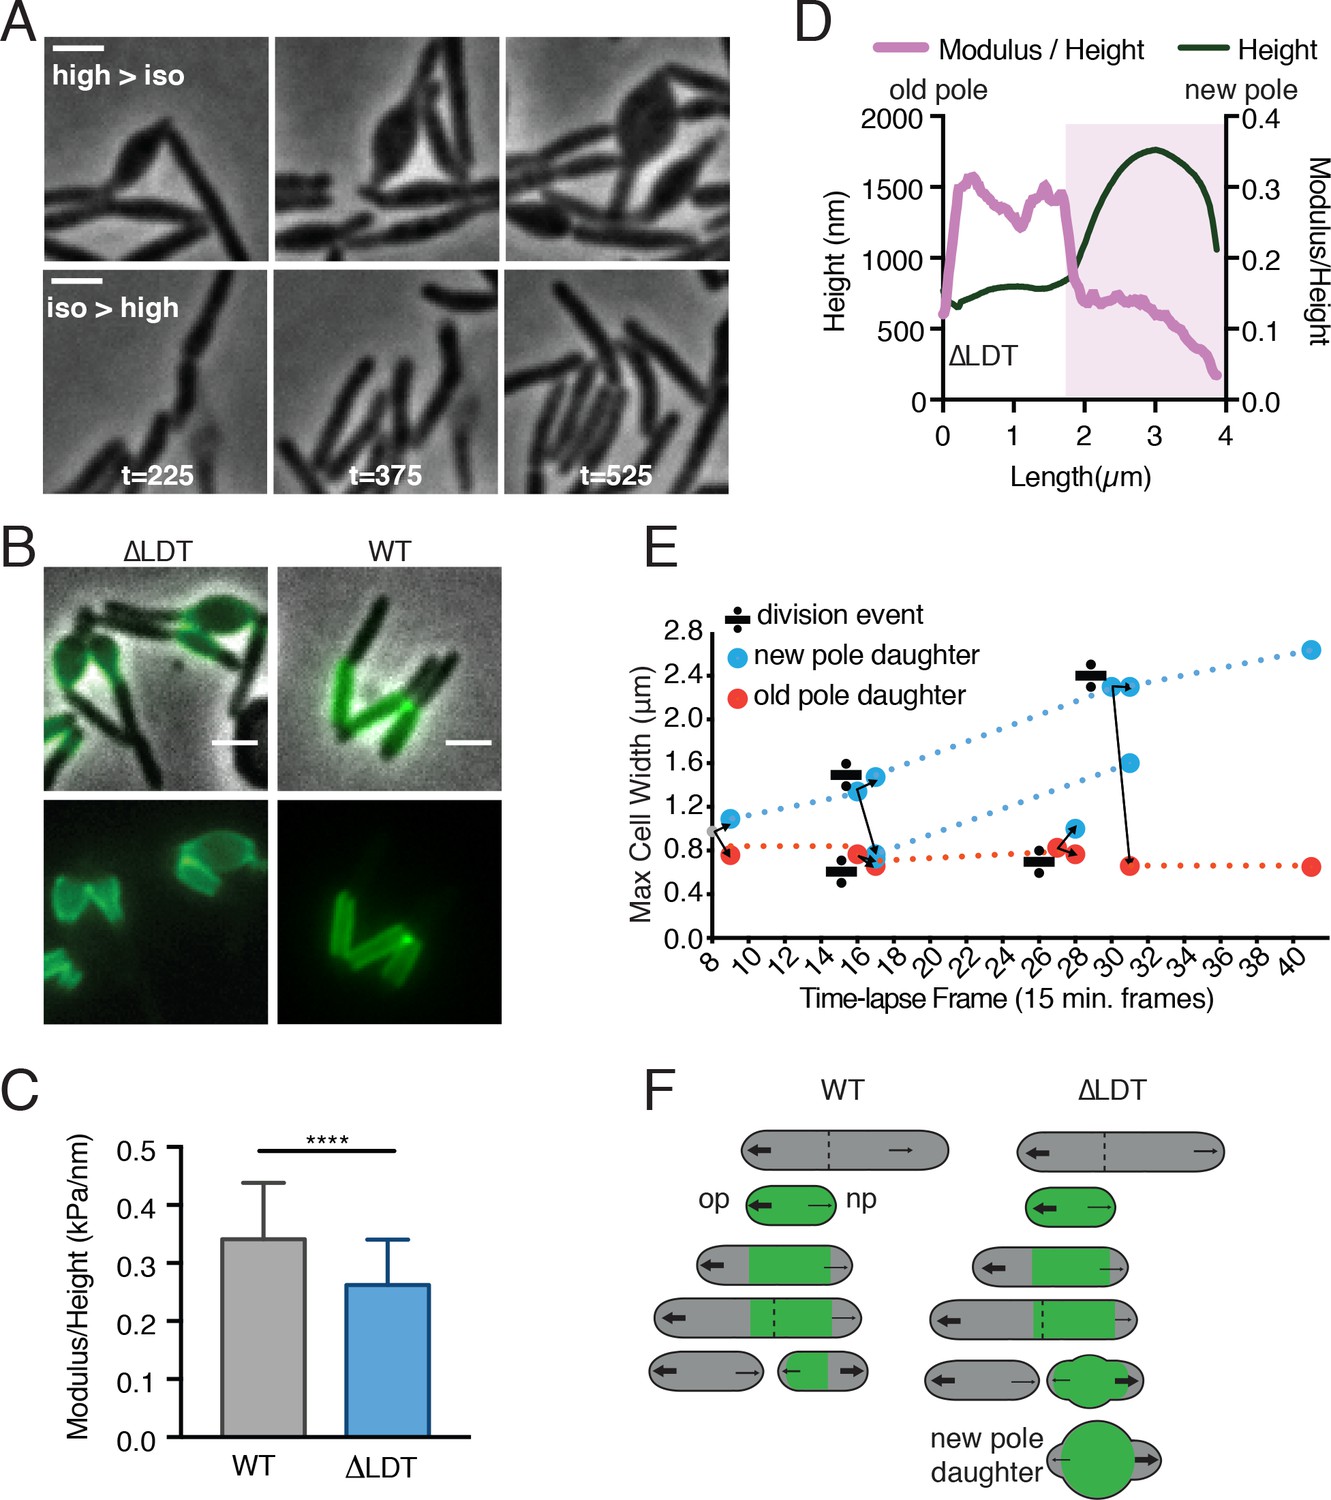
3–3 crosslinks are required for rod shape maintenance at aging cell wall.
(A) Msm ∆LDT time-lapse microscopy of cells switched from high- to iso- osmolar media (top row, see Figure 2—video 1), or iso- to high osmolar media (bottom row, see Figure 2—video 2). (high = 7H9+150 mM sorbitol; iso = 7H9). t = time in minutes post-osmolarity switch. (B) ∆LDT or WT cells were stained with Alexa 488 NHS-ester (green) to mark existing cell wall, washed, and visualized after outgrowth (unstained material). A, B scale bar = 2 µm. (C) Mean stiffness of WT (N = 73) and ∆LDT (N = 47) Msm cells as measured by atomic force microscopy. Mann-Whitney U p-Value ****<0.0001. (D) Representative profile of cell height and height-normalized stiffness (modulus/height) in a single ∆LDT cell. Pink-shaded portion highlights location of a bleb. (E) Maximum cell width of ∆LDT cell lineages over time. Width of new pole daughters = blue circle; width of old pole daughters = orange circle. Division signs denote a division event. At each division, there are two arrows from the dividing cell leading to the resulting new and old pole daughter cell widths (blue and orange respectively). (F) Model of rod shape loss in old cell wall of ∆LDT cells compared to WT. Green portions of the cell represents old cell wall; grey portion represents new cell wall. The larger arrows indicate more growth from the old pole, while smaller arrows show less relative growth from the new pole. Dotted lines represent septa. op = old pole, np = new pole.
-
Figure 2—source data 1
Modulus (kPa)/Height (nm) for WT and ∆LDT cells used for Figure 2C.
- https://doi.org/10.7554/eLife.37516.014
-
Figure 2—source data 2
Modulus and height for the representative ∆LDT cell corresponding to Figure 2D.
- https://doi.org/10.7554/eLife.37516.015
Figure 2—figure supplement 1
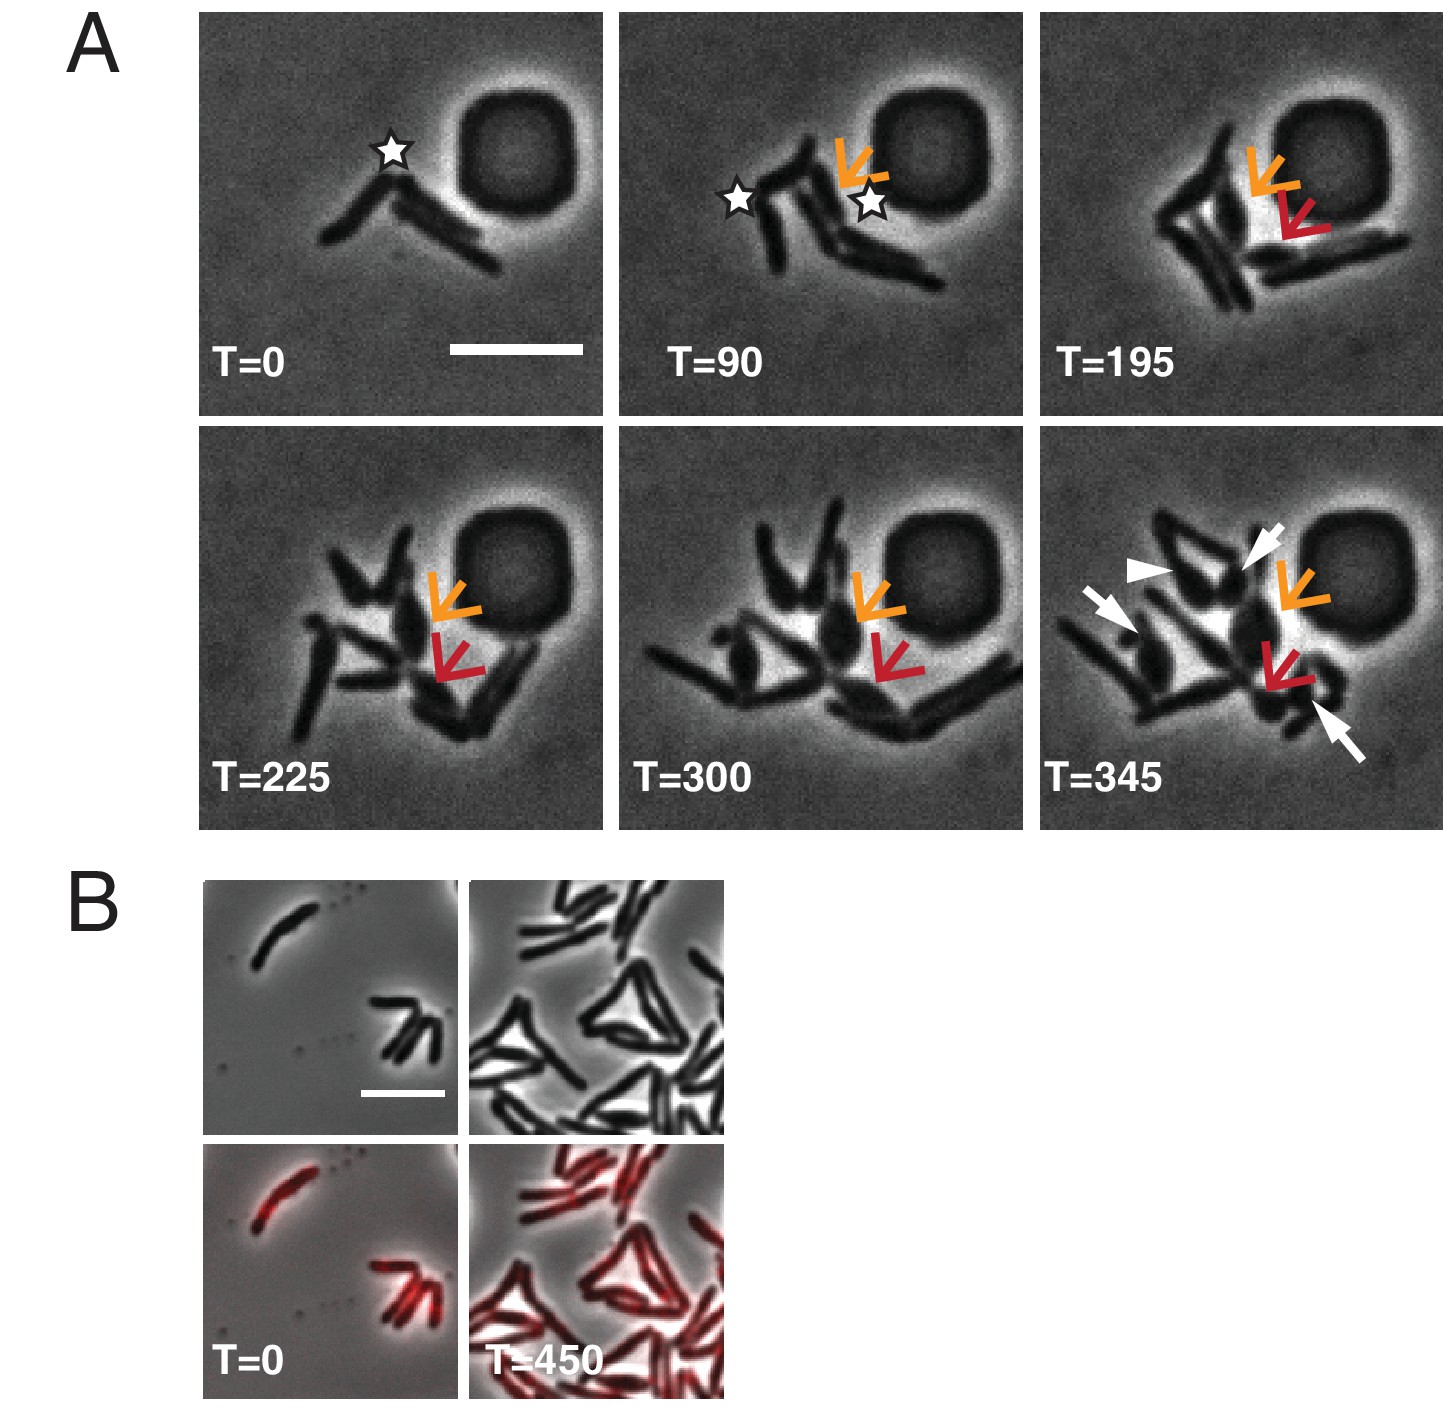
∆LDT cell morphological characteristics.
(A) Time-lapse microscopy montage of ∆LDT cells. The white stars mark new poles. The orange arrow points to the first new pole daughter cell of this series. The red arrow indicates the second resulting new pole daughter cell. In the last frame, white arrows point to all new pole daughter cells (besides the orange arrow and red arrow). (B) Time-lapse microscopy montage of ∆LDTcomp cells expressing LdtE-mRFP. All scale bars = 5 μm.
Figure 2—figure supplement 2
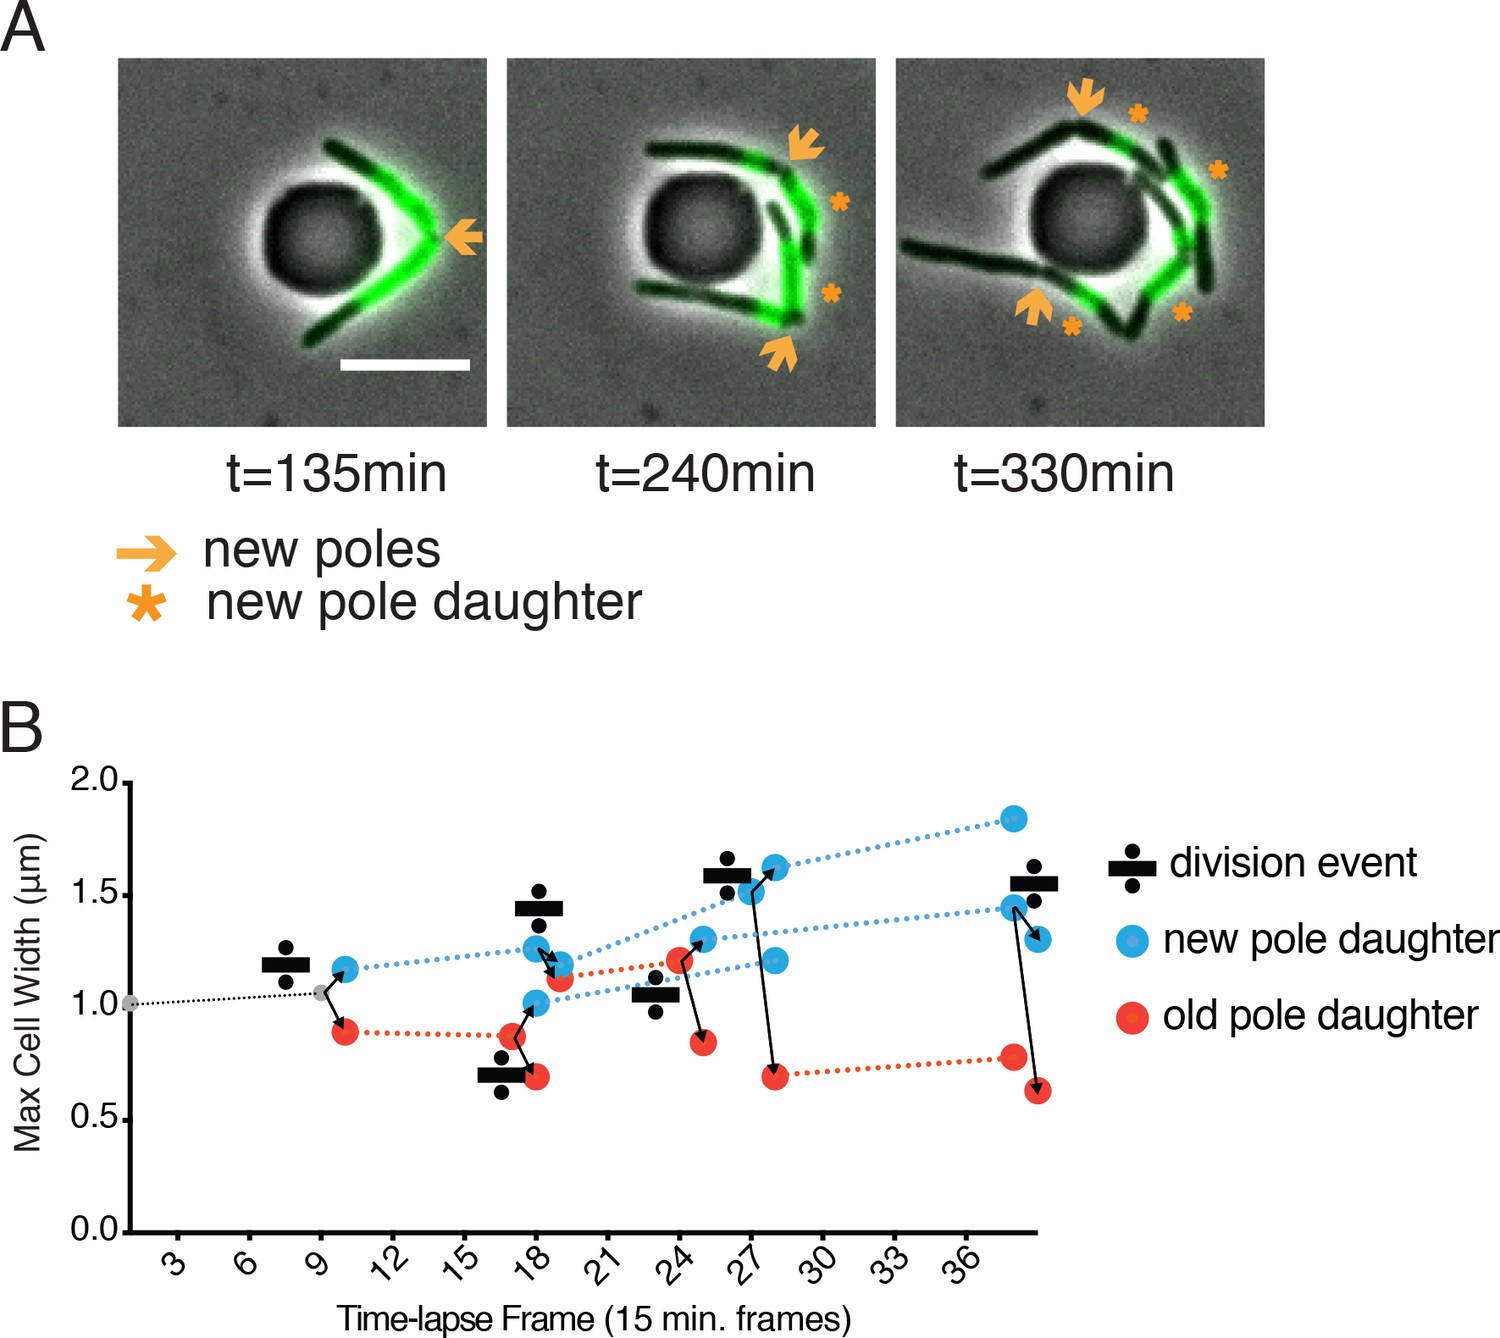
Inheritance of old cell wall and occurrence of blebs in new pole daughter cells.
(A) WT Msm stained with Alexa FluorTM 488 NHS ester, washed and visualized over time. New material is unstained, old material is stained green. Orange arrows indicate a new pole. Orange stars mark new pole daughter cells. All scale bars = 5 μm. (B) Maximum cell width of ∆LDT cell lineages over time. Width of new pole daughters = blue circle; width of old pole daughters = orange circle. Division signs denote a division event. At each division, there are two arrows from the dividing cell leading to the resulting new and old pole daughter cell widths (blue and orange, respectively).
Figure 2—video 1
Time-lapse of ΔLDT cells in iso-osmolar media.
This video corresponds to Figure 2A (top). This is a time-lapse microscopy video of ΔLDT Msm cells growing in 7H9 (iso-osmolar) media. Frames are 15 min apart, and the video is 5 frames/s.
Figure 2—video 2
Time-lapse of ΔLDT cells in high-osmolar media.
This video corresponds to Figure 2A (bottom). This is a time-lapse microscopy video of ΔLDT Msm cells growing in 7H9 + 150 mM sorbitol (high-osmolar) media. Frames are 15 min apart, and the video is 5 frames/s.
Figure 3 with 1 supplement
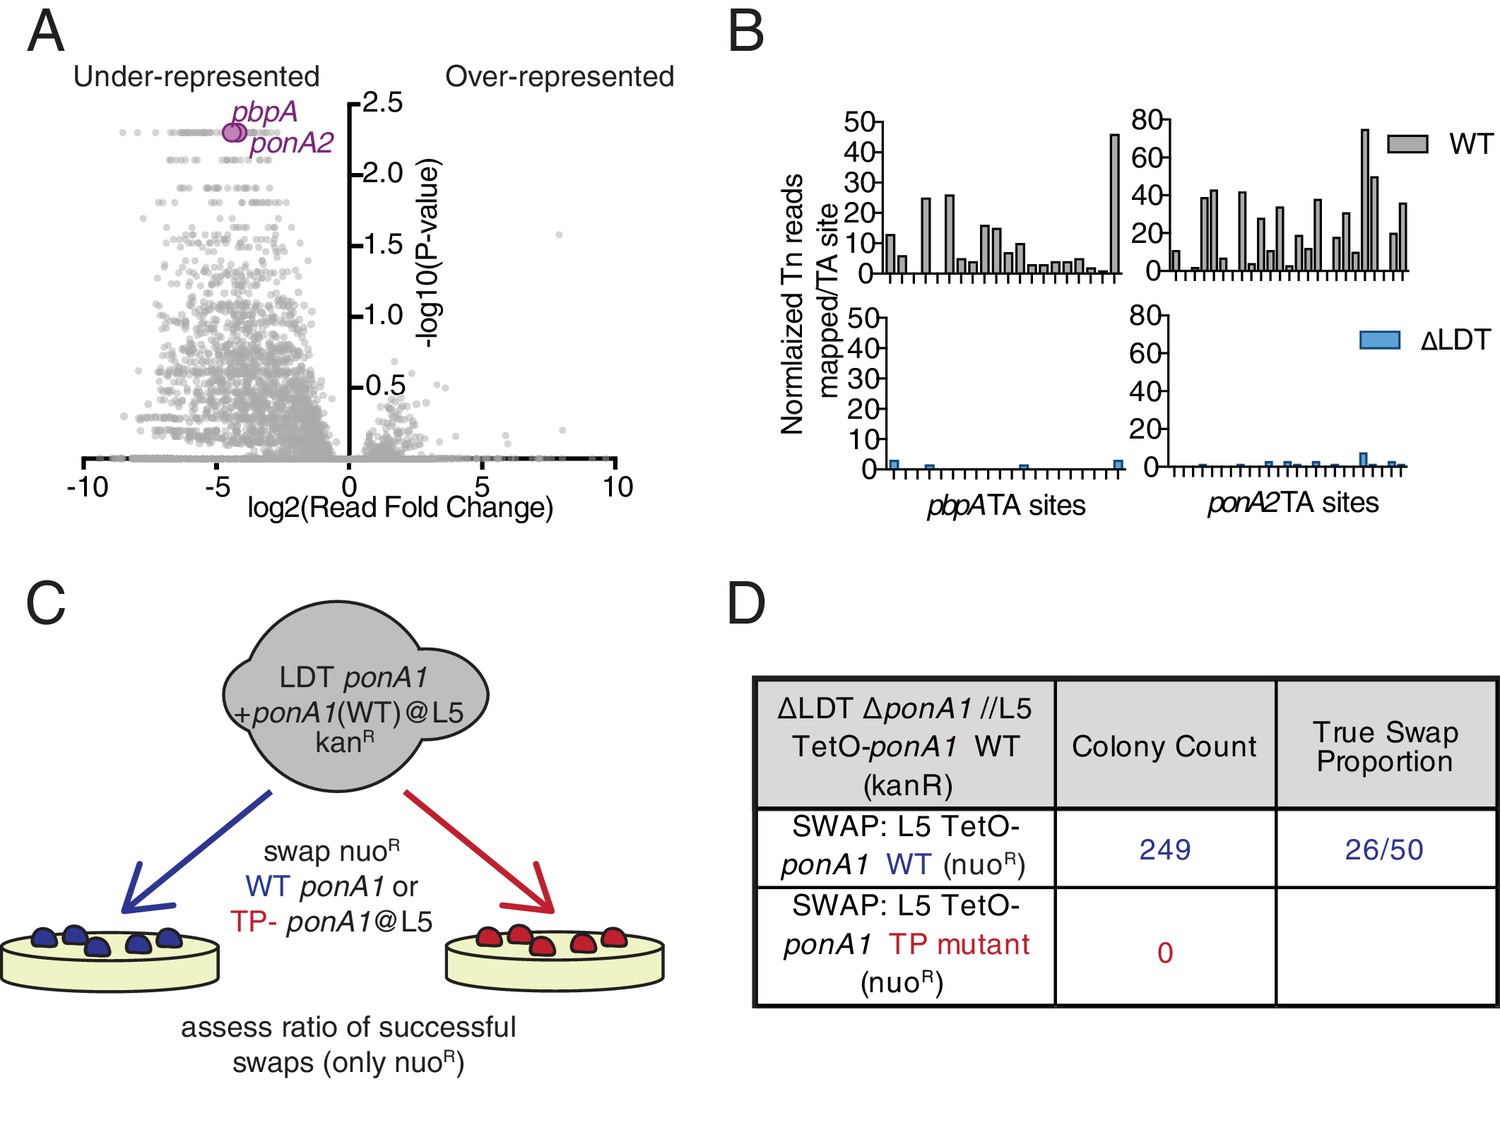
Mycobacterium smegmatis is hypersensitive to PBP inactivation in the absence of LDTs.
(A) Fold change in the number of reads for transposon insertion counts in ∆LDT cells compared to WT Msm. p-value is derived from a rank sum test (DeJesus et al., 2015). (B) Transposon insertions per TA dinucleotide in pbpA and ponA2 in WT (grey) and ∆LDT (blue) cells. (C) Schematic of L5 allele swapping experiment. (D) Results of WT or transpeptidase null ponA1 allele swapping experiment in ∆LDT cells.
-
Figure 3—source data 1
∆LDT Tnseq data used for Figure 3A.
Below are the column names with a brief description-. Orf - ID of gene. Name - name of gene. Desc - annotation of gene. Sites - number of TA sites in gene. Mean Ctrl - mean insertion count averaged over TA sites and replicates for wild-type strain (mc2155). Mean Exp - mean insertion count averaged over TA sites and replicates for knockout strain (ΔLDT)log2FC - log-fold-change, log2(meanExp/meanCtl). Sum Ctrl - sum of insertion counts over TA sites and replicates for wild-type strain (mc2155). Sum Exp - sum of insertion counts over TA sites and replicates for knockout strain (ΔLDT). Delta Sum - difference of sums (sumExp-sumCtl) p-value - probability of null hypothesis (i.e. no significant difference between strains) estimated from resampling distribution. Adj. p-value - p-values after applying Benjamini-Hochberg correction for multiple tests.
- https://doi.org/10.7554/eLife.37516.020
-
Figure 3—source data 2
Read counts per TA site in WT and ∆LDT cells for ponA2 and pbp2 used in Figure 3B.
- https://doi.org/10.7554/eLife.37516.021
Figure 3—figure supplement 1
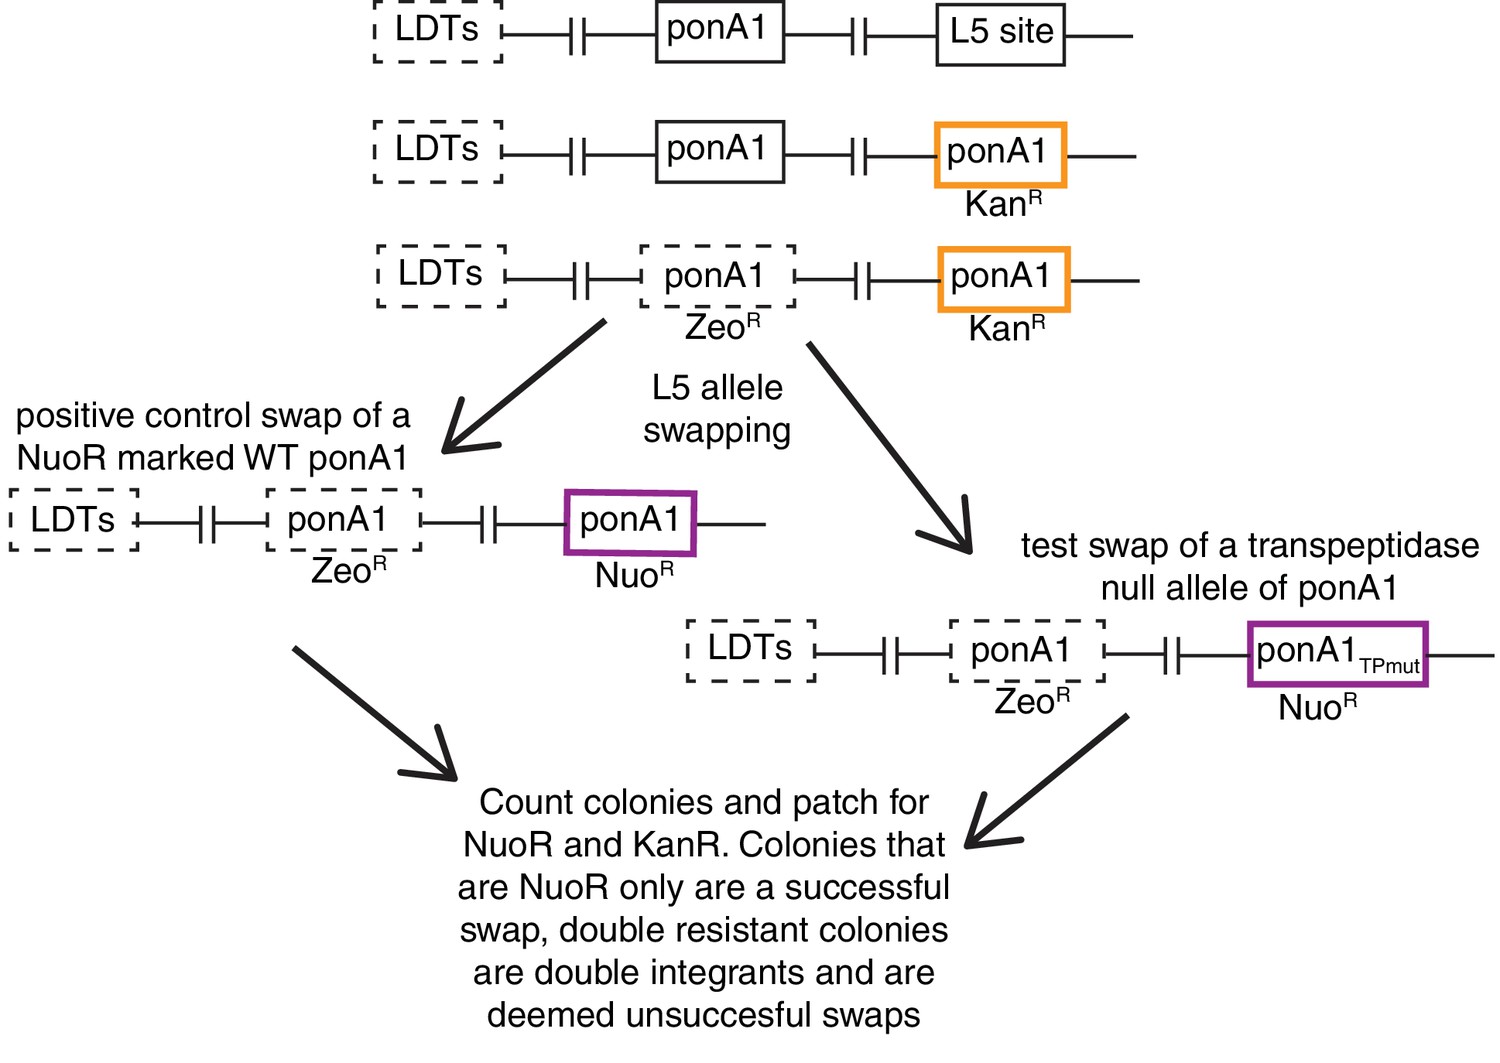
L5 allele swapping to test essentiality of PonA1’s ability to form 4 to 3 crosslinks (transpeptidation).
(A) Schematic of L5 allele swapping experiment. Adapted from (Kieser et al., 2015b).
Figure 4 with 6 supplements
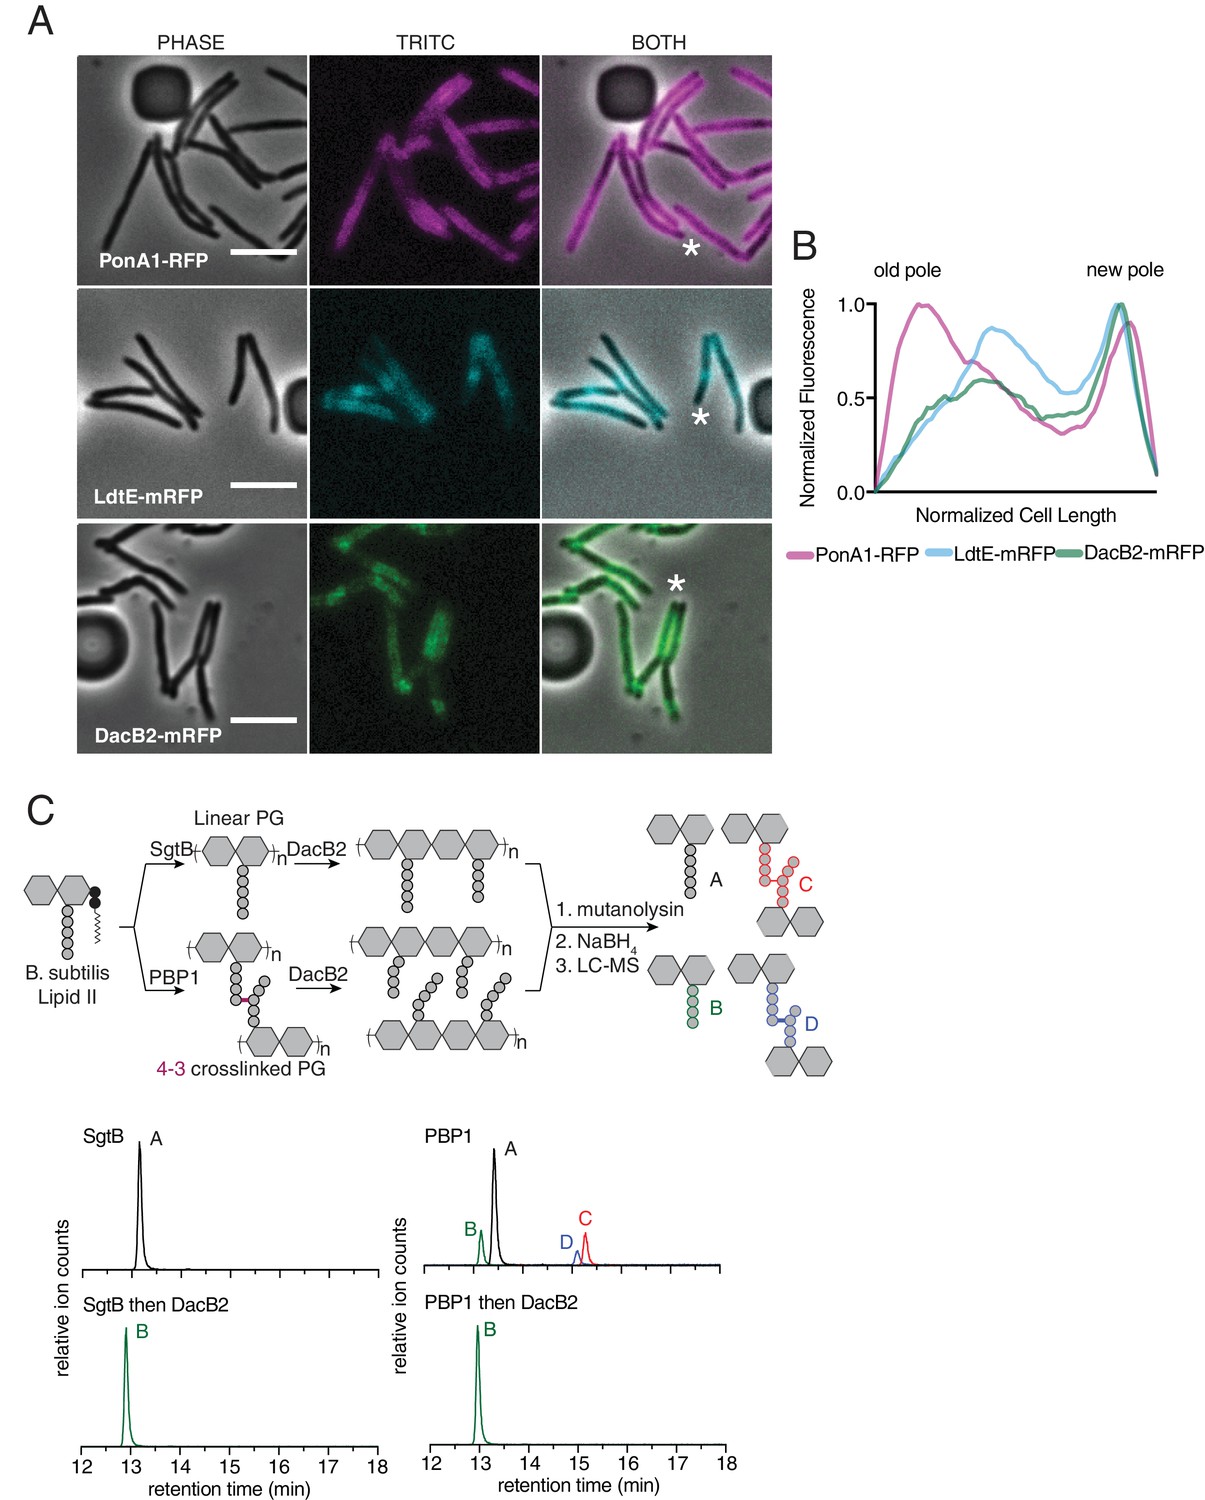
Peptidoglycan synthesizing enzymes localize to differentially aged cell wall.
(A) Representative fluorescence image of PonA1-RFP (magenta, see Figure 4—video 1), LdtE-mRFP (cyan, see Figure 4—video 2), and DacB2-mRFP (green, see Figure 4—video 3). Scale bars = 5 µm. (B) Average PonA1-RFP (N = 24), LdtE-mRFP (N = 23) or DacB2-mRFP (N = 23) distribution in cells before division. (C) Schematic of the in vitro experiment to test D,D-carboxy- and D,D-endopeptidase activity of DacB2 (top). Lipid II extracted from B. subtilis is first polymerized into linear (using SgtB) or crosslinked (using B. subtilis PBP1) peptidoglycan and then reacted with DacB2. The reaction products are analyzed by LC-MS. Extracted ion chromatograms of the reaction products produced by incubation of DacB2 with peptidoglycan substrates (bottom).
-
Figure 4—source data 1
Fluorescence distributions used for Figure 4B.
- https://doi.org/10.7554/eLife.37516.028
Figure 4—figure supplement 1
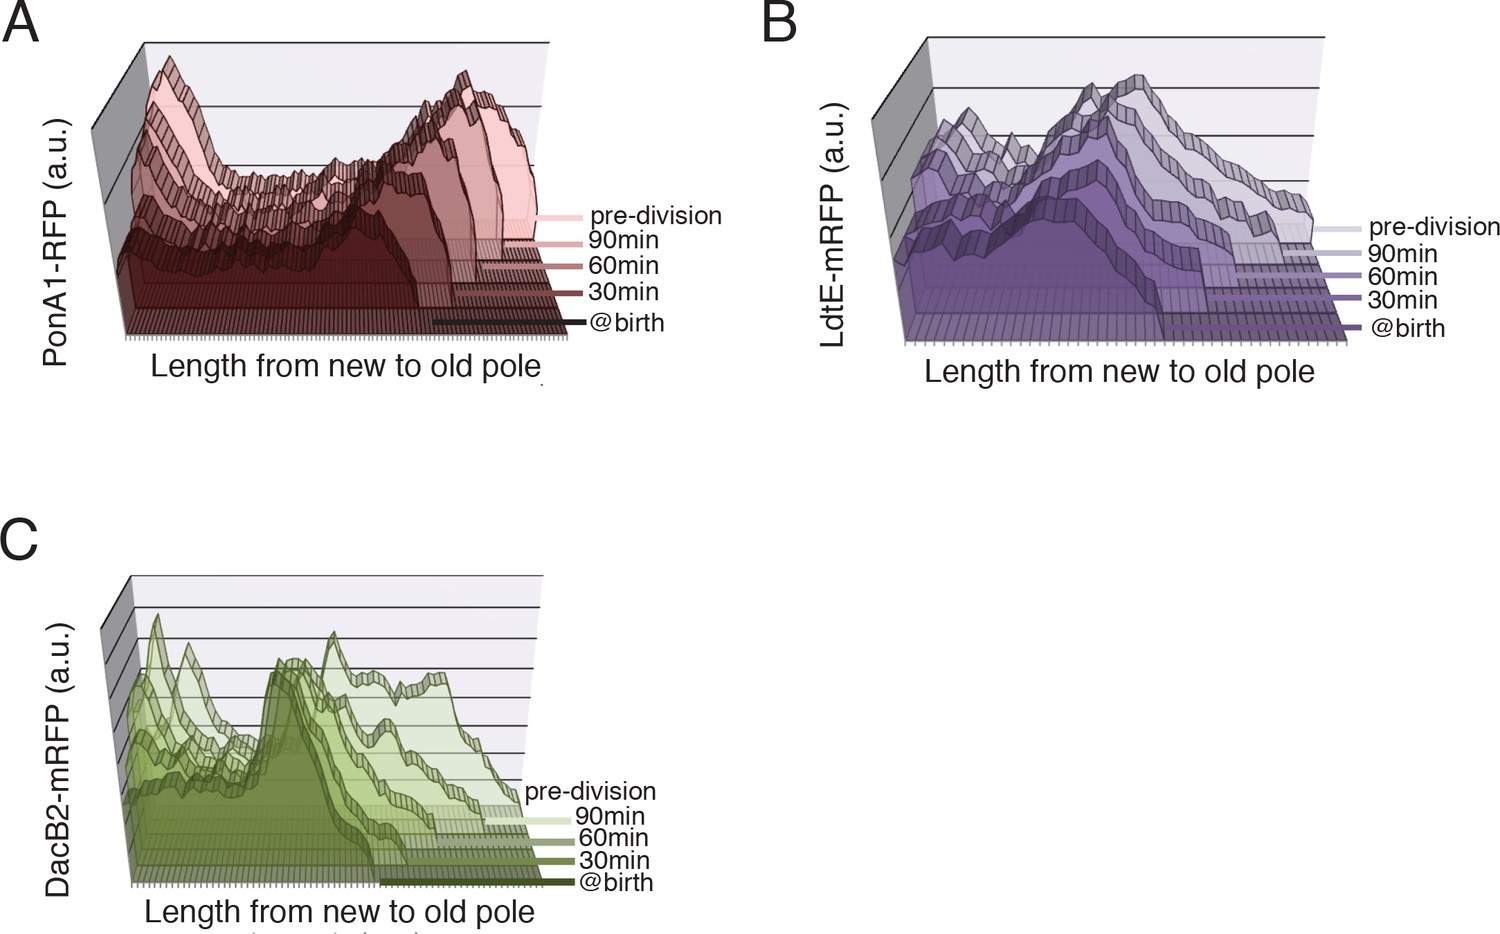
PG synthetic enzyme localization at birth, 30, 60 and 90 min post-birth and at the frame before division (pre-division) in a representative cell.
(A) Distribution of PonA1-RFP, (B) LdtE-mRFP, and (C) DacB2-mRFP.
-
Figure 4—figure supplement 1—source data 1
Fluorescence distributions used for Figure 4—figure supplement 1A–C.
- https://cdn.elifesciences.org/articles/37516/elife-37516-fig4-figsupp1-data1-v2.xlsx
Figure 4—figure supplement 2
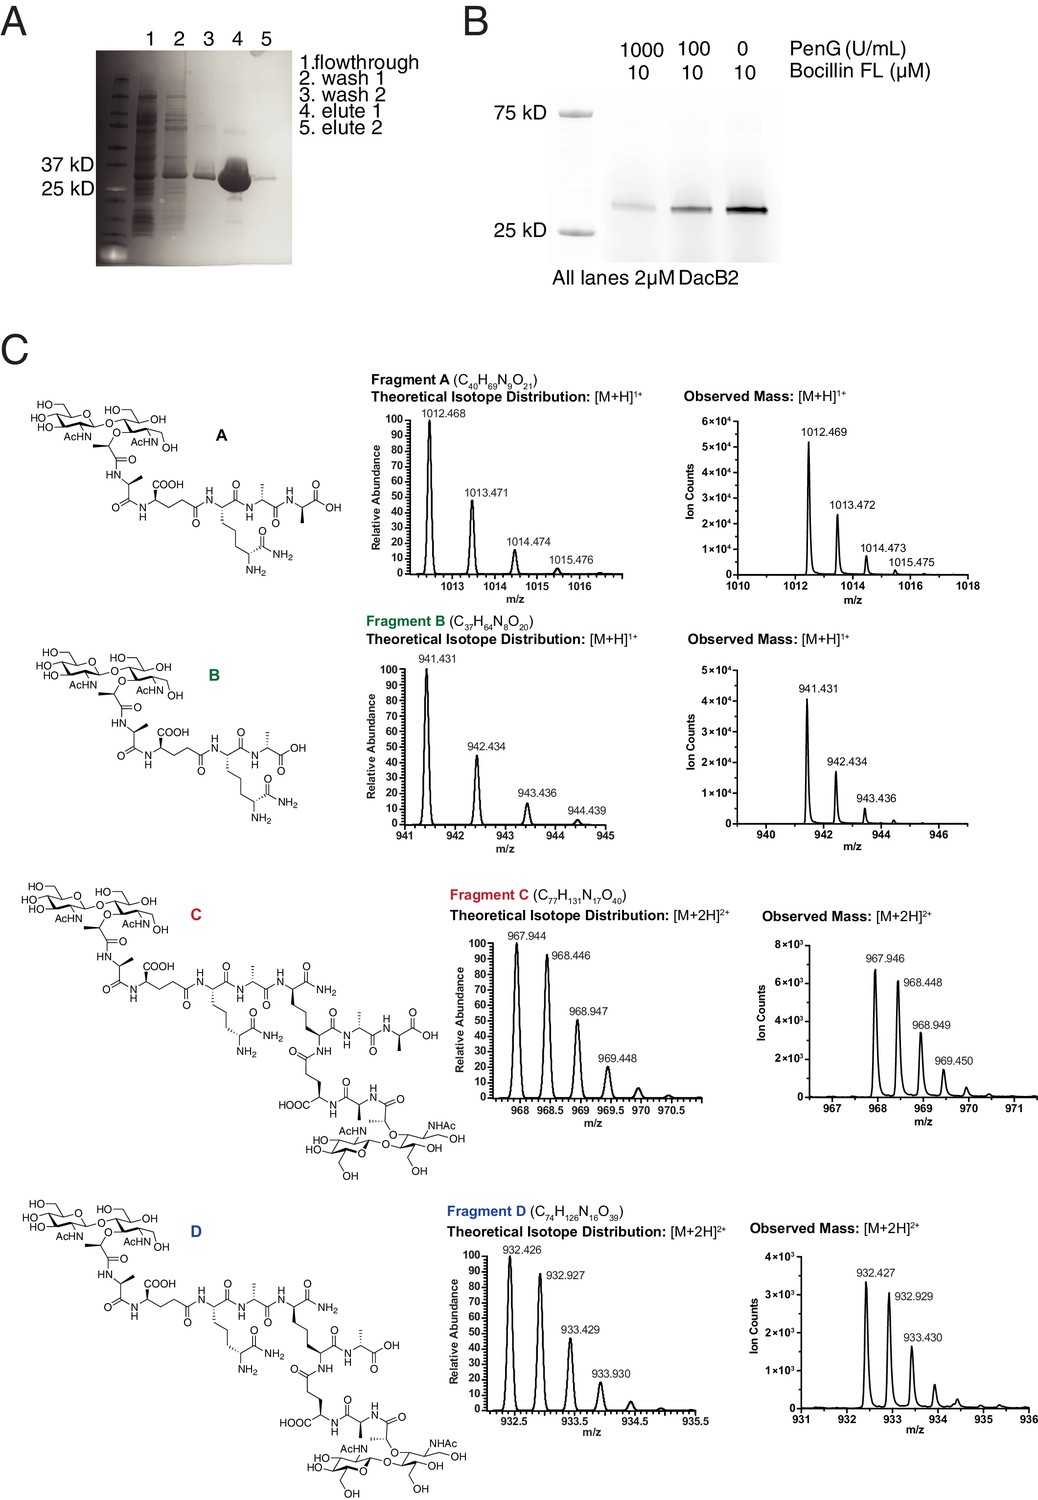
MSMEG_2433 (DacB2) functions as a D,D-carboxypeptidase and D,D-endopeptidase in vitro.
(A) Coomassie-stained gel of purified His6-DacB2. (B) Bocillin-FL and Penicillin G binding assay of purified DacB2. (C) Mass spectra of the reaction products of DacB2 digestion reactions.
Figure 4—figure supplement 3

CRISPRi knock-down of dacB2 in Msm lacking LDTs reduces bleb size.
An anhydro-tetracycline (aTc)-inducible guide RNA targeting dacB2 was cloned into Msm containing a dCas9 as described previously (Rock et al., 2017). Bleb size was measured in ∆LDT cells without the dacB2 targeting guide RNA (grey) as well as ∆LDT cells with (+aTc) and without (-aTc) induction of the guide RNA. Mann-Whitney U test p-value=0.0070.
-
Figure 4—figure supplement 3—source data 1
Measurements of bleb width for Figure 4—figure supplement 3.
Alexa 488 NHS ester and FDAA incorporation used for Figure 1—figure supplement 2C,E.
- https://doi.org/10.7554/eLife.37516.027
Figure 4—video 1
Time-lapse of ponA1-RFP.
This video corresponds to Figure 4A,B. This is a time-lapse microscopy video of Msm cells expressing ponA1-RFP growing in 7H9 media. Frames are 15 min apart, and the video is 5 frames/second.
Figure 4—video 2
Time-lapse of ldtE-mRFP.
This video corresponds to Figure 4A,B. This is a time-lapse microscopy video of Msm cells expressing ldtE-mRFP growing in 7H9 media. Frames are 15 min apart, and the video is five frames/second.
Figure 4—video 3
Time-lapse of dacB2-mRFP.
This video corresponds to Figure 4A,B. This is a time-lapse microscopy video of Msm cells expressing dacB2-mRFP growing in 7H9 media. Frames are 15 min apart, and the video is 5 frames/second.
Figure 5 with 2 supplements
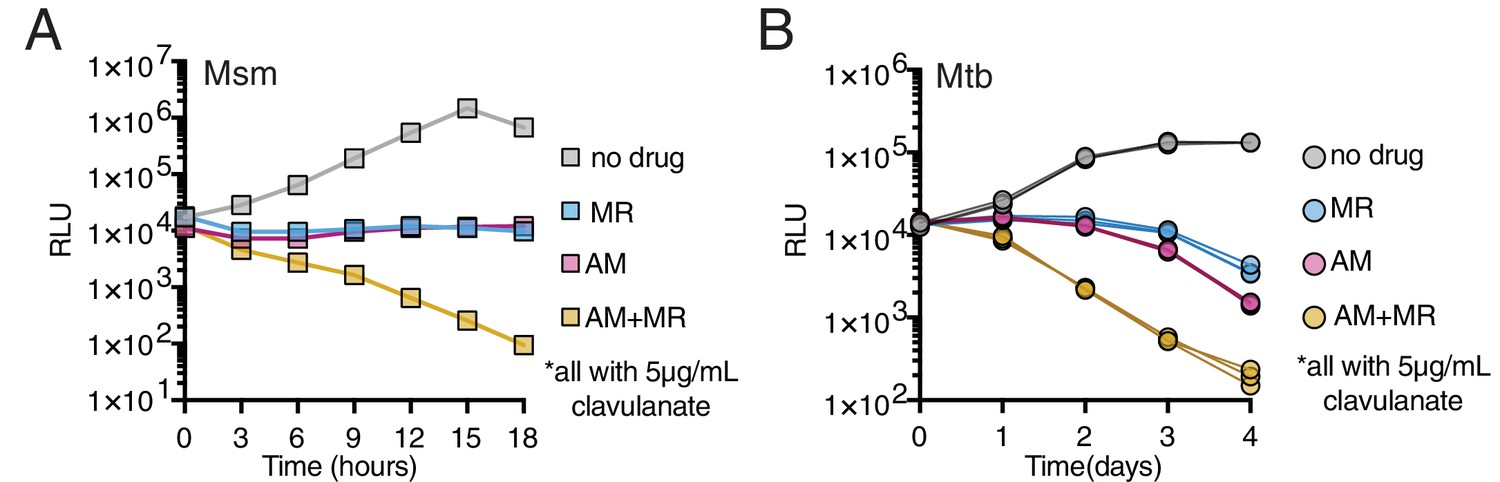
Drugs targeting both PBPs and LDTs kill mycobacteria more rapidly when combined (A, B).
Killing dynamics of Msm (A) and Mtb (B) (expressing the luxABCDE operon from Photorhabdus luminescens [Andreu et al., 2010]) measured via luciferase production (RLU = relative light units). Amoxicillin (AM) (Msm-1.25; Mtb-3.125 µg/mL); Meropenem (MR) (Msm-10; Mtb-6.25 µg/mL); Amoxicillin + Meropenem: Msm-1.25 µg/mL AM +10 µg/mL MR; Mtb-3.125 µg/mL AM +6.25 µg/mL MR). Biological triplicate are plotted for Mtb. All drugs were used in combination with 5 µg/mL clavulanate.
-
Figure 5—source data 1
Luminescence measurements used for Figure 5A,B.
- https://doi.org/10.7554/eLife.37516.036
Figure 5—figure supplement 1
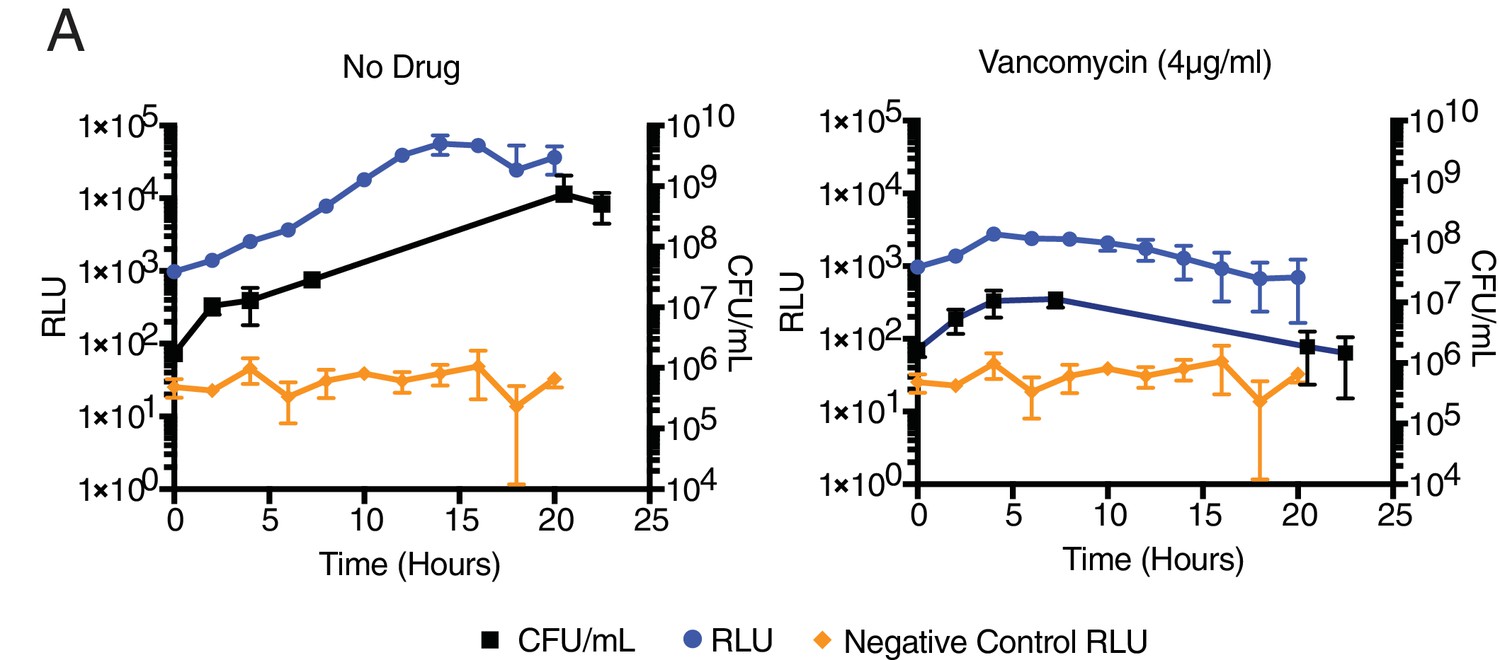
Light production (RLU) correlates to colony-forming units (CFU) in mycobacterial cells expressing luxABCDE in drug treatment.
(A) Mycobacterium smegmatis CFU and luminescence (RLU) during drug treatment.
Figure 5—figure supplement 2
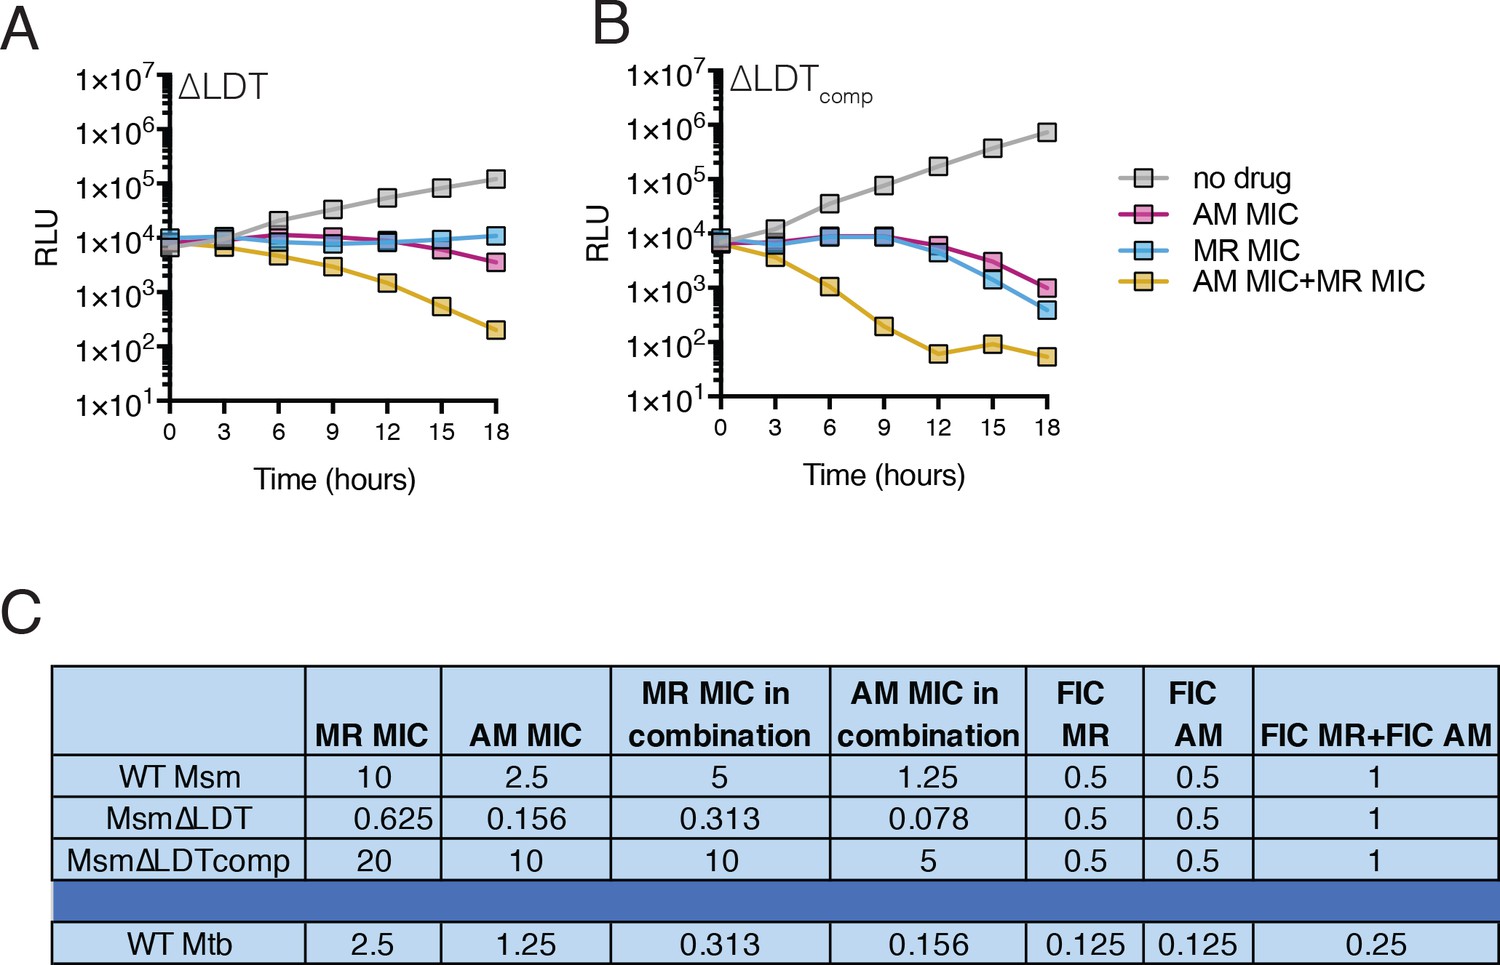
Meropenem and Amoxicillin killing kinetics and minimum inhibitory concentration data.
(A, B) Killing dynamics of ∆LDT (A) and ∆LDTcomp (B) (expressing the luxABCDE operon from Photorhabdus luminescens [Andreu et al., 2010]) measured via luciferase production (RLU = relative light units). Amoxicillin (AM) (∆LDT −0.156; ∆LDTcomp−10 µg/mL); Meropenem (MR) (∆LDT −0.625; ∆LDTcomp−20 µg/mL); Amoxicillin + Meropenem: ∆LDT −0.156 µg/mL AM +0.625 µg/mL MR; ∆LDTcomp−10 µg/mL AM +20 µg/mL MR). (C) Minimum inhibitor concentration (MIC) data calculated via alamar blue (resazurin). All drugs were used in combination with 5 µg/mL clavulanate. Synergy by fractional inhibitory concentration (FIC) is defined as a sum of FIC for each drug in the combination less than 0.5 (‘Synergism Testing: Broth Microdilution Checkerboard and Broth Macrodilution Materials and methods,’ 2016).
-
Figure 5—figure supplement 2—source data 1
Luminescence measurements used for Figure 5—figure supplement 2A,B.
- https://doi.org/10.7554/eLife.37516.035
Figure 6
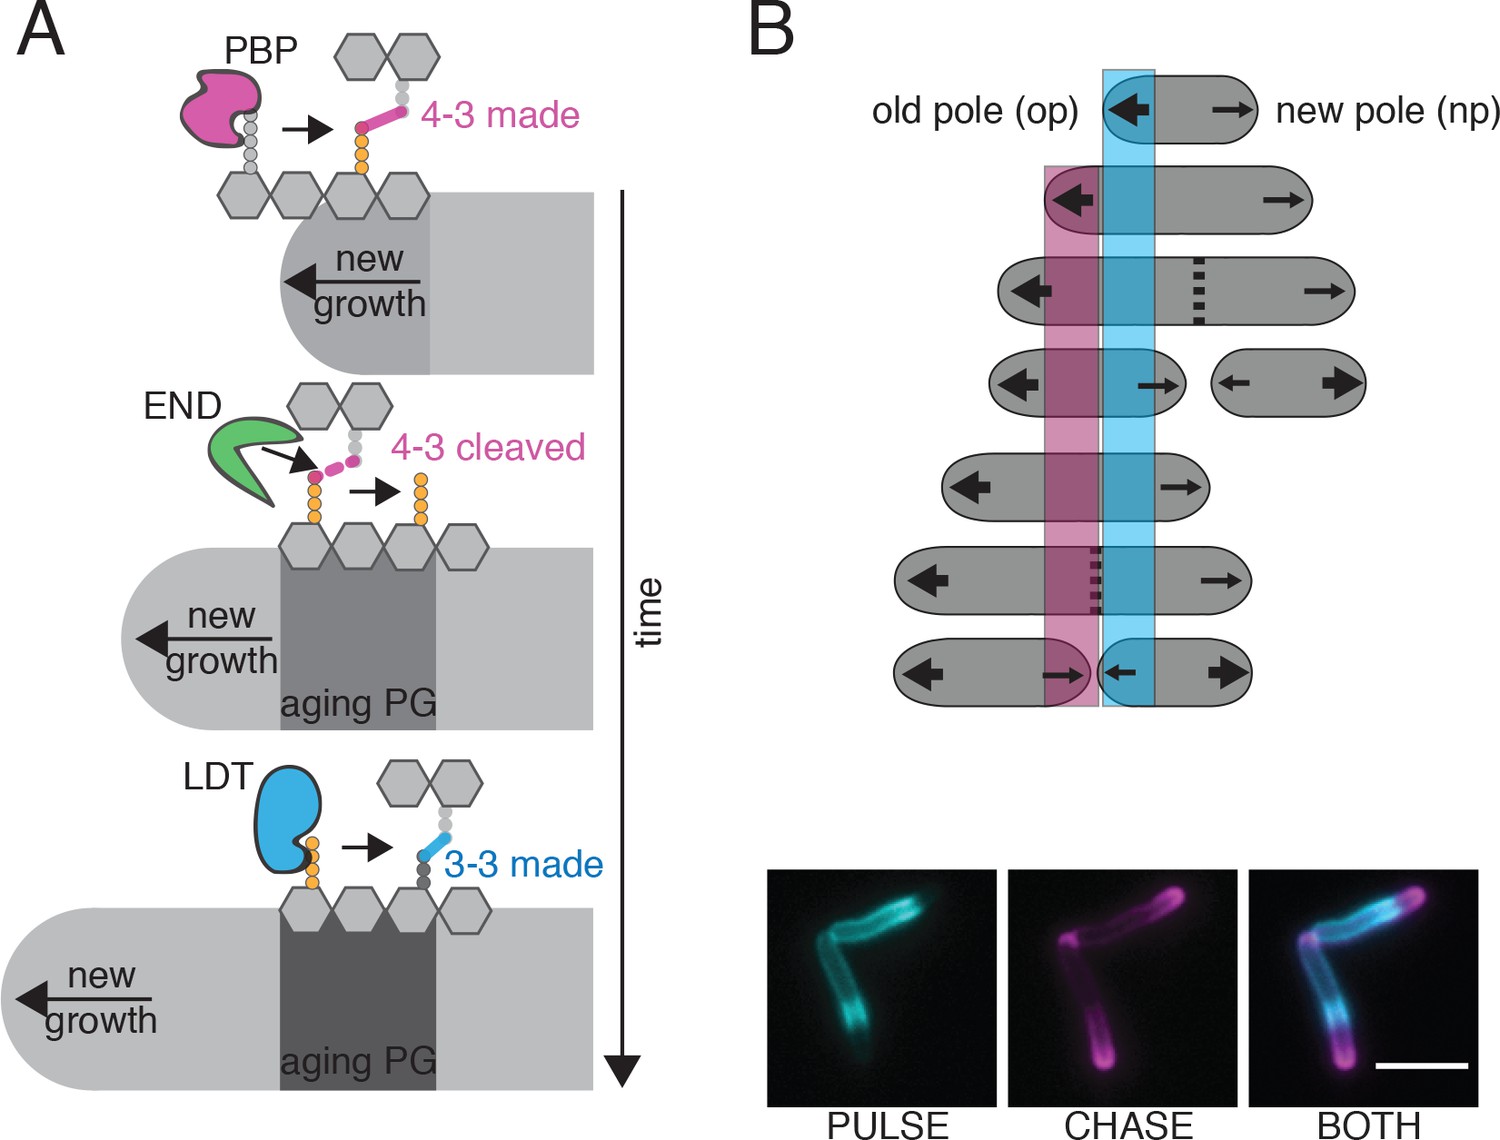
Model for PG enzyme and substrate distribution as governed by polar growth and PG segregation by age.
(A) A model for PG age, PG enzyme and crosslink segregation via polar growth in mycobacteria. First, 4–3 crosslinks are made by PBPs at site of new growth, where the pentapeptide substrate resides. Then, these 4–3 crosslinks can be cleaved by D,D-endopeptidases (END). This action would leave a free tetrapeptide. Lastly, LDTs can utilize this tetrapeptide to generate 3–3 crosslinks. As this is occurring over time and during polar growth, the aging cell wall moves toward mid-cell (new growth at the poles moves away from the existing cell wall). (B) Schematic of PG segregation by age (top). 2 min FDAA pulse (cyan), 45 min outgrowth, followed by 2 min FDAA chase (magenta) in WT Msm cells (bottom). Newest cell wall (magenta), older cell wall (cyan). Scale bar = 5 μm.
Tables
Key resources table
| Reagent type (species) or resource | Designation | Source or reference | Identifiers | Additional information |
|---|---|---|---|---|
| Strain (Mycobacterium smegmatis) | KB85; (WT Msm) | this work | Mycobacterium smegmatis mc2155 | Wildtype M. smegmatis |
| Strain (M. smegmatis) | KB134 | this work | mc2155∆ldtA::loxP | |
| Strain (M. smegmatis) | KB156 | this work | mc2155∆ldtA::loxP + ∆ldtE:: zeoR | |
| Strain (M. smegmatis) | KB200 (∆ldtAEB) | this work | mc2155∆ldtA::loxP ∆ldtE:: zeoR + ∆ldtB:: hygR | |
| Strain (M. smegmatis) | KB209 | this work | mc2155∆ldtA::loxP ∆ldtE::loxP ∆ldtB::loxP + ∆ldtC:: hygR | |
| Strain (M. smegmatis) | KB222 | this work | mc2155∆ldtA::loxP ∆ldtE::loxP ∆ldtB::loxP ∆ldtC:: hygR ∆ldtG:: zeoR | |
| Strain (M. smegmatis) | KB303 (∆LDT) | this work | mc2155∆ldtA::loxP ∆ldtE::loxP ∆ldtB::loxP ∆ldtC:: loxP ∆ldtG:: loxP ∆ldtF:: hygR | |
| Strain (Escherichia coli XL1-Blue) | KB302 | this work | pTetO-ldtE(MSMEG_0233)-Gly-Gly-Ser linker-mRFP | |
| Strain (M. smegmatis) | KB316 (∆LDTcomp) | this work | [mc2155∆ldtA::loxP ∆ldtE::loxP ∆ldtB::loxP ∆ldtC:: loxP ∆ldtG:: loxP ∆ldtF:: hygR]+KB302 | |
| Strain (M. smegmatis) | KK311 | this work; plasmid from Kieser et al. (2015a) | mc2155 + TetO-ponA1-RFP (Kieser et al., 2015b) | |
| Strain (Escherichia coli Top10) | KB380 | this work | pTetO-dacB2 (MSMEG_2433)-glycine-glycine-serine linker-mRFP | |
| Strain (M. smegmatis) | KB414 | this work | mc2155 + KB380 | |
| Strain (M. smegmatis) | HR583 | this work | KB303 (∆LDT)+CRISPRi vector (Rock et al., 2017) with dacB2 targeting sgRNA | Plasmid from Dr. Sarah Fortune (Harvard School of Public Health) and Dr. Jeremy Rock (Rockefeller University) |
| Strain (E. coli BL21) | KB428 | this work | E.coli BL21 + pET28 b (dacB2) | Plasmid pET28b from Dr. Suzanne Walker |
Additional files
-
Supplementary file 1
List of primers.
- https://doi.org/10.7554/eLife.37516.038
Download links
A two-part list of links to download the article, or parts of the article, in various formats.
Downloads (link to download the article as PDF)
Open citations (links to open the citations from this article in various online reference manager services)
Cite this article (links to download the citations from this article in formats compatible with various reference manager tools)
Maturing Mycobacterium smegmatis peptidoglycan requires non-canonical crosslinks to maintain shape
eLife 7:e37516.
https://doi.org/10.7554/eLife.37516


