Tuned polymerization of the transcription factor Yan limits off-DNA sequestration to confer context-specific repression
- University of Chicago, United States
Figures
Figure 1
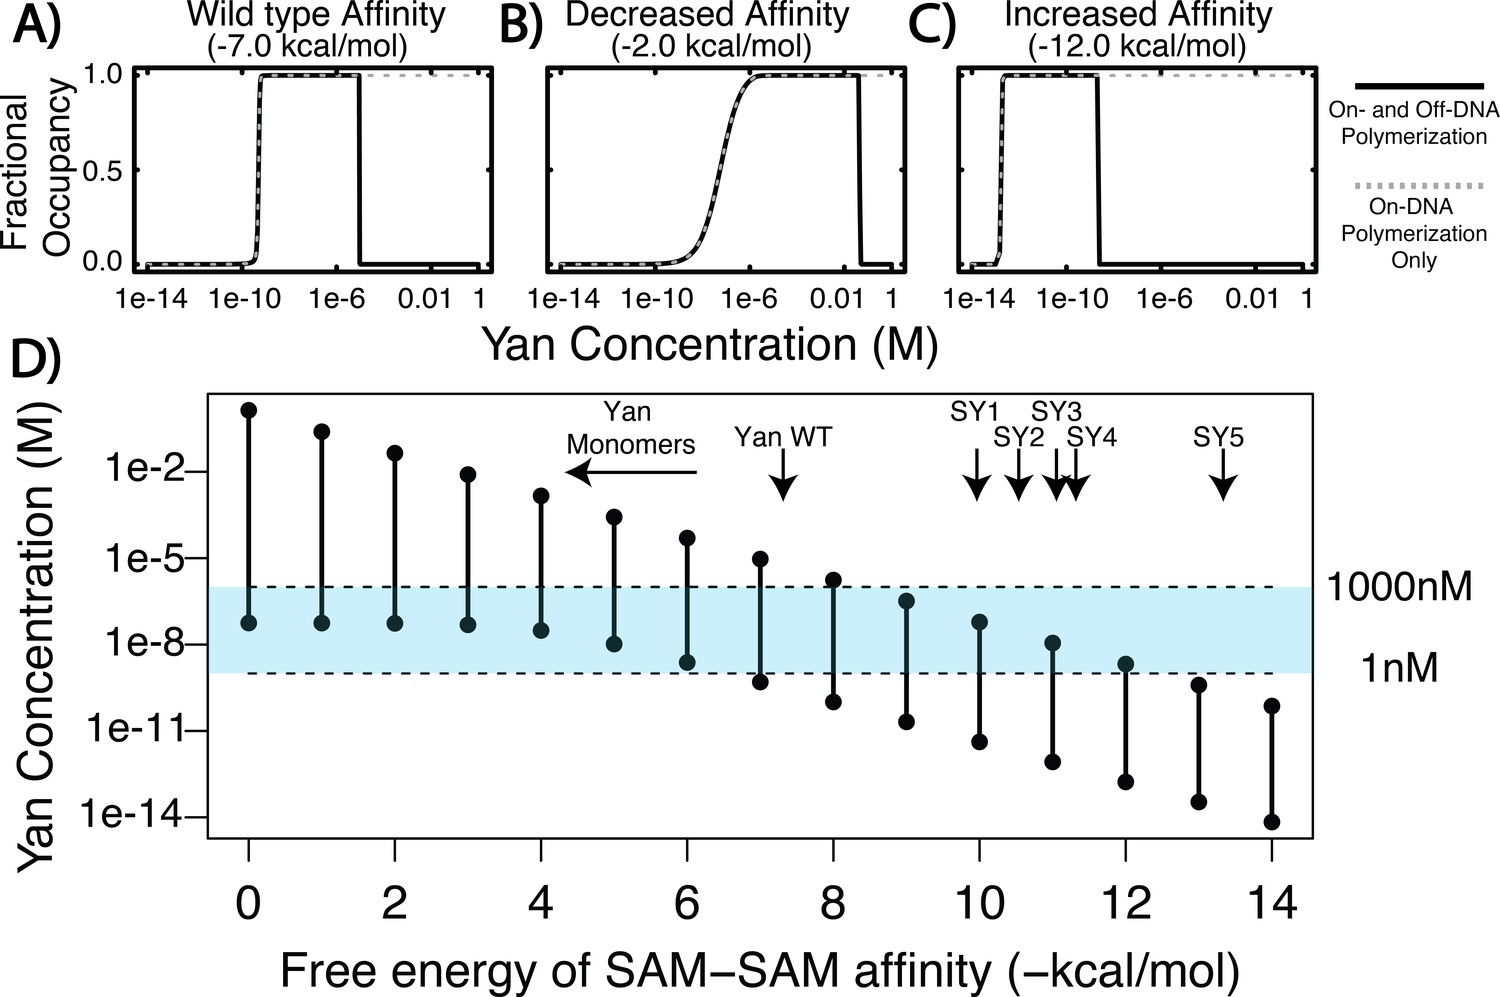
Equilibrium modeling shows that increasing polymerization affinity decreases Yan’s DNA occupancy.
(A–C) Fractional occupancy of Yan for given values of self-association as a function of concentration. Solid lines, polymerization both on and off DNA; dashed lines, on-DNA polymerization only. (D) Concentration ranges of 50% or greater Yan fractional occupancy, as a function of SAM–SAM affinity (black vertical bars). As protein–protein interaction affinity increases, the model predicts that Yan occupancy moves outside the physiologically relevant range (blue shaded area). Arrows point to wildtype affinity (Qiao et al., 2004) or to measured SY affinities (this study). The weak affinity of Yan monomers did not permit precise Kd measurement (Qiao et al., 2004), but the maximum range of affinity is noted by the beginning of the arrow.
-
Figure 1—source data 1
Increasing the size of species capable of binding DNA does not appreciably alter the output of model calculations.
Concentrations of Yan at which 50% or greater occupancy at the ETS site is achieved are plotted as a function of SAM–SAM interaction strength. The data for monomers alone correspond to Figure 1. Subsequent data show the results of calculations that allow binding of both monomers and dimers to DNA, or of monomers, dimers and trimers.
- https://doi.org/10.7554/eLife.37545.004
Figure 2

Mutagenesis of the SAM–SAM interface increases Yan polymerization affinity.
(A) Cartoon representation of the TEL SAM crystal structure (PDB: 1JI7, Kim et al., 2001) with the primary sequence alignment of Yan and TEL SAMs below. Residues at the interface are emphasized, with conserved residues in blue, divergent residues in green, and previously published monomerizing mutations in orange (A61D and V80E depicted). Sequence alignment shows conserved residues (*), conservative substitutions (:), and semi-conservative substitutions (.) Inset shows TEL residues corresponding to Yan R92, A93, G96, and H97. (B) Schematic of negGFP Native Gel Assay showing discrimination between monomers, dimers, and higher-order polymers. (C) Native gels showing the mobility of all 15 possible combinations of the four mutations Yan R92K, A93E, G96R, and H97Y relative to wildtype (WT), and arranged in order of increasing polymerization. Sequences are listed below with green font highlighting mutated residues. As reference points, the left-most lane in each gel contains an unequal mixture of TEL monomer species to mark the mobility of monomers and dimers whereas the wildtype TEL SAM shows the mobility of a high-affinity polymer in the right-most lane. YT9-15 were run on both 12.5% and 6% gels to maximize the discrimination of mobility differences.
Figure 3 with 3 supplements
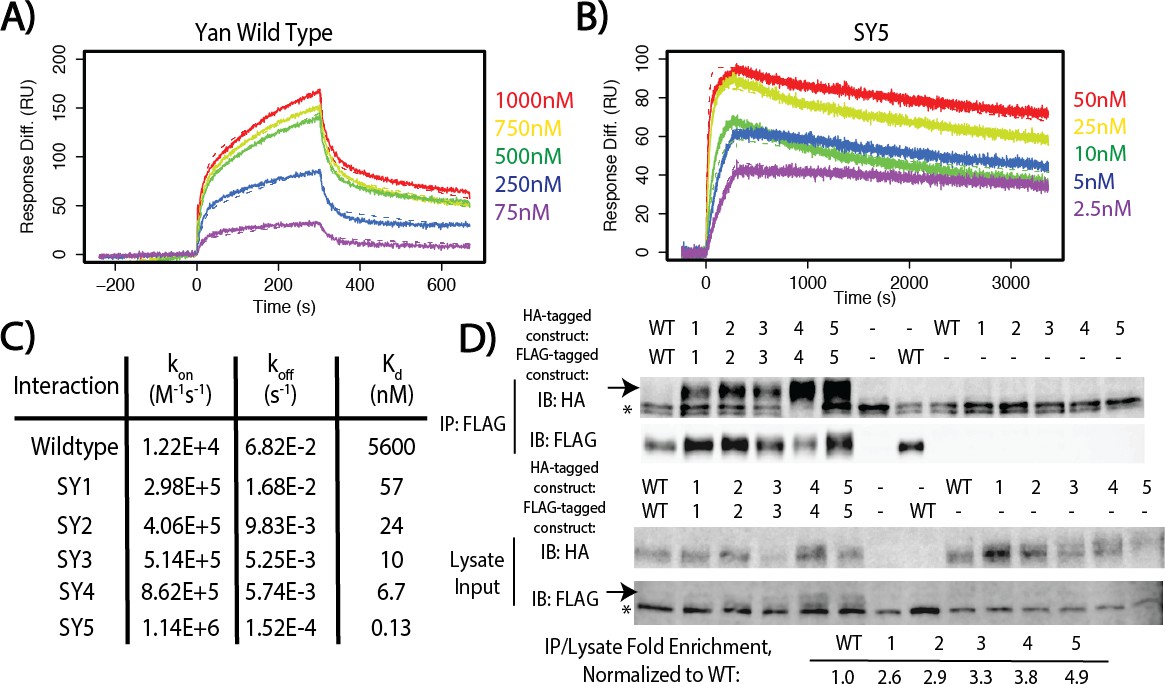
SuperYan mutations increase SAM–SAM affinity in vitro and full-length self-association in vivo.
(A) Representative sensogram of the wildtype Yan SAM interaction, via SPR. Concentrations of analyte are color-coded and listed to the right, and the kinetic model is represented by dashed lines. (B) Sensogram of the SY5 interaction, demonstrating stronger binding affinity. (C) Table of parameters obtained from kinetic fitting of sensograms for Yan and SY1–5 interactions. Two technical replicates were taken for each interaction to calculate parameters. (D) Co-immunoprecipitation of Yan and SY1–5 constructs. IPs are shown in the top panel, whereas lysate inputs are shown in the bottom panel. FLAG-tagged Yan constructs were immunoprecipitated and both HA-tagged and FLAG-tagged proteins were immunoblotted. Arrows mark the mobility of the Yan constructs, whereas asterisks mark unreduced IgG in the IP and a non-specific FLAG-reactive species in the lysate, respectively. Fold enrichment of IP to lysate relative to wildtype is noted.
Figure 3—figure supplement 1
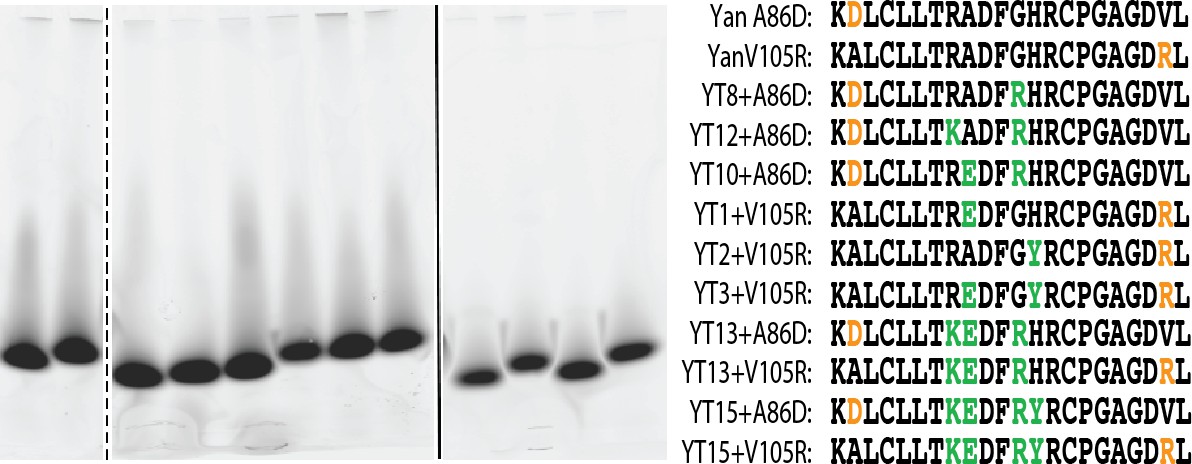
Yan A86D and V105R mutations can monomerize SuperYan, thereby allowing measurement of affinity.
negGFP native gel assay for the proteins listed in the right-hand panel. All constructs run as monomers. The image that is shown is taken from three separate 4 – 15% gradient gels loaded and run in parallel.
Figure 3—figure supplement 2
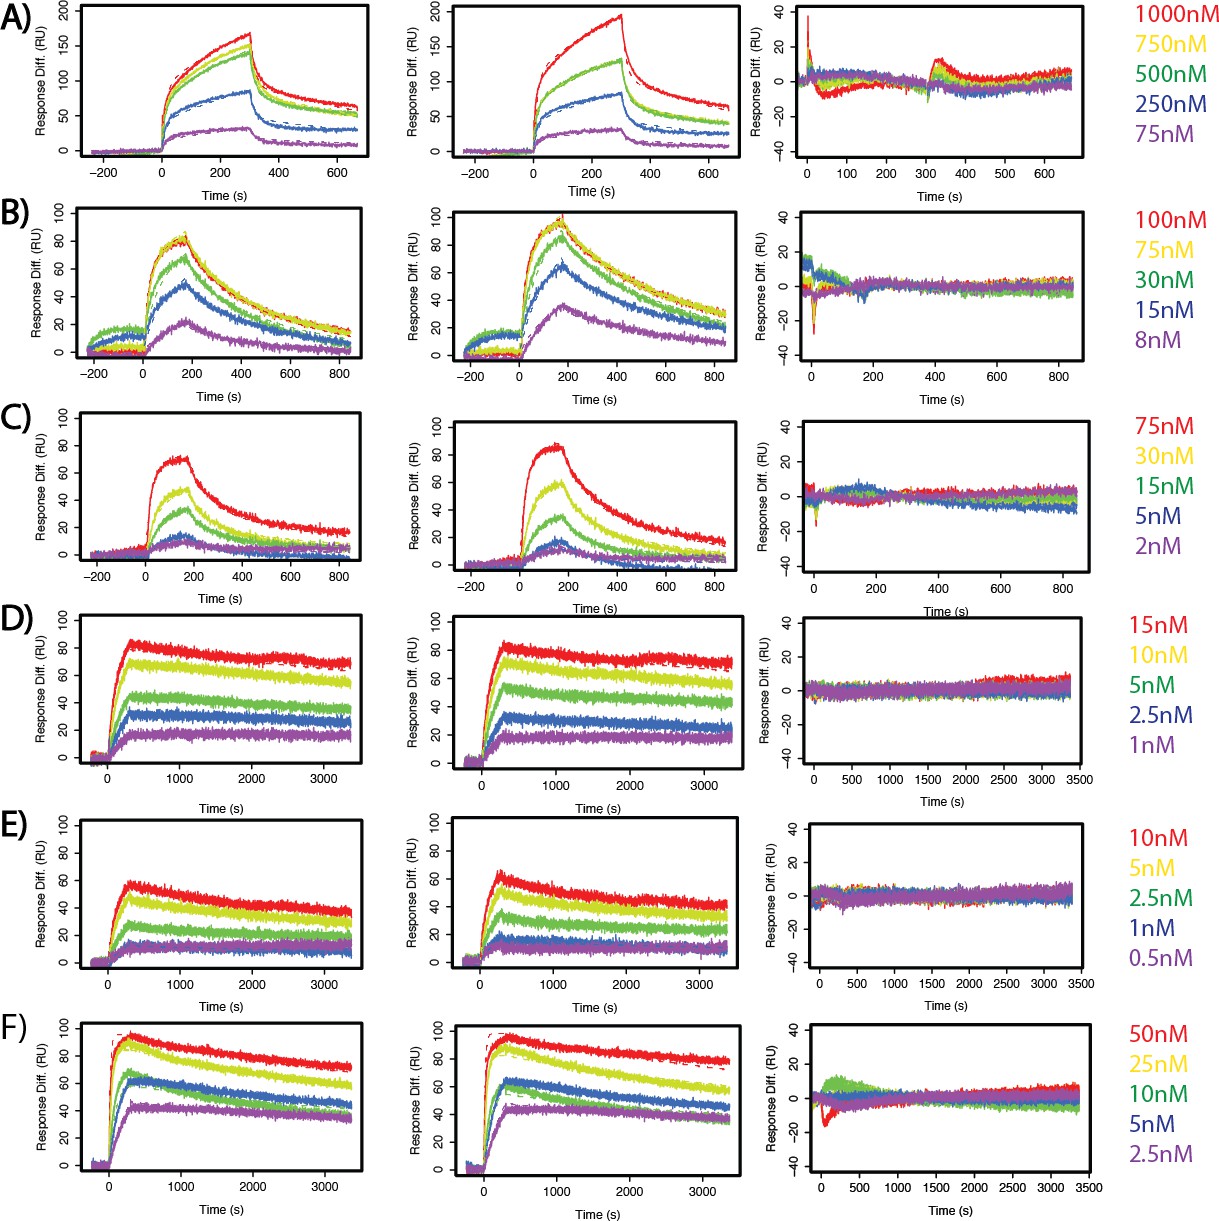
SuperYan mutations increase SAM–SAM affinity, as measured by SPR.
(A–F) Two sensograms with kinetic model fits and residuals for the measured interactions. (A) Yan wild type. (B) SY1. (C) SY2. (D) SY3. (E) SY4. (F) SY5.
Figure 3—figure supplement 3
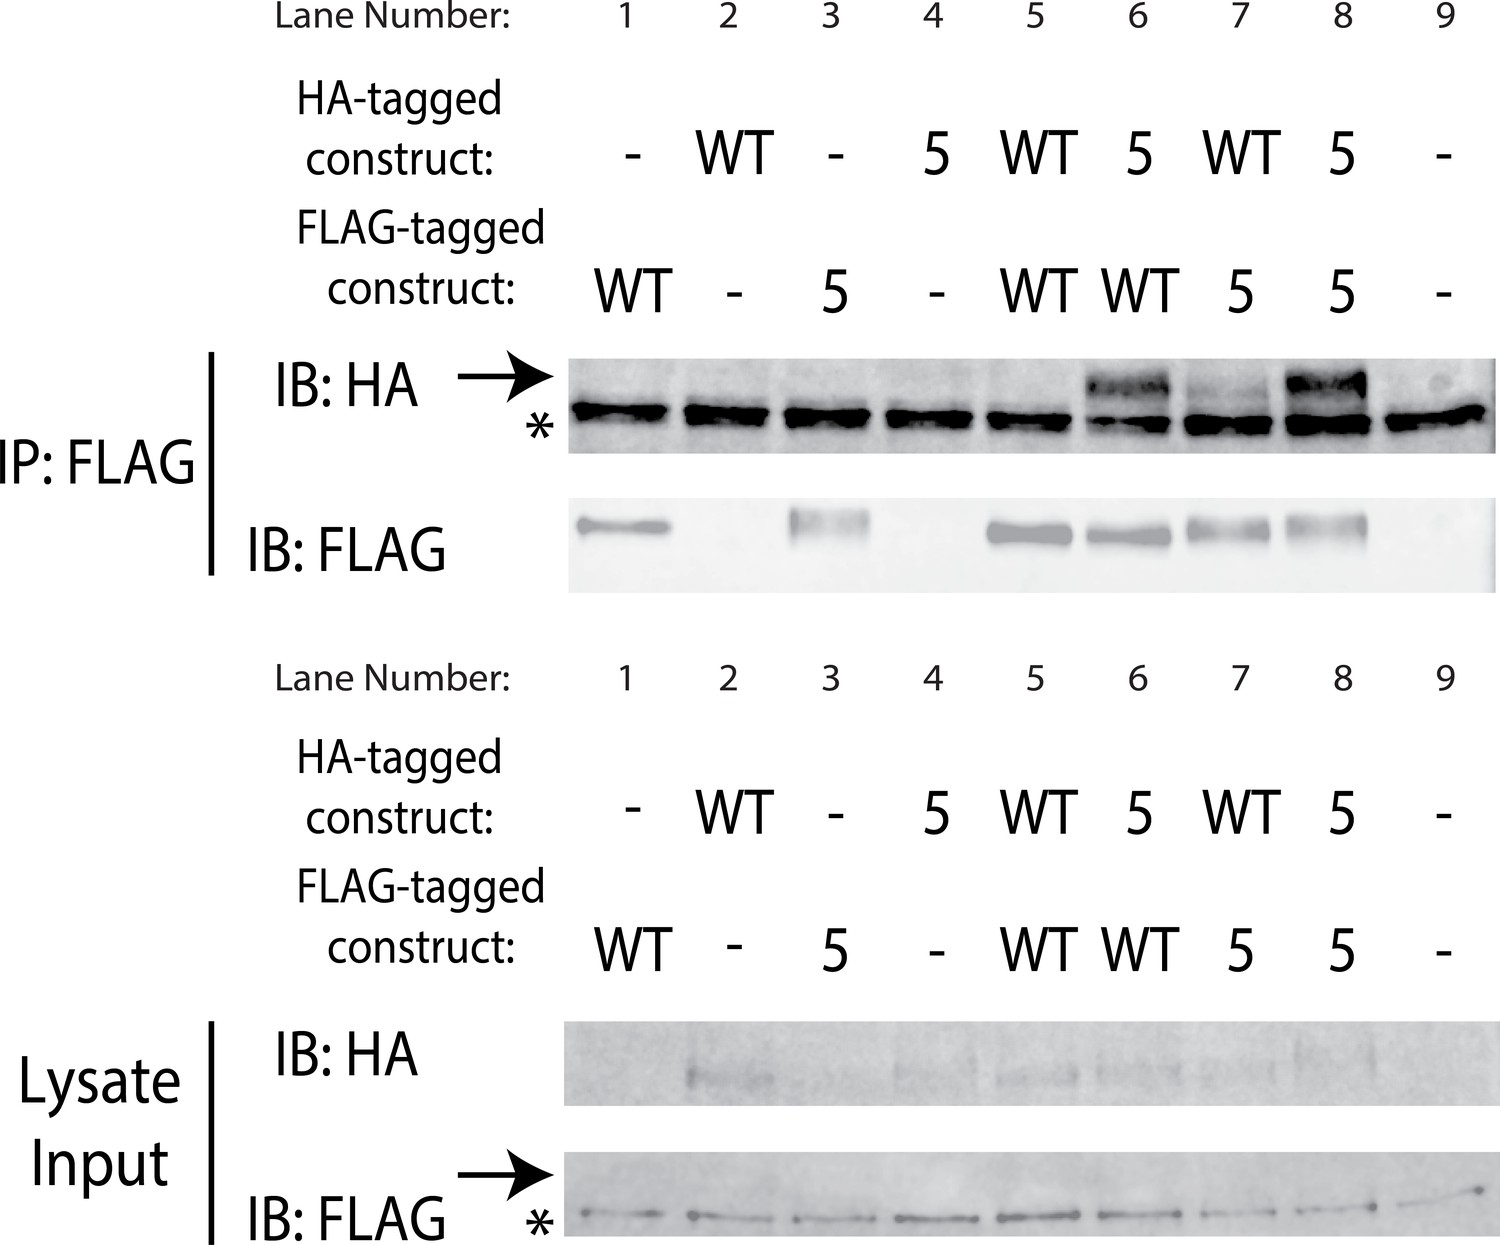
SuperYan mutations maintain interaction with wildtype Yan SAM interface.
Pairwise co-immunoprecipitation of full length Yan and SY5, with the indicated constructs transfected in each lane. Heterotypic co-IP between WT and SY5 is observed in lanes 6 and 7. Arrows mark the mobility of Yan species, whereas asterisks mark unreduced IgG in the IP and a non-specific, FLAG-reactive species in the lysate. Note that the Yan signal is weak in lysates, but strong in the IP.
Figure 4 with 2 supplements
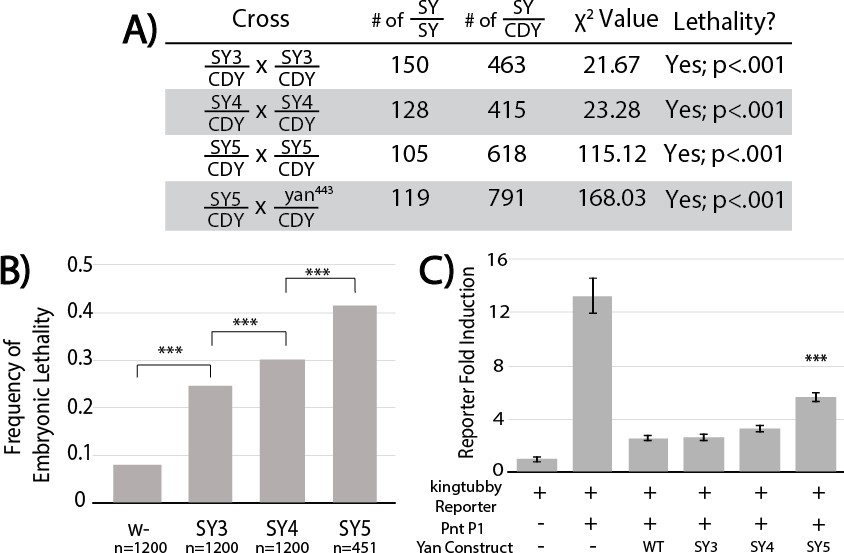
SuperYan mutations behave as loss-of-function alleles, and show compromised transcriptional repression.
(A) The reduced recovery of adults homozygous for yanSY3–5 indicates reduced fitness. Reduced fitness was also observed when yanSY5 was placed in trans to a yan null allele, yan443. CDY, CyO,Dfd > YFP. Significance was calculated via Pearson’s chi-square test with the expected Mendelian ratio as the null hypothesis. (B) Embryonic lethality of yanSY3–5 homozygotes, as compared to w- control, measured by failure to hatch into larvae. Significance was calculated via pair-wise chi-square tests. (C) Transcription assays using a Yan/Pnt-responsive transcriptional reporter from king tubby show impaired repressive function with SY5. Error bars represent SEM from six biological replicates. Significance was calculated via pair-wise Student T-tests between Yan wildtype and mutants, with Bonferroni correction. ***, p<0.001.
Figure 4—figure supplement 1
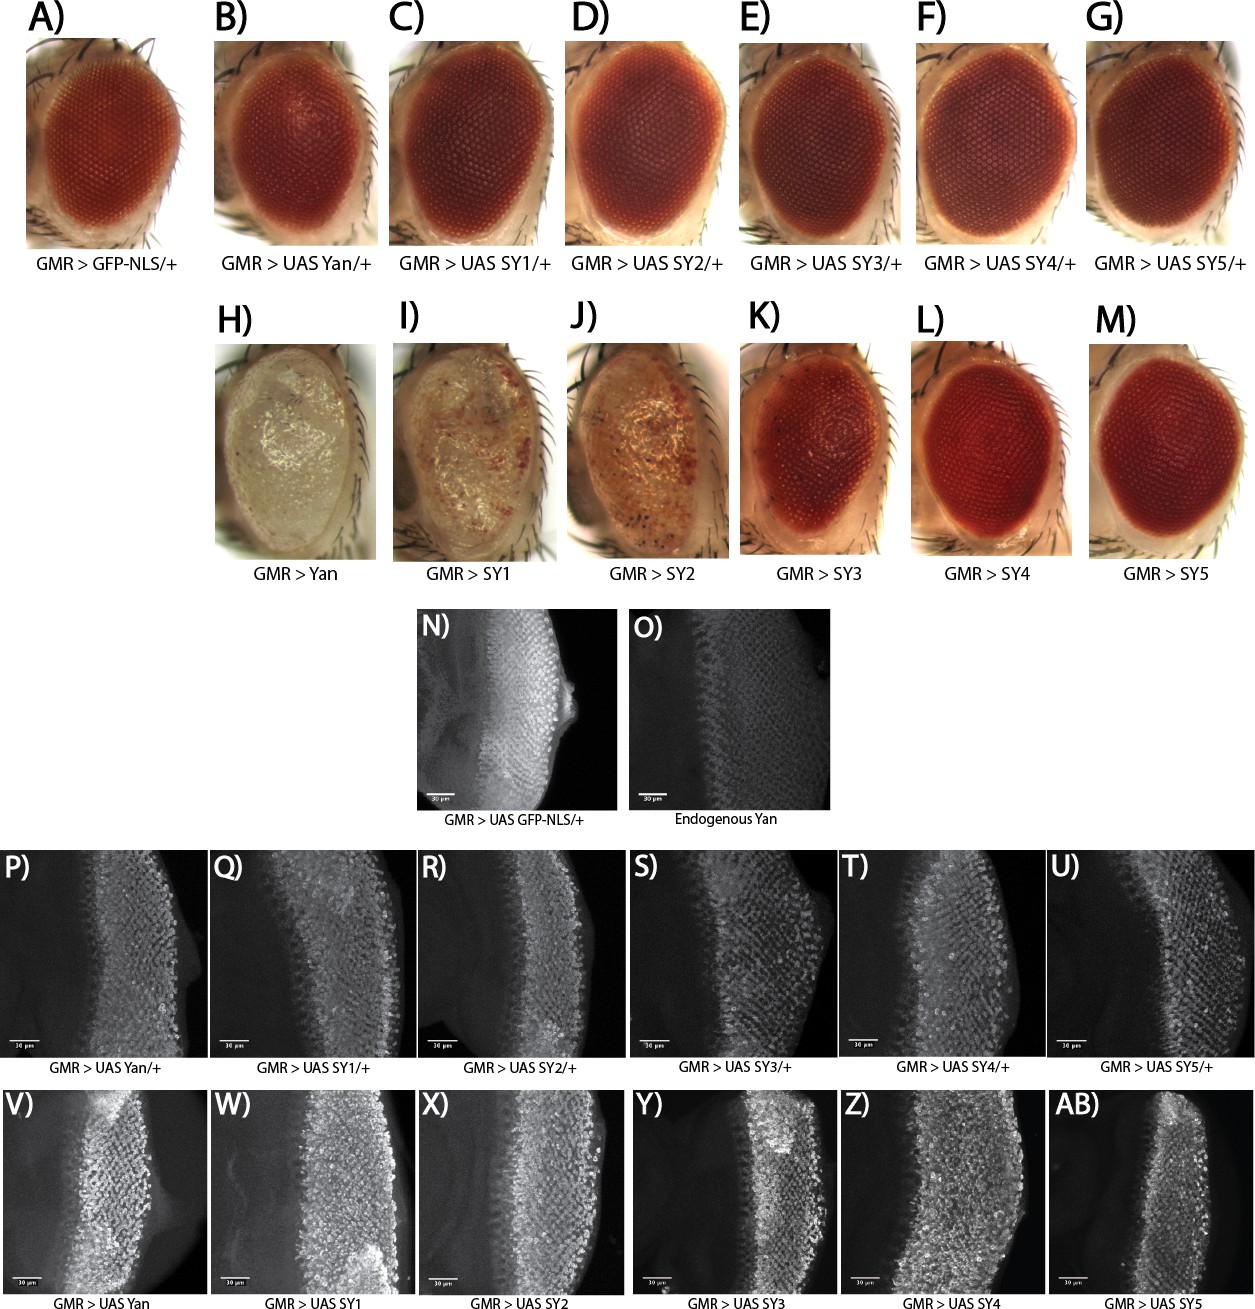
Overexpressed SuperYan has reduced activity relative to wildtype Yan, but normally localizes to the nucleus.
(A–G) Adult eye phenotype of overexpression of Yan and SY1–5 in one copy, driven with GMR–GAL4 at 25°C. (H–M) Overexpression of Yan and SY1–5 in two copies. (N) GMR >UAS GFP–NLS demonstrates pattern of driver. (O) Endogenous Yan pattern in third instar larval discs. (P–U) Comparable increase in Yan levels upon overexpression of one copy of the transgene for Yan wildtype and SY1–5. (V–AB) Comparable increase in Yan levels upon overexpression of two copies of the transgene, for Yan wildtype and SY1–5. All confocal microscopy images are maximum intensity projections, taken with the same microscope settings. Discs and adult eyes are oriented anterior left.
Figure 4—figure supplement 2
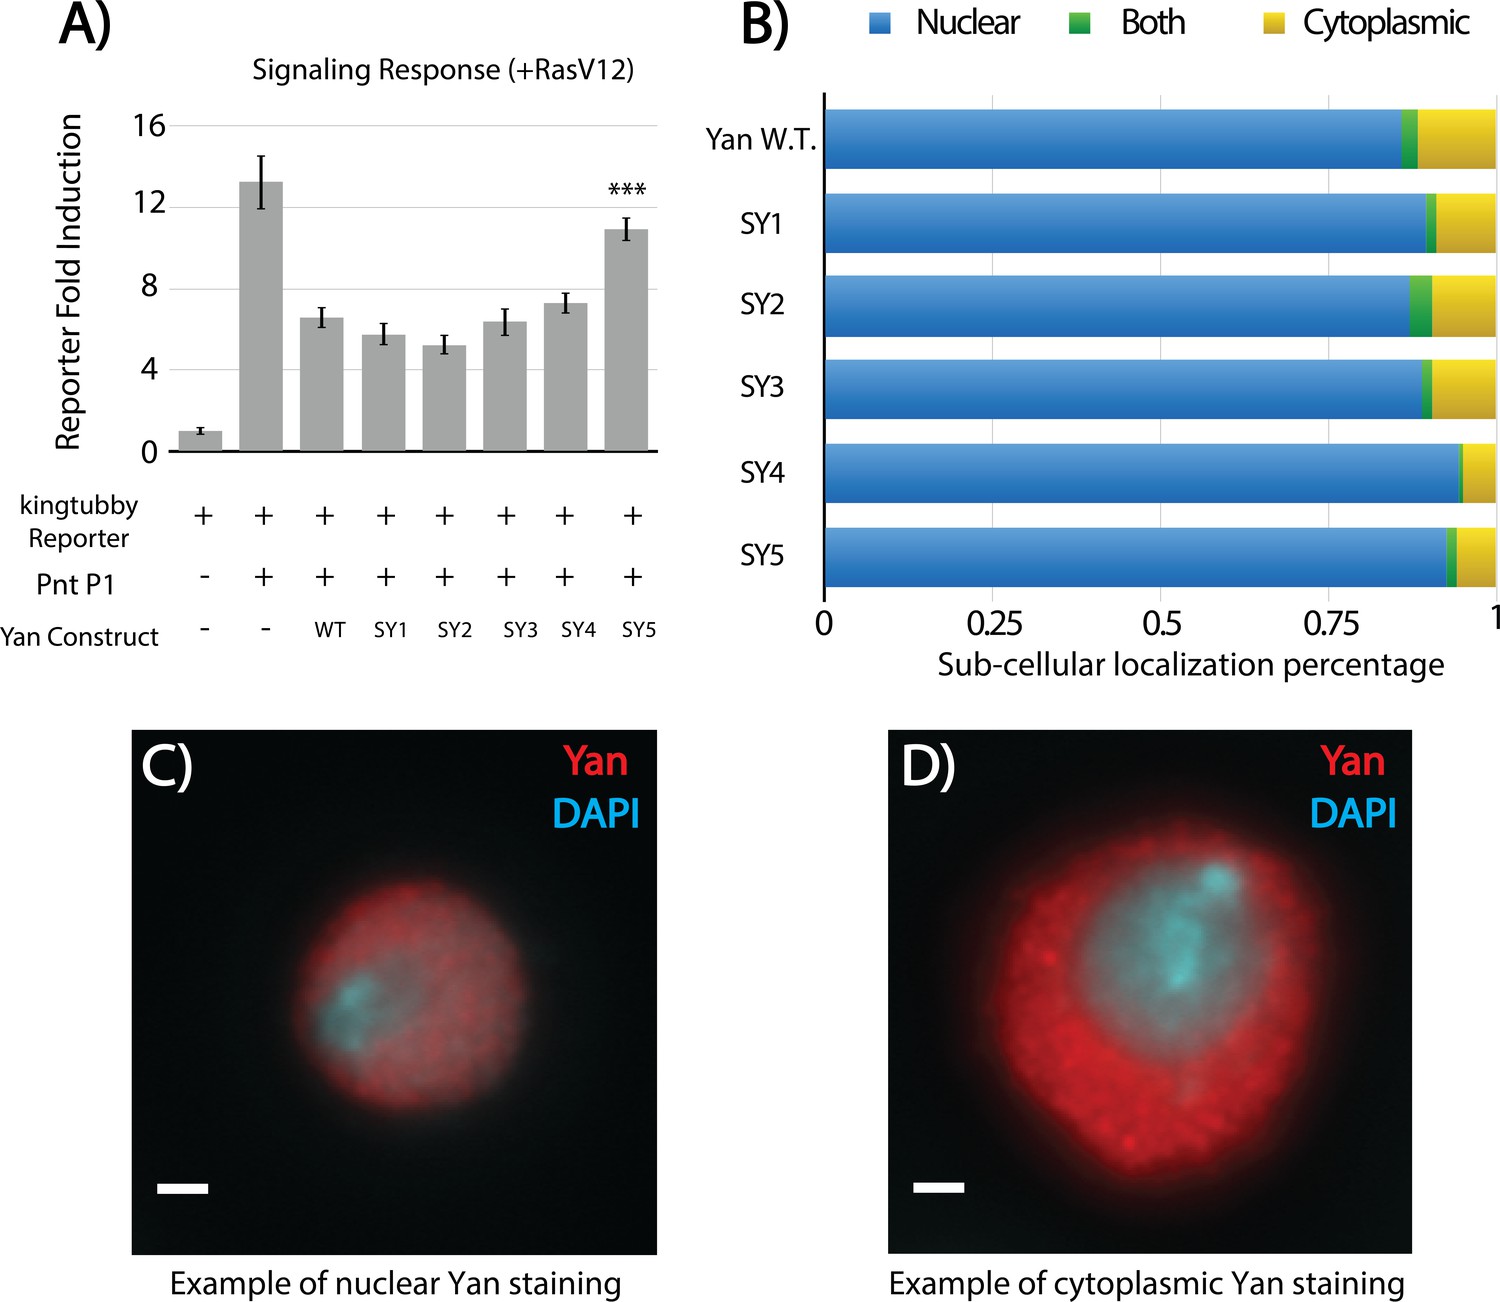
SuperYan mutants are responsive to RasV12 and properly localized in S2 cells.
(A) Luciferase transcription assays of Yan and SY3–5 using the king tubby transcriptional reporter, in the presence of RasV12 to stimulate MAPK induction. Error bars represent SEM of n = 6 biological replicates. Significance was calculated via pair-wise Student T-tests between Yan wildtype and mutant, with Bonferroni correction, ***p<0.001. (B) Quantification of Yan sub-cellular localization in transfected S2 cells. A minimum of 196 cells were scored for each genotype. None of the mutants are significantly different from wildtype, as calculated by pair-wise chi-square tests. (C–D) Representative examples of nuclear and cytoplasmic Yan staining, respectively, for S2 cell localization studies. (C) Yan without RasV12. (D) Yan with RasV12.
Figure 5 with 1 supplement
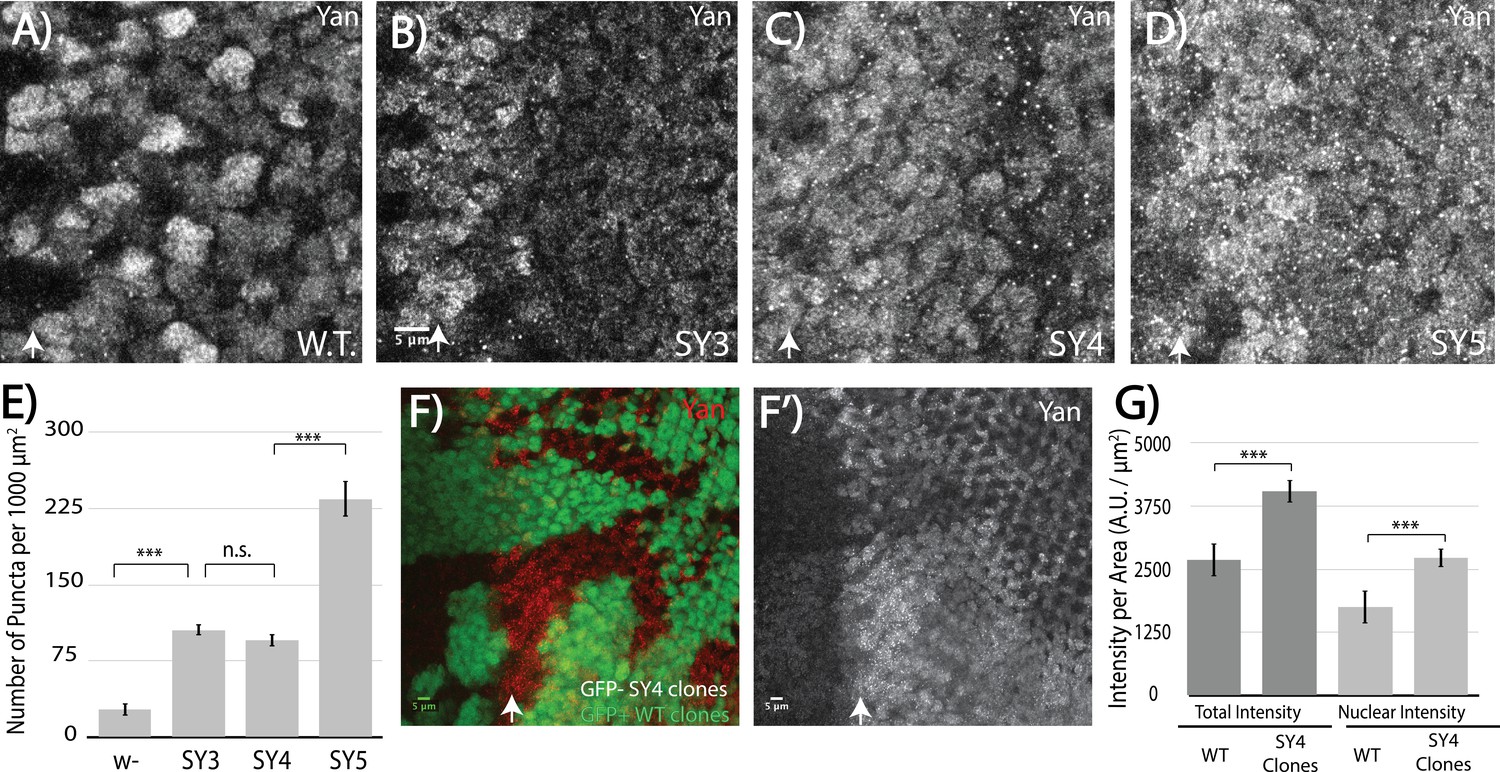
High-affinity SAM–SAM interactions increase Yan levels and promote punctual aggregates in both the cytoplasm and the nucleus.
(A–D) Immunofluoresence of Yan in wild-type and yanSY3-5 third instar eye discs, oriented anterior left. (E) Quantification shows an increased number of puncta per area in SuperYan discs. Error bars represent SEM from n = 6 measurements. Significance was calculated by pair-wise Student T-tests with Bonferroni correction. (F–F’) Mitotic clones of yanSY4, marked by the absence of GFP, show increased Yan puncta and intensity. (G) Quantification of Yan levels in yanSY4 clones relative to wild type. Measurements represent n = 4 pairs of clones, normalized by area, for both total intensity and nuclear intensity. Significance was calculated via pair-wise Student T-tests with Bonferroni correction. Scale bars represent 5 um; white arrows mark the position of the morphogenetic furrow in (A–D) and (F–F’). ***p<0.001; n.s., not significant.
Figure 5—figure supplement 1

Levels of RTK signaling influence Yan puncta.
(A–C) Immunofluoresence of Yan in wildtype and yanSY5 third instar eye discs, oriented anterior left. (A) W.T. = w1118. (B) yanSY5/+heterozygotes. (C) yanSY5; GMR-Gal4/UAS-rlSEM. (D) Quantification of puncta per area. Error bars represent SEM from n = 6 measurements; significance was calculated by pair-wise Student T-tests with Bonferroni correction. ***, p<0.001; *, p<0.05. Scale bars represent five microns.
Figure 6
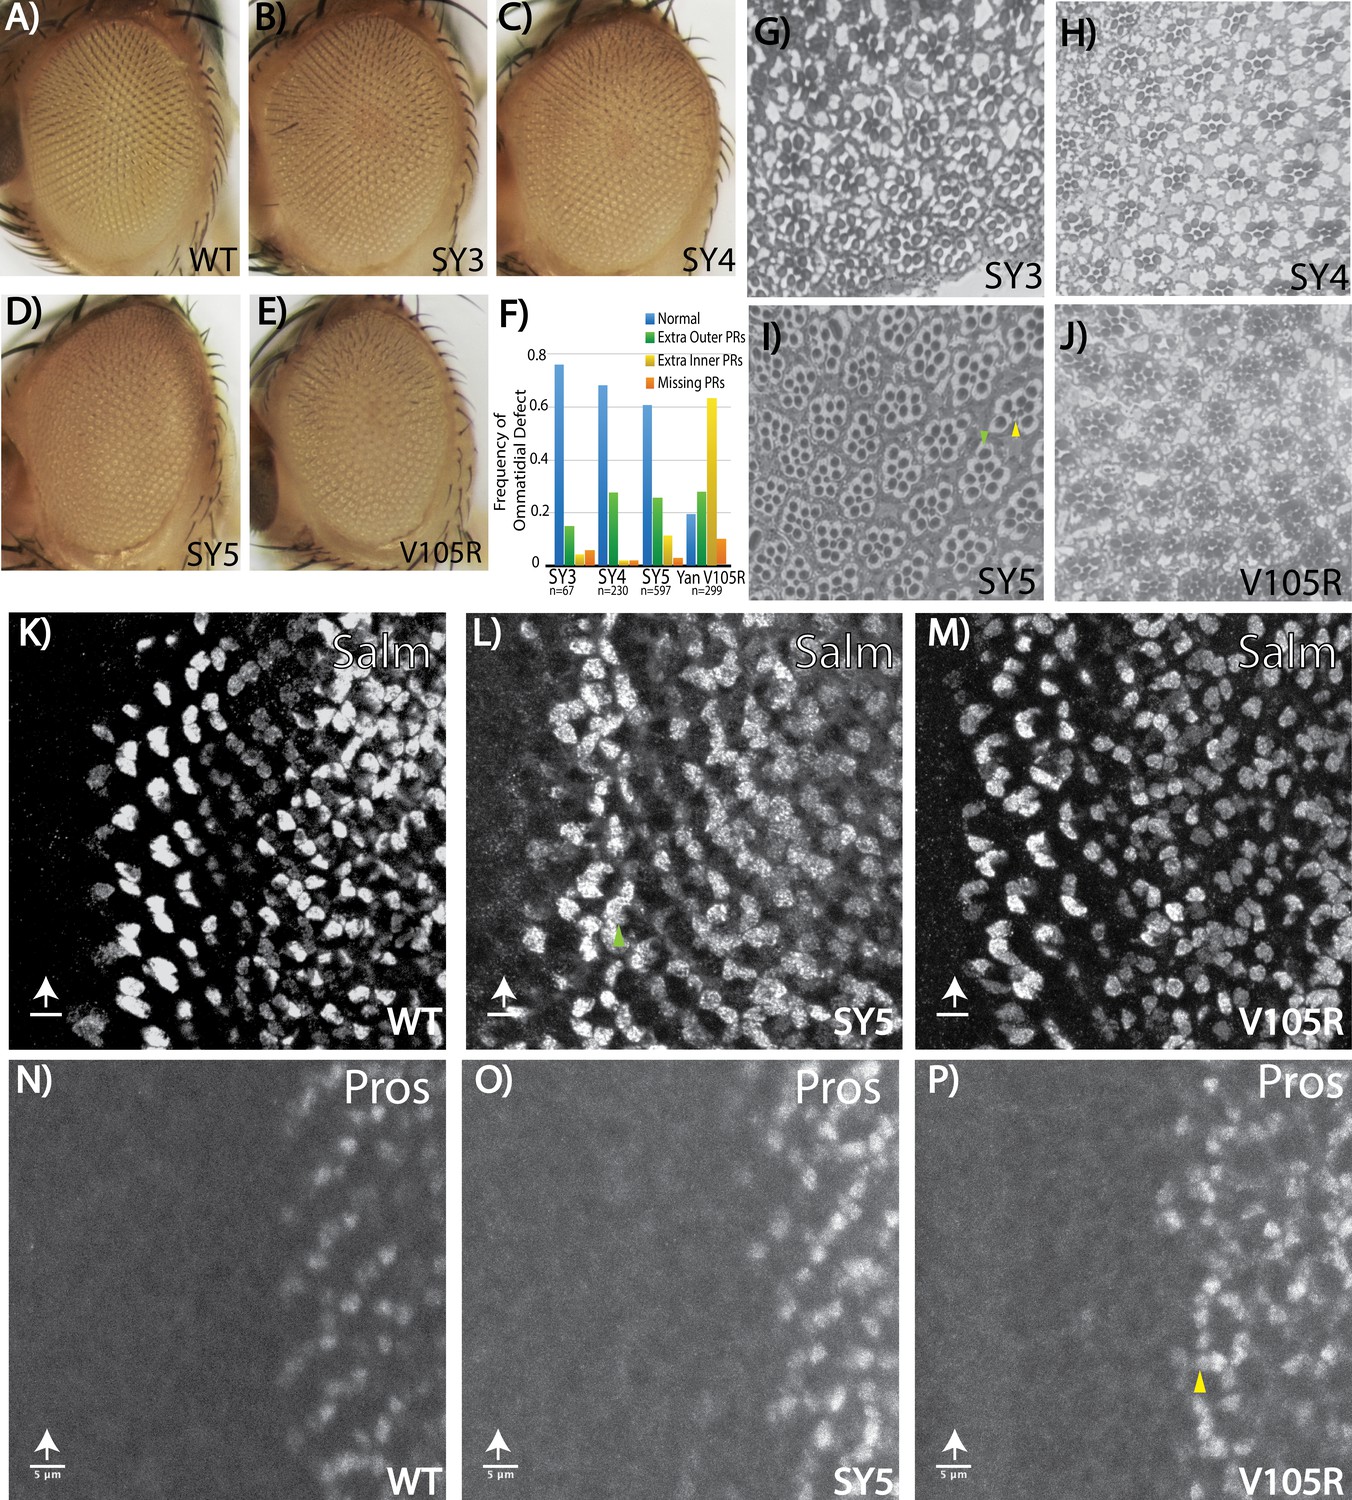
Fate-specification defects suggest different requirements for Yan polymerization and repression in R7 versus R3/R4 photoreceptors.
(A–E) Adult eye images of indicated genotypes, showing progressive roughening of the eye field for the SuperYan alleles and monomeric Yan V105R. (F) Quantification of sectioning. All genotypes were significantly different from one another, as confirmed by paired Chi-square tests, p<0.001. (G–J) Histological sections of yanSY3–5 and yanV105R. Green arrows indicate extra outer photoreceptors, yellow arrows indicate extra inner photoreceptors; examples shown in (I). (K–M) The expression of Spalt-major (Salm), a marker of R3/4 cell fate, shows increased numbers of R3/4 cells. (N–P) Expressions of Prospero (Pros), a marker of R7 cell fate, shows no expansion of the R7 lineage in yanSY5 discs. White arrows mark the position of the morphogenetic furrow; green and yellow arrows mark examples of extra Salm-positive and Pros-positive cells, respectively. Scale bars represent five microns.
Figure 7 with 1 supplement
Salm is a direct Yan target and is specifically derepressed in yanSY5 mutants.
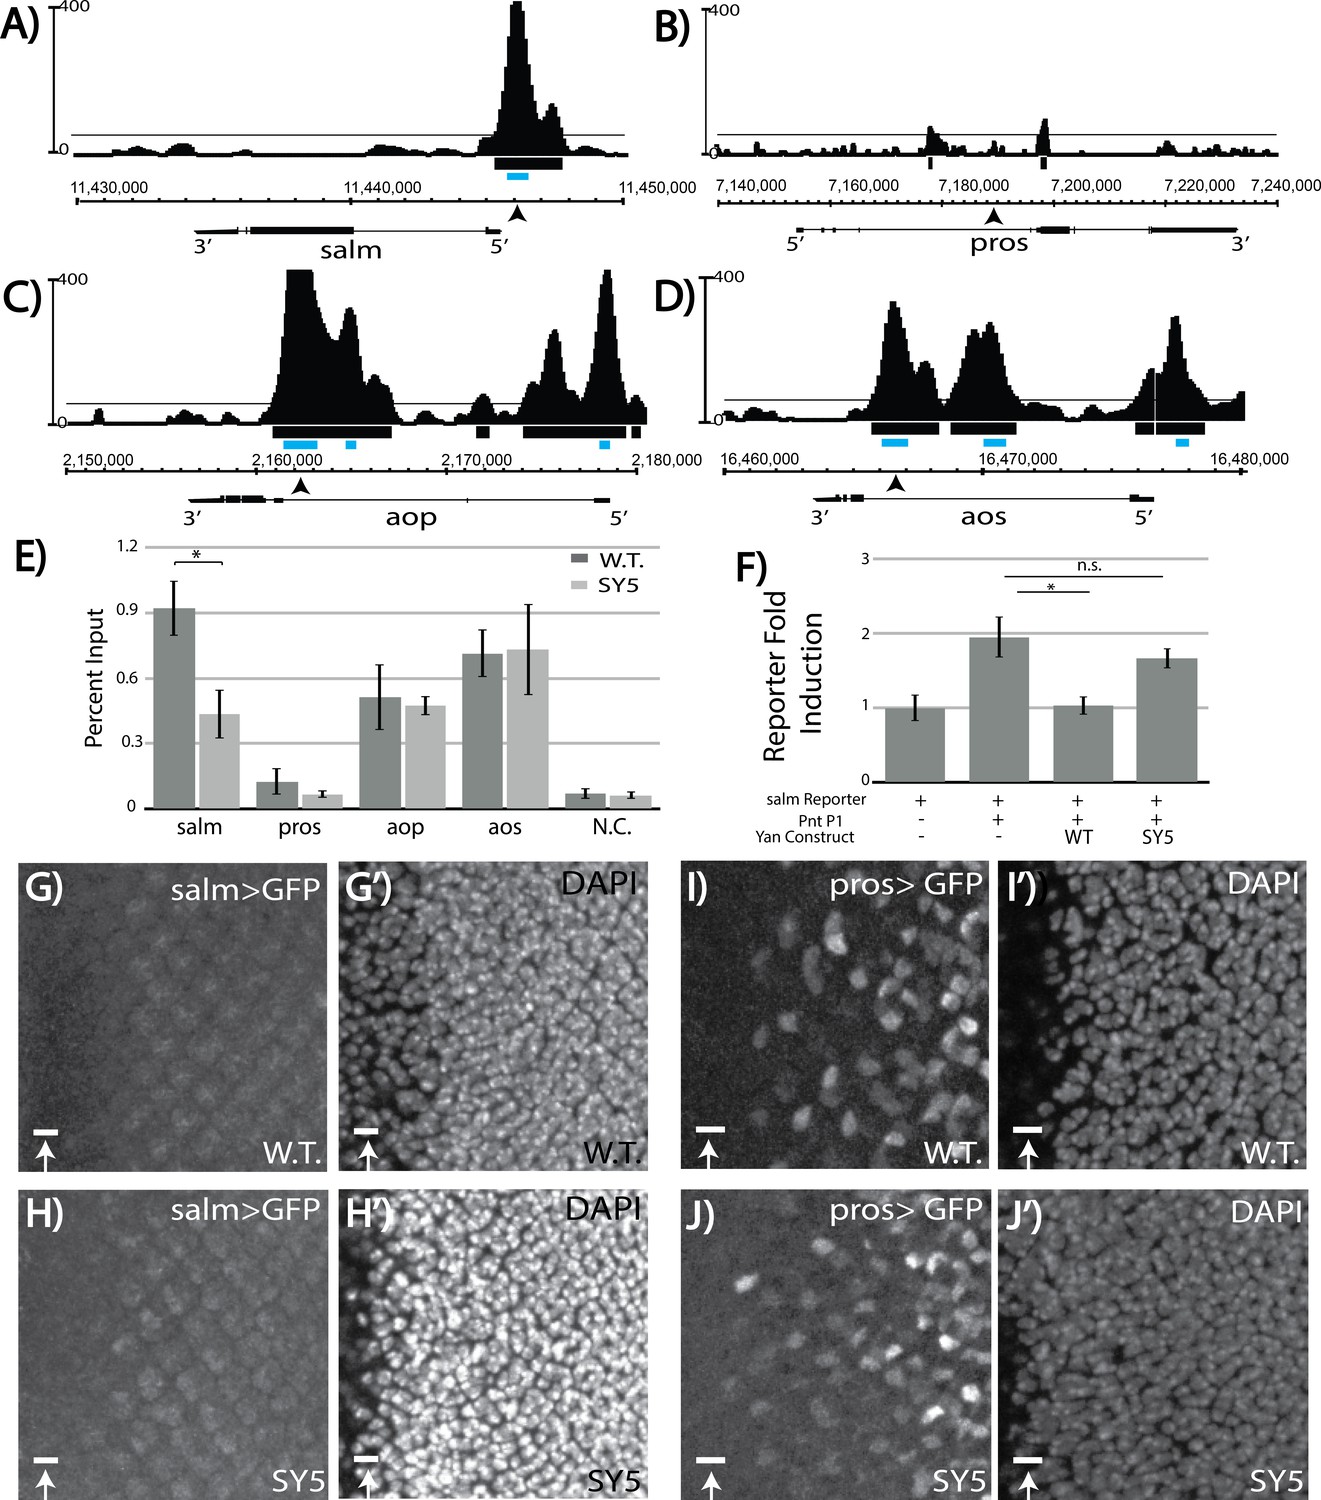
(A–D) ChIP-seq tracks of Yan binding in third instar larval eye discs, represented as smoothed tag density with a scale of number of reads per million; alignment was performed to Drosophila genome assembly Dm3. For clarity, the longest isoform of each gene is depicted, with 5’ and 3’ ends noted. Arrows mark the location of the primers used for ChIP-qPCR; gray boxes mark the location of peaks called by MACS (see Figure 7—source data 1). (A) spalt major locus (salm). (B) prospero locus (pros). (C) yan locus (aop). (D) argos locus (aos). (E) ChIP-qPCR of wildtype and yanSY5 eye discs. Error bars represent SEM of n = 3 biological replicates. Significance was calculated by Student’s T-test *, p<0.05. (F) Transcription assays with the spalt reporter. Error bars represent SEM of n = 4 biological replicates. Significance was calculated by Student’s T-test *, p<0.05; n.s., not significant. (G–H) spalt reporter-driven GFP expression, in a wildtype (G) and SY5 background (H). (I–J) pros reporter-driven GFP expression, in a wildtype (I) and SY5 background (J). Scale bars represent five microns.
-
Figure 7—source data 1
Genomic coordinates of MACS-called Yan ChIP peaks.
- https://doi.org/10.7554/eLife.37545.018
Figure 7—figure supplement 1

Comparison of Yan ChIP patterns in the eye disc versus embryo reveals eye-specific occupancy at salm.
(A-D) ChIP-seq tracks of Yan binding in third instar larval eye discs, as in Figure 7, compared to embryo ChIP-seq (Webber et al., 2013). Tracks are represented as smoothed tag density with a scale of number of reads per million; alignment was performed to Drosophila genome assembly Dm5. For clarity, the longest isoform of each gene is depicted, with 5′ and 3′ ends noted. Arrows mark location of primer binding for ChIP-qPCR; gray boxes mark the location of peaks called by MACS (see Figure 7—source data 1). (A) spalt major locus (salm). (B) spalt-related locus (salr). (C) prospero locus (pros). (D) yan locus (aop). (E) argos locus (aos).
Additional files
-
Transparent reporting form
- https://doi.org/10.7554/eLife.37545.019
Download links
A two-part list of links to download the article, or parts of the article, in various formats.
Downloads (link to download the article as PDF)
Open citations (links to open the citations from this article in various online reference manager services)
Cite this article (links to download the citations from this article in formats compatible with various reference manager tools)
Tuned polymerization of the transcription factor Yan limits off-DNA sequestration to confer context-specific repression
eLife 7:e37545.
https://doi.org/10.7554/eLife.37545


