Single-particle cryo-EM structure of a voltage-activated potassium channel in lipid nanodiscs
- National Institutes of Health, United States
- Frederick National Laboratory for Cancer Research, United States
Figures
Figure 1 with 2 supplements
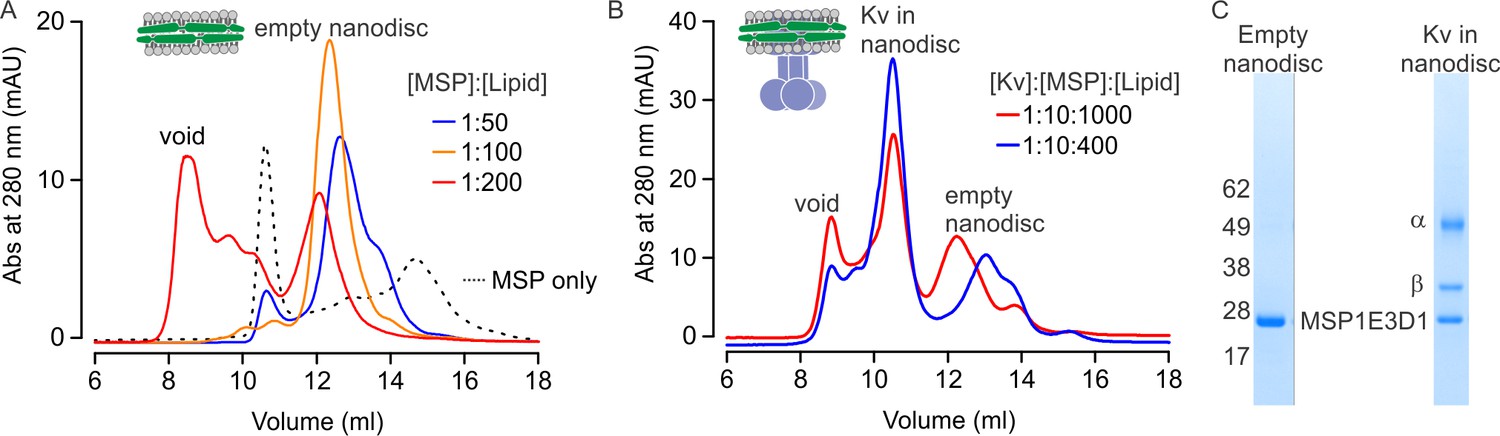
Reconstitution of the Kv chimera into lipid nanodiscs.
(A) Size exclusion chromatograms of empty nanodiscs assembled under different molar ratios of MSP1E3D1:lipid where the lipid mixture is 3:1:1 POPC:POPG:POPE. (B) Reconstitution of Kv chimera into nanodiscs. Size exclusion chromatograms of the Kv chimera reconstituted into nanodiscs at different molar ratios of Kv chimera:MSP1E3D1:lipid (same lipids used for empty nanodiscs). (C) SDS-PAGE of main fractions collected from size exclusion chromatography (B) for nanodisc assembly at molar ratios of 1:10:1000.
Figure 1—figure supplement 1
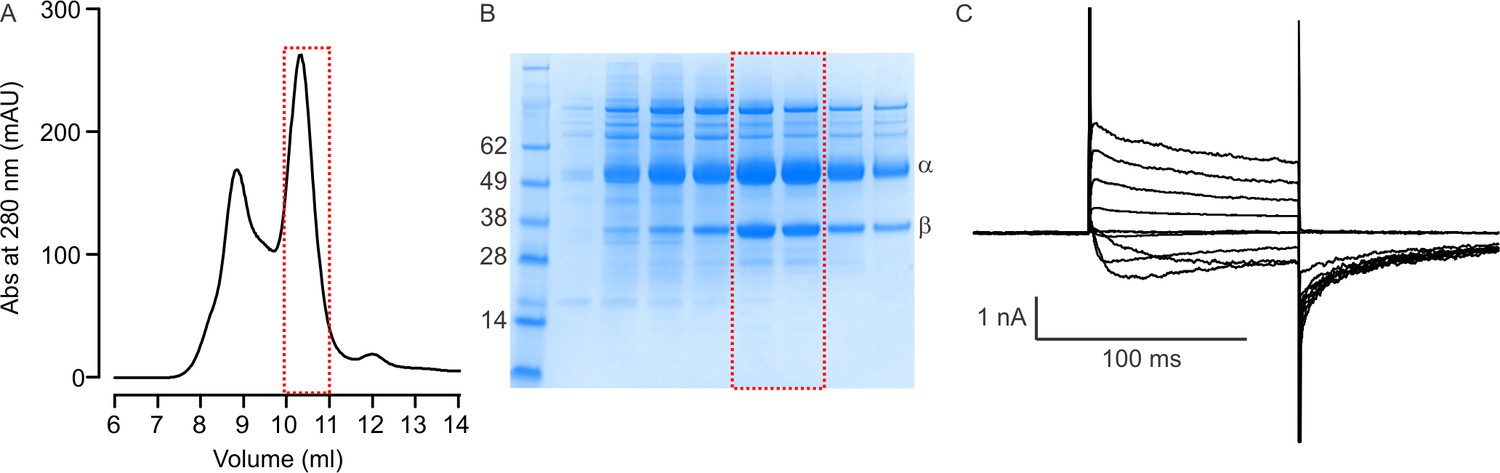
Purification and functional analysis of Kv chimera.
(A) Representative gel filtration chromatogram of the Kv chimera purified in detergent using Superdex 200 (10 × 300 mm) column. (B) SDS-PAGE profile of fractions (500 µl) collected from the Superdex 200 column. Fractions collected between 10 and 11 ml (red box) were pooled, concentrated and used for reconstitution into membrane vesicles comprised of POPE and POPG (3:1). (C) Recording of the Kv chimera reconstituted into a planar lipid bilayer formed with DPhPC. Holding voltage was −110 mV and tail voltage was −90 mV, with voltage steps from −130 to +70 mV in 20 mV increments. Concentration of KCl was 150 mM on both sides of the bilayer.
Figure 1—figure supplement 2
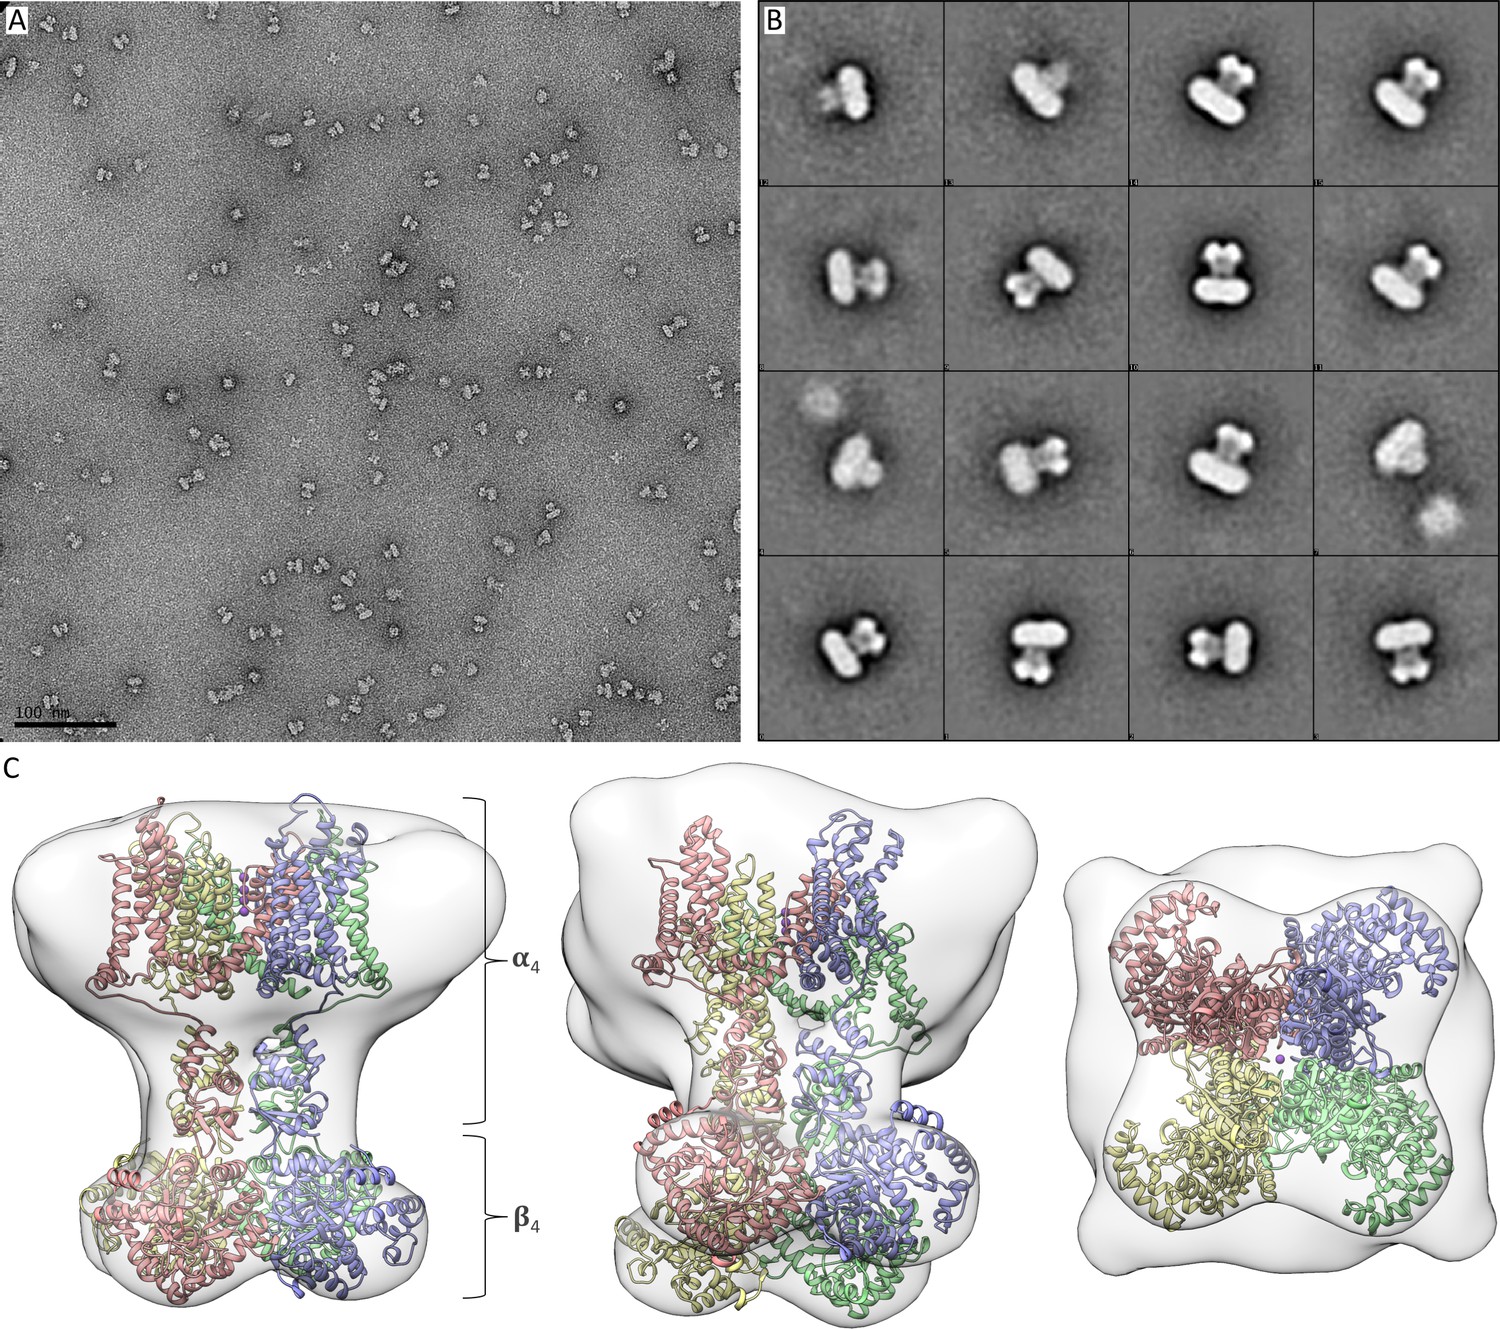
Negative staining electron microscopy of purified Kv chimera in lipid nanodiscs.
(A) Representative micrograph indicating many isolated single particles. (B) Selected 2D class averages showing many side views of intact complexes composed of four α and four β subunits in lipid nanodiscs, along with some subcomplexes lacking the β subunit. It is notable that the angle and position of the cytosolic domain with respect to the transmembrane region was variable in different 2D class averages. In addition, slight variations in the size of lipid nanodiscs can be observed, as well as various locations of the protein complex inside lipid nanodiscs. (C) An initial map generated from a subset of the 2D class averages is shown with the docked X-ray structure of the Kv channel (PDB entry 2r9r) from the side (left), slightly tilted (center) and from the cytosolic side (right).
Figure 2 with 2 supplements
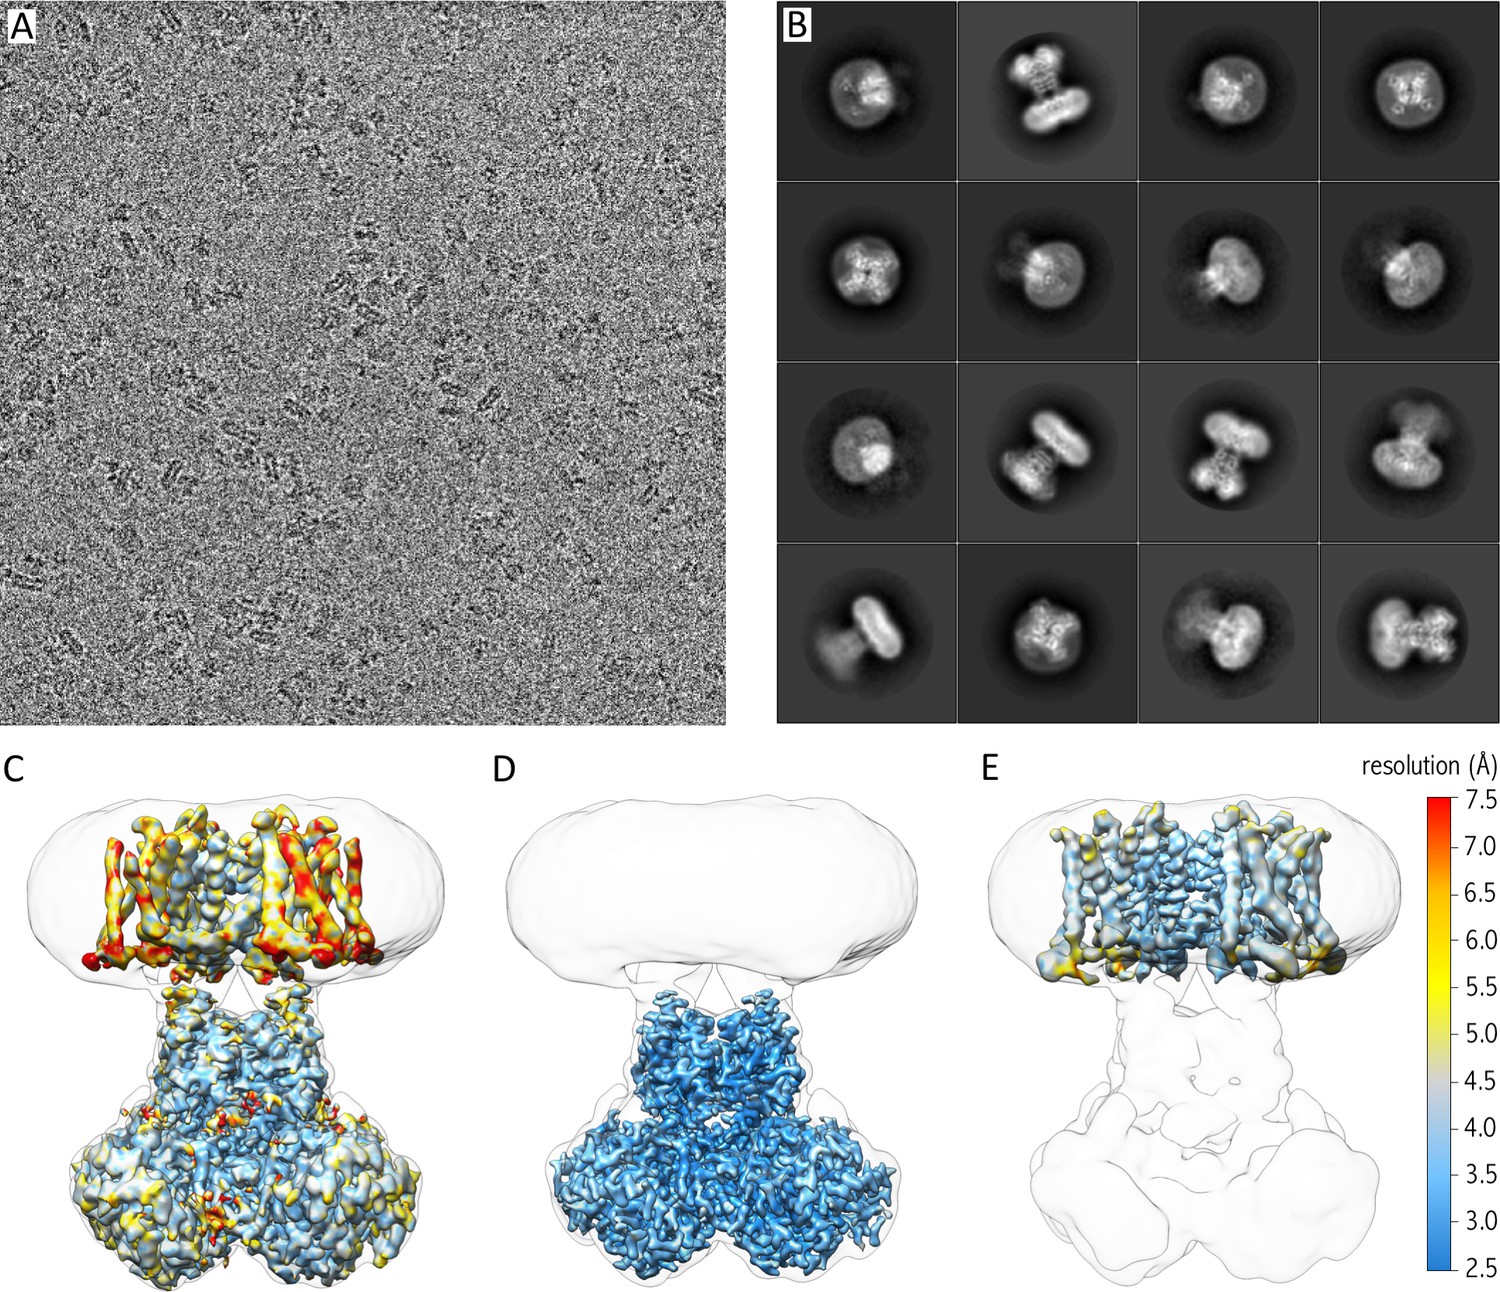
Cryo-EM of purified Kv chimera in lipid nanodiscs using gold grids.
(A) A representative micrograph at approximately −1.7 µm defocus. (B) 2D class averages of the 16 most populated classes out of 118,556 selected particles. (C) 3.3 Å map of entire complex filtered and colored according to local resolution fitted into a low resolution 3D class envelope. (D) 3 Å map of the cytosolic domain after focused refinement colored according to local resolution and fitted into a low resolution 3D class envelope. (E) 4 Å map of the transmembrane domain after focused refinement and local resolution filtering, colored according to local resolution and fitted into a low resolution 3D class envelope. FSC curves for each map are shown in Figure 2—figure supplement 2.
Figure 2—figure supplement 1
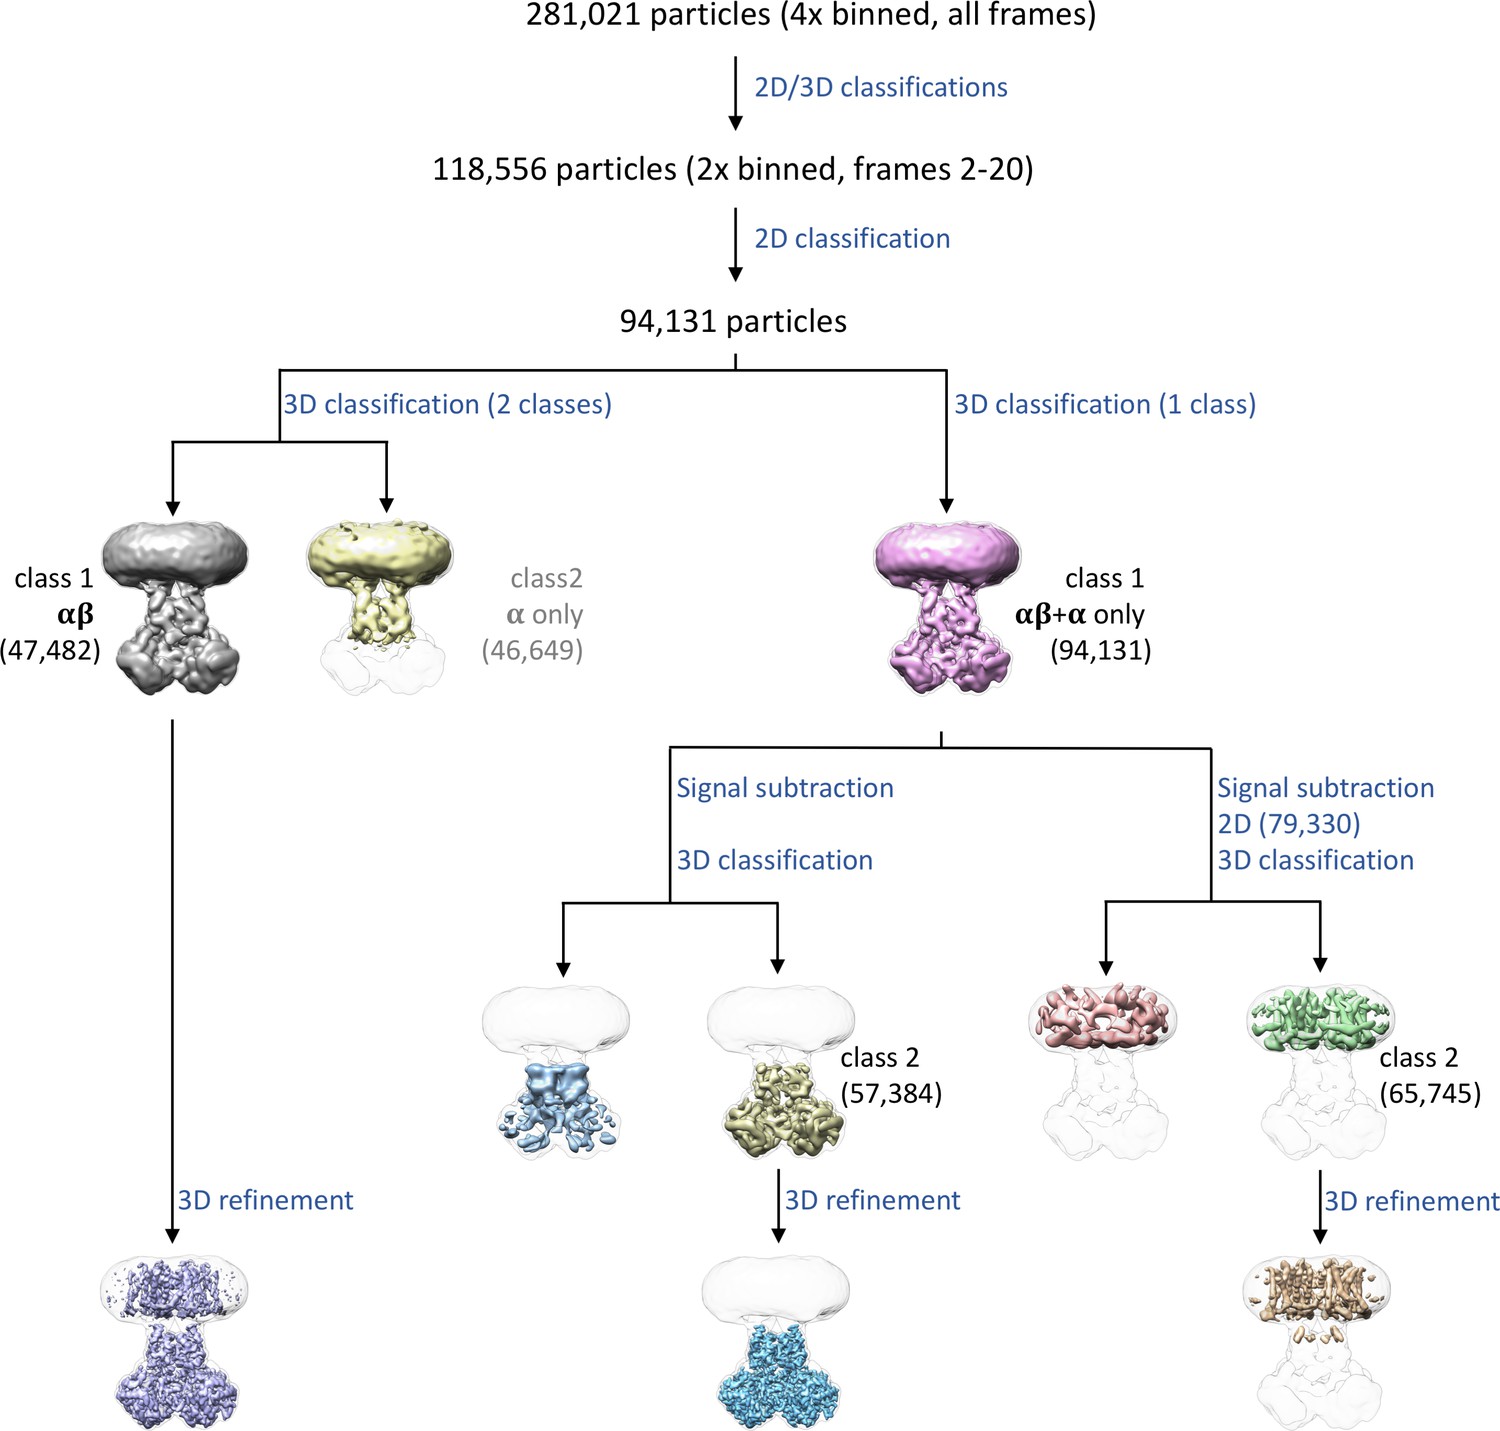
Data processing details.
281,021 particles were extracted from 2,062 micrographs using a binning factor of 4. 118,556 particles indicating the presence of a nanodisc were left after multiple rounds of 2D and 3D classification, which were then re-extracted with a binning factor of 2 only using frames 2–20. An additional round of 2D classification resulted in a selection of 94,131 particles. To obtain the map of the entire complex, a round of 3D classification into 2 classes was carried out that divided the data into particles with both α and β subunits, and particles that seem to contain only α subunits. The particles yielding the map containing α and β subunits were used for 3D refinement to obtain the 3.3 Å map of the entire complex. Additional maps of the cytosolic domain and the transmembrane domain were obtained by a forced 3D classification of 94,131 particles into a single class, followed by signal subtraction and additional rounds of classifications and refinements. A 3 Å map of the cytosolic domain was finally generated from 57,384 particles. For the TM domain, an overall 4 Å map was generated from 65,745 particles.
Figure 2—figure supplement 2
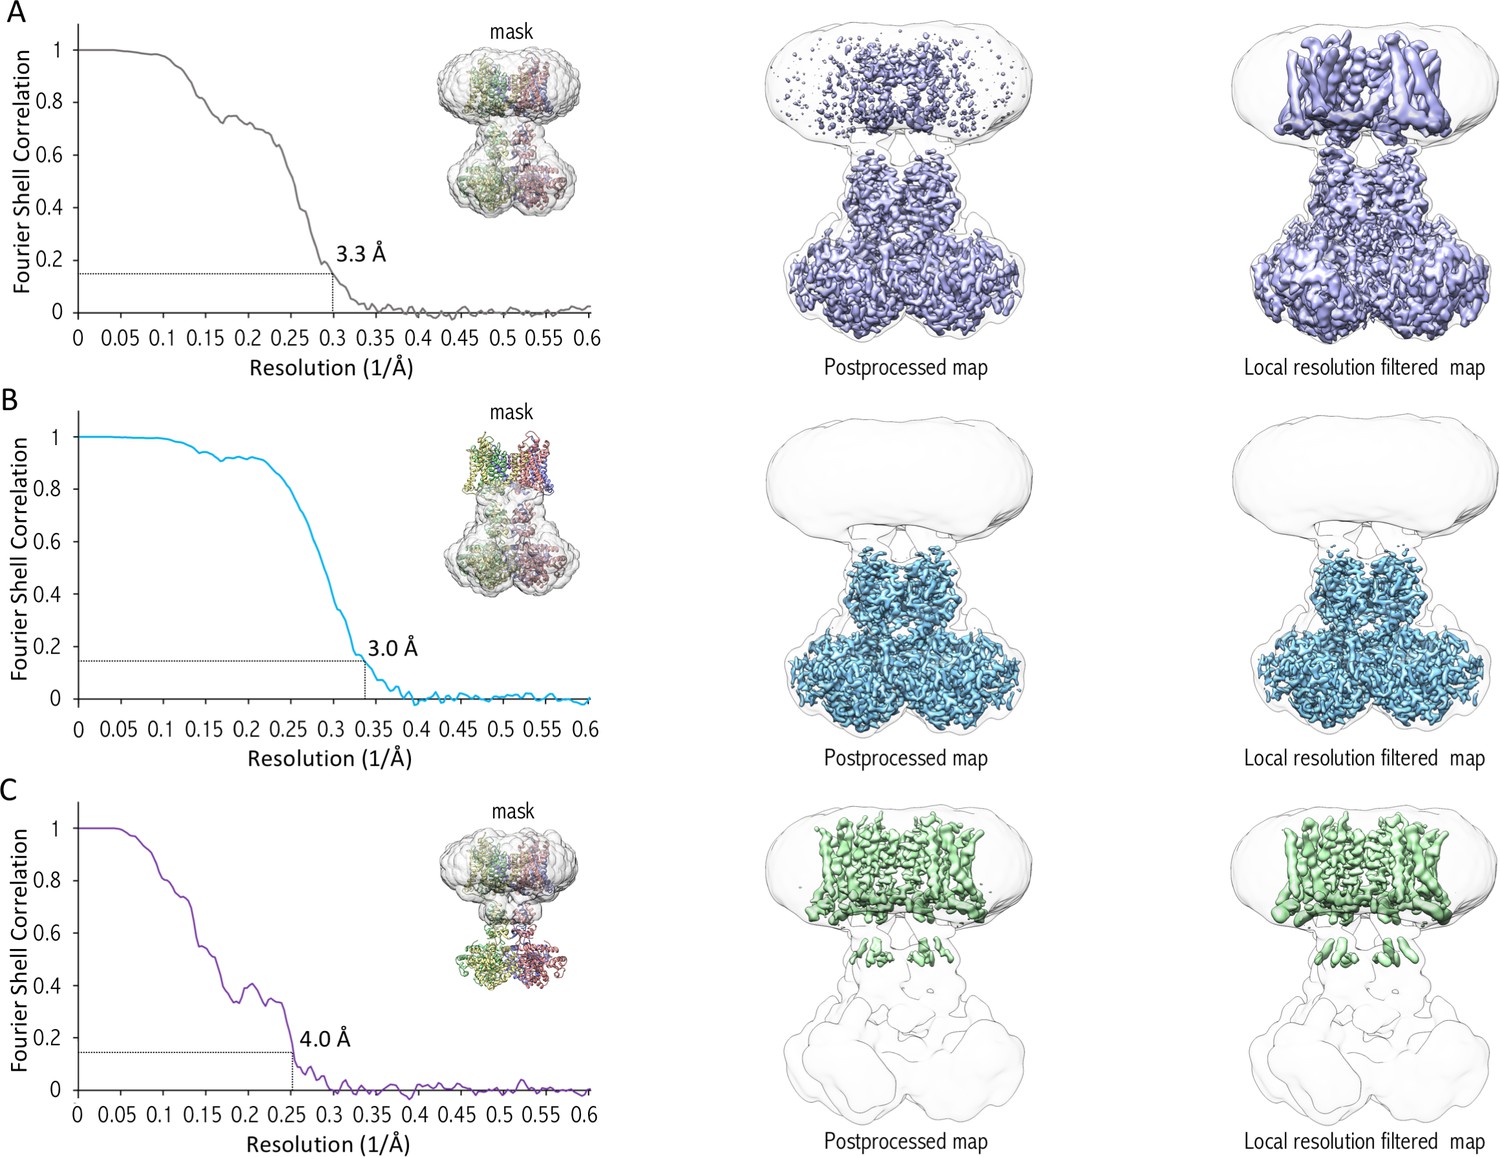
FSC curves indicating overall resolution of cryo-EM maps.
(A–C) Gold-standard FSC curves of entire complex (A), cytosolic domain (B) and transmembrane domain (C) are shown indicating resolutions according to the 0.143 FSC criteria of 3.3, 3 and 4 Å, respectively. Masks used to calculate the FSC are shown in each panel, as well as the corresponding maps using RELION’s postprocessing and local resolution filtering.
Figure 3 with 3 supplements
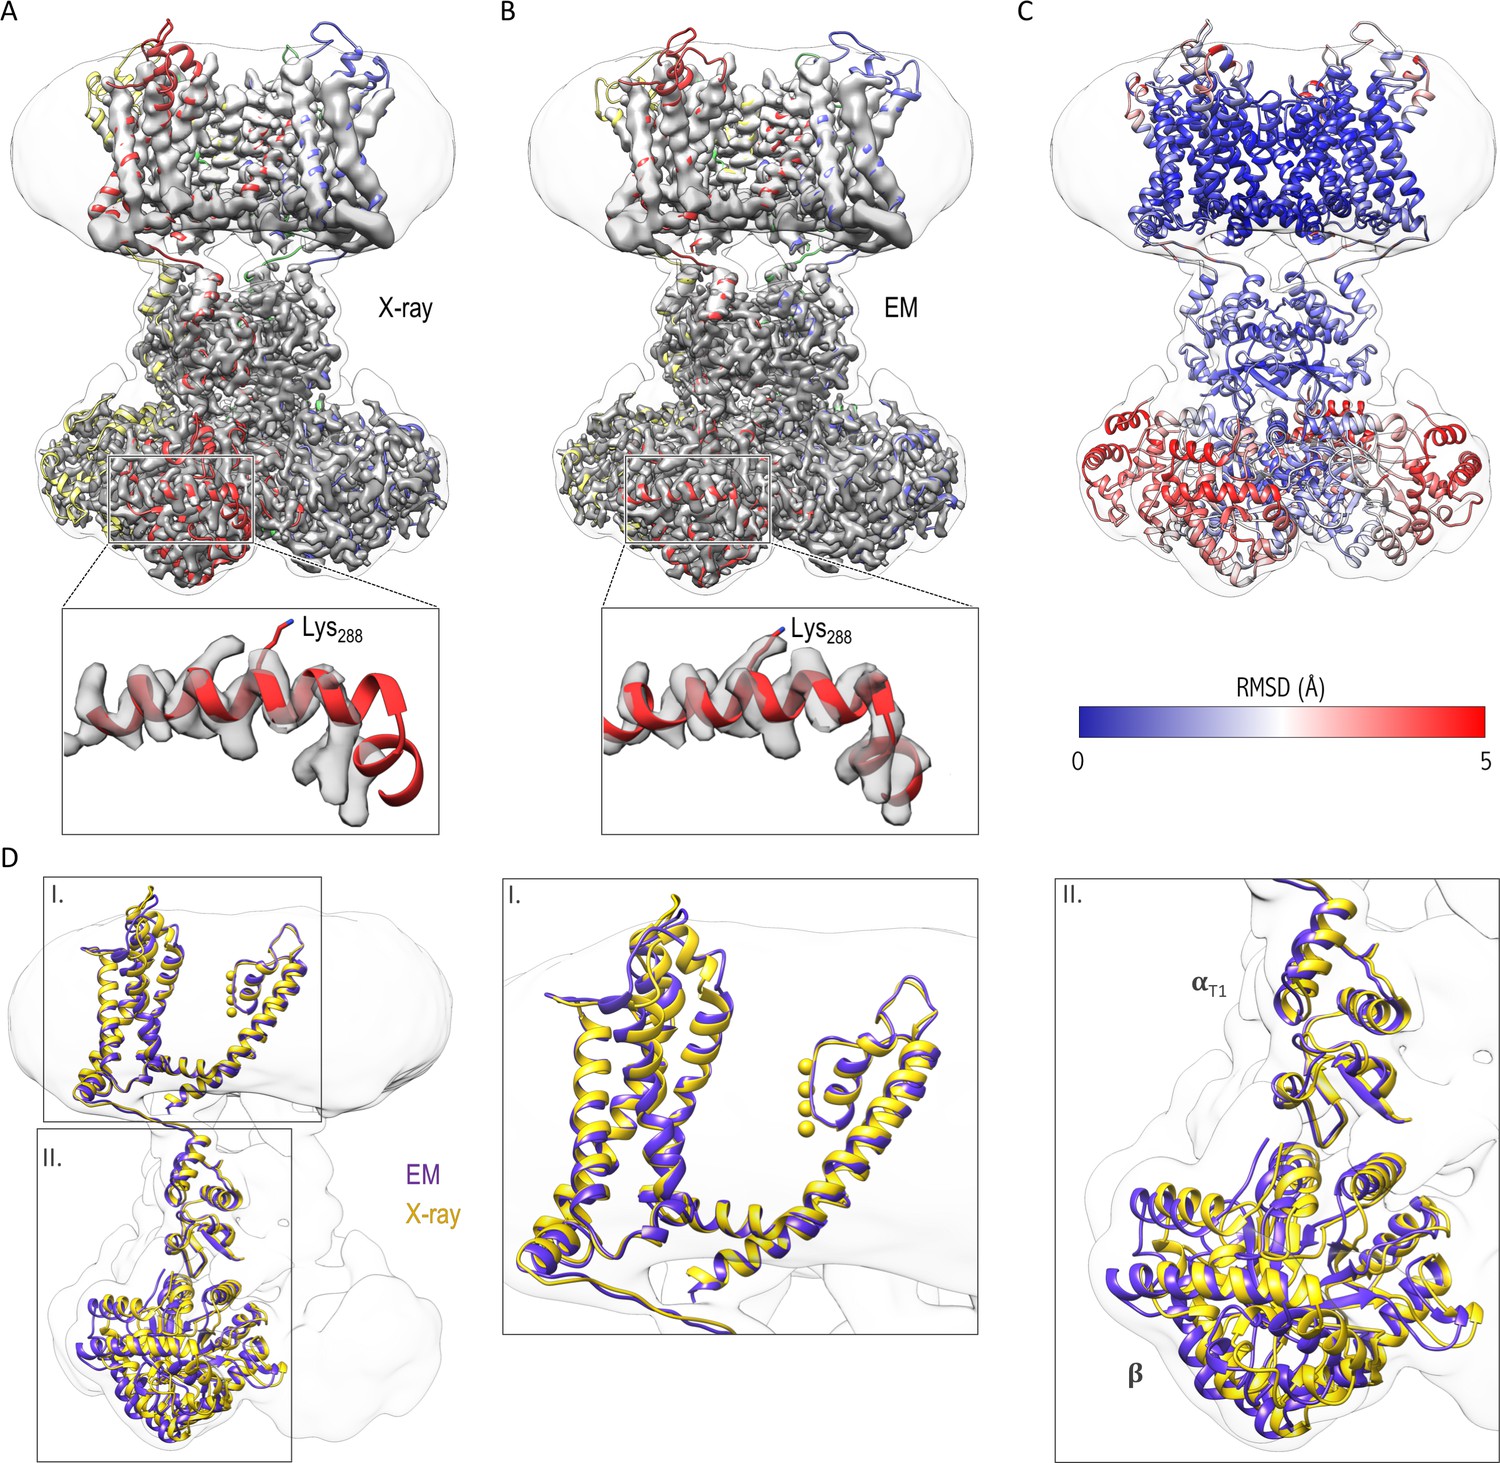
Comparison of the structures of the Kv chimera solved in detergent by X-ray crystallography and in lipid nanodiscs by single-particle cryo-EM.
(A) The X-ray structure (PDB entry 2r9r) is shown in the overlapping cryo-EM maps with fitting of the transmembrane region to the map. Notice the slight displacement/shift of the X-ray structure is most pronounced in the cytosolic β subunit. (B) Final model refined against the cryo-EM maps is shown with the maps. (C) The structural difference between the X-ray structure and the cryo-EM structure is illustrated with the backbone atom RMSD values (0.096–5.759 Å). α subunits were used for superpositioning of the two structures. (D) The superpositioning of the X-ray (gold) and cryo-EM (purple) structure with the close-up views of the transmembrane (I) and cytosolic (II) domains.
Figure 3—figure supplement 1
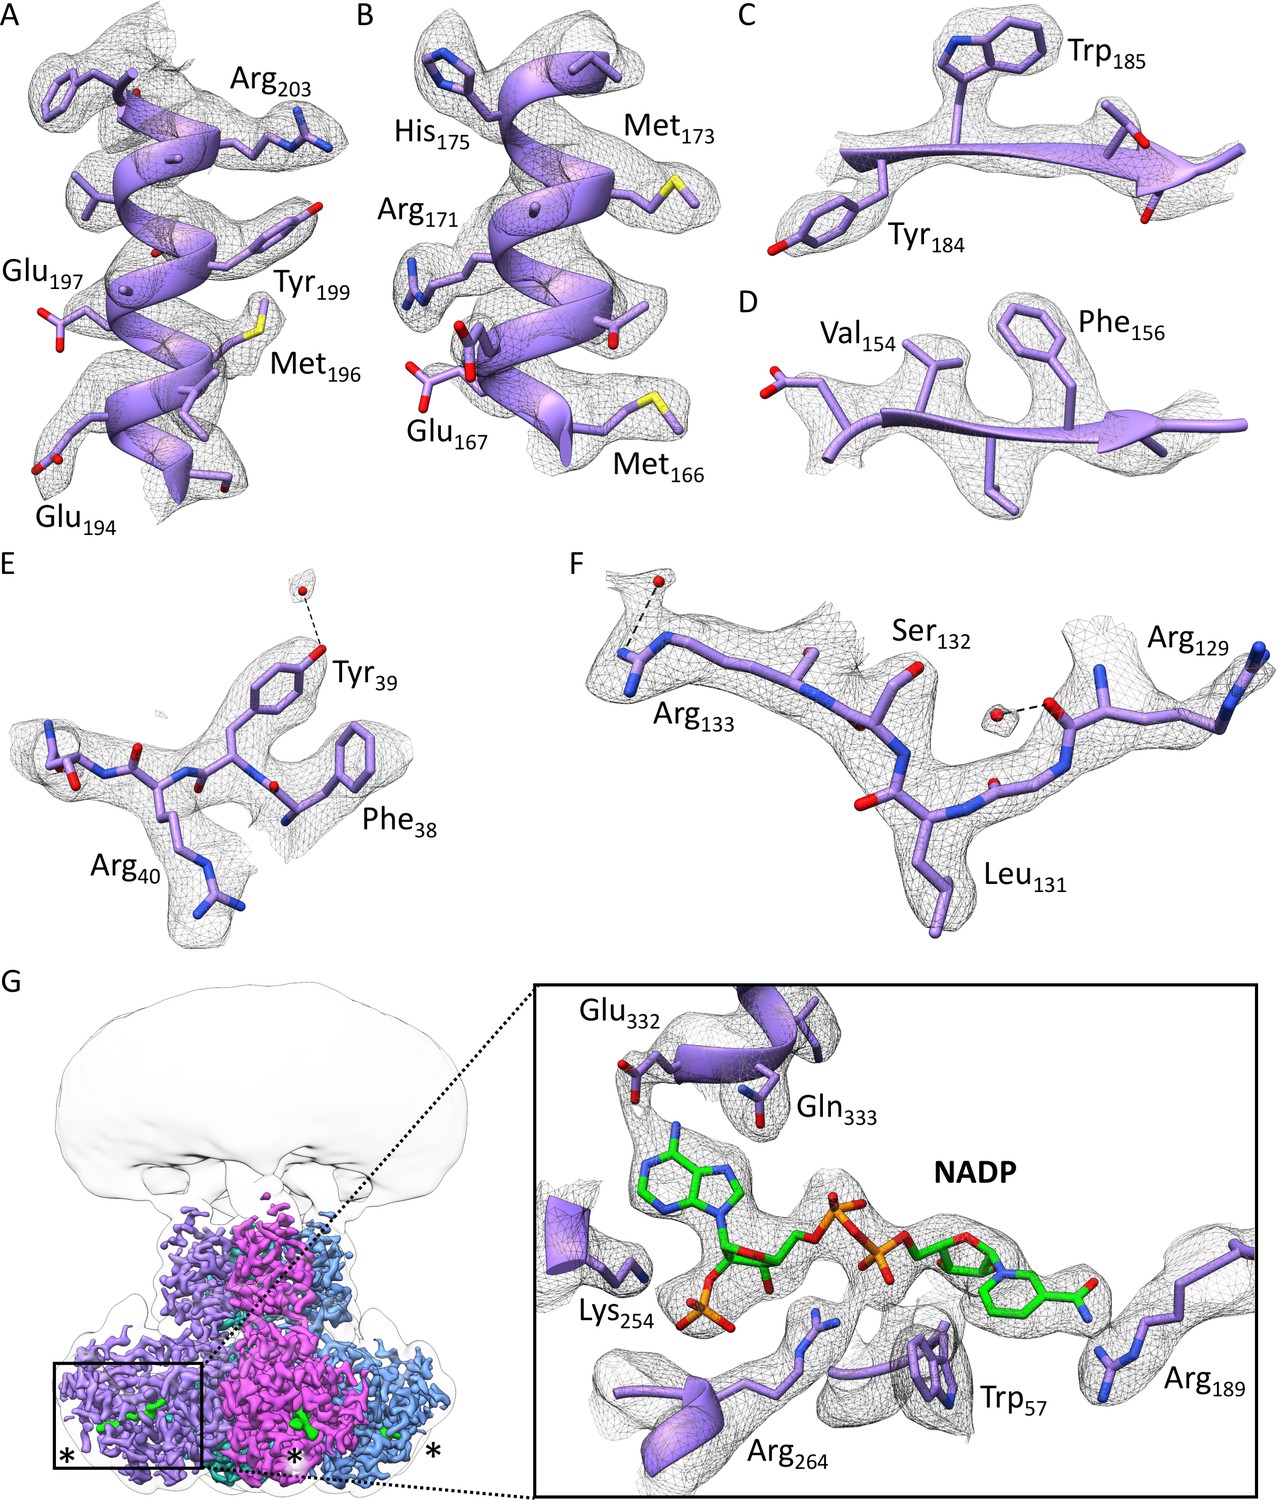
Quality of the cryo-EM density of the overall 3.0 Å resolution map of the cytosolic domain of the Kv chimera.
(A–B) Examples of two α-helical regions. (C–D) Examples of two β-sheets. (E–F) Higher resolution regions revealing densities for bound water molecules. (G) Ligand NADP+ in β subunit with its coordinating residues. Glu329, Ser325 and Asp85 were removed for clarity.
Figure 3—figure supplement 2
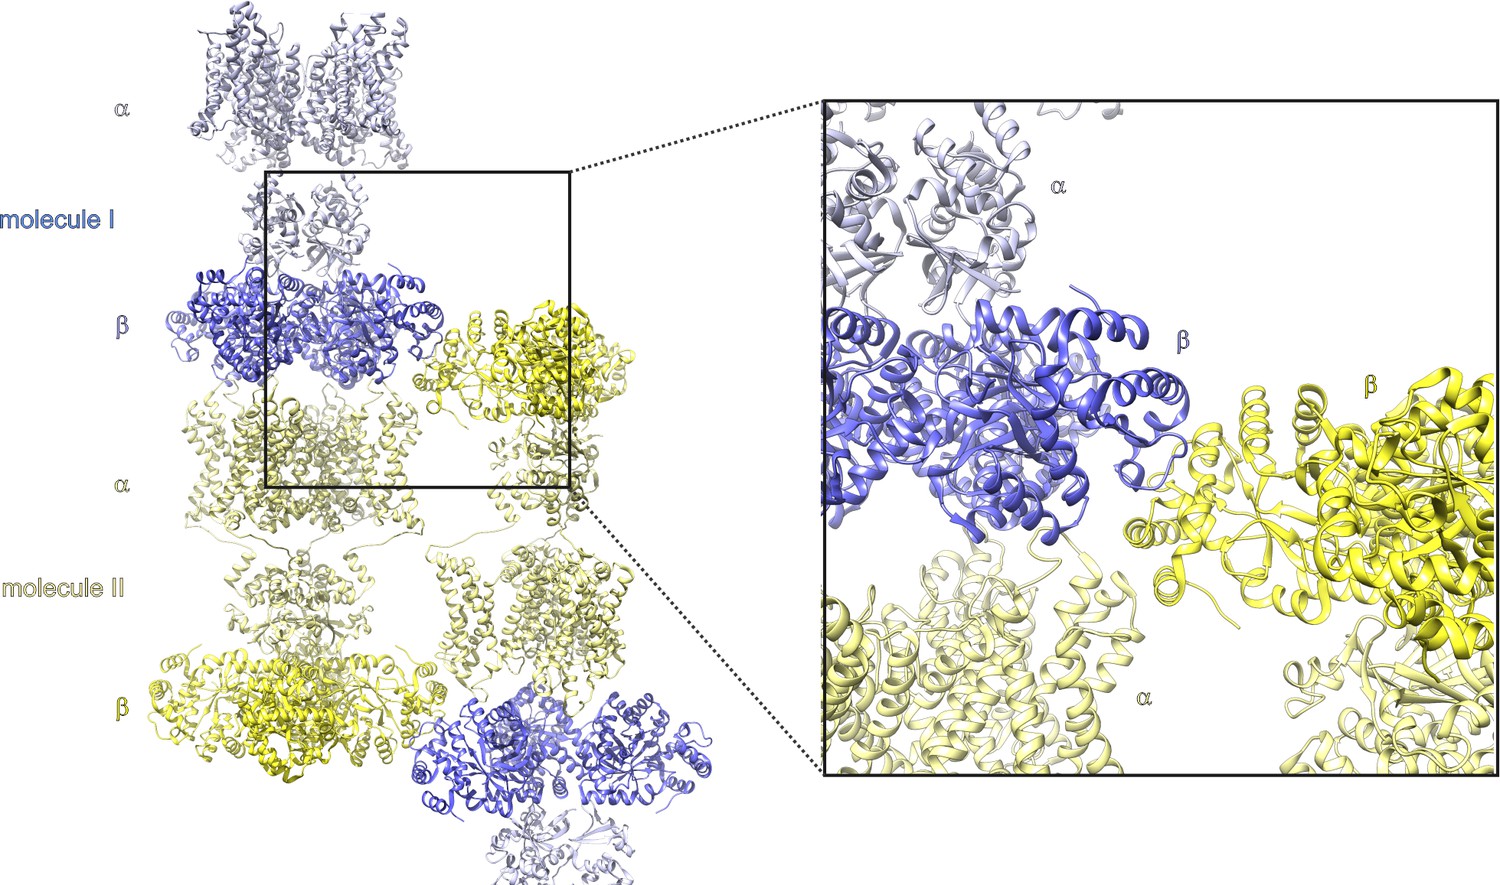
Crystal contacts between the Kv chimera β subunits in crystals used to solve the X-ray structure.
PDB entry 2r9r. The asymmetric unit contains two molecules (one of four αβ monomers in molecule I and II) and each molecule is composed of channel-forming α subunits and auxiliary cytosolic β subunits. Highlighted are the contact sites of β subunits from independent molecules in the crystal.
Figure 3—figure supplement 3
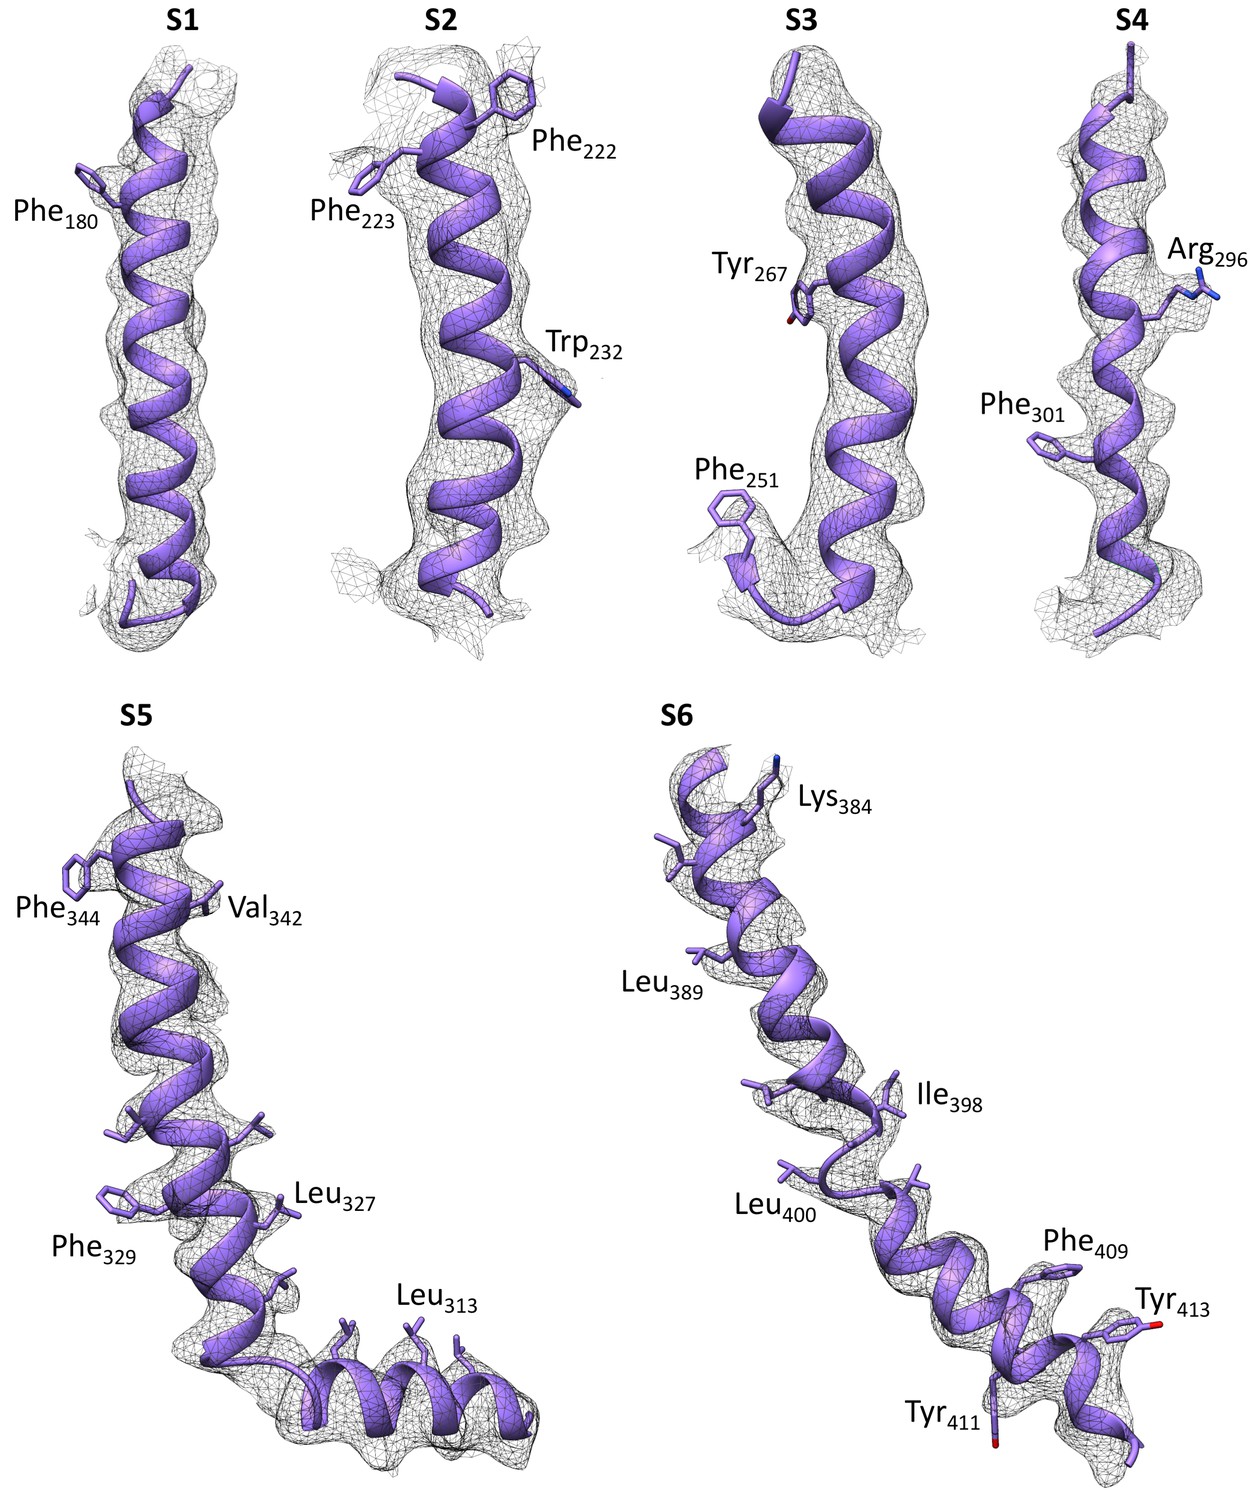
Quality of the cryo-EM density map of the transmembrane domain at an overall 4 Å resolution.
The map was filtered according to local resolution. Six transmembrane helices S1 to S6 are shown. Several areas with large side chains show bumps along the sausage-like densities for the transmembrane helices. The resolution for S5-S6 in the center of the TM domain shows higher resolution compared to the peripheral S1-S4 helices within the voltage-sensing domain.
Figure 4
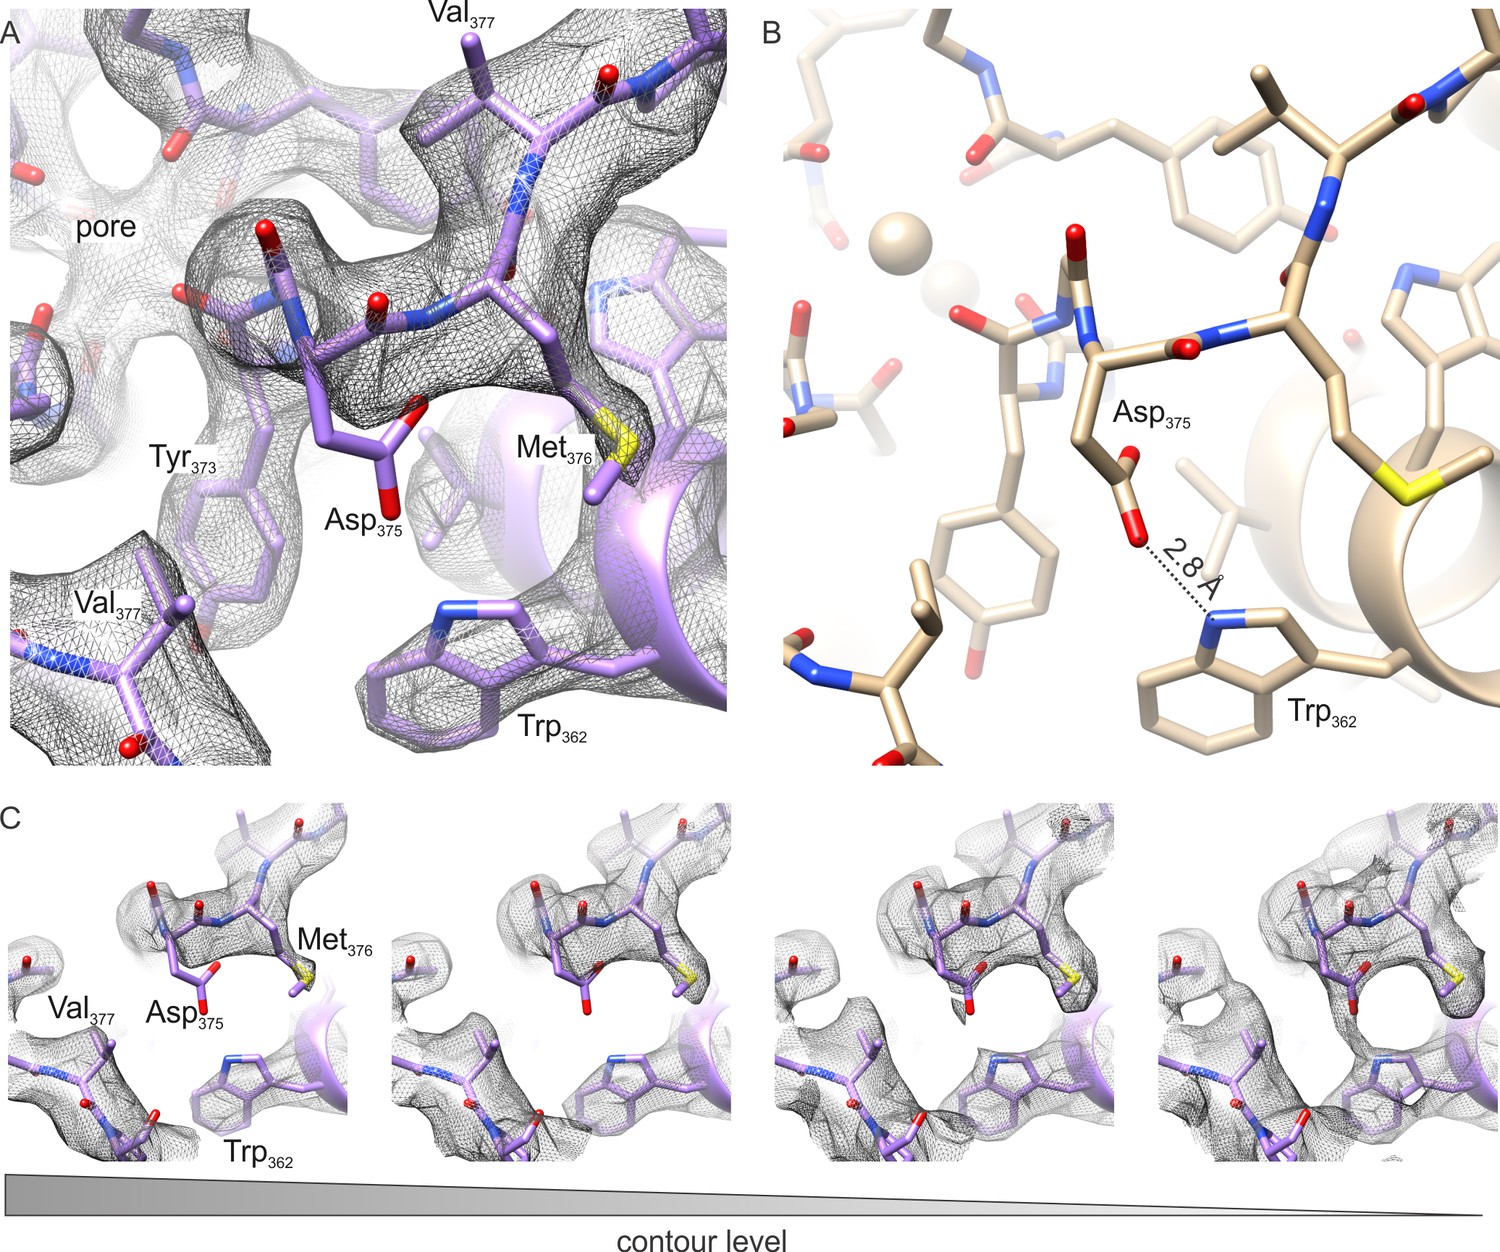
The outer pore region of the Kv chimera.
(A–B) Extracellular views of the outer pore region of the structures of the Kv chimera solved by cryo-EM (A) and X-ray crystallography (B; 2r9r). D375 and W362, the key residues that are expected to be involved in C-type inactivation are shown. (C) Weak sidechain density for D375 shown at different contour levels.
Figure 5 with 1 supplement
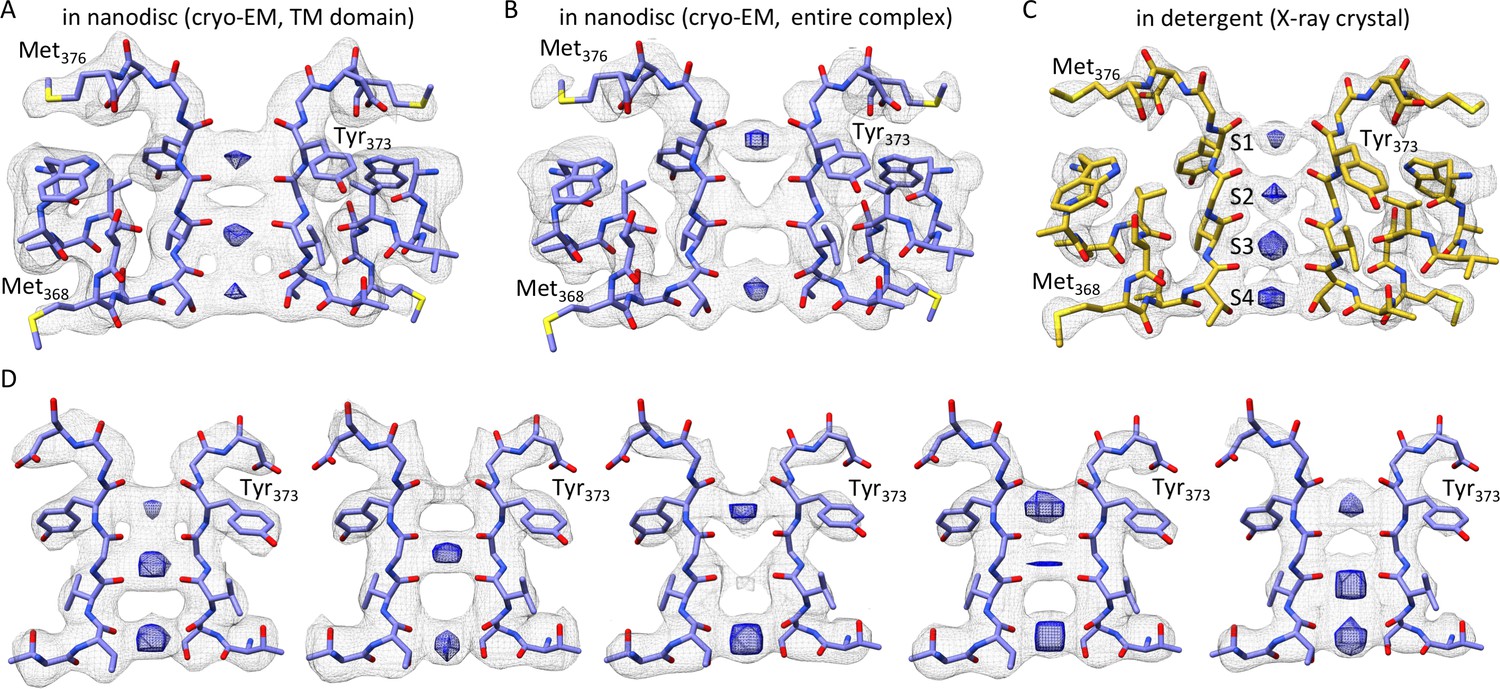
The selectivity filter of the Kv chimera.
(A) Transmembrane view of the selectivity filter of the Kv chimera solved by cryo-EM in lipid nanodiscs with densities in the pore from the ~4.0 Å map with local higher resolution in this central region of 65,745 signal subtracted particles including only the transmembrane region. (B) Cryo-EM structure of the selectivity filter from the ~3.3 Å map of the entire complex of 47,482 particles. (C) Same view of the selectivity filter of the Kv chimera solved by X-ray crystallography (PDB entry 2r9r). (D) A variety of maps obtained during processing. From left to right, ~3.6 Å map of the entire complex obtained from 67,300 particles, ~3.8 Å map of the entire complex obtained from 75,633 particles, ~3.9 Å map of the entire complex obtained from 63,826 particles, ~3.9 Å map of the entire complex obtained from 118,556 particles, and ~4.6 Å map with local higher resolution in this central region of the transmembrane domain after signal subtraction and focused refinement of 34,654 particles (right). The blue densities are shown from the same maps in gray, just at higher contour level and restricted to the central region of the pore.
Figure 5—figure supplement 1
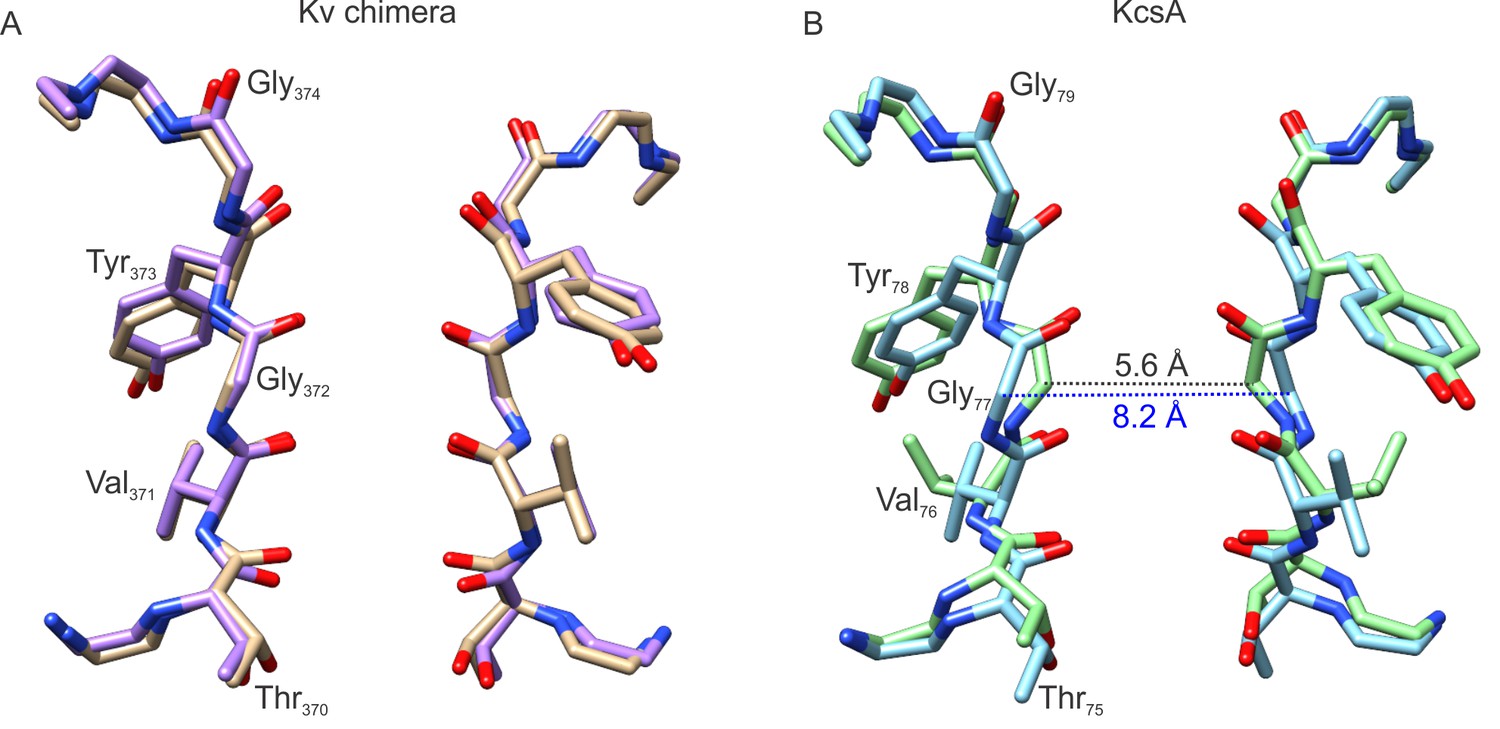
Comparison of the selectivity filters of the Kv chimera and KcsA.
(A) Superposition of the selectivity filter of the Kv chimera whose structure was solved by cryo-EM in lipid nanodiscs (purple) and by X-ray crystallography in detergent (tan, PDB entry 2r9r). (B) Superposition of the selectivity filter of KcsA (blue, PDB entry 1k4c) and an inactivation promoted mutant (green, KcsA Y82A, PDB entry 5vke), with distances shown between Cα atoms of G77.
Tables
Table 1
| Protein concentration | 0.7 mg/ml |
| Sample volume for EM grid | 3 µl |
| Grid type | UltraAuFoil 1.2/1.3 |
| Plunge freezer | Leica GP EM |
| Blotting time | 10 s |
| Blotting temperature | 4°C |
| Blotting chamber humidity (set/measured) | 95%/88% |
| Microscope | FEI Titan Krios |
| Camera | K2 Summit |
| Energy Filter | no |
| Cs corrector | no |
| Magnification | 29,000x |
| Dose rate | ~4.5 e-/px ∙ s |
| Total dose | ~40 e-/Å2 |
| Number of frames | 38 |
| Physical pixel size (microscope) | 0.858 Å/px |
| Super-resolution pixel size (microscope) | 0.429 Å/px |
| Final pixel size used for final maps | 0.835 Å/px |
| Number of total micrographs | 3,085 |
| Number of selected micrographs | 2,062 |
| Number of particles picked | 281,021 |
| Number of particles selected containing a lipid nanodisc | 118,556 |
| Number of particles in α4β4 map | 47,482 |
| Number of particles in the cytosolic domain map | 57,384 |
| Number of particles in the TM domain map | 65,745 |
| Average resolution in α4β4 map | 3.3 Å |
| Average resolution in cytosolic domain map | 3.0 Å |
| Average resolution in TM domain map | 4.0 Å |
| B-factor for α4β4 map | −89 |
| B-factor for cytosolic domain map | −84 |
| B-factor for TM domain map | −123 |
Additional files
-
Transparent reporting form
- https://doi.org/10.7554/eLife.37558.016
Download links
A two-part list of links to download the article, or parts of the article, in various formats.
Downloads (link to download the article as PDF)
Open citations (links to open the citations from this article in various online reference manager services)
Cite this article (links to download the citations from this article in formats compatible with various reference manager tools)
Single-particle cryo-EM structure of a voltage-activated potassium channel in lipid nanodiscs
eLife 7:e37558.
https://doi.org/10.7554/eLife.37558


