Synergistic assembly of human pre-spliceosomes across introns and exons
- University of Massachusetts Medical School, United States
- Brandeis University, United States
Figures
Figure 1 with 5 supplements
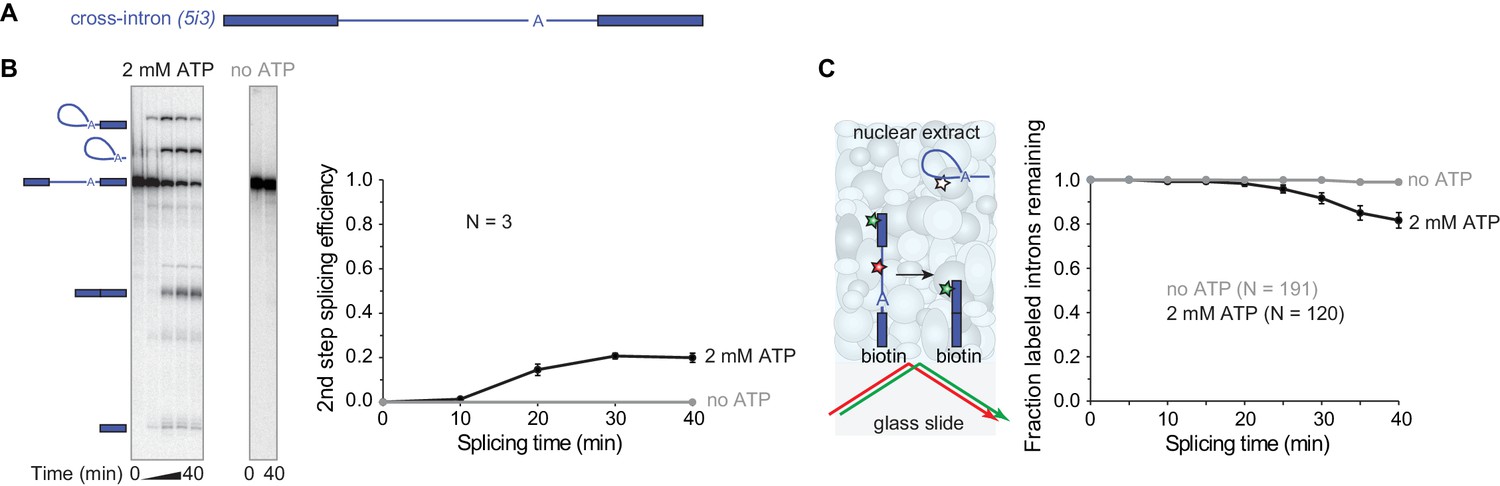
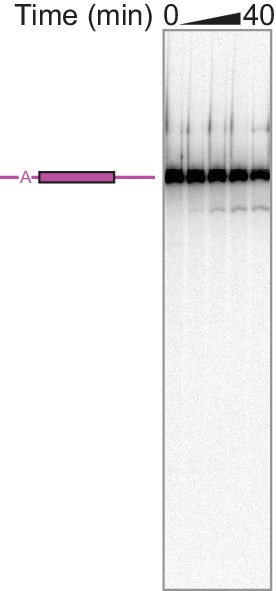
Observing splicing of the PIP85A (5i3) model pre-mRNA (A) in bulk (B) and single-molecule (C) splicing assays.
Introns and exons are schematized as blue lines and rectangles, respectively, with A indicating the branchpoint. For bulk analysis (B) trace-labeled 5i3 was incubated with nuclear extracts, aliquots were analyzed on denaturing gel (15%) and second step splicing products quantified in graph. Second step splicing efficiency (±s.d.) was calculated as the amount of ligated exon product relative to the amount of 5i3 starting material at time zero. For single-molecule analysis (C), dyes tethered to the surface (red, green stars) were visualized using total internal reflection fluorescence microscopy using alternating red and green laser excitation (arrows); dye-labeled molecules in solution are not detectable. Fraction (±s.e.) of labeled introns remaining was calculated as the fraction of the N molecules retaining the exon dye fluorescence (green star) through the entire experiment duration which retained intron dye fluorescence (red star) at a particular time. Labeling of spliceosomal subcomplexes is shown in Figure 1—figure supplements 1–5.
Figure 1—figure supplement 1
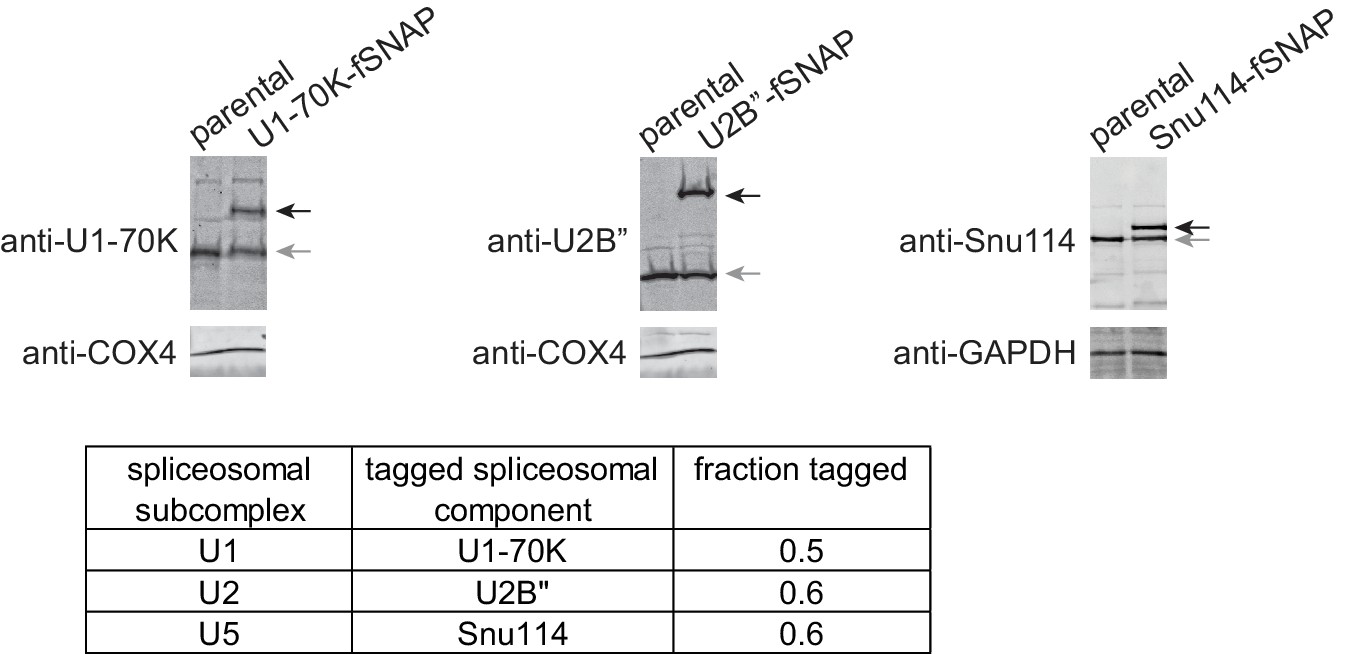
Expression of fSNAP-fusion proteins in HEK293 cells.
Western blots confirm expression of fSNAP-fusion proteins (black arrows) at levels similar to untagged endogenous proteins (gray arrows); Parental, untagged HEK293 cell line. Glyceraldehyde-3-phosphate dehydrogenase (GAPDH) and cytochrome c oxidase polypeptide IV (COX4) serve as loading controls. Fractions tagged (the amount of fSNAP-fusion protein relative to the total amounts of both untagged endogenous protein and fSNAP-fusion protein) are listed in the table. Anti-U1-70K (Synaptic Systems, 203011, RRID:AB_887903), anti-U2B'' (American Research Products, 4G3, 03–57035), anti-Snu114 (Bethyl, A300-957A, RRID:AB_805780), anti-COX4 (Bethyl, A301-899A, RRID:AB_1524093), anti-GAPDH (Bethyl, A500-005A, RRID:AB_10895657), anti-rabbit-680 (LI-COR, 926–68021, RRID:AB_10706309), and anti-mouse-800 (LI-COR, 926–32212, RRID:AB_621847) antibodies were used according to manufacturer’s recommendations.
Figure 1—figure supplement 2
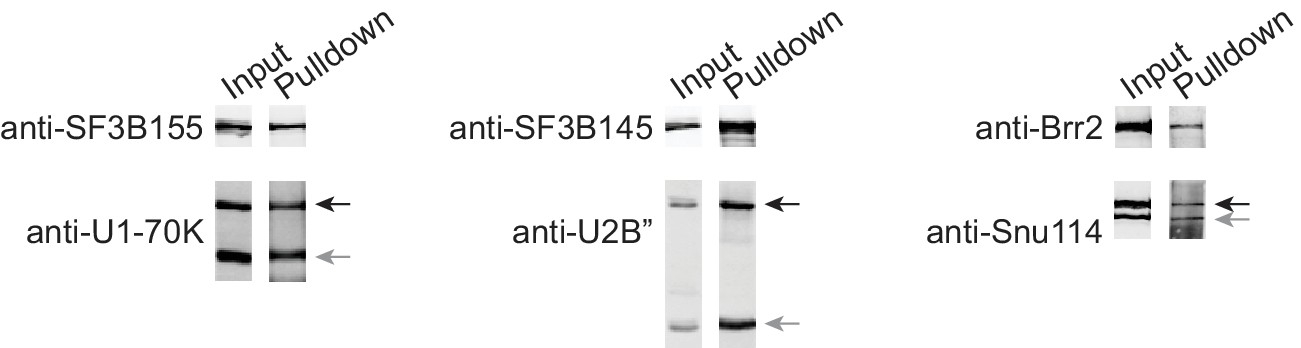
Co-immunoprecipitation experiments show integration of fusion proteins into spliceosome assembly intermediates at efficiencies similar to their endogenous untagged counterparts.
Indicated bait proteins were immunoprecipitated from nuclear extracts and aliquots from input (1%) and pulldown (30%) analyzed by Western blotting for immunoprecipitated bait protein (upper panel) and co-immunoprecipitated prey protein (both endogenous and fSNAP-tagged, gray and black arrows respectively). For co-immunoprecipitation the following antibodies were used according to manufacturer’s recommendations: U1-70K, anti-SF3B155 (Bethyl, A300-996A, RRID:AB_805834); U2B'', anti-SF3B145 (Bethyl, A301-606A, RRID:AB_1078828); and Snu114, anti-Brr2 (Bethyl, A303-453A, RRID:AB_10949362). For Western blotting anti-SF3B155 (Bethyl, A300-996A, RRID:AB_805834), anti-U1-70K (Synaptic Systems, 203011, RRID:AB_887903), anti-SF3B145 (Bethyl, A301-606A, RRID:AB_1078828), anti-U2B'' (American Research Products, 4G3, 03–57035), anti-Brr2 (Bethyl, A303-453A, RRID:AB_10949362), anti-Snu114 (Bethyl, A300-957A, RRID:AB_805780), anti-rabbit-680 (LI-COR, 926–68021, RRID:AB_10706309), and anti-mouse-800 (LI-COR, 926–32212, RRID:AB_621847) were used according to manufacturer’s recommendations.
Figure 1—figure supplement 3
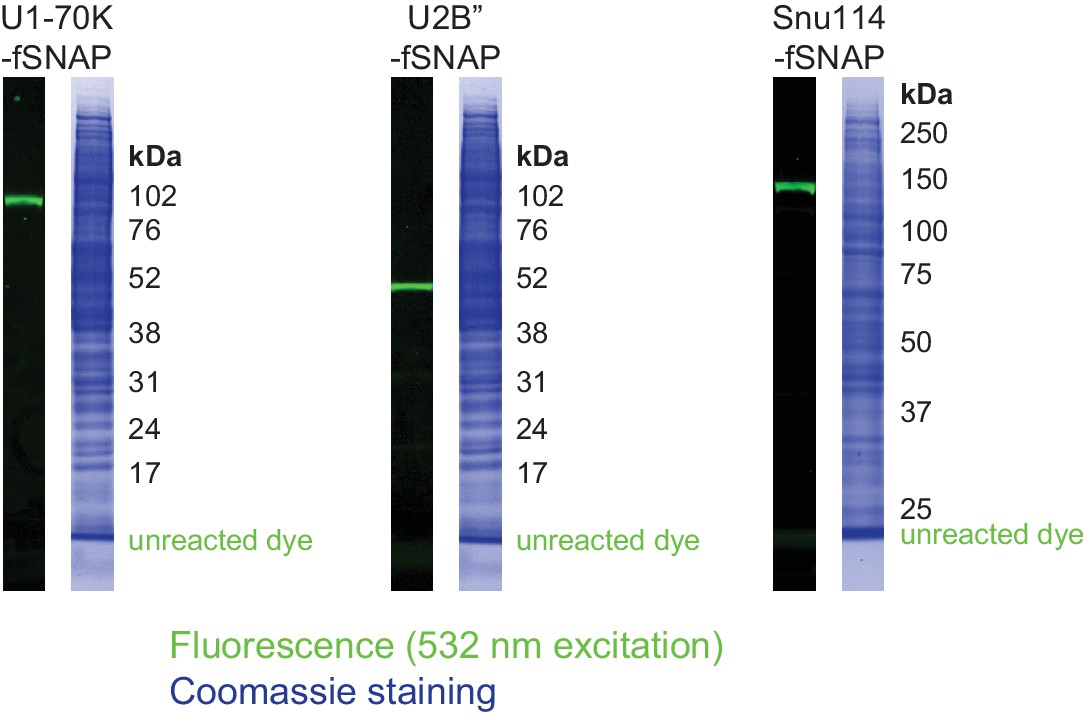
Spliceosomal subcomplex labeling in human nuclear extracts.
Fluorescence and Coomassie images of SDS-PAGE gel lanes show specific dye labeling of tagged spliceosomal components in nuclear extracts. Indicated migration position of unreacted dye was determined using control untagged nuclear extract spiked with the green-excited dye-benzylguanine adduct.
Figure 1—figure supplement 4
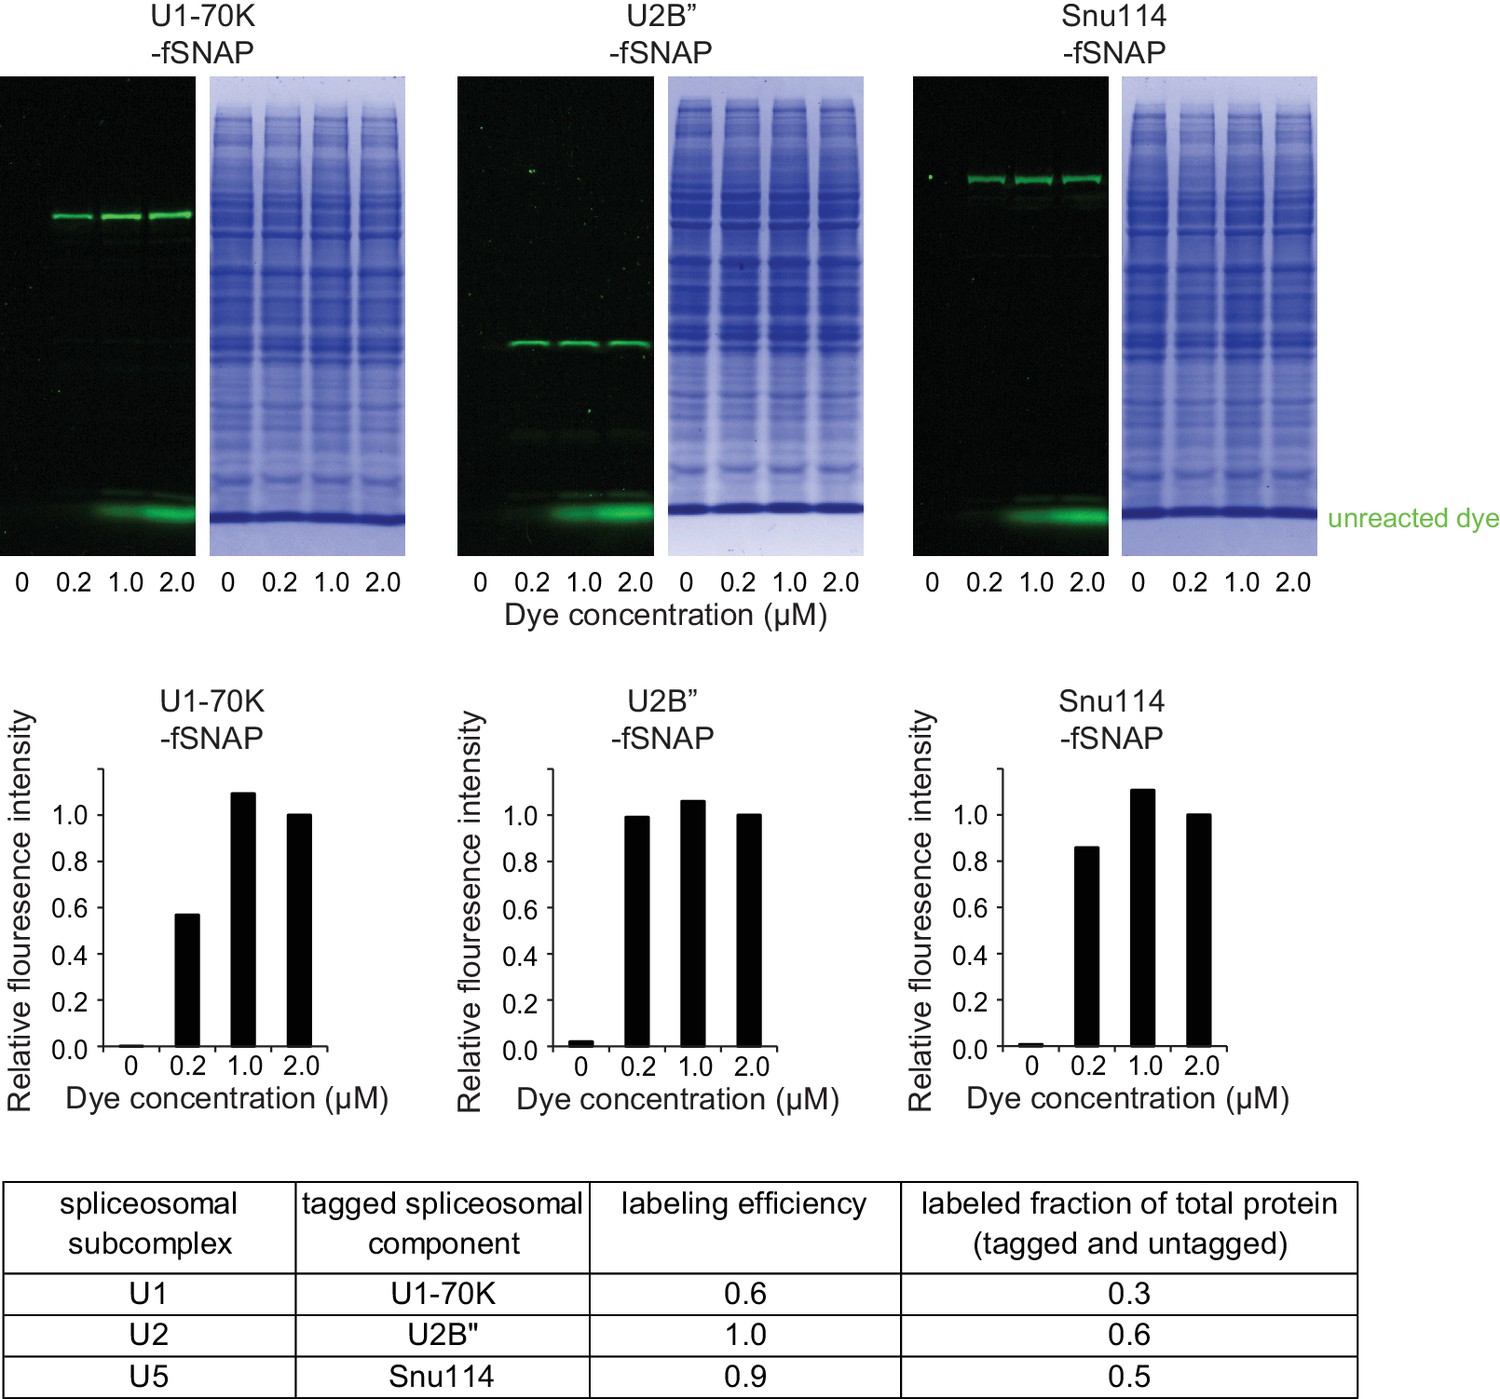
Labeling efficiencies for spliceosomal proteins.
Extracts were labeled at 200 nM, 1000 nM and 2000 nM benzylguanine-dye conjugate at 30°C for 1 hr. Fluorescence intensity in the region corresponding to each protein band is shown in the bar graph (N = 1) normalized to the fluorescence intensity at saturation (2000 nM). The fraction labeled of the tagged protein at 200 nM is estimated as ratio of labeled tagged protein at 200 nM and labeled tagged protein at saturation (2000 nM) and given in the table as ‘labeling efficiency’. Labeled fraction of total protein (tagged plus untagged) was calculated as the product of labeling efficiency and fraction tagged (Figure 1—figure supplement 1).
Figure 1—figure supplement 5
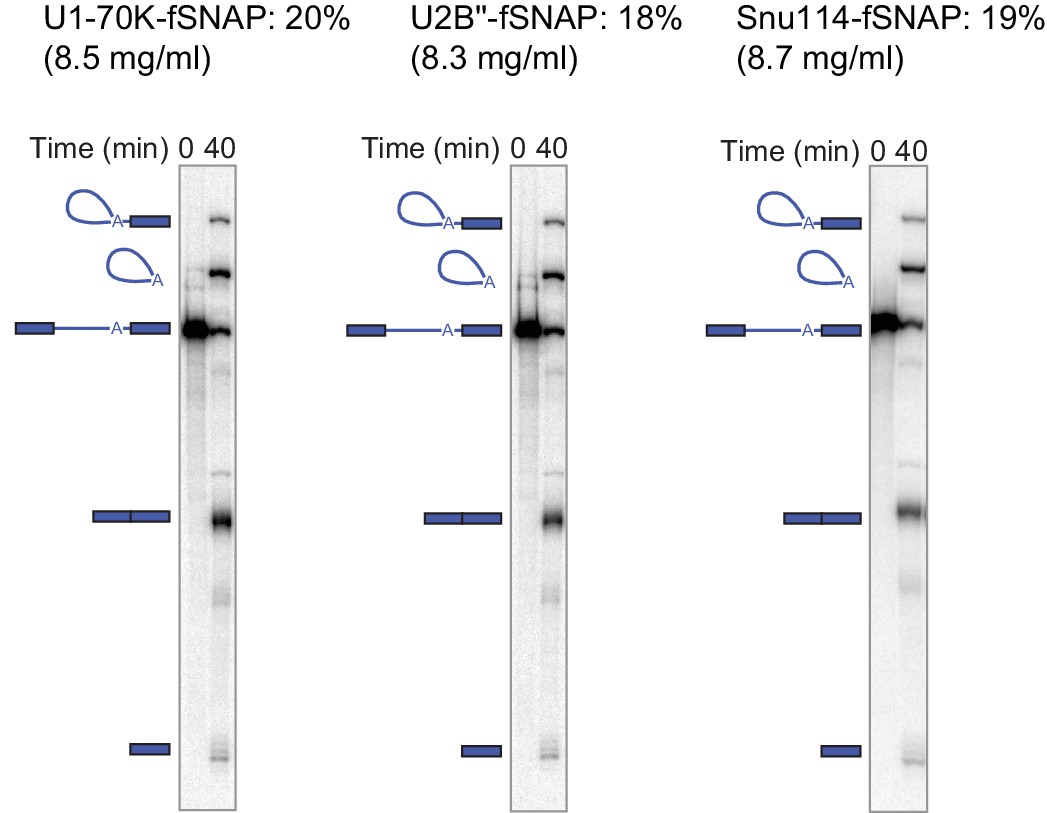
Bulk splicing efficiency and protein concentration for the nuclear extracts used in this study.
2nd step splicing efficiency was calculated as in Figure 1 at 40 min reaction time (N = 1). Protein concentration was determined using Bradford protein assay using bovine serum albumin as a standard (N = 1).
Figure 2 with 4 supplements
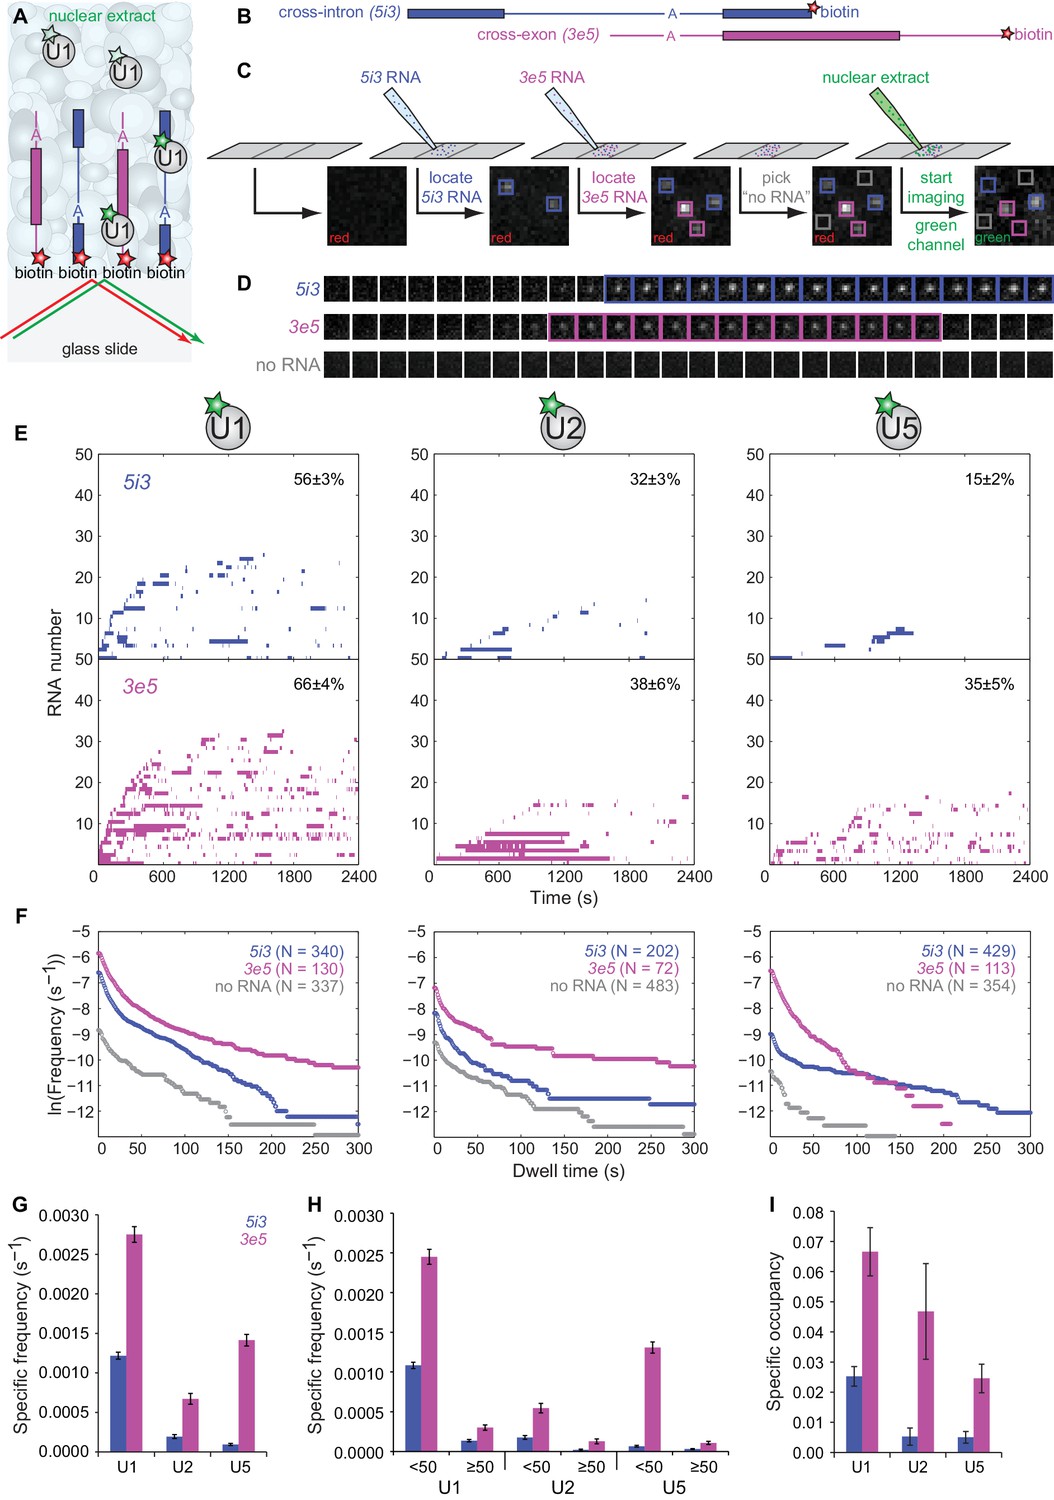
CoSMoS monitoring of spliceosomal subcomplex interactions with individual cross-intron (5i3) and cross-exon (3e5) pre-mRNA molecules in human nuclear extracts.
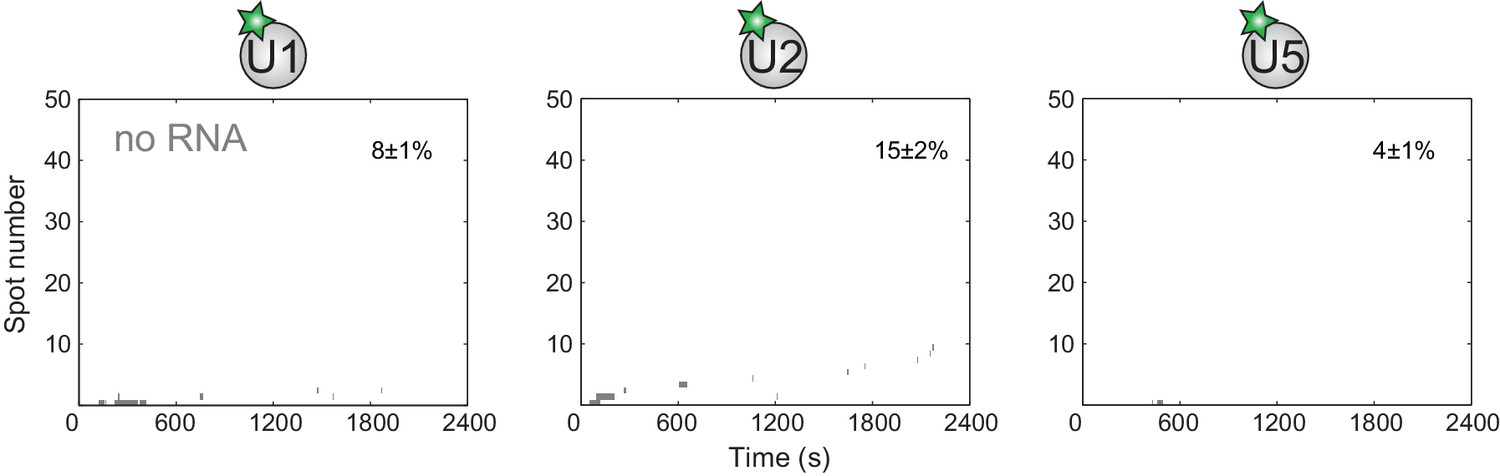
(A) Schematic of a CoSMoS experiment in which green dye-labeled U1 is observed binding to red dye-labeled, surface-tethered RNAs. Introns and exons are schematized as blue and magenta lines and rectangles, respectively, with A indicating the branchpoint. Dyes (stars) linked to tethered RNAs were visualized using total internal reflection fluorescence microscopy using alternating red and green laser excitation (arrows); dye-labeled molecules in solution are not detectable. (B) Schematic of 5i3 and 3e5 RNAs, with features indicated as in (A). See Table 1 for RNA sequences. (C) Protocol: 5i3 (blue) and 3e5 (magenta) RNAs were sequentially deposited and located (squares) under red laser excitation. Non-overlapping control ‘no RNA’ locations (gray) were selected. Then, extract was introduced and spliceosomal subcomplex (e.g., U1) binding to individual RNA molecules was visualized under green laser excitation. Images (grayscale) are a small portion (2.6 μm x 2.6 μm) of the microscope field of view recorded at each stage of the process. See Figure 2—figure supplement 3 for complete field of view. (D) Time series images (1 s per frame; 1.3 μm x 1.3 μm) of U1 fluorescence from example surface locations containing a single 5i3 RNA (top), a single 3e5 RNA (middle) or no detected RNA (bottom). Images with fluorescence spots (highlighted) indicate U1 binding. See Figure 2—figure supplement 4 for additional traces and detected events. (E) Rastergrams aggregating U1, U2, and U5 binding time courses from random samples of 50 individual 5i3 and 3e5 RNA molecules over 2,400 s. Each row in these plots contains data from a single RNA molecule; color indicates presence and white indicates absence of bound spliceosomal subcomplex. In each panel, RNA molecules are sorted by the time of first subcomplex binding (latest to earliest); the percentage (±s.e.) of N observed RNA molecules that exhibited subcomplex binding during the experiment is indicated. Rastergrams for ‘no RNA’ control locations are shown in Figure 2—figure supplement 1. (F) Cumulative distributions of U1, U2, and U5 dwell times on N observed 5i3 and 3e5 RNAs or control ‘no RNA’ locations. Data show the mean frequency per RNA molecule (or per ‘no RNA’ location) of subcomplex binding events with durations greater than or equal to the indicated dwell time. All frequencies on RNAs are substantially higher than the non-specific binding seen at ‘no RNA’ locations (note logarithmic scale). (G) Total frequencies (±s.e.) per RNA molecule of RNA-specific subcomplex binding. These RNA-specific binding frequencies correspond to the RNA minus the no RNA vertical axis intercepts of the curves in (F); they represent the total rate of subcomplex-RNA binding throughout the 2,400 s experiment averaged over all observed RNA molecules. (H) Frequencies (±s.e.) per RNA molecule of the subsets of RNA-specific subcomplex binding events shorter or longer than 50 s. (I) Specific occupancy (±s.e.), corresponding to the fraction of RNA molecules bound by the indicated fluorescent subcomplex averaged over the duration of the experiment. Numbers of RNA molecules observed in (G–I) are the same as those reported in (F). The specific occupancy values are calculated as described (see Materials and methods) to correct for the small amount of binding observed at ‘no RNA’ locations. Source data for Figure 2: SourceDataFigure2.zip.
-
Figure 2—Source data 1
Data from the single-molecule experiments.
- https://doi.org/10.7554/eLife.37751.012
Figure 2—figure supplement 1
Rastergrams of each subcomplex binding to 50 randomly selected 'no RNA' control locations.
Data are from the experiments shown in Figure 2. The stated fraction (±s.e.) of the no RNA locations that exhibited subcomplex binding was calculated from the total sample of N no RNA locations reported in Figure 2F.
Figure 2—figure supplement 2
Bulk assay detects no splicing of 3e5 pre-mRNA.
Time points are 0, 10, 20, 30, and 40 min after nuclear extract addition.
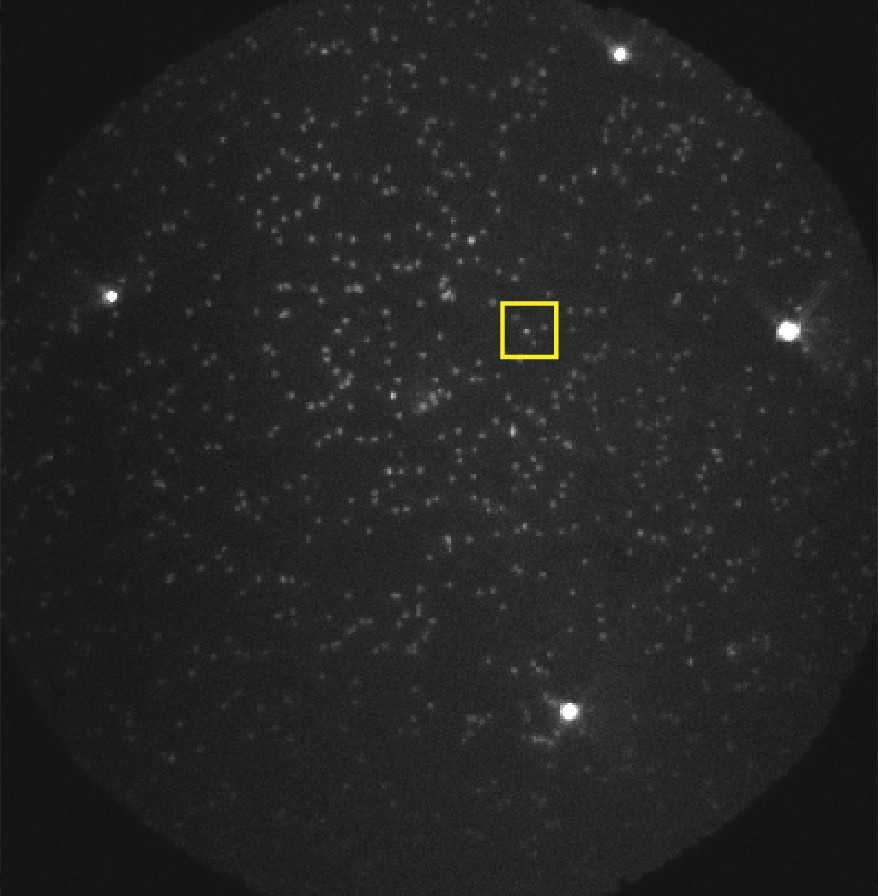
Figure 2—figure supplement 3
Complete microscope field of view (48 μm x 49 μm, grayscale) containing the region shown in Figure 2C (yellow box).
RNA molecules were visualized under red laser excitation after both 5i3 and 3e5 molecules were tethered. The four brightest spots are fluorescent beads used as fiducial markers to correct for stage drift.
Figure 2—figure supplement 4
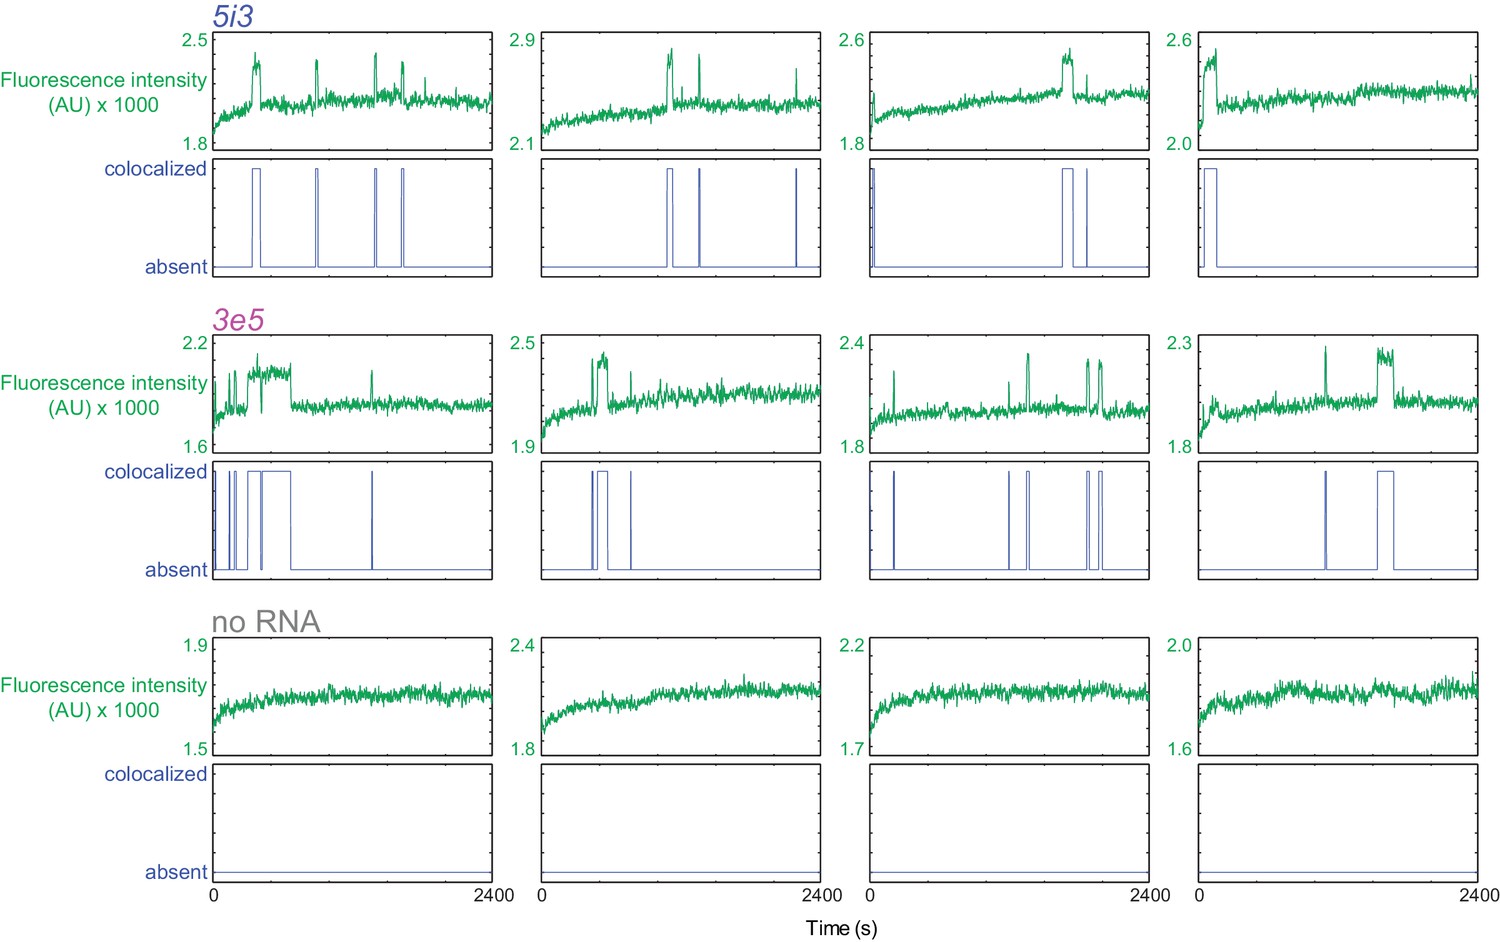
Sample fluorescence intensity traces and detected U1 binding events on 5i3 and 3e5 RNA molecules and at no RNA control locations (see Figure 2).
For each location both time records of fluorescence intensity (green) and image-analysis-based detection of a fluorescent spot (blue; colocalization or absence of colocalization; [Friedman and Gelles, 2015]) are shown.
Figure 3 with 6 supplements
Interdependence of U1 and U2 binding to cross-intron and cross-exon RNAs.
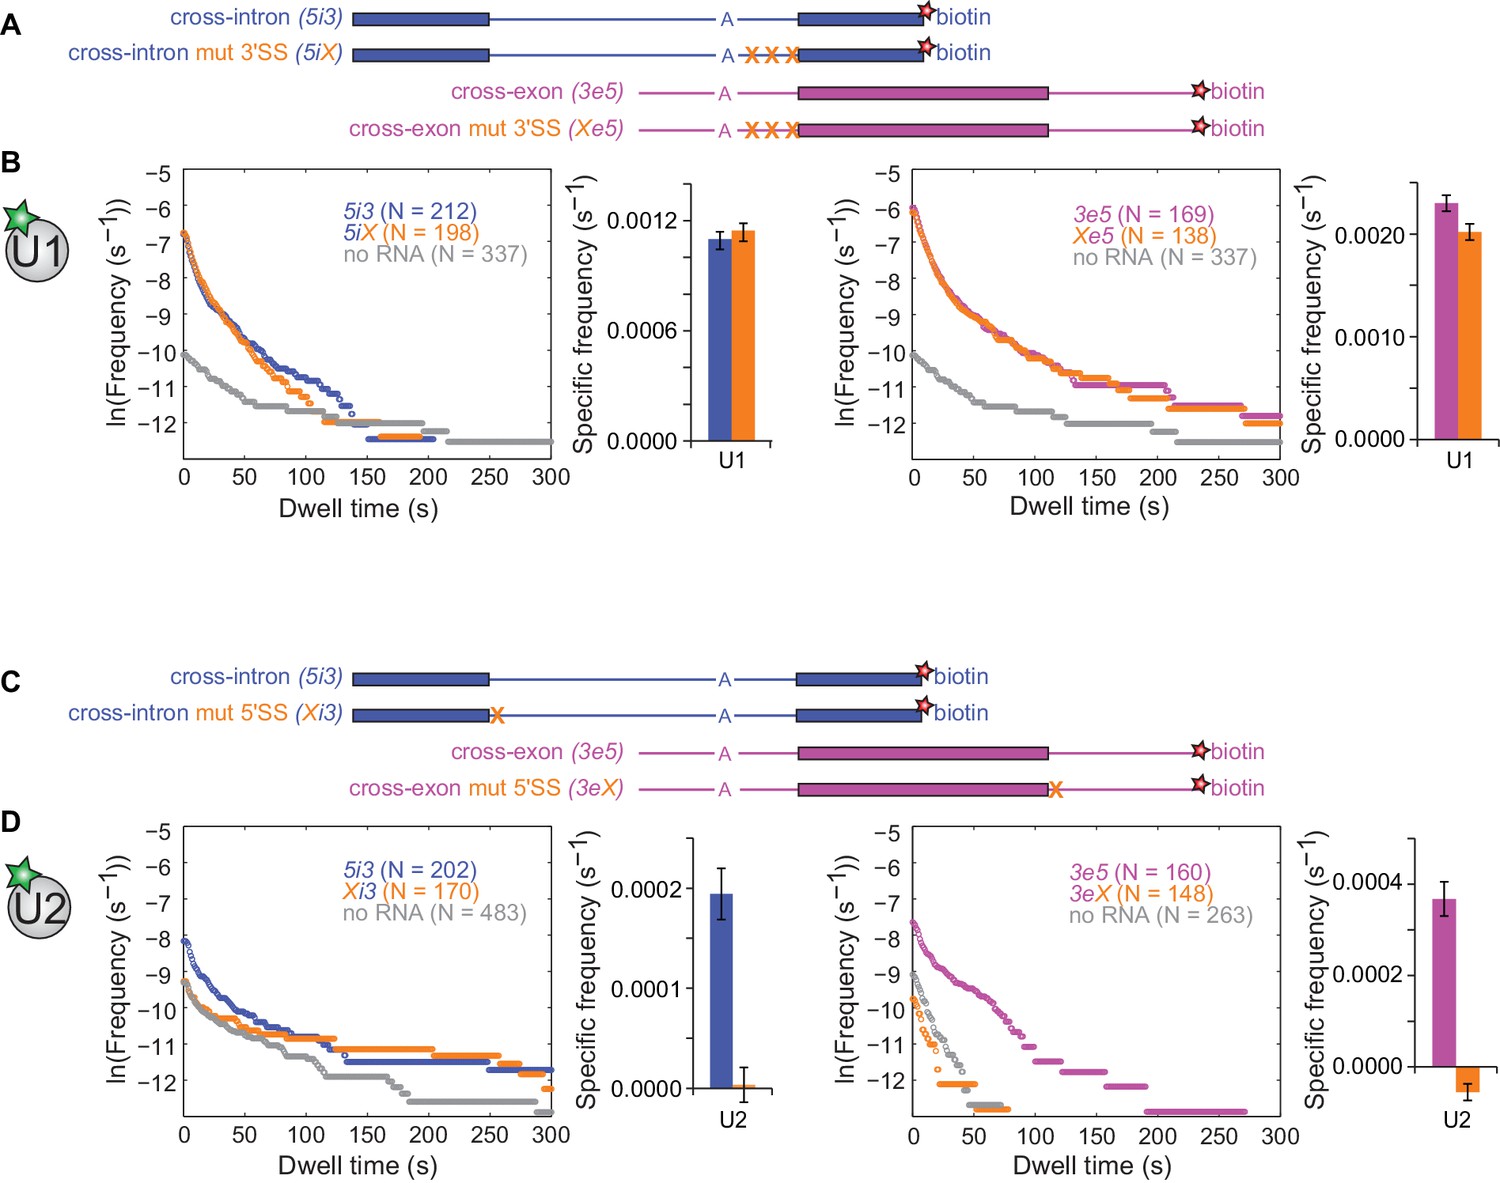
(A) Schematics of 5i3 and 3e5 RNAs without or with polypyrimidine tract and 3'SS mutations (X). See Table 1 for RNA sequences. (B) Dynamics of dye labeled U1 binding to the RNAs depicted in (A), in a CoSMoS experiment in which all four RNAs were simultaneously present. Cumulative dwell time distributions and frequencies of RNA-specific binding were measured and plotted as in Figure 2F and G. For clarity, pairs of distributions are plotted in separate left and right panels and the no RNA data from the experiment is shown in both. Corresponding rastergrams are shown in Figure 3—figure supplement 2. (C) Schematics of 5i3 and 3e5 RNAs without or with 5'SS mutations (X). (D) Dynamics of dye-labeled U2 binding in two separate CoSMoS experiments, one with 5i3 and Xi3 RNAs (left) and one with 3e5 and 3eX (right). Corresponding rastergrams are shown in Figure 3—figure supplement 4. Dependence of U1 binding on 5'SS mutations and dependence of U2 binding on polypyrimidine tract and 3'SS mutations are shown in Figure 3—figure supplement 1 and Figure 3—figure supplement 3 respectively. Source data for the single-molecule experiments in Figure 3, Figure 3—figure supplement 1, Figure 3—figure supplement 3, Figure 3—figure supplement 5, and Figure 3—figure supplement 6: SourceDataFigure3.zip, SourceDataFigure3S1.zip, SourceDataFigure3S3.zip, SourceDataFigure3S5.zip, and SourceDataFigure3S6.zip.
-
Figure 3—Source data 1
Data from the single-molecule experiments.
- https://doi.org/10.7554/eLife.37751.022
Figure 3—figure supplement 1
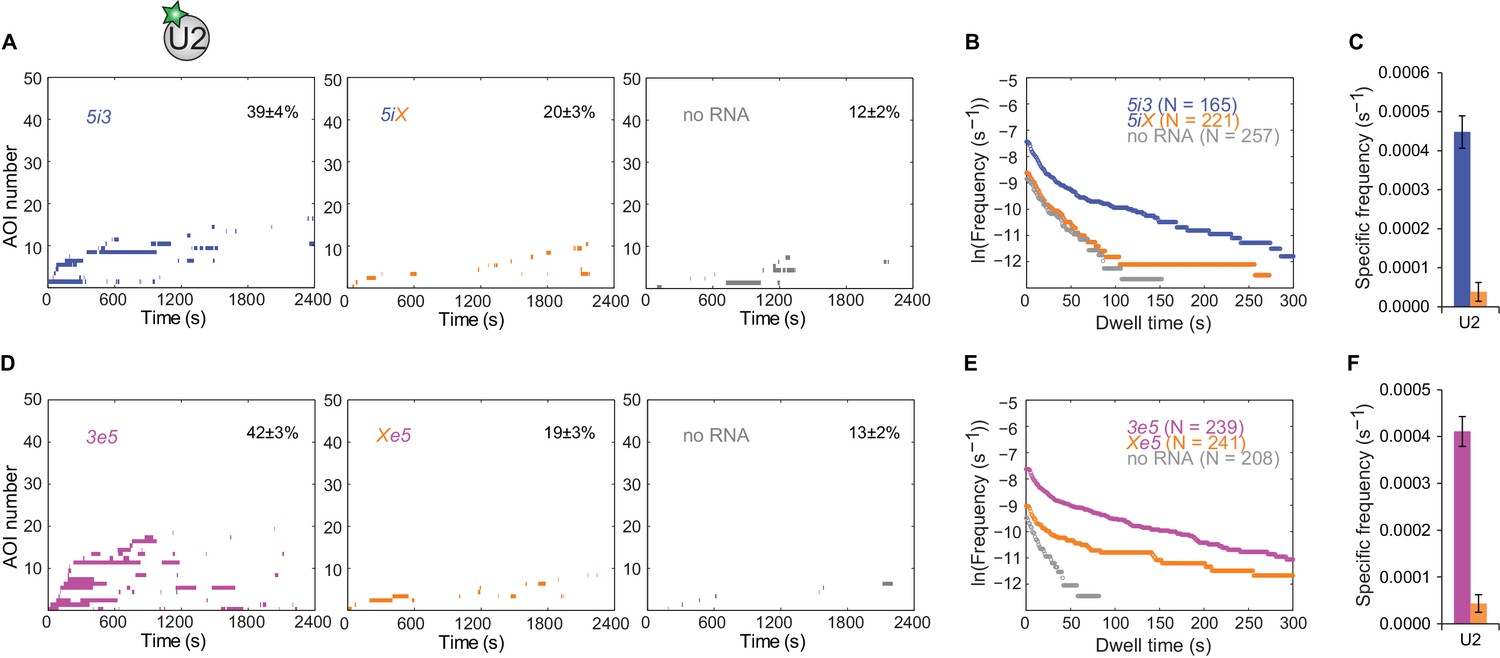
U2 binding events to pre-mRNA depend on the polypyrimidine tract and 3'SS.
(A) Rastergrams showing U2 binding data on 50 randomly selected individual 5i3 and 5iX pre-mRNA molecules and 'no RNA' control locations over the course of 2,400 s, sorted by the time of the first binding event to each RNA. The percentage (±s.e.) of N observed RNA molecules that exhibited subcomplex binding during the experiment is indicated. (B) Cumulative dwell time distributions of U2 binding events on wild-type 5i3 and mutated 5iX cross-intron RNAs, and at randomly selected locations with no RNA. (C) Frequencies (±s.e.) of RNA-specific U2 binding to 5i3 and 5iX RNAs calculated as in Figure 2G. (D–F) Same as (A–C), except for the 3e5 and Xe5 RNAs. Data in all three panels are from the same experiment.
-
Figure 3—figure supplement 1—source data 1
Data from the single-molecule experiments.
- https://doi.org/10.7554/eLife.37751.023
Figure 3—figure supplement 2
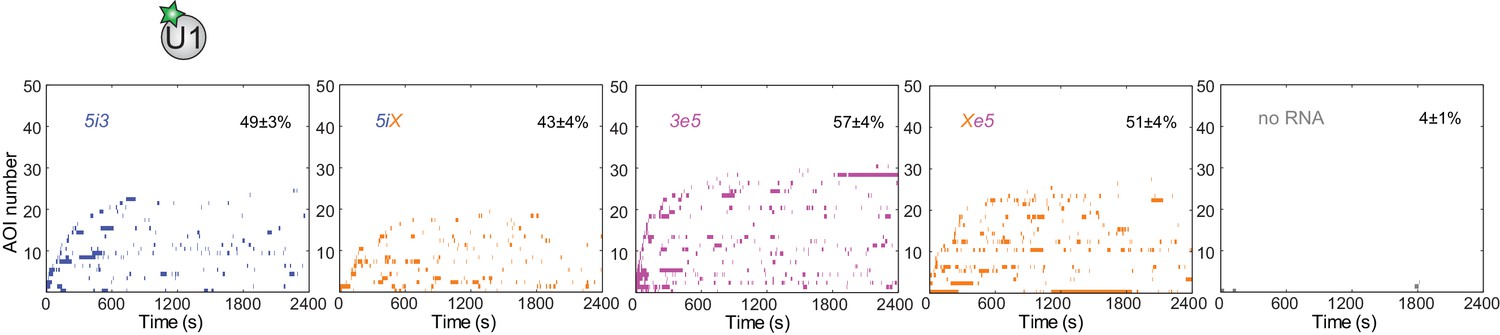
Rastergrams showing U1 binding to 50 randomly selected 5i3, 5iX, 3e5, and Xe5 pre-mRNA molecules and 'no RNA' control locations over the course of 2,400 s, sorted by the time of the first binding event.
Data are from the experiment in Figure 3B. The percentage (±s.e.) of N observed RNA molecules (see Figure 3B) that exhibited subcomplex binding during the experiment is indicated.
Figure 3—figure supplement 3
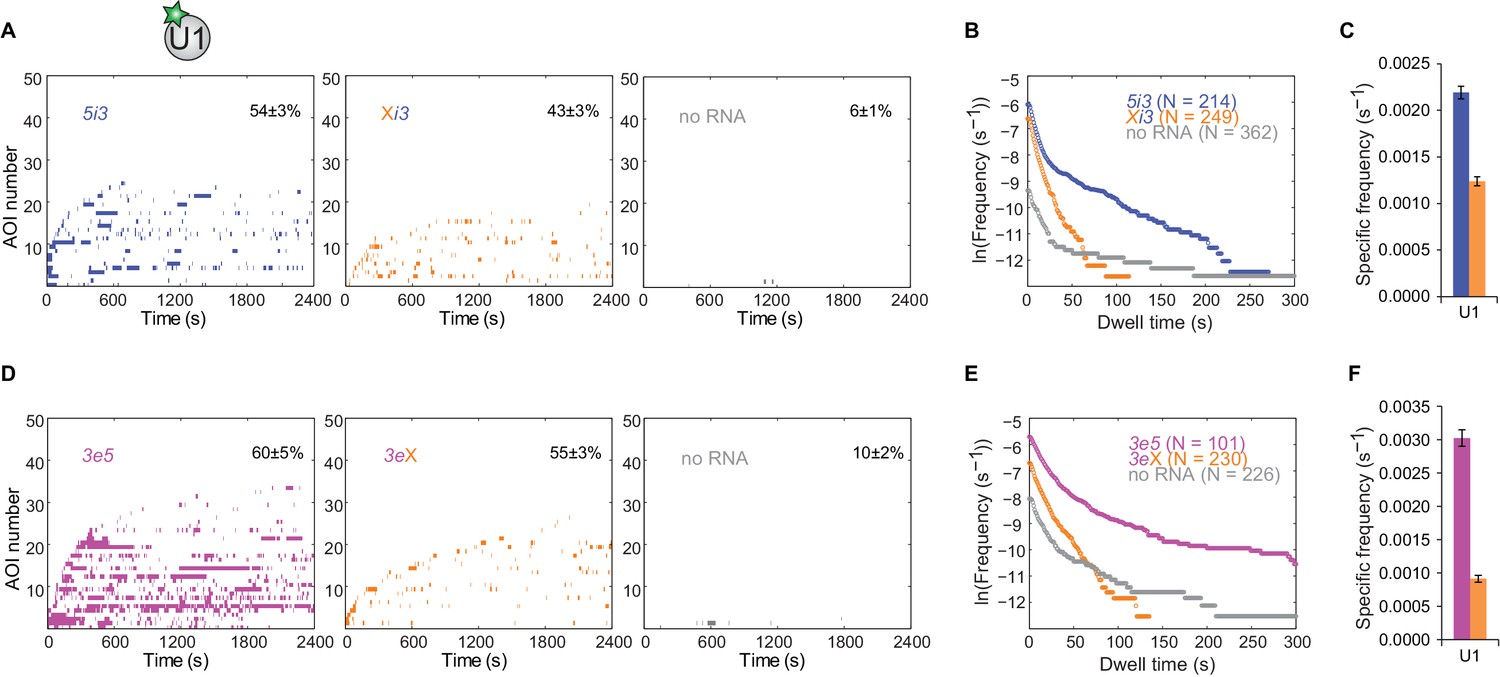
Long-duration U1 binding to pre-mRNA depends on a canonical 5'SS.
(A) Rastergrams showing U1 binding data on 50 randomly selected individual 5i3 and Xi3 pre-mRNA molecules and control no RNA locations from the same experiment, sorted by the time of the first binding event at each RNA or no RNA location. The percentage (±s.e.) of N observed RNA molecules that exhibited subcomplex binding during the experiment is indicated. (B) Cumulative dwell time distributions of U1 binding events on wild-type 5i3 and mutated Xi3 cross-intron RNAs. (C) Frequency (±s.e.) of RNA-specific U1 binding to 5i3 and Xi3 RNAs calculated as in Figure 2G. Data in panels A, B, and C are all from the same experiment. (D–F) Same as (A–C), except for the 3e5 and 3eX RNAs. Data in all three panels are from the same experiment.
-
Figure 3—figure supplement 3—source data 2
Data from the single-molecule experiments.
- https://doi.org/10.7554/eLife.37751.024
Figure 3—figure supplement 4
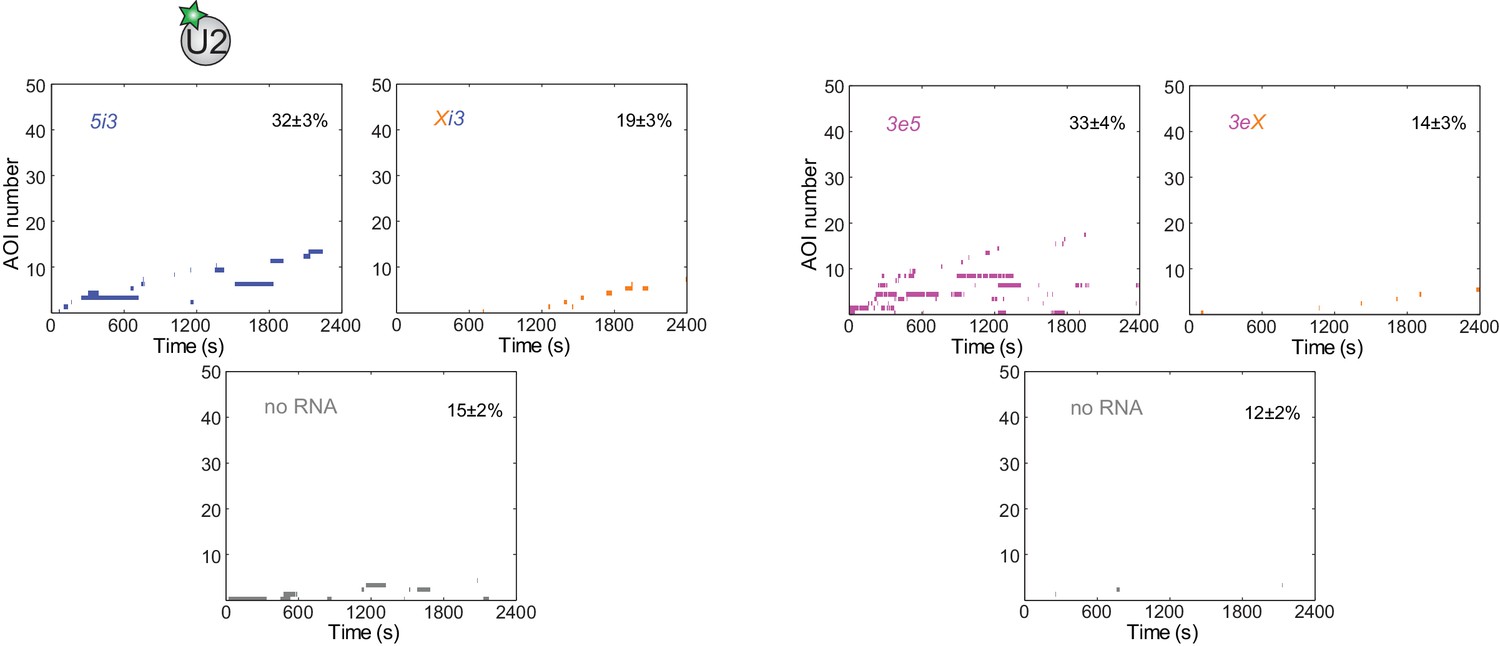
Rastergrams showing U2 binding data on 50 randomly selected individual 5i3, Xi3, 3e5, and 3eX pre-mRNA molecules and control 'no RNA' locations over the course of 2,400 s, sorted by the time of the first binding event to each RNA or location.
The percentage (±s.e.) of N observed RNA molecules (see Figure 3D) that exhibited subcomplex binding during the experiment is indicated. Data for the left and right halves of the figure are taken from the same experiments as the left and right halves of Figure 3D.
Figure 3—figure supplement 5
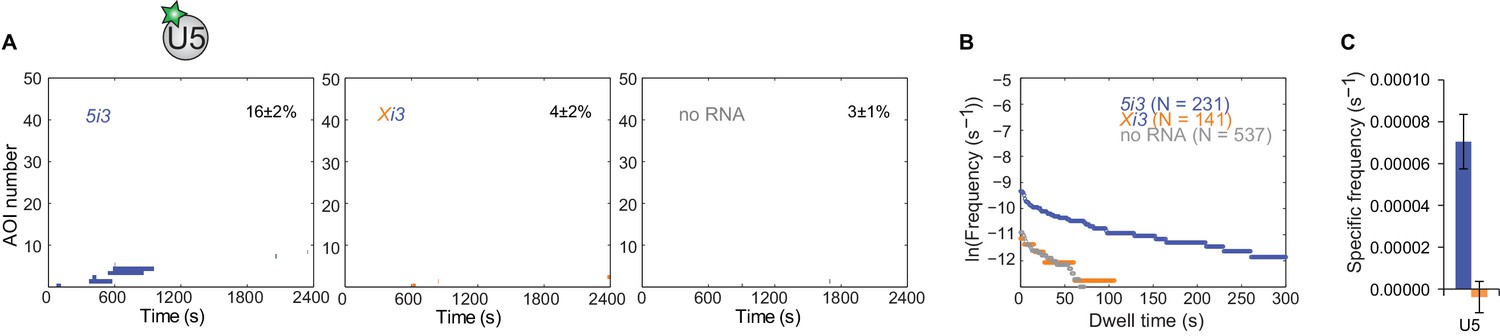
U5 binding to 5i3 pre-mRNA depends on the 5'SS.
(A) Rastergrams showing U5 binding to 50 randomly selected individual 5i3 and Xi3 pre-mRNA molecules and to 'no RNA' control locations over the course of 2,400 s, sorted by the time of the first binding event to each RNA. The percentage (±s.e.) of N observed RNA molecules that exhibited subcomplex binding during the experiment is indicated. (B) Cumulative dwell time distributions of U2 binding events on wild-type 5i3 and mutated Xi3 cross-intron RNAs, and at randomly selected locations with no RNA. (C) Frequencies (±s.e.) of RNA-specific U5 binding to 5i3 and Xi3 RNAs calculated as in Figure 2G.
-
Figure 3—figure supplement 5—source data 3
Data from the single-molecule experiments.
- https://doi.org/10.7554/eLife.37751.025
Figure 3—figure supplement 6
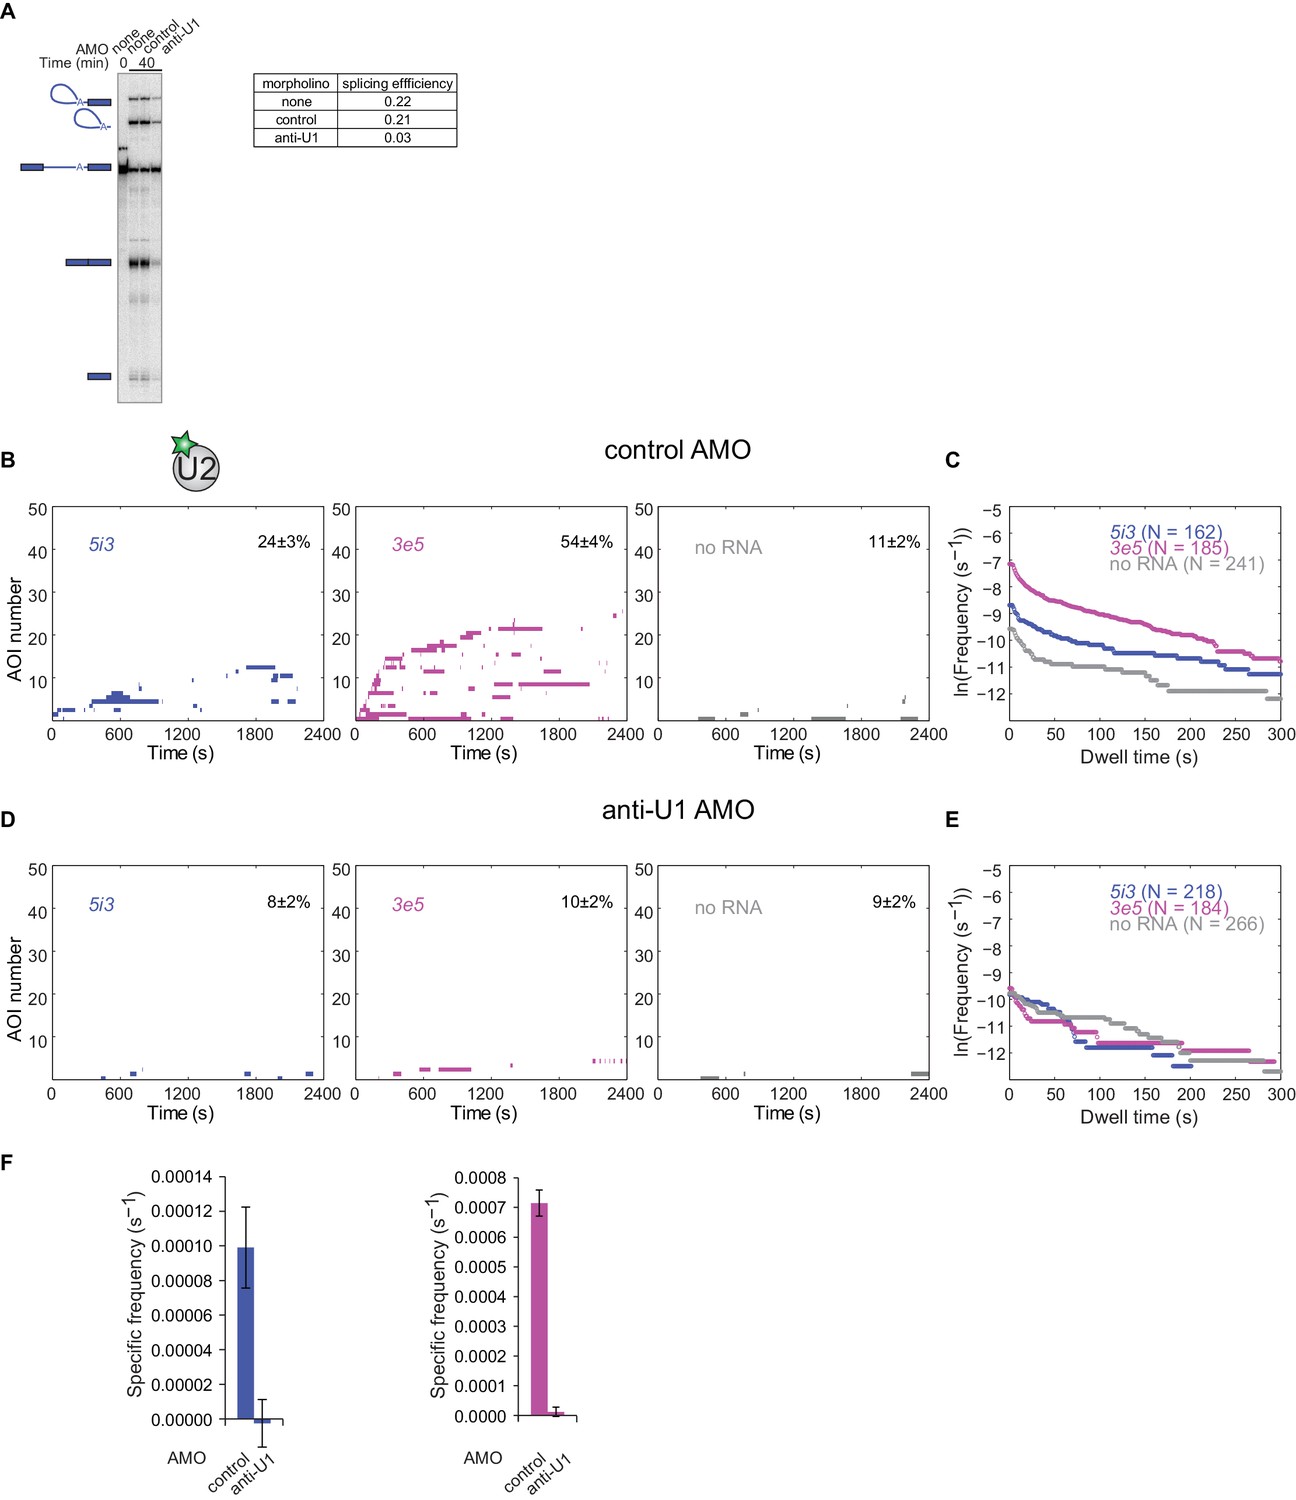
Antisense morpholino oligonucleotide (AMO) targeting U1 snRNA strongly reduces U2 binding to both 5i3 and 3e5 RNAs.
(A) Bulk splicing assay (as in Figure 1A) shows specific inhibition of 5i3 pre-mRNA splicing upon addition of anti-U1 AMO at 10 µM final concentration as previously reported (Kaida et al., 2010). A non-complementary control AMO of the same length showed minimal inhibition (Kaida et al., 2010). (B) Single molecule observations of U2 binding to RNAs in extract preincubated with 10 µM control AMO. Rastergrams show U2 binding to 50 randomly selected individual 5i3 and 3e5 pre-mRNA molecules and control no RNA locations from the same experiment, sorted by the time of the first binding event at each RNA or no RNA location. The percentage (±s.e.) of N observed RNA molecules that exhibited subcomplex binding during the experiment is indicated. (C) Cumulative dwell time distributions of all U2 binding events from the experiment excerpted in (B). (D,E) Same as (B,C), except that the extract was preincubated with 10 µM anti-U1 AMO. (F) Frequency (±s.e.) of RNA-specific U2 binding in the presence of control and anti-U1 AMO to 5i3 (left) and 3e5 (right) calculated from data in (B–E) as in Figure 2G.
-
Figure 3—figure supplement 6—source data 4
Data from the single-molecule experiments.
- https://doi.org/10.7554/eLife.37751.026
Figure 4 with 2 supplements
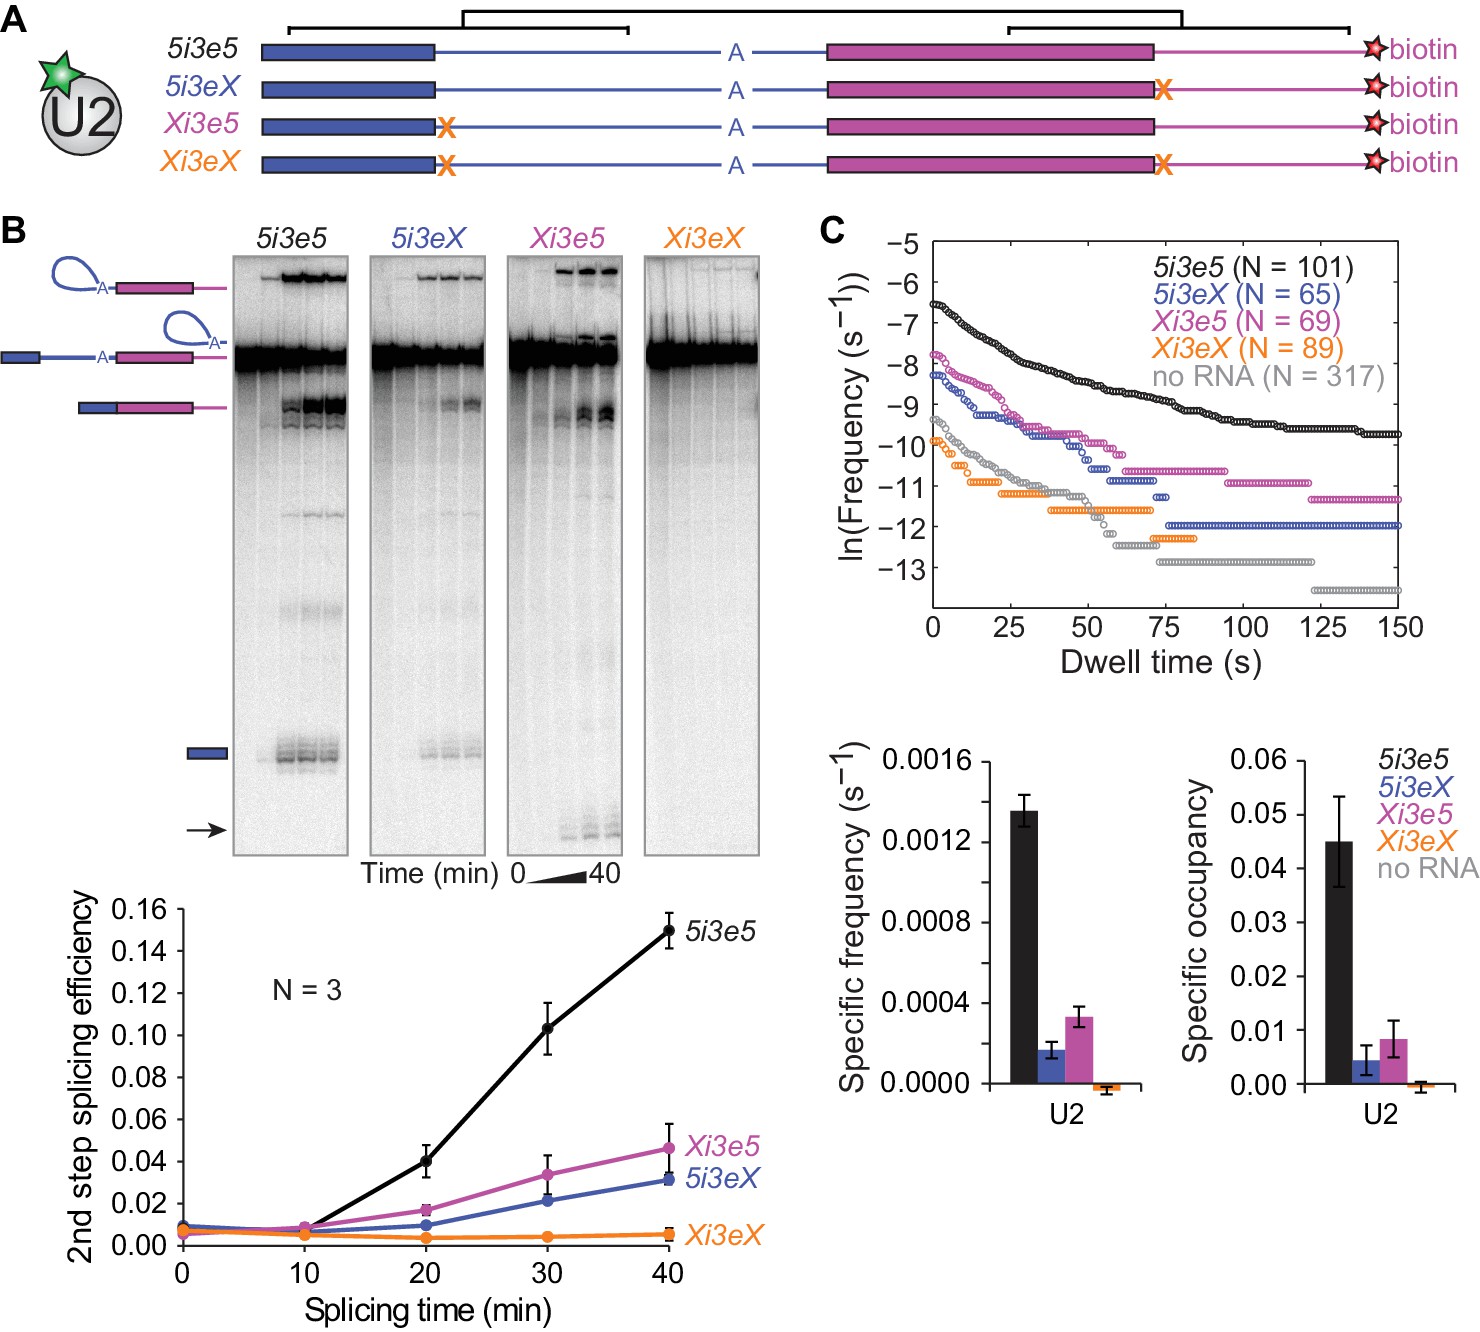
Synergistic recruitment of U2 by 5'SS across introns and exons.
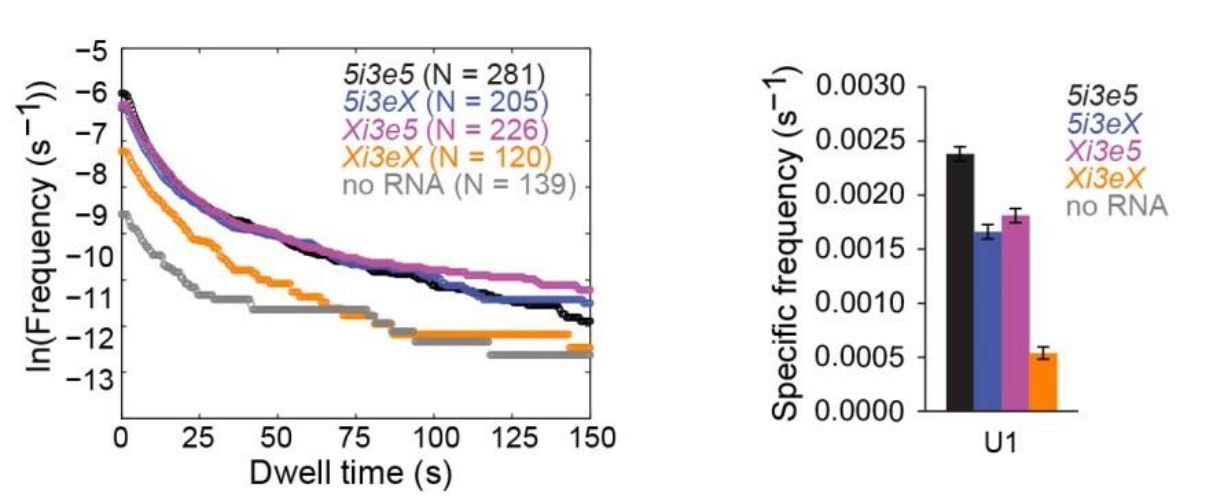
(A) Schematic of 5i3e5 RNAs without or with 5'SS mutations (X). Black brackets indicate two regions (113 nts) of identical sequence. (B) Ensemble splicing time courses of 32P-labeled RNA. Second step splicing efficiencies (±s.d.) were calculated as fraction of 5i3e5, 5i3eX, Xi3e5 and Xi3eX starting material at time zero. Arrow indicates 5' exon resulting from usage of a cryptic 5'SS 12 nts upstream of the canonical 5'SS in Xi3e5. (C) Cumulative dwell time distributions, RNA-specific binding frequencies (±s.e.) and time-averaged fractional occupancies (±s.e.) of U2 binding to 5i3e5, 5i3eX, Xi3e5 and Xi3eX RNAs measured in the same experiment. Corresponding rastergrams are shown in Figure 4—figure supplement 1. Analysis of time of first U2 binding event distributions is shown in Figure 4—figure supplement 2. Source data for the single-molecule experiments in Figure 4: SourceDataFigure4.zip.
-
Figure 4—Source data 1
Data from the single-molecule experiments.
- https://doi.org/10.7554/eLife.37751.031
Figure 4—figure supplement 1
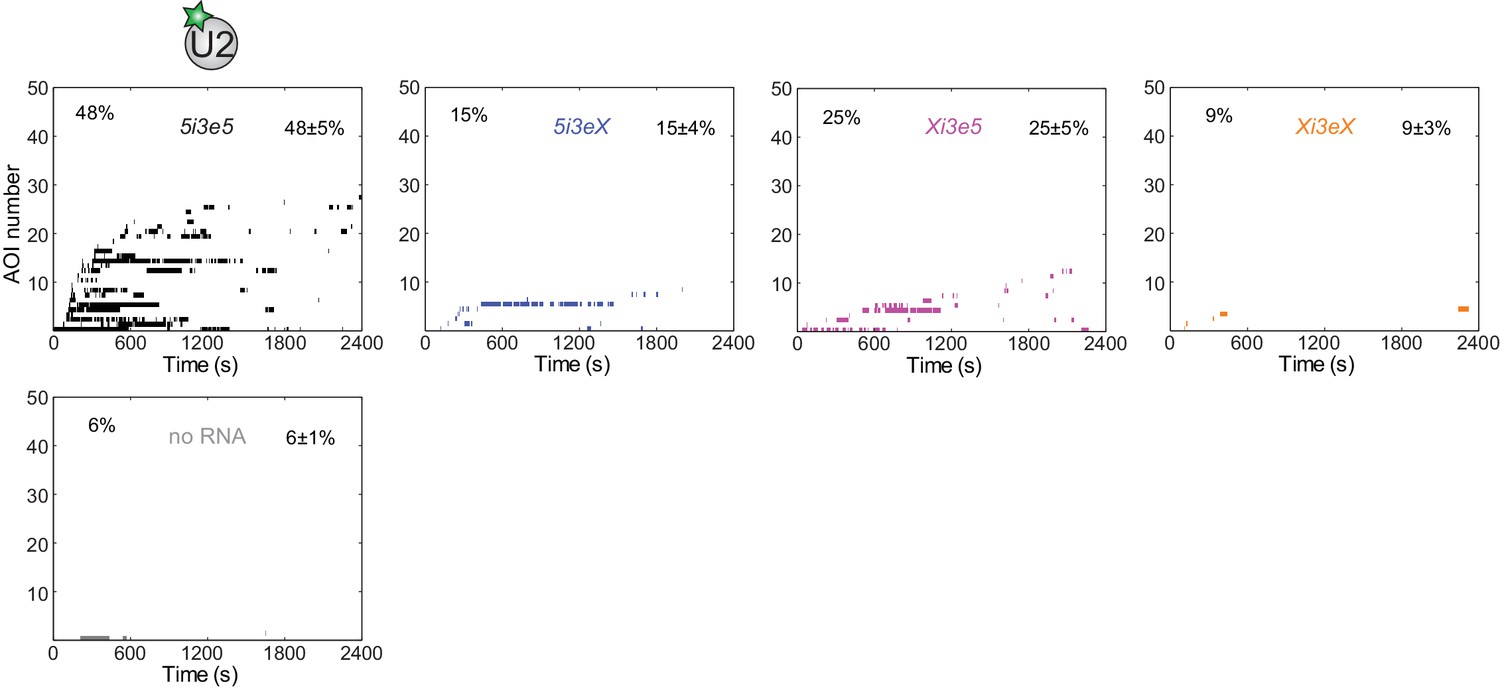
Rastergrams showing U2 binding data on 50 randomly selected individual 5i3e5, 5i3eX, Xi3e5, and Xi3eX pre-mRNA molecules and control 'no RNA' locations from the experiment shown in Figure 4C, sorted by the time to the first binding observed on each RNA.
The percentage (±s.e.) of N (see Figure 4C) observed RNA molecules or no RNA locations that exhibited subcomplex binding during the experiment is indicated.
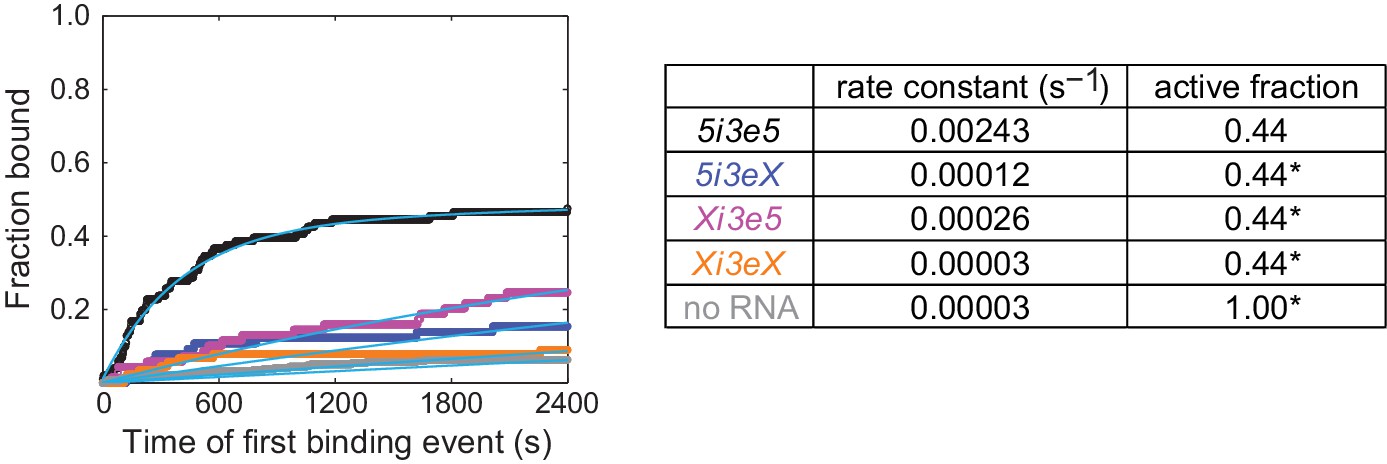
Figure 4—figure supplement 2
Cumulative distributions of the fraction of RNA molecules exhibiting at least one U2 binding event by the indicated time after the start of the experiment.
Data include measurements on 5i3e5, 5i3eX, Xi3e5, and Xi3eX RNA molecules and no RNA control locations, all from the experiment in Figure 4C. For all four RNAs, data were consistent with a quantitative model (cyan fit lines; see [Friedman and Gelles, 2015]) that assumes a single rate-limiting step for U2 binding (with the indicated values for the apparent first-order association rate constant) to only a subpopulation (the ‘active fraction’) of the RNA molecules. The active fraction was determined from the fit to the 5i3e5 data and was held fixed at the indicated values (asterisks) for the other fits.
Figure 5
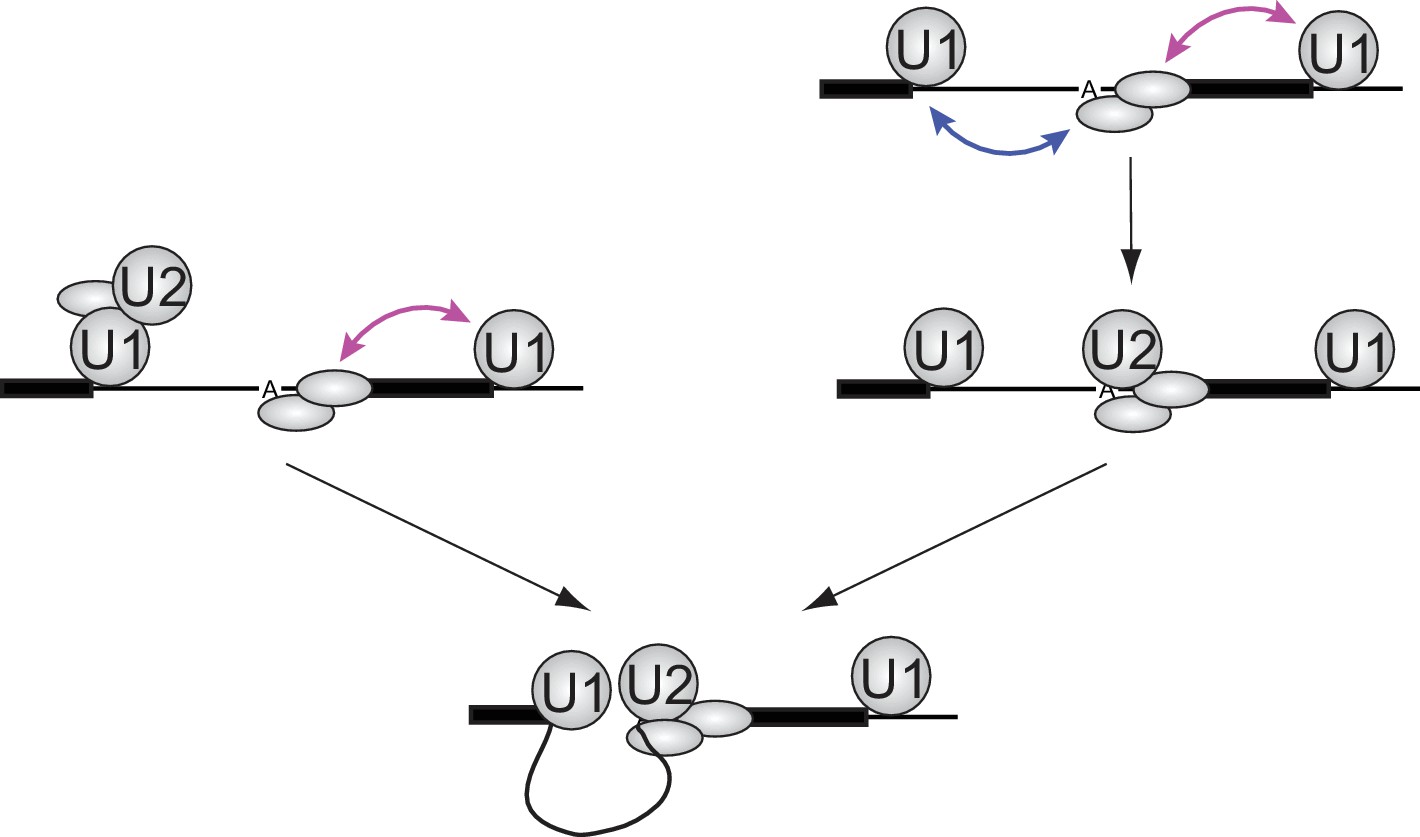
Implications of synergistic U2 recruitment for the mechanism of exon and intron recognition.
The cartoon illustrates how differing modes of U1 action from upstream (cross-intron) and downstream (cross-exon) sites can synergize to promote faster U2 binding when both flanking U1 sites are present. Double-headed arrows denote physical interactions in which one component may accelerate association or slow dissociation of another.
Author response image 1
U1 binding to four RNA constructs, all measured in the same experiment, analogous to the U2 data in Figure 4.
https://doi.org/10.7554/eLife.37751.037
Author response image 2

Optimal secondary structure prediction for 5i3
https://doi.org/10.7554/eLife.37751.038
Author response image 3

Optimal secondary structure prediction for 3e5
https://doi.org/10.7554/eLife.37751.039
Author response image 4
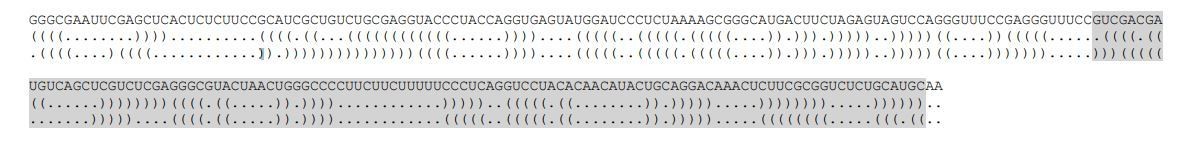
Comparison of the optimal secondary structure predictions of 5i3 and 3e5
https://doi.org/10.7554/eLife.37751.040
Author response image 5
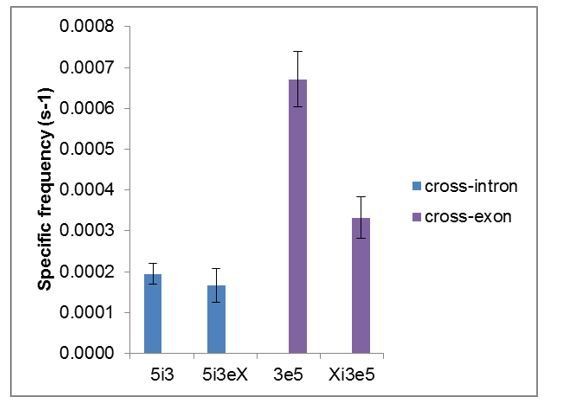
Total frequencies ( ± s.e.) per RNA molecule of RNA-specific U2 snRNP binding.
Data are from Figures 2G and 4C.
Author response image 6

Fractional occupancy ( ± s.e.) of RNA molecules by U2 snRNP, averaged over the duration of the experiment.
Data are from Figures 2I and 4C.
Tables
Table 1
RNAs.
5 N-U, 5-aminoallyluridine. U-DY547, Dylight 547 dye conjugated to C5 of U through a six-carbon linker. Small letters indicate mutated bases in the mutant sequence variants. The cryptic 5'SS in Xi3e5 (see Figure 4B) is underlined.
| RNA name | RNA sequence (5' to 3') |
|---|---|
| 5i3 (cross-intron, PIP85A) | GGGCGAAUUCGAGCUCACUCUCUUCCGCAUCGCUGUCUGCG AGGUACCCUACCAGGUGAGUAUGGAUCCCUCUAAAAGCGGG CAUGACUUCUAGAGUAGUCCAGGGUUUCCGAGGGUUUCCG UCGACGAUGUCAGCUCGUCUCGAGGGCGUACUAACUGGGC CCCUUCUUCUUUUUCCCUCAGGUCCUACACAACAUACUGCA GGACAAACUCUUCGCGGUCUCUGCAUGCAA |
| Xi3 (cross-intron, 5'SS mutant) | GGGCGAAUUCGAGCUCACUCUCUUCCGCAUCGCUGUCUGCG AGGUACCCUACCccccGAGUAUGGAUCCCUCUAAAAGCGGGCA UGACUUCUAGAGUAGUCCAGGGUUUCCGAGGGUUUCCGUCG ACGAUGUCAGCUCGUCUCGAGGGCGUACUAACUGGGCCCCUU CUUCUUUUUCCCUCAGGUCCUACACAACAUACUGCAGGACAA ACUCUUCGCGGUCUCUGCAUGCAA |
| 5iX (cross-intron, polypyrimidine tract and 3'SS mutant) | GGGCGAAUUCGAGCUCACUCUCUUCCGCAUCGCUGUCUGCGA GGUACCCUACCAGGUGAGUAUGGAUCCCUCUAAAAGCGGGCAU GACUUCUAGAGUAGUCCAGGGUUUCCGAGGGUUUCCGUCGAC GAUGUCAGCUCGUCUCGAGGGCGUACUAACUGGGCCgCUaCaU gaUaUaCgCaCGGGUCCUACACAACAUACUGCAGGACAAACUCU UCGCGGUCUCUGCAUGCAA |
| 3e5 (cross-exon) | GGGCGAAUUCGUCGACGAUGUCAGCUCGUCUCGAGGGCGUAC UAACUGGGCCCCUUCUUCUUUUUCCCUCAGGUCCUACACAAC AUACUGCAGGACAAACUCUUCGCGGUCUCUGCAUGCGAGCUC ACUCUCUUCCGCAUCGCUGUCUGCGAGGUACCCUACCAGGU GAGUAUGGAUCCCUCUAAAAGCGGGCAUGACUUCUAGAGUAG UCCAGGGUUUCCGAGGGUUUCCAA |
| 3eX (cross-exon, 5'SS mutant) | GGGCGAAUUCGUCGACGAUGUCAGCUCGUCUCGAGGGCGUA CUAACUGGGCCCCUUCUUCUUUUUCCCUCAGGUCCUACACA ACAUACUGCAGGACAAACUCUUCGCGGUCUCUGCAUGCGAG CUCACUCUCUUCCGCAUCGCUGUCUGCGAGGUACCCUACCc cccGAGUAUGGAUCCCUCUAAAAGCGGGCAUGACUUCUAGAG UAGUCCAGGGUUUCCGAGGGUUUCCAA |
| Xe5 (cross-exon, polypyrimidine tract and 3'SS mutant) | GGGCGAAUUCGUCGACGAUGUCAGCUCGUCUCGAGGGCGU ACUAACUGGGCCgCUaCaUgaUaUaCgCaCgGGUCCUACACA ACAUACUGCAGGACAAACUCUUCGCGGUCUCUGCAUGCGA GCUCACUCUCUUCCGCAUCGCUGUCUGCGAGGUACCCUAC CAGGUGAGUAUGGAUCCCUCUAAAAGCGGGCAUGACUUCU AGAGUAGUCCAGGGUUUCCGAGGGUUUCCAA |
| 5i3e5 | GGGCGAAUUCGAGCUCACUCUCUUCCGCAUCGCUGUCUGC GAGGUACCCUACCAGGUGAGUAUGGAUCCCUCUAAAAGCGG GCAUGACUUCUAGAGUAGUCCAGGGUUUCCGAGGGUUUCC GUCGACGAUGUCAGCUCGUCUCGAGGGCGUACUAACUGGG CCCCUUCUUCUUUUUCCCUCAGGUCCUACACAACAUACUG CAGGACAAACUCUUCGCGGUCUCUGCAUGCGAGCUCACUC UCUUCCGCAUCGCUGUCUGCGAGGUACCCUACCAGGUGA GUAUGGAUCCCUCUAAAAGCGGGCAUGACUUCUAGAGUA GUCCAGGGUUUCCGAGGGUUUCCGACAAUUGCAUGAA |
| 5i3eX | GGGCGAAUUCGAGCUCACUCUCUUCCGCAUCGCUGUCUG CGAGGUACCCUACCAGGUGAGUAUGGAUCCCUCUAAAAGC GGGCAUGACUUCUAGAGUAGUCCAGGGUUUCCGAGGGUU UCCGUCGACGAUGUCAGCUCGUCUCGAGGGCGUACUAAC UGGGCCCCUUCUUCUUUUUCCCUCAGGUCCUACACAACA UACUGCAGGACAAACUCUUCGCGGUCUCUGCAUGCGAGC UCACUCUCUUCCGCAUCGCUGUCUGCGAGGUACCCUACC ccccGAGUAUGGAUCCCUCUAAAAGCGGGCAUGACUUCUA GAGUAGUCCAGGGUUUCCGAGGGUUUCCGACAAUUGCAUGAA |
| Xi3e5 | GGGCGAAUUCGAGCUCACUCUCUUCCGCAUCGCUGUCU GCGAGGUACCCUACCccccGAGUAUGGAUCCCUCUAAAAG CGGGCAUGACUUCUAGAGUAGUCCAGGGUUUCCGAGGG UUUCCGUCGACGAUGUCAGCUCGUCUCGAGGGCGUACU AACUGGGCCCCUUCUUCUUUUUCCCUCAGGUCCUACAC AACAUACUGCAGGACAAACUCUUCGCGGUCUCUGCAUG CGAGCUCACUCUCUUCCGCAUCGCUGUCUGCGAGGUAC CCUACCAGGUGAGUAUGGAUCCCUCUAAAAGCGGGCAU GACUUCUAGAGUAGUCCAGGGUUUCCGAGGGUUUCCG ACAAUUGCAUGAA |
| Xi3eX | GGGCGAAUUCGAGCUCACUCUCUUCCGCAUCGCUGUC UGCGAGGUACCCUACCccccGAGUAUGGAUCCCUCUAA AAGCGGGCAUGACUUCUAGAGUAGUCCAGGGUUUCCG AGGGUUUCCGUCGACGAUGUCAGCUCGUCUCGAGGGC GUACUAACUGGGCCCCUUCUUCUUUUUCCCUCAGGUC CUACACAACAUACUGCAGGACAAACUCUUCGCGGUCUC UGCAUGCGAGCUCACUCUCUUCCGCAUCGCUGUCUGC GAGGUACCCUACCccccGAGUAUGGAUCCCUCUAAAAGC GGGCAUGACUUCUAGAGUAGUCCAGGGUUUCCGAGGG UUUCCGACAAUUGCAUGAA |
| S1 | GGGCGAAUUCGAGCUCACUCUCUUCCGCAUCGCUGUCUG |
| S2 | CGAGGUACC(U-DY547)UACCAGGUGA |
| S3 | GUAUGGAUCCCUC(5 N-U)AAAAGCGGGCA(5 N-U)GACU UCUAGAG(5 N-U)AGUCCAGGGUUUCCGA |
| S4 | GGGUUUCCGUCGACGAUGUCAGCUCGUCUCGAGGGCGU ACUAACUGGGCCCCUUCUUCUUUUUCCCUCAGGUCCUA CACAACAUACUGCAGGACAAACUCUUCGCGGUCUCUGCAUGCAA |
Table 3
Plasmids.
https://doi.org/10.7554/eLife.37751.033| Plasmid name | Description |
|---|---|
| pcDNA5-FRT-TetO | Singh et al. (2012) |
| pcDNA5-FRT-TetO-fSNAPc | open reading frame of fSNAP inserted into pcDNA5-FRT-TetO using the HindIII and XhoI restriction sites |
| pcDNA5-FRT-TetO-U1-70K-fSNAPc | open reading frame of U1-70K inserted into pcDNA5-FRT-TetO-fSNAPc using the KpnI and NotI restriction sites |
| pcDNA5-FRT-TetO-U2B''-fSNAPc | open reading frame of U2B'' inserted into pcDNA5-FRT-TetO-fSNAPc using the KpnI and NotI restriction sites |
| pcDNA5-FRT-TetO-Snu114-fSNAPc | open reading frame of Snu114 inserted into pcDNA5-FRT-TetO-fSNAPc using the KpnI and NotI restriction sites |
| PIP85.A (=T7-5i3) | Moore and Sharp (1992), T7 transcription template for 5i3 |
| T7-3e5 | T7 transcription template for 3e5 |
| T7-5iX | T7 transcription template for 5iX |
| T7-Xi3 | T7 transcription template for Xi3 |
| T7-3eX | T7 transcription template for 3eX |
| T7-Xe5 | T7 transcription template for Xe5 |
| T7-5i3e5 | T7 transcription template for 5i3e5 |
| T7-5i3eX | T7 transcription template for 5i3eX |
| T7-Xi3e5 | T7 transcription template for Xi3e5 |
| T7-Xi3eX | T7 transcription template for Xi3eX |
Table 2
Oligonucleotides and antisense morpholino oligonucleotides (AMO).
m, 2'-O-methyl ribonucleotide; 3ddN, 3' dideoxy nucleotide.
| Oligonucleotide name | Oligonucleotide sequence (5' to 3') |
|---|---|
| fSNAP-F | AGAGATAAGCTTTCCAGCGGTACCGAGCTCGGATC CAGCGGACCTAGGGAAACCTGCGGCCGCGGCTCCG GAGGCTCCGGCGGGAGCGGCATGGACAAAGACTGCGAAATG |
| fSNAP-R | ACAGATCTCGAGCTAACCCAGCCCAGGCTTGCCCAGTC |
| U1-70K-F | AGAGATGGTACCATGACCCAGTTCCTGCCGCCCAAC |
| U1-70K-R | ACAGATGCGGCCGCACTCCGGCGCAGCCTCCATC |
| U2B’-F | AGAGATGGTACCATGGATATCAGACCAAATCATAC |
| U2B’-R | ACAGATGCGGCCGCATTTCTTGGCGTATGTAATTTTC |
| Snu114-F | AGAGATGGTACCATGGATACCGACTTATATGATGAG |
| Snu114-R | ACAGATGCGGCCGCACATGGGGTAATTGAGCACAACATC |
| ligation splint | ACATCGTCGACGGAAACCCTCGGAAACCCTGGACTACT CTAGAAGTCATGCCCGCTTTTAGAGGGATCCATACTCA CCTGGTAAGGTACCTCGCAGACAGCGATGCGGAAGAG |
| S1-T7-F | TAATACGACTCACTATAGGGCGAATTCGAGCTCAC |
| S4-T7-F | TAATACGACTCACTATAGGGTTTCCGTCGACGATGTCAGCTC |
| S1-R | mCmAGACAGCGATGCGGAAG |
| S4-R | mUmUGCATGCAGAGACCGCGAAG |
| 2-color RNA Klenow splint | GTTCCTTGCATGCAGAGACCGCGAAGAG/3ddC/ |
| 5i3 template-F | TAATACGACTCACTATAGGGCGAATTCGAGCTCAC |
| 5i3 template-R | mUmUGCATGCAGAGACCGCGAAG |
| 5i3 Klenow splint | GTTCTTCTTATTGCATGCAGAGACCGCGAAGAG/3ddC/ |
| 5i3 Klenow capture | CTCTTCGCGGTCTCTGCATGCAATAAGAAGAAC |
| 3e5 template-F | TAATACGACTCACTATAGGGCGAATTCGTCGACG |
| 3e5 template-R | mUmUGGAAACCCTCGGAAACCCTG |
| 3e5 Klenow splint | GTTCTTCTTATTGGAAACCCTCGGAAACCCTGGA/3ddC/ |
| 3e5 Klenow capture | TCCAGGGTTTCCGAGGGTTTCCAATAAGAAGAAC |
| 5i3e5 template-F | TAATACGACTCACTATAGGGCGAATTC |
| 5i3e5 template-R | mUmUCATGCAATTGTCG |
| 5i3e5 Klenow splint | GTTCTTATCTTATTCATGCAATTGTCGGAAACCCTC/3ddC/ |
| 5i3e5 Klenow capture | GAGGGTTTCCGACAATTGCATGAATAAGATAAGAAC |
| control-AMO | CCTCTTACCTCAGTTACAATTTATA |
| anti-U1-AMO | GGTATCTCCCCTGCCAGGTAAGTAT |
Additional files
-
Transparent reporting form
- https://doi.org/10.7554/eLife.37751.035
Download links
A two-part list of links to download the article, or parts of the article, in various formats.
Downloads (link to download the article as PDF)
Open citations (links to open the citations from this article in various online reference manager services)
Cite this article (links to download the citations from this article in formats compatible with various reference manager tools)
Synergistic assembly of human pre-spliceosomes across introns and exons
eLife 7:e37751.
https://doi.org/10.7554/eLife.37751


