Angiopoietin-4-dependent venous maturation and fluid drainage in the peripheral retina
- University of Oulu, Finland
- Experimentica Ltd, Finland
Figures
Figure 1 with 2 supplements
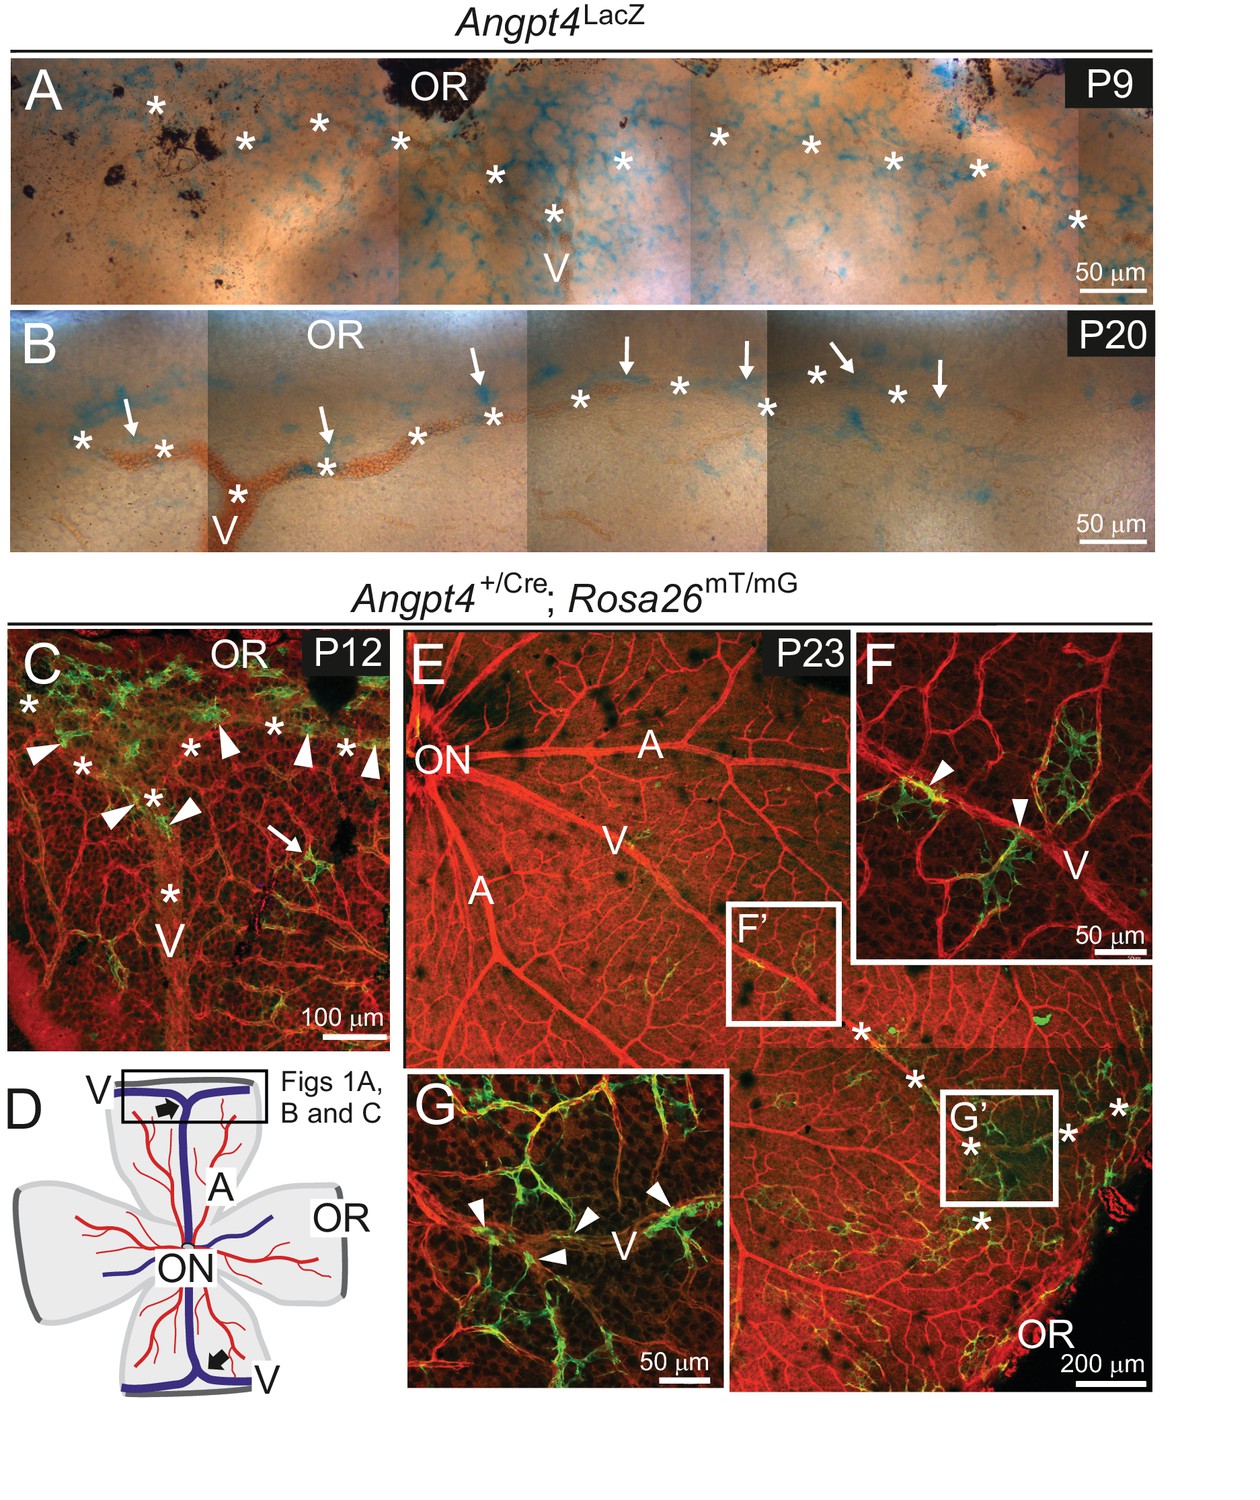
Angpt4 expression is temporally and spatially regulated at venous development sites in the peripheral retina.
(A–G) Whole-mount retinas from Angpt4LacZ and Angpt4+/Cre; Rosa26mT/mG mice at the indicated postnatal days (P). (A) Angpt4LacZ allele visualized with X-Gal staining (blue) indicated numerous Angpt4 expressing cells in the P9 peripheral retina at the sites of developing vein (V, asterisks) as identified based on anatomical location, morphology and reticulocytes. (B) Angpt4LacZ allele revealed continued but lower Angpt4 expression (blue, arrows) around matured vein (V) in peripheral retina at P20. (C) In Angpt4+/Cre; Rosa26mT/mG mice, mTomato (red) is ubiquitously expressed until Angpt4-promoter-driven Cre-mediated loxP recombination induces GFP (green) expression. P12 retina shows GFP-positive cells preferentially locating in the peripheral part of retina close to the branching vein (arrowheads). Arrow indicates rare single GFP-positive cells that are apart from vein (asterisks). Angpt4-expressing cells in Angpt4+/Cre; Rosa26mT/mG mice are labeled permanently, that is they remain GFP positive even if Angpt4 expression is discontinued and may represent a progeny of Angpt4-expressing cells. (D) A schematic representation of mouse retina preparation. Peripheral venous circulation develops typically as two Y-shaped veins (thick arrows) starting after the first postnatal week and branching in the peripheral segment to form annular structure. Vein (V, blue line); artery (A, red line); OR, ora serrata; ON, optic nerve head; frame, location of microscopic analysis in Figure 1 panels. (E–G) At P23 (late maturation phase), Angpt4+/Cre; Rosa26mT/mG retina shows GFP-positive cells enriched in the peripheral segment when compared to the central retina. Magnifications (F) and (G) reveal a GFP-positive cell population (arrowheads) connected to veins and perivenous capillaries.
Figure 1—figure supplement 1
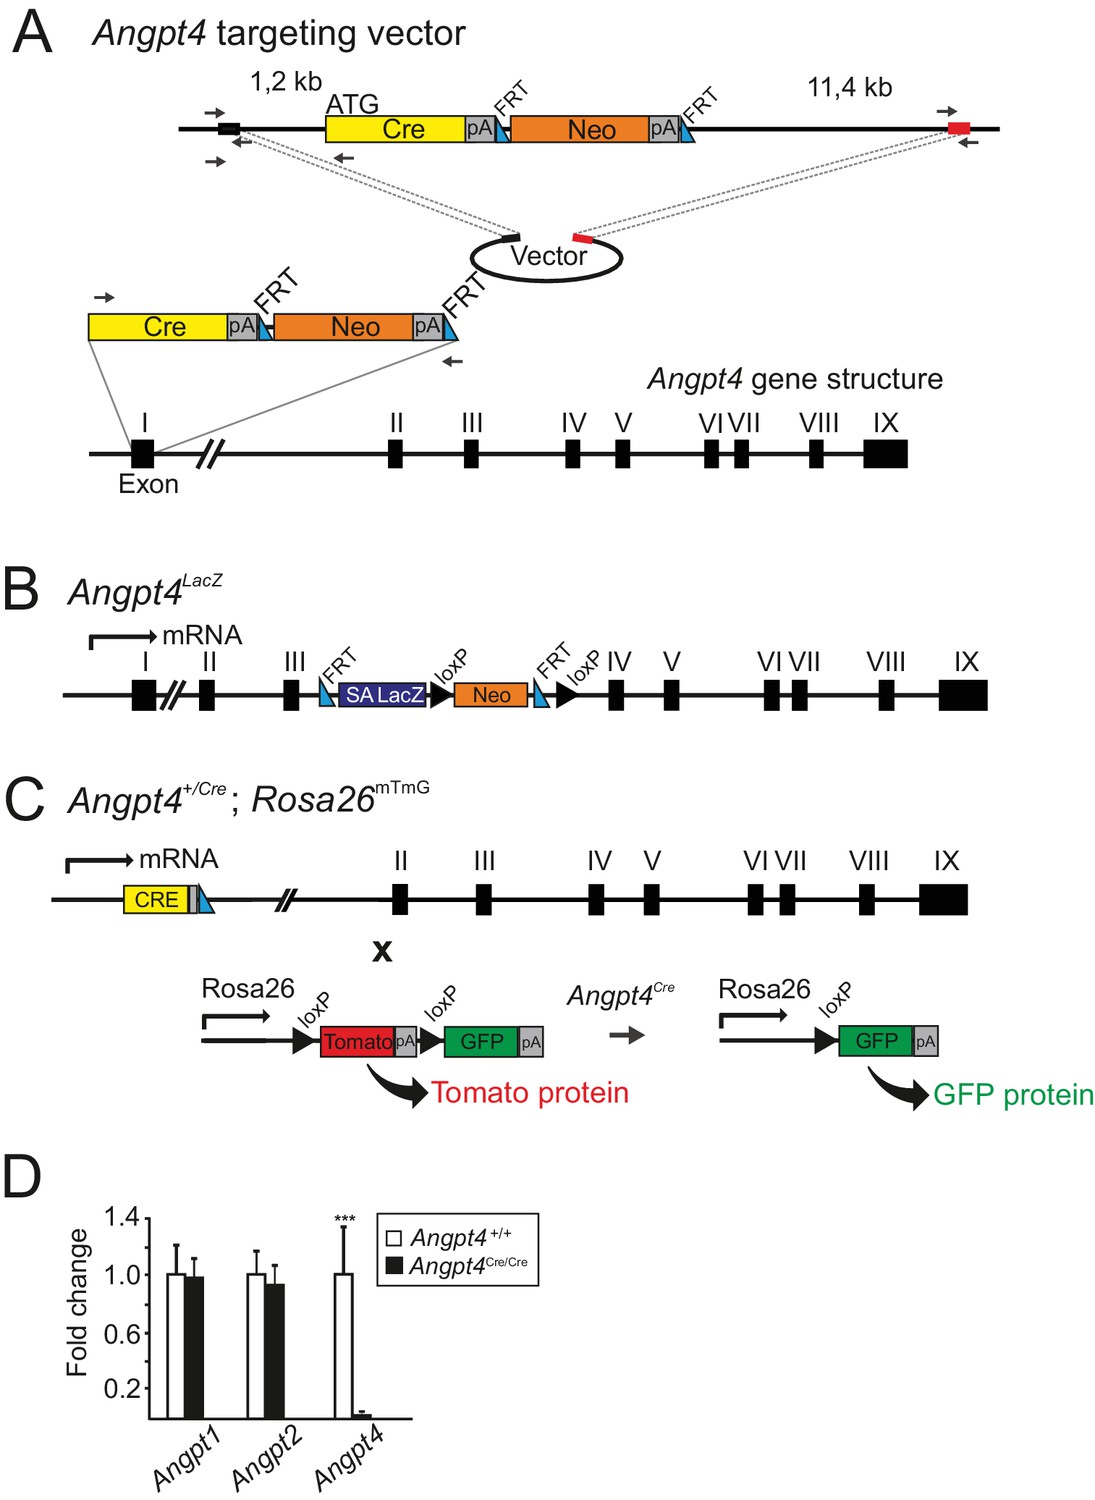
Generated Angpt4 mouse alleles.
(A) Strategy used to insert Cre cassette into the murine Angpt4 locus. A targeting construct was generated by recombineering method. The flanking regions and position of used primers (black arrows) are shown and the primer sequences are provided in the Materials and methods section. The first exon of the Angpt4 gene was replaced by Cre/Neo cassette and Neo was removed by FRT sites and flippase enzyme. Black and red boxes represent generated homologous sequences for recombination. (B) A schematic representation of Angpt4LacZ allele. A splice acceptor (SA) site with LacZ cassette was inserted between exon III and exon IV in Angpt4 gene locus. Endogenous expression of Angpt4 resulted in a truncated Angpt4 fusion protein with LacZ revealing Angpt4 expression in X-Gal-stained tissues. (C) A fate mapping strategy to track Angpt4 expressing/expressed cells. Mouse line expressing Cre recombinase under endogenous Angpt4 promoter was crossed with Rosa26mT/mG mouse line. In resulting mice, constitutive tomato expression is replaced by Cre recombinase induced GFP when Angpt4 is expressed. In Angpt4+/Cre; Rosa26mTmG model, Angpt4-expressing cells are labeled permanently and remain indelibly GFP positive if Angpt4 expression is discontinued. (D) Analysis of Angpt4 mRNA expression level in WT control and Angpt4Cre/Cre eyes in relation to β-actin. Fold change was calculated from Ct values. No Angpt4 mRNA in homozygous Angpt4Cre/Cre mice is observed indicating a null allele (hereafter Angpt4-/-). No compensatory change was observed in Angpt1 or Angpt2 mRNA expression level in Angpt4-/- eyes at P12 (Angpt4-/- n = 5 and WT n = 6). Mean ±SD, ***p<0.001 Angpt4-/- vs. WT in t-test.
Figure 1—figure supplement 2
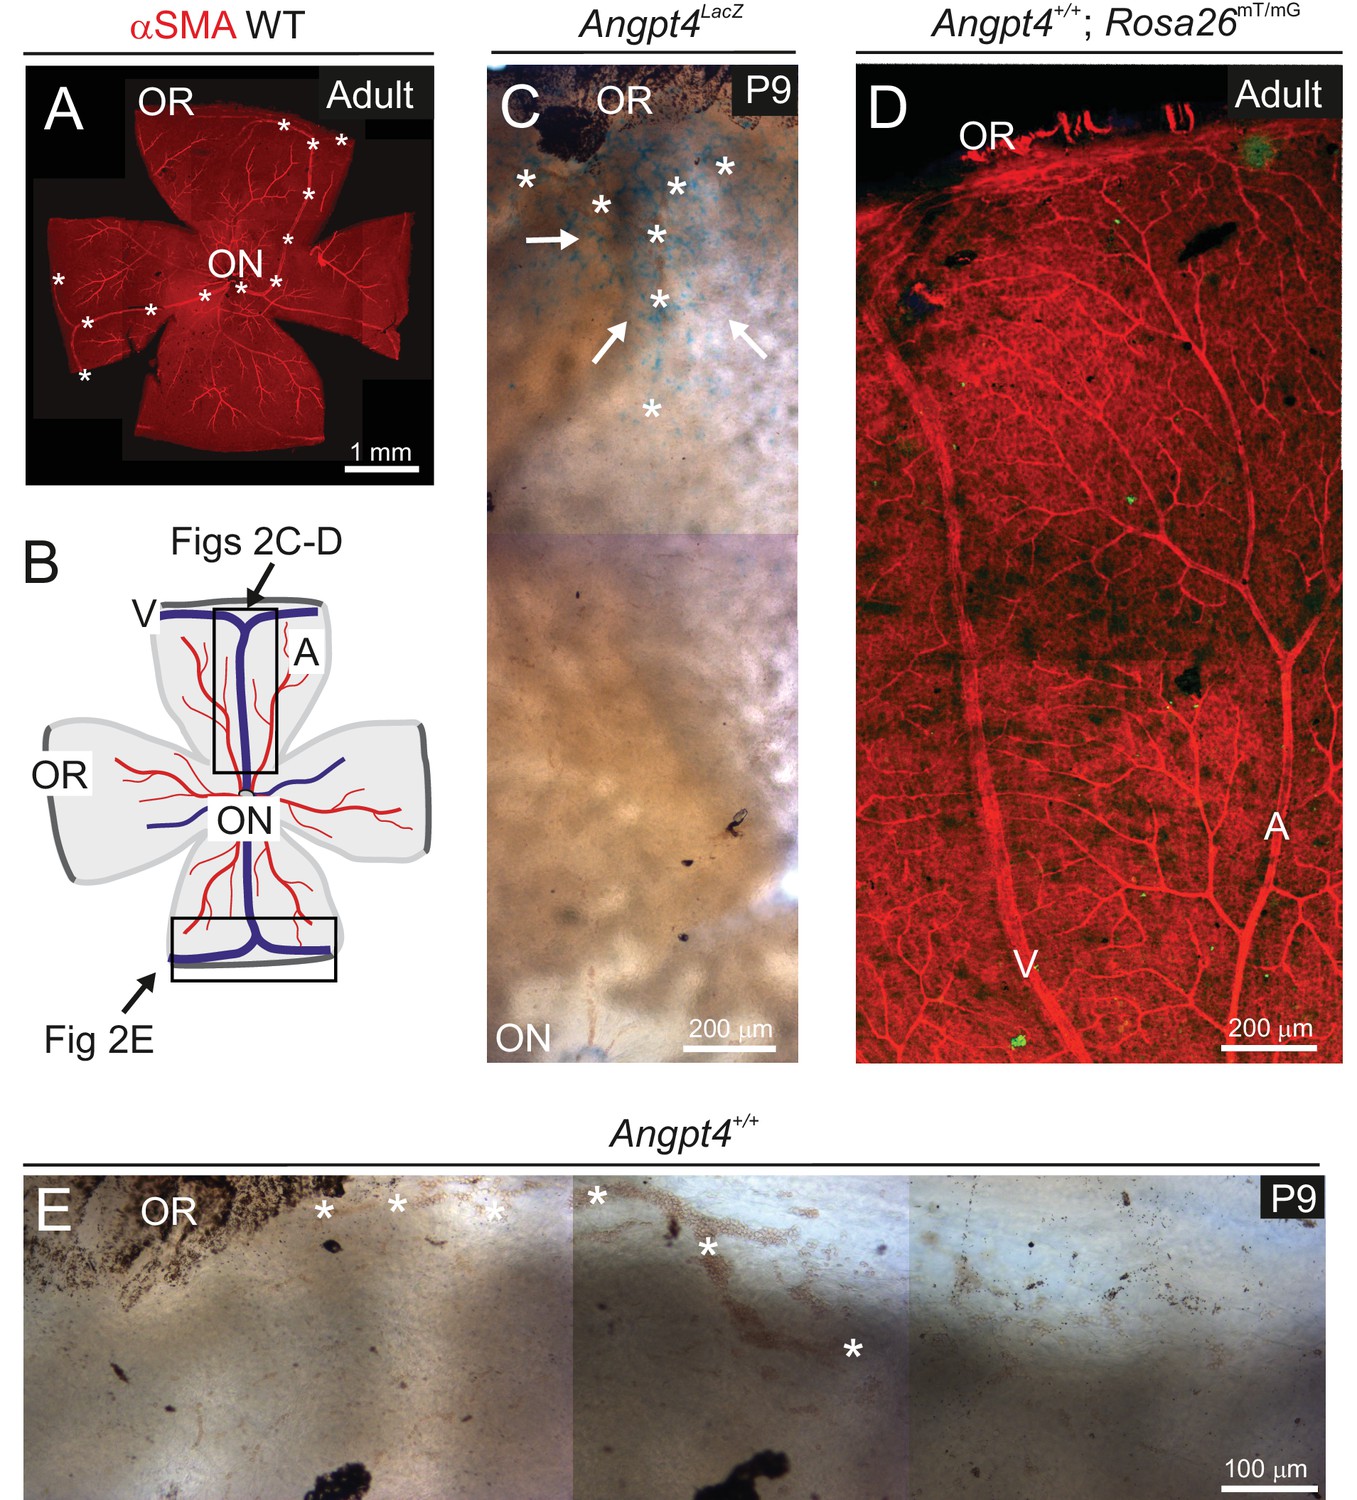
Controls of Angpt4 gene expression in mouse retina model.
(A) Whole mount preparation showing entire adult mouse retina. αSMA staining indicates arteries and veins. Two major Y-shaped veins extending from optic nerve head (ON) forming branches in the periphery near ora serrata (OR) are highlighted by asterisks. (B) A cartoon indicating location of microscopic analysis (framed) shown in panels C–E. Blue line, vein (V); red line, artery (A); OR, ora serrata; ON, optic nerve head. (C) Angpt4LacZ allele visualized with X-Gal showed staining (blue, white arrows) in the peripheral part of retina near OR region at age P9 indicating Angpt4 expressing cells, whereas central retina is virtually negative. Asterisks indicate branching vein in the periphery of retina. (D) Retina from adult Angpt4+/+; Rosa26mT/mG mouse shows no GFP-positive cells (green) without Angpt4Cre. Only mTomato expressing cells (red) were seen as expected. (E) Peripheral retinal segment from Angpt4+/+ mouse stained with X-Gal showed no staining in P9 retina. Asterisks indicate a forming vein in the periphery of retina near OR.
Figure 2 with 2 supplements
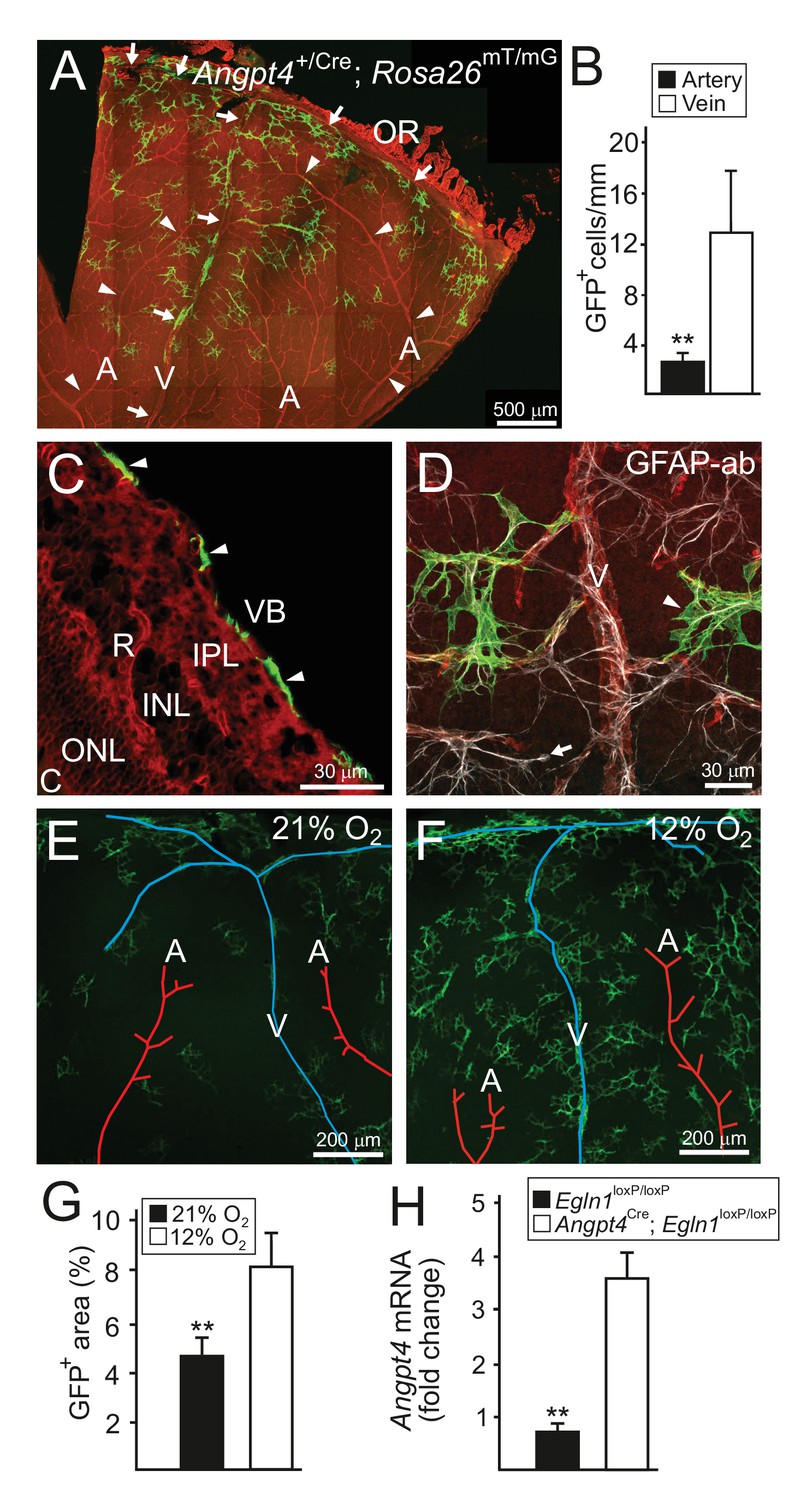
Angpt4 marks a specific subpopulation of retinal astrocytes and is induced in low oxygen.
Angpt4 lineage cells (GFP, green) visualized in Angpt4Cre/+; Rosa26mT/mG reporter mice in adult (2 months) in (A-D) retina. Angpt4-negative cells express mTomato (red). (A) Similarly to developing retina (Figure 1), GFP-positive cells are enriched in the distal segment near ora serrata (OR) when compared to central retina. GFP positive cells are also less numbered near to arteries (A, arrowheads) than veins (V, arrows). Quantification of the image data is shown in (B). (C) Section through the adult retina (R) reveals Angpt4 lineage cells (arrowheads) locating in the superficial layer of retina, whereas other retina layers are negative (VB, vitreous body; IPL, inner plexiform layer; INL, inner nuclear layer; ONL, outer nuclear layer; C, choroid). (D) All GFP+ cells (arrowhead) express astrocyte marker GFAP (white). However, not all astrocytes are GFP positive (arrow). (E–G) Low oxygen increases number of Angpt4+ astrocytes, but does not induce Angpt4 expression in other cell types (in 1.5 months old mice). Quantification of the image data is shown in (G). (H) Induction of hypoxia-inducible factor pathway in Angpt4-expressing cells via Angpt4Cre mediated Egln1 deletion increases Angpt4 expression in P12 eye. Mean ±SD, **p<0.01 in t-test. n = 5 (B) and n = 4 mice (G)/group. In (H) n = 5 Egln1loxP/loxP and n = 2 Angpt4Cre; Egln1loxP/loxP mice.
Figure 2—figure supplement 1
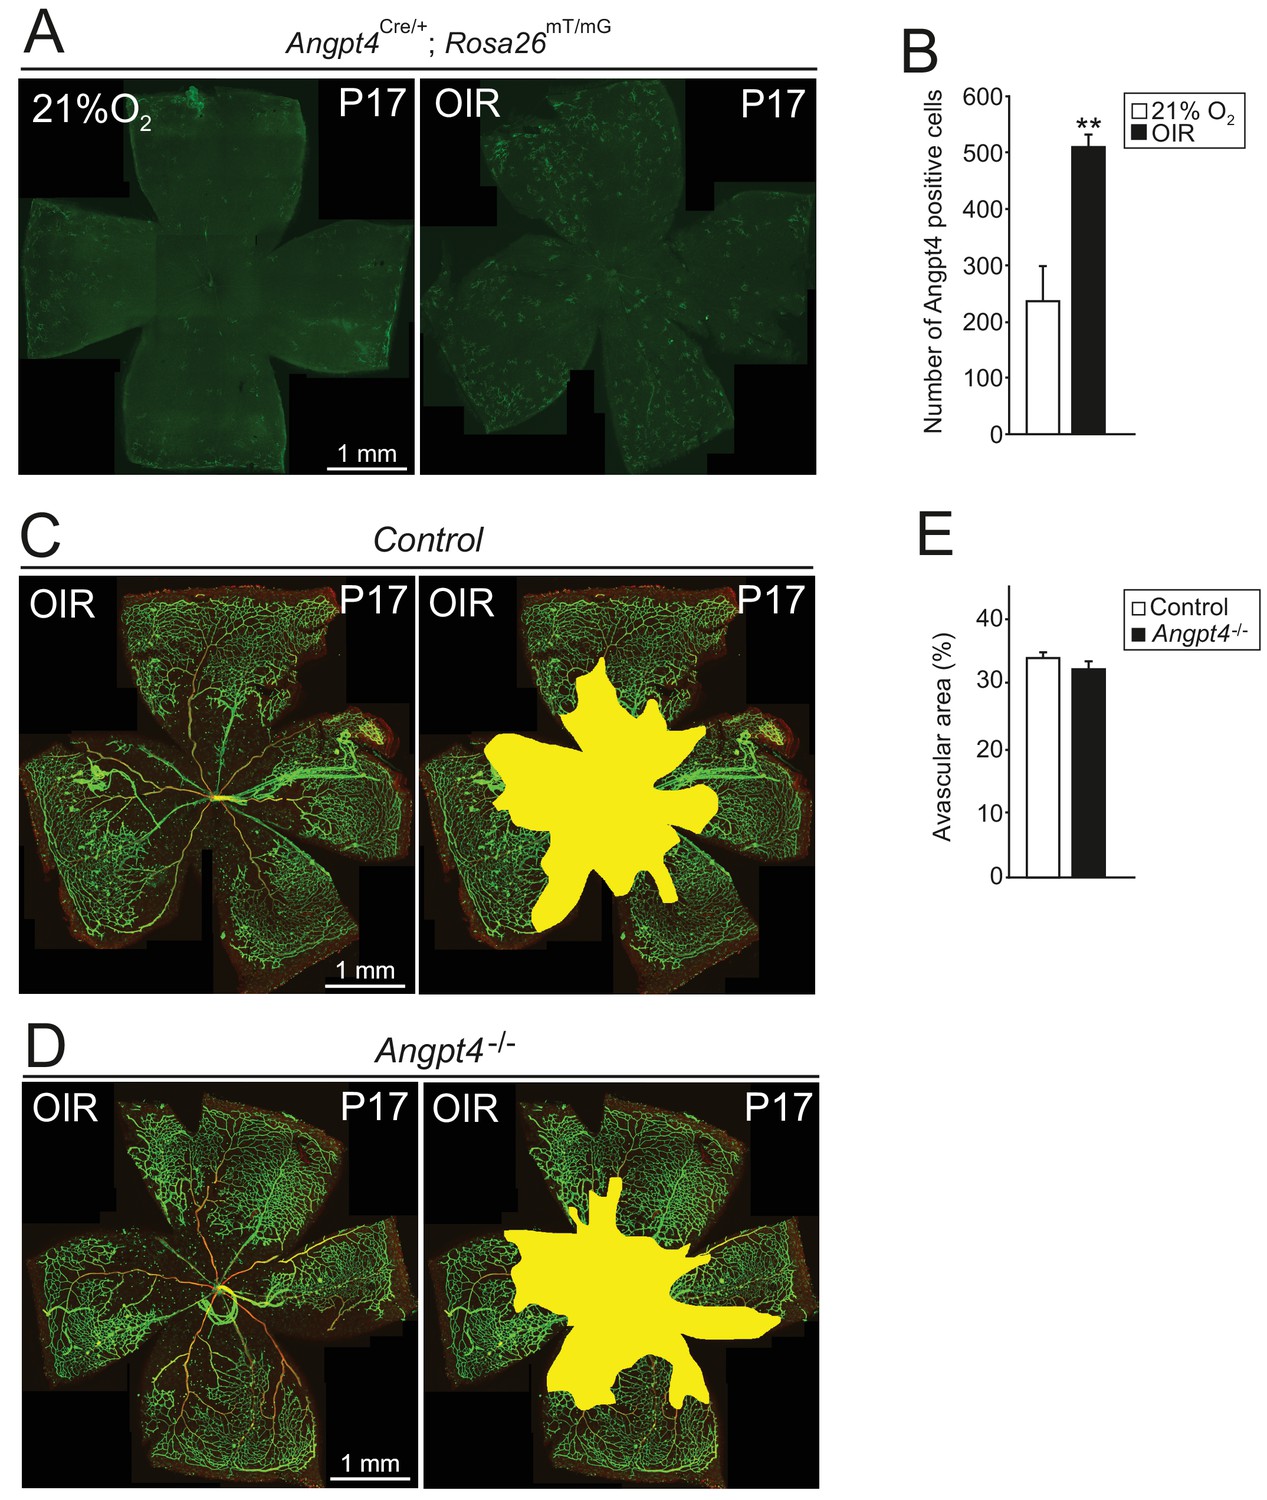
Induction of Angpt4 expression and degree of vasculopathy in OIR model in Angpt4-/- mice.
In the oxygen-induced retinopathy (OIR) -model, P7 mice were exposed to 75% oxygen for 5 days and then returned to normoxia (21% O2) for 5 days, resulting in capillary dropout and retinal ischemia that are followed by capillary proliferation for neovascularization of avascular areas. (A) Angpt4 lineage cells (GFP, green) visualized in Angpt4Cre/+; Rosa26mT/mG reporter mice in flat mount retinas harvested at P17. (B) In OIR-model, number of GFP positive cells is increased compared to normoxia. (C–D) Whole mount retinal staining of OIR retinas, IB4 (green) and αSMA (red) staining visualize capillary-artery-vein hierarchy in the superficial layer. Avascular areas quantified in (E) are highlighted in yellow. Angpt4 deficiency does not affect neovascular tuft formation or capillary regeneration in avascular retina. (B) and (E) Quantification of image data; control n = 4 and OIR n = 2 mice (B); control n = 5 and Angpt4-/- n = 4 mice (E). Mean ±SD, **p<0.01 in t-test.
Figure 2—figure supplement 2
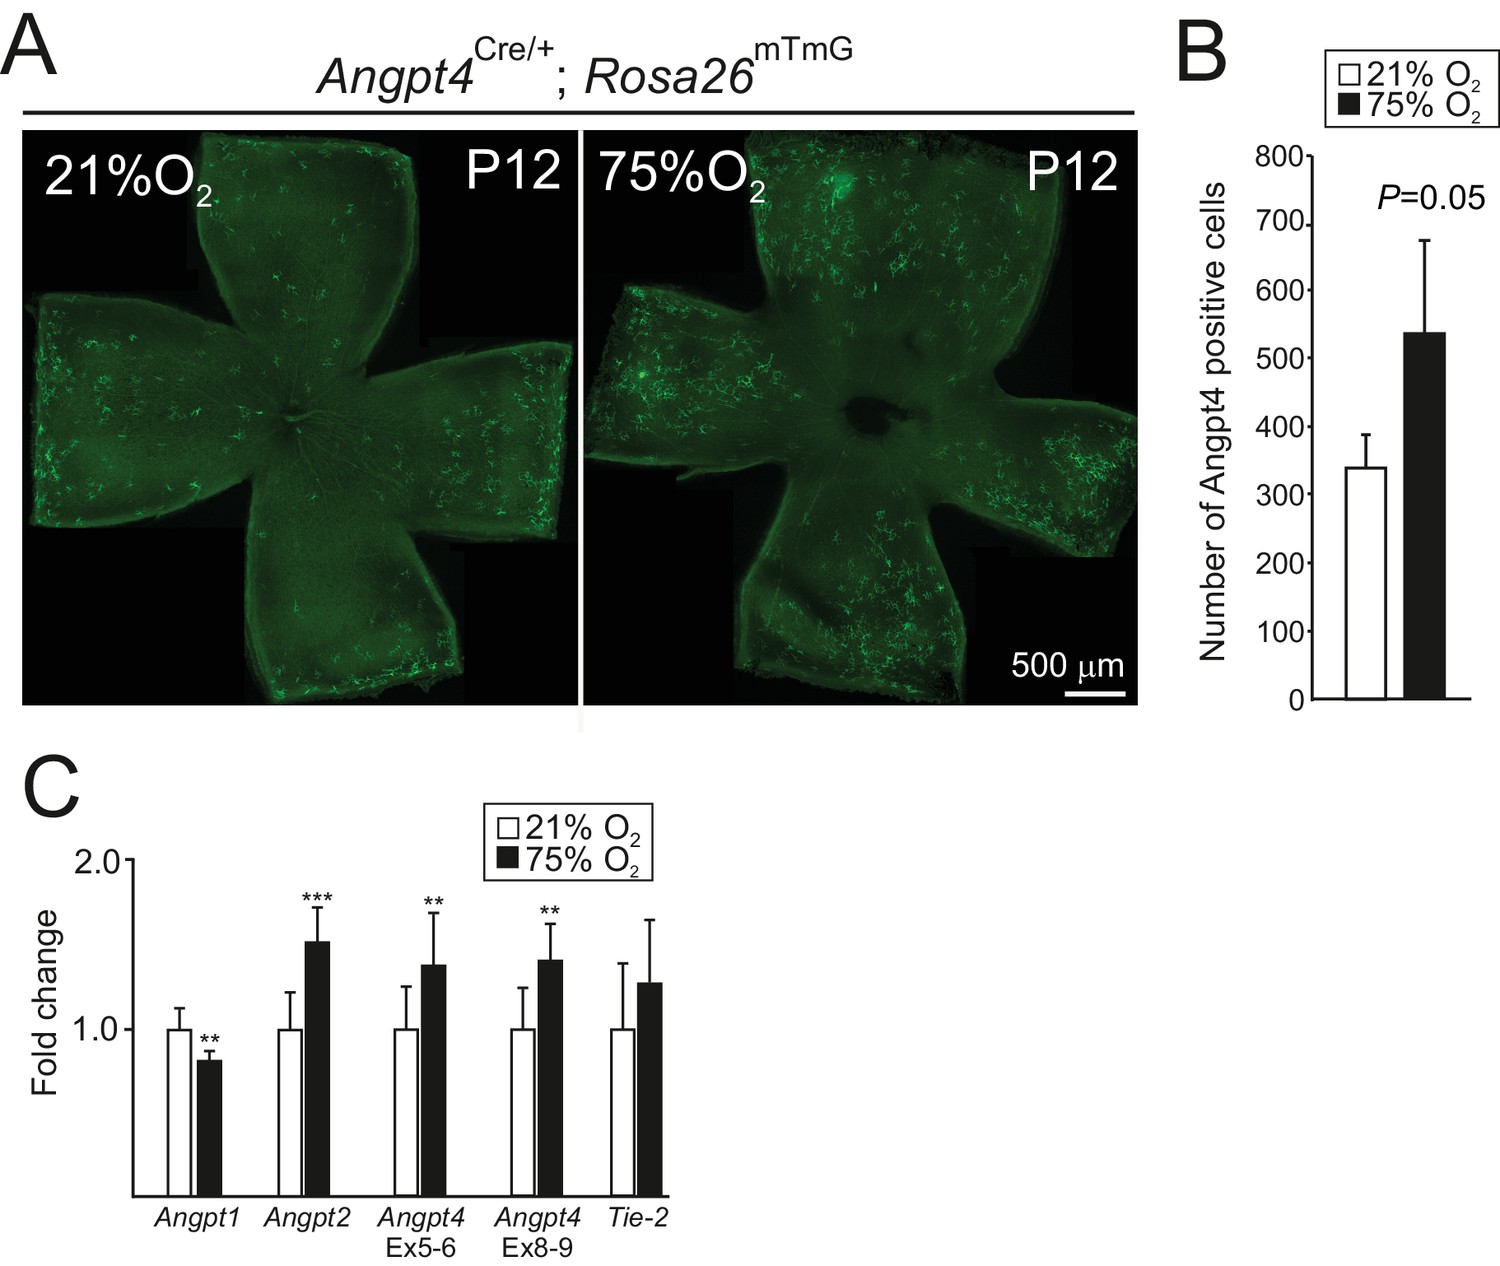
Angpt4 expression in hyperoxia model.
P7 mice were exposed to 75% oxygen for 5 days and number of GFP-positive cells were analyzed from P12 retinas. (A) Angpt4-lineage cells (GFP, green) visualized in Angpt4Cre/+; Rosa26mT/mG reporter mice in flat mount retinas. (B) Quantification of the image data. (C) Analysis of angiopoietins and Tie2 mRNA expression levels in normoxia (21% O2) and hyperoxia (75% O2) eyes in relation to β-actin. Fold change was calculated from Ct values. For verification, Angpt4 level was measured using two oligo pairs from exons 5–6 (Ex 5–6) and exons 8–9 (Ex 8–9). (B) n = 4 mice/group. (C) n = 9 mice/group. Mean ±SD, **p<0.01 and ***p<0.001 in t-test.
Figure 3 with 1 supplement
mRNA expression of angiopoietins and Tie2 in retinal vein development.
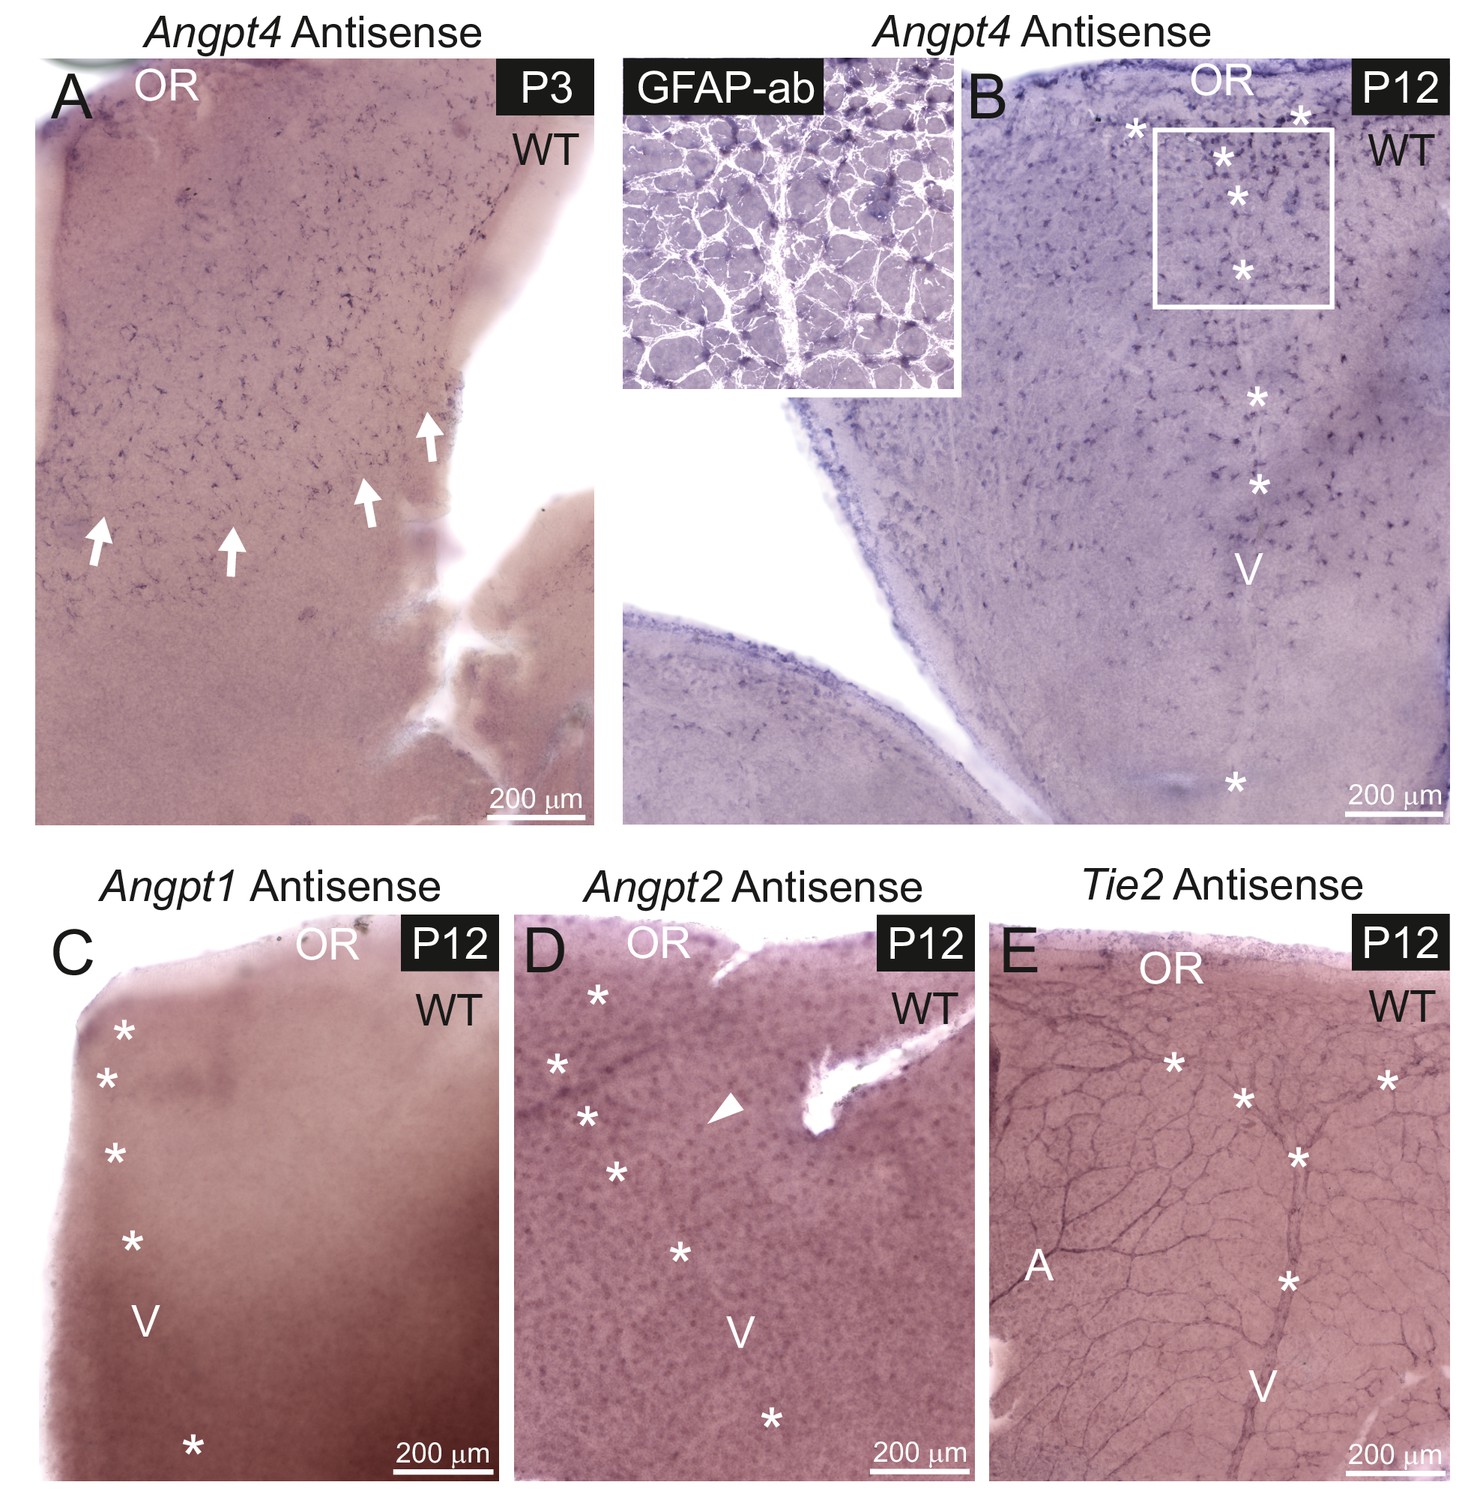
mRNA expression was detected in whole mount retinas from WT mice by in situ hybridization. (A) At P3, astrocytes expressing Angpt4 precede the front of the developing vasculature (red blood cells indicated by arrows). (B) At P12, Angpt4 expression is notable around the developing vein in the peripheral retina (V, asterisks) and colocalizes with the astrocyte marker GFAP (white overlay in insert). (C) Angpt1 expression is not detected at P12 by whole mount in situ hybridization in the peripheral retina. (D) Angpt2 is expressed in retinal neurons (arrowhead) in the intermediate retinal plexus. (E) Expression of Tie2 is detected in the endothelium of arteries (A), veins and capillaries at P12. OR, ora serrata.
Figure 3—figure supplement 1

Controls of in situ hybridization staining.
(A–F) Whole mount retinas from WT or Angpt4-/- mice. (A) Angpt4-/- retina at P12 shows no signal for Angpt4 antisense probe, as expected. (B–F) In situ hybridizations with sense control probes for Angpt4 at P3 (B) and P12 (C) and for Angpt1 (D) Angpt2 (E) and Tie2 (F) at P12 were performed in parallel with antisense probe hybridizations. All sense probes show only unspecific background staining. Asterisks indicate developing vein (V) OR, ora serrata. (G–J) Specificity of the Angpt1 antisense probe was confirmed by positive staining of retinal neurons at P4 (arrowhead) (G) and atriums at P2 (I). Corresponding sense controls (H, J) were negative.
Figure 4 with 1 supplement
Retinal veins of Angpt4 deficient mice show SMC abnormality and smaller diameter.
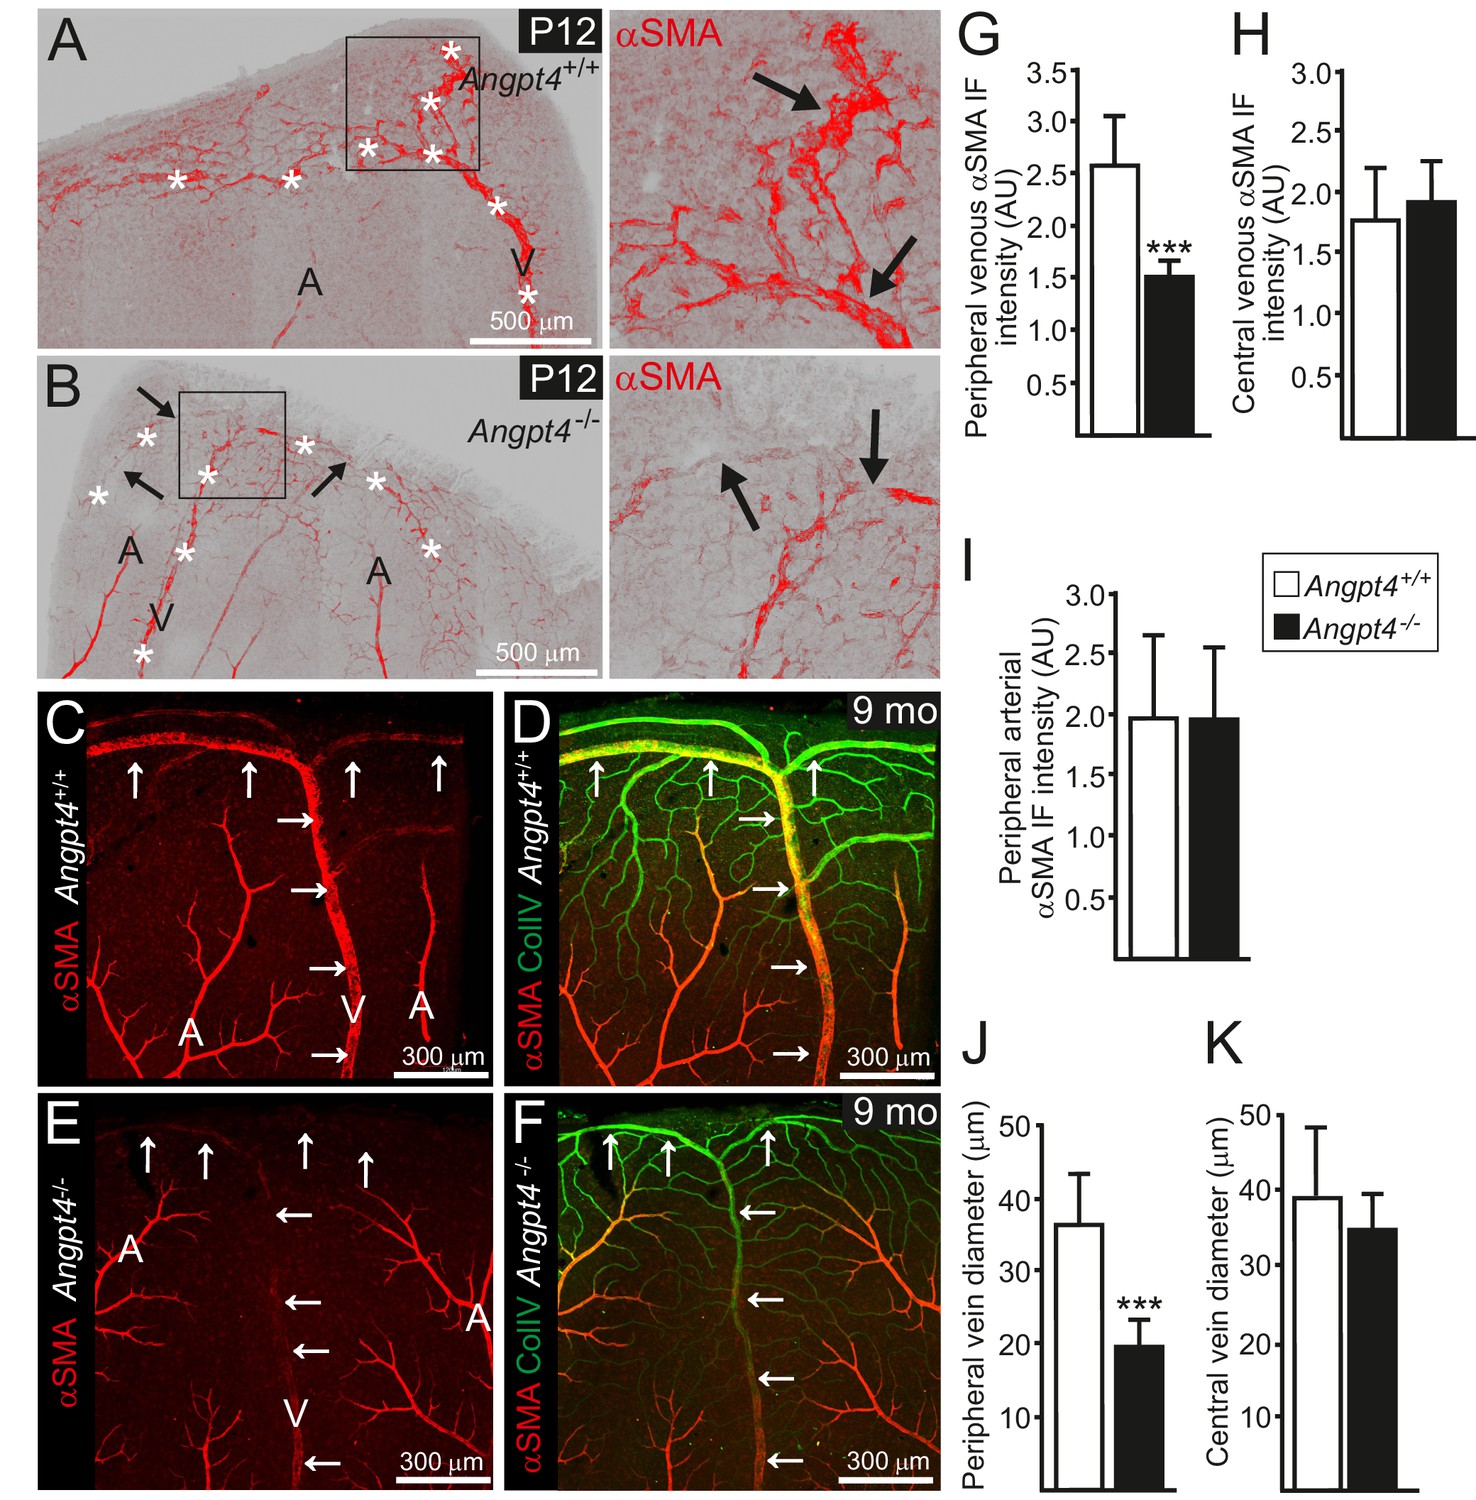
(A) P12 WT retina whole mount shows strong αSMA staining (red, arrows) in the developing annular vein in the peripheral retina. (B) αSMA staining is weak in Angpt4-/- retina especially in the peripheral location (red, arrows). Asterisks indicate developing Y-shaped annular peripheral vein in (A) and (B). (C–F) Whole mount retinal staining of nine months old mice. αSMA staining (red) (C, E) and merged image (D, F) with Col IV (green) indicate perivascular sleeves. In Angpt4-/- retina, αSMA level is low around annular veins (V, arrows) in the peripheral retina, but not around arteries (A). (G–I) αSMA immunofluorescence intensity (IF) in Angpt4-/- retina is reduced around annular peripheral veins (G), but not in veins close to optic nerve head (central) (H) or arteries (I) (n = 3 mice/group). (J–K) Peripheral annular vein diameter is reduced in Angpt4-/- retina. n = 8 WT and 6 Angpt4-/- mice, measured from the base of the peripheral bifurcation (J). n = 8 WT and 8 Angpt4-/- mice, measured from the central region close the optic nerve head (K). Mean ±SD, ***p<0.001 in t-test.
Figure 4—figure supplement 1

Vascular structures and densities in the intermediate and deep vascular plexuses.
(A-B) Periodic acid-Schiff staining (PAS) for polysaccharides counterstained with hematoxylin. PAS stains vascular basement membranes in superficial (black arrowheads) and intermediate/deep vascular plexuses (white arrowheads). PAS staining is also diagnostic for plasma leakage resulting in formation of exudates into the retina, which is not observed in either of the genotypes. (C) Quantification of the image data; n = 3 mice/group, average of 3–4 sections, mean ± SD. Peripheral sections representing microscopic fields are shown in (A) and (B). (D-E) Primary and deeper vascular plexuses at postnatal day 12. (F–G) Col IV staining illustrates superficial, intermediate and deep retinal vasculature in adult peripheral retina. V, bifurcation of peripheral vein. (H–I) TEM analysis of blood vessels locating in the intermediate/deep plexuses show no structural abnormalities. NS = not significant in t-test.
Figure 5 with 1 supplement
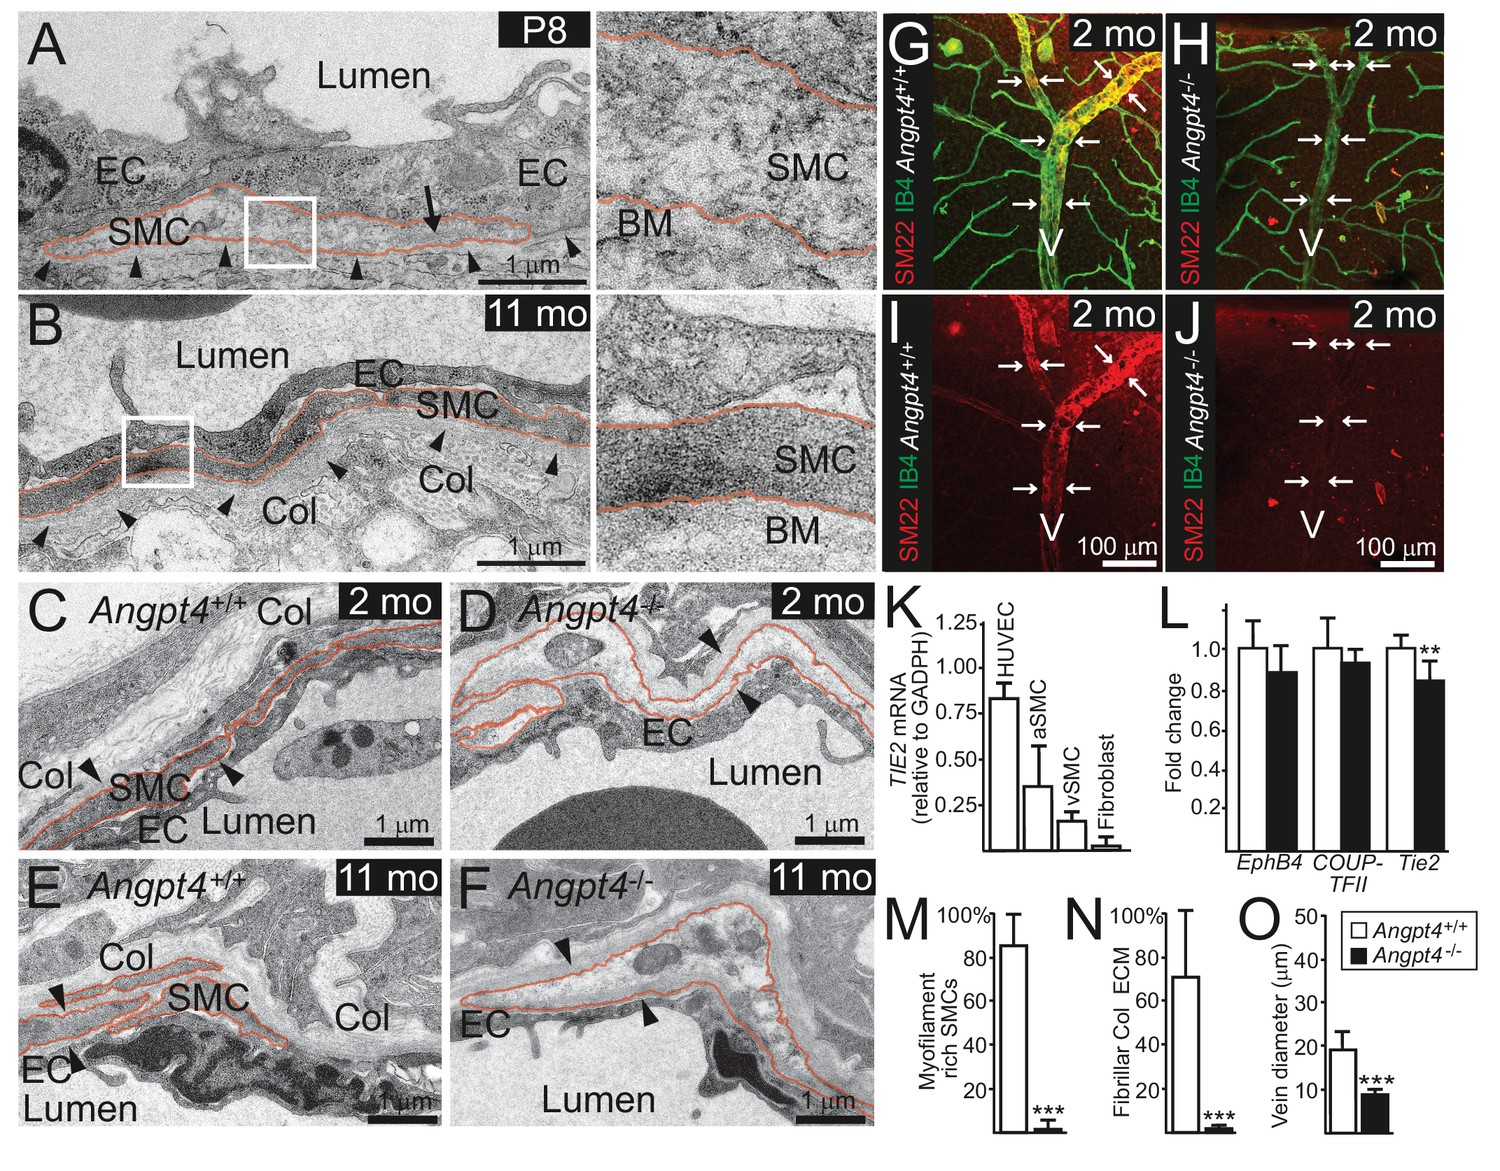
Angpt4 deficiency results in defective SMC maturation in veins.
TEM micrographs of peripheral annular vein in P8 (A) and adult (11 months old) mice (B). SMCs are marked by red line. In the developing veins, SMCs are covered by basement membranes (BM, arrowheads) and SMC cytoskeleton appears translucent with some myofilaments (arrow). Perivascular ECM contains no fibrillar collagen. In adult mouse, venous SMC cytoplasm is mostly filled with myofilaments and perivascular matrix contains fibrillar collagen (Col). TEM micrographs of peripheral vein in 2 (C, D) and 11 (E, F) months old WT and Angpt4-/- mice, respectively. In both genotypes, perivascular cells (red line) are closely aligned with ECs and surrounded by BM (arrowheads) that indicates SMC identity. In Angpt4-/- retina, SMC cytoplasm lacks myofibril-rich cytoskeleton and fibrillar collagen (Col) matrix. No ultrastructural abnormalities are observed in ECs. (G–J) Whole mount retinal staining of peripheral veins in 2 months old WT (G, I) and Angpt4-/- (H, J) mice. SM22 (red) (G–J) and IB4 (green) (G, H) staining. In Angpt4-/- retina, SM22 level is low around veins (arrows, V). (K) Tie2 expression in arterial (a) and venous (v) SMC cell lines. HUVECs and fibroblasts are positive and negative controls, respectively. (L) qPCR analysis of venous specification marker genes at P12 retinas (Angpt4-/-n = 5 and WT n = 6). (M–N) Quantification of SMC maturation markers from TEM analyzed retinas (n = 6 WT and n = 7 Angpt4-/- mice). (O) Peripheral annular vein diameter is reduced in Angpt4-/- retina (n = 7 mice/group, the shortest diameter of peripheral branch measured from TEM cross-section). Data are presented as mean ±SD, ***p<0.001 and **p<0.01 Angpt4-/- vs. WT in t-test.
Figure 5—figure supplement 1
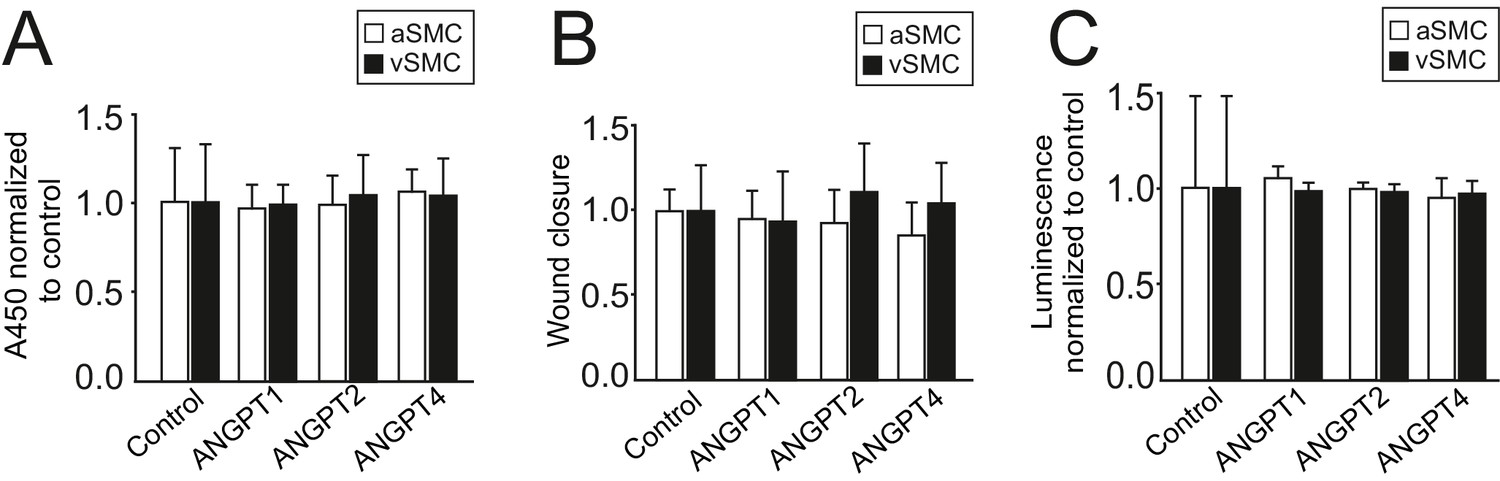
Smooth muscle cell proliferation, migration or apoptosis is not affected by ANGPT4.
(A) ANGPT4 does not affect proliferation of aSMCs (n = 5 independent experiments) or vSMCs (n = 3) in BrdU ELISA. (B) ANGPT4 does not affect migration of aSMCs (n = 3) or vSMCs (n = 4) in scratch assay, bars represent wound closure time/wound area normalized to control. (C) ANGPT4 has no effect on aSMC (n = 3) or vSMC (n = 2) apoptosis in Caspase 3/7 ELISA.
Figure 6 with 2 supplements
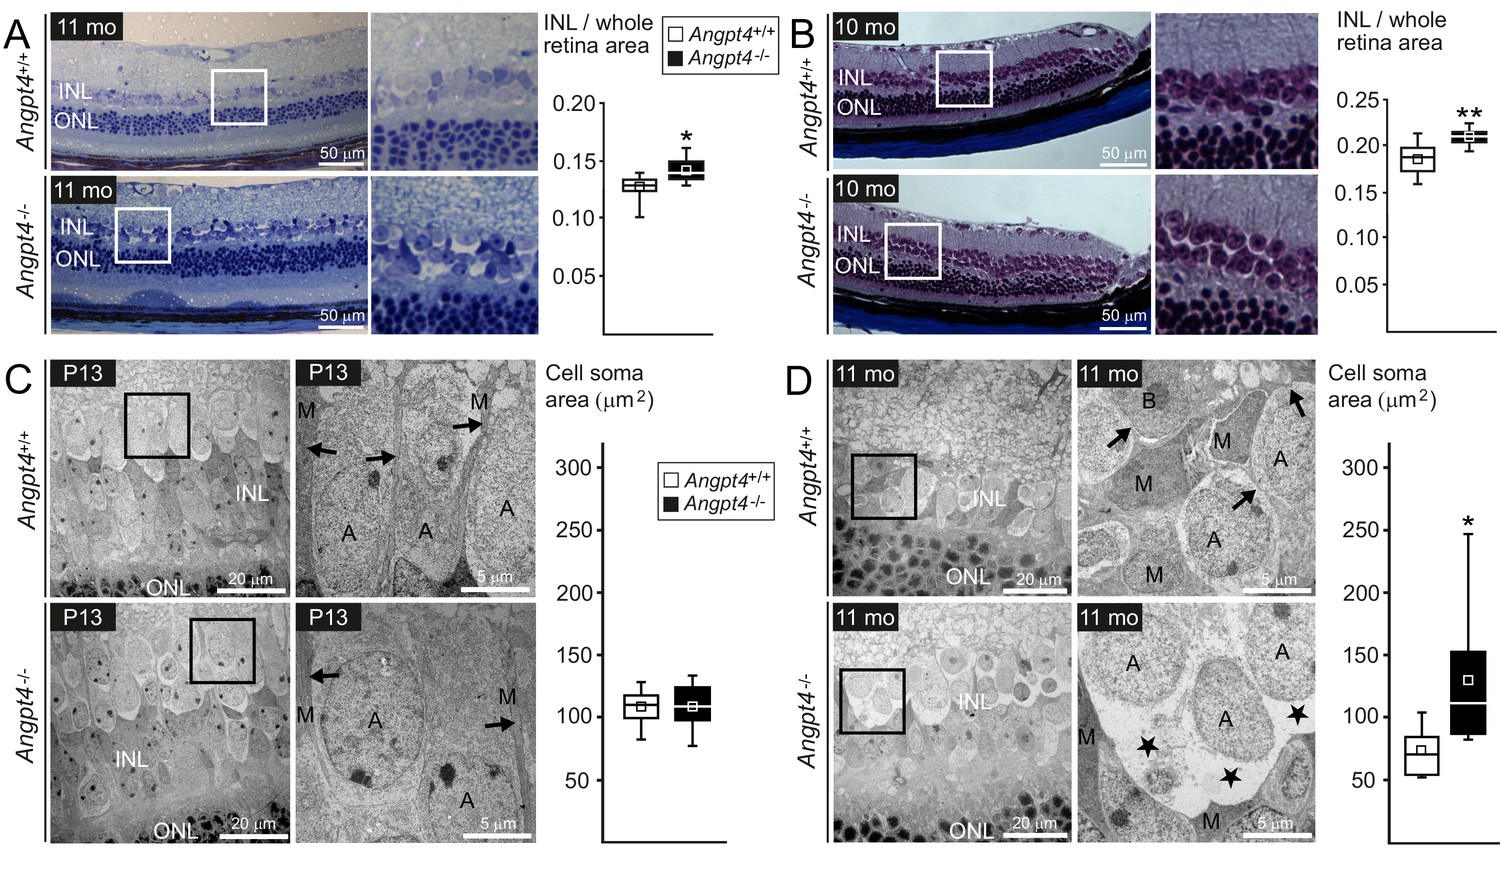
Neuronal cell swelling in adult Angpt4-/- mice.
(A–B) Light microscopy images of peripheral retinal sections from control and Angpt4-/- mice stained with (A) toluidine blue (n = 7 mice/group) or (B) Masson's trichrome (n = 9 control and 5 Angpt4-/- mice). Framed area of inner nuclear layer (INL) is magnified on the right. Two different fixation, embedding and staining protocols indicate increased thickness of the INL in (A) and (B), data analyzed at least from four sections per mouse. (C–D) TEM micrographs from peripheral INL. (C) n = 8 control and 6 Angpt4-/- P13 mice and in adult mice (D) n = 8 control and 8 adult Angpt4-/- mice. Quantification (on the right) was done from cell somas locating in the interface between INL and inner plexiform layer that is composed mainly of amacrine cells (Jeon et al., 1998). Asterisks indicate cell swelling in (D) and black arrows Müller cell processes (C, D) that are displaced around swollen cells. A, amacrine cell; M, Müller glia; B, bipolar cell. (A–D) Median (line), average (square), 75th quartile (box), 5th and 95th percentile (whiskers) in whisker blots. *p<0.05 and **p<0.01 WT vs. Angpt4-/- in t-test.
-
Figure 6—source data 1
Cell soma areas of individual neuronal cells in the interphase between INL and IPL.
- https://doi.org/10.7554/eLife.37776.017
Figure 6—figure supplement 1

Ultrastructural analysis of retinal layers in adult mice.
TEM reveals no alterations in the outer (A-B) or superficial (C-D) retinal layers in Angpt4-/- mice. RPE, retinal pigment epithelium; OS, photoreceptor outer segment; IS, photoreceptor inner segment; ONL, outer nuclear layer; INL, inner nuclear layer; IPL, inner plexiform layer; GCL, ganglion cell layer; RNFL, retinal nerve fiber layer; VB, vitreous body.
Figure 6—figure supplement 2

Inflammatory markers are not increased in adult Angpt4-deficient retinas.
(A) Number of CD45-positive cells per histological section. n = 3 mice/genotype, cells calculated from 2 to 4 retina sections/mouse. (B) qPCR analysis of leukocyte migration and infiltration marker genes. MCP-1, monocyte chemoattractant protein-1; ICAM-1, intercellular adhesion molecule-1.
Figure 7 with 1 supplement
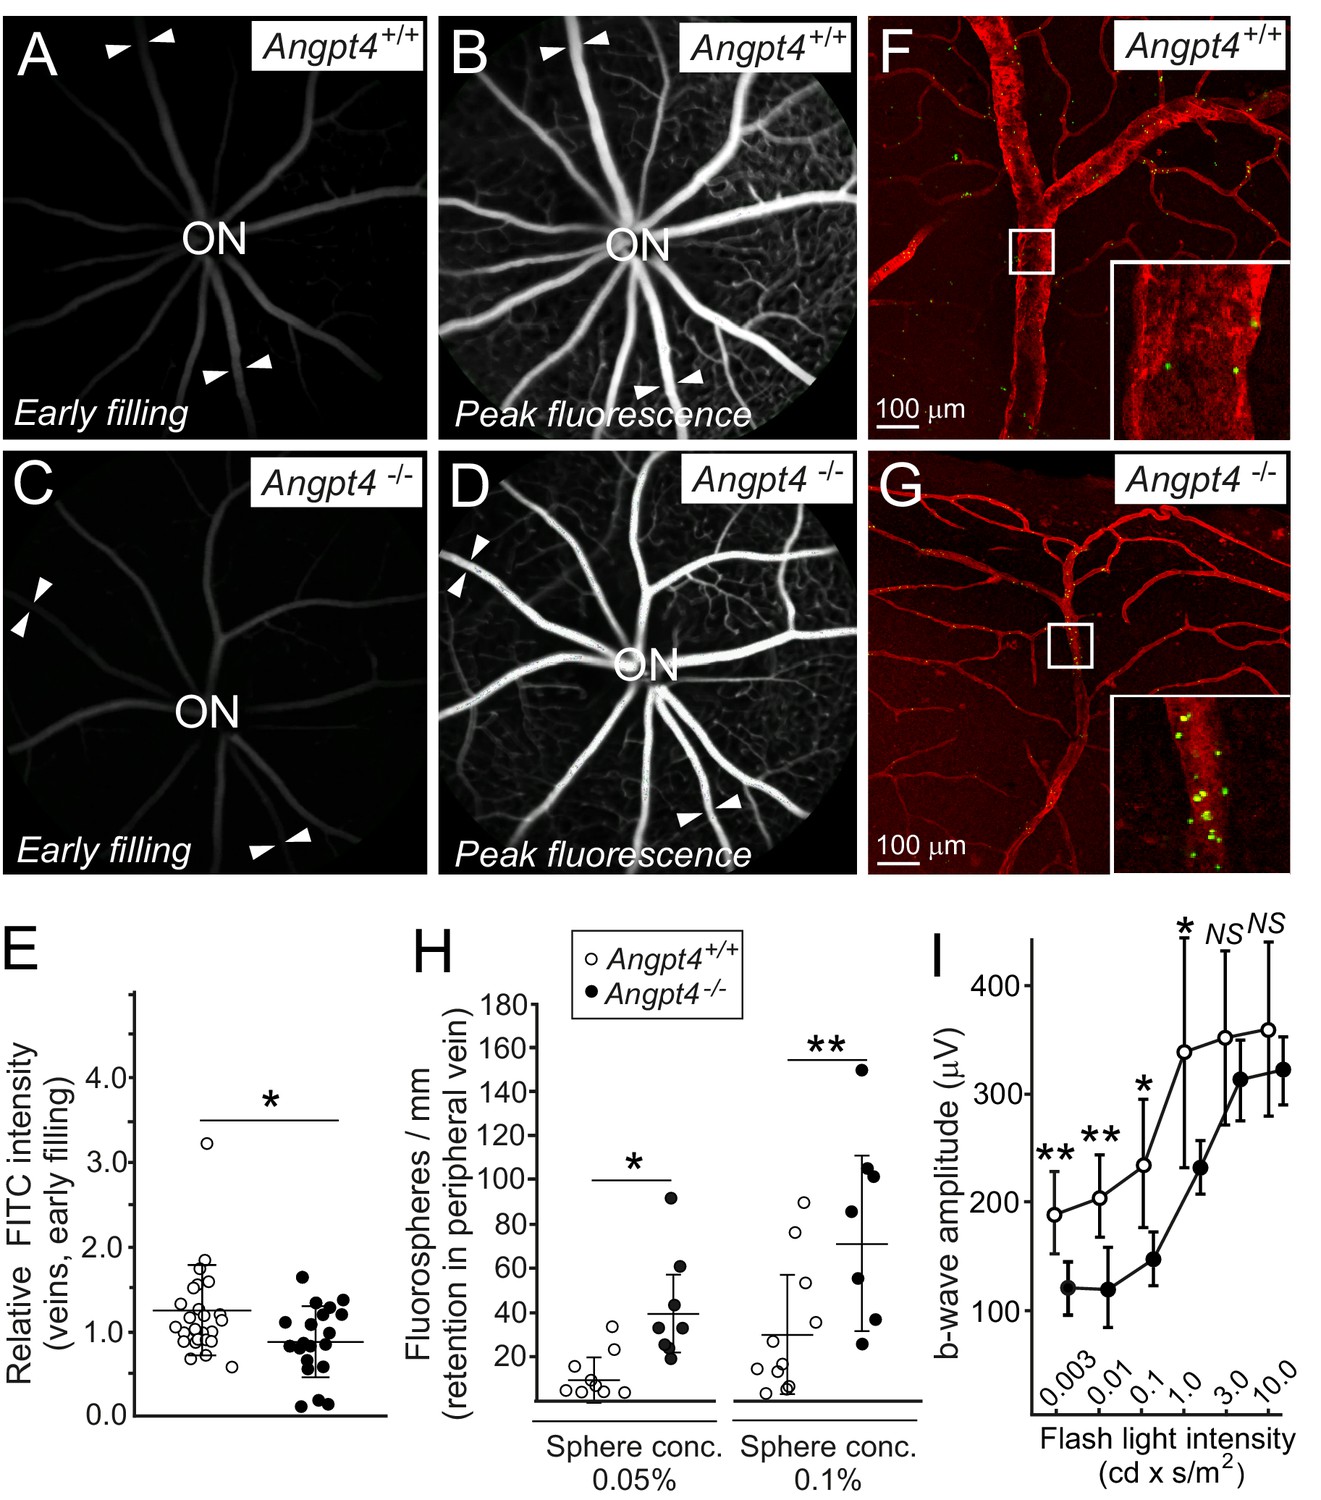
Functional analysis of venous flow and neuronal activity in retina.
(A-D) Filling of the retinal veins in fluorescein angiography. Fundus camera images show the same retinas in (A) and (B) and in (C) and (D) in early filling phase (A, C) and in the peak phase of fluorescence (B, D). Arrowheads highlight examples of veins extending peripheral retina. (E) Quantification of the early filling image data; symbols represent fluorescein intensity in individual veins/average arterial fluorescein intensity in the same eye from 7 WT and 5 Angpt4-deficient mice. (F–G) Retention of fluorospheres in the peripheral annular vein after carotid artery injection. Blood vessels were counterstained with Cy3-conjugated αSMA antibody and co-injected Evans blue. (H) Two different sphere concentrations were used, and results are expressed as number of microspheres normalized by the length of venous segment analyzed. Each symbol represents an individual vein from 5 WT and 5 Angpt4-deficient mice. (I) Amplitudes of the b-wave in aged (eight months) WT and Angpt4 deficient mice. ERGs were measured at six different flash intensities as indicated. Data are presented as mean ±SD (n = 12 WT and n = 8 Angpt4-/- eyes). **p<0.01, *p<0.05 in t-test.
-
Figure 7—source data 1
Electroretinogram measurements of individual eyes.
- https://doi.org/10.7554/eLife.37776.020
Figure 7—figure supplement 1
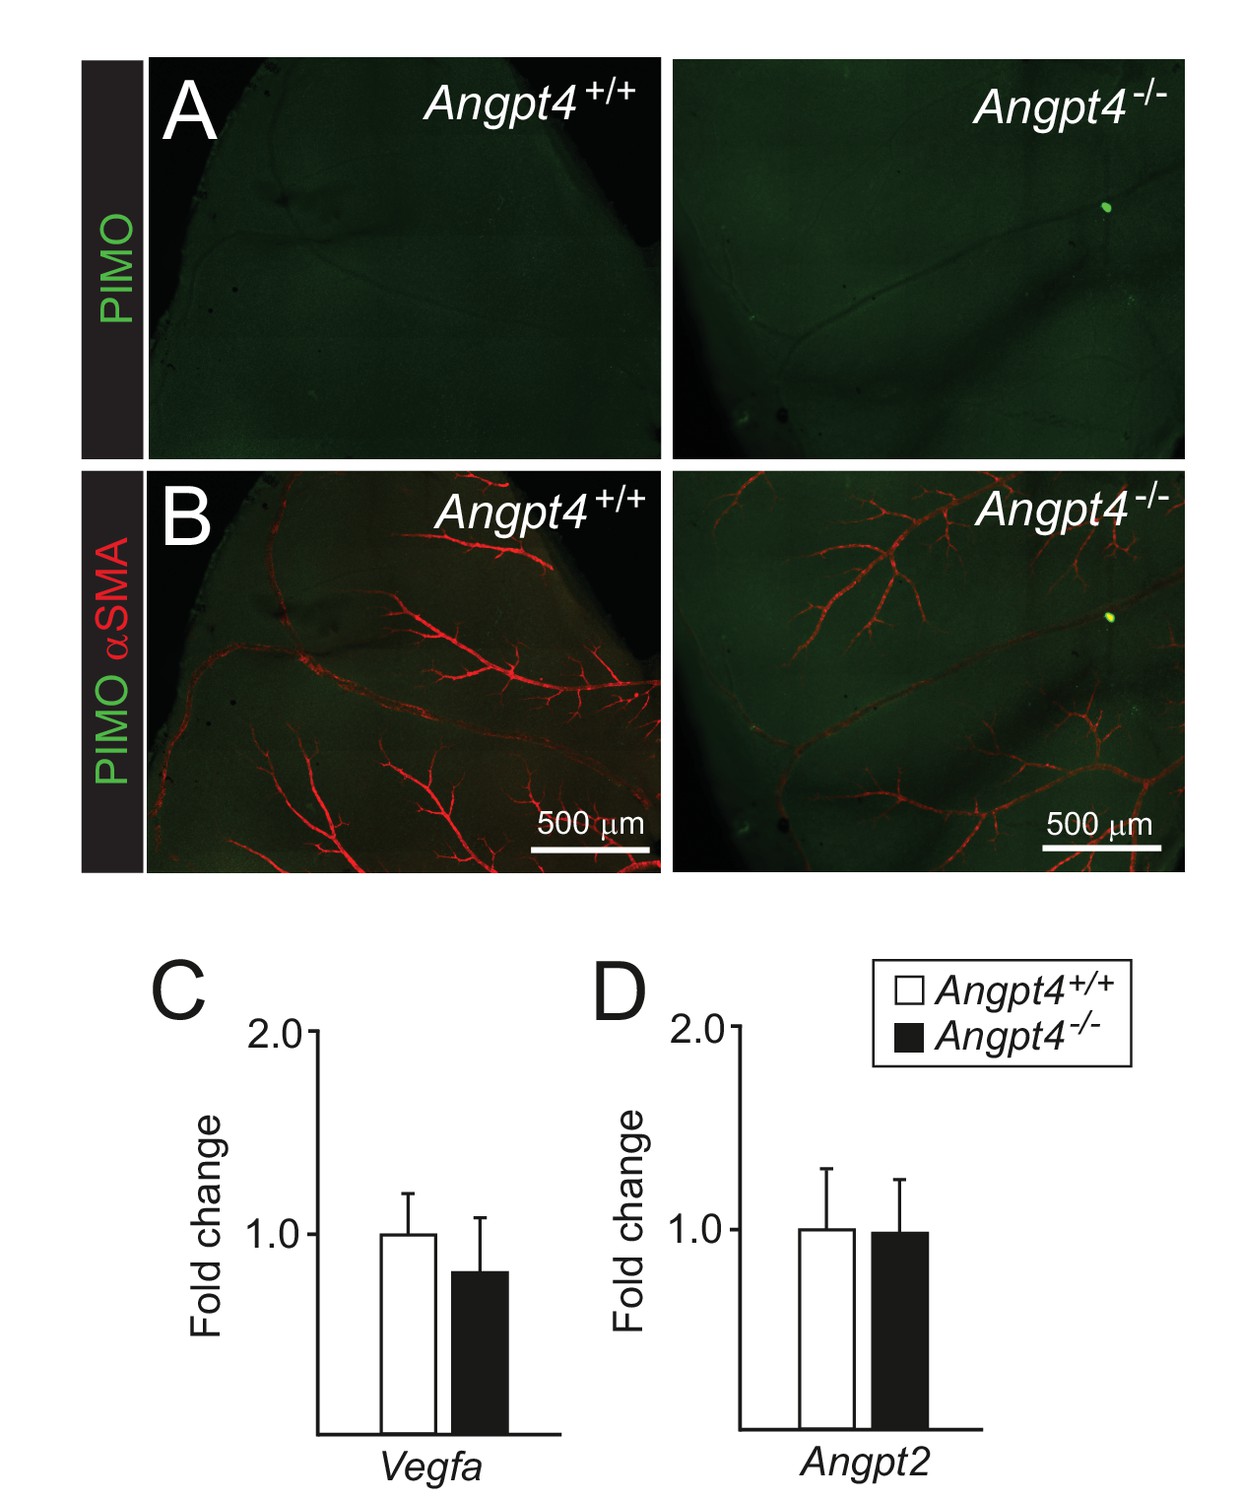
Hypoxia markers are not increased in adult Angpt4-deficient retinas.
(A-B) Pimonidazole was administrated i.v., and after 1 hr retinas were collected. Negative pimonidazole (hypoxyprobe) immunostaining in retina, lower panels merged with αSMA. (C–D) qPCR analysis of Vegfa and Angpt2 mRNA isolated from eyes, n = 3 mice/group. Mean ±SD.
Figure 8 with 1 supplement
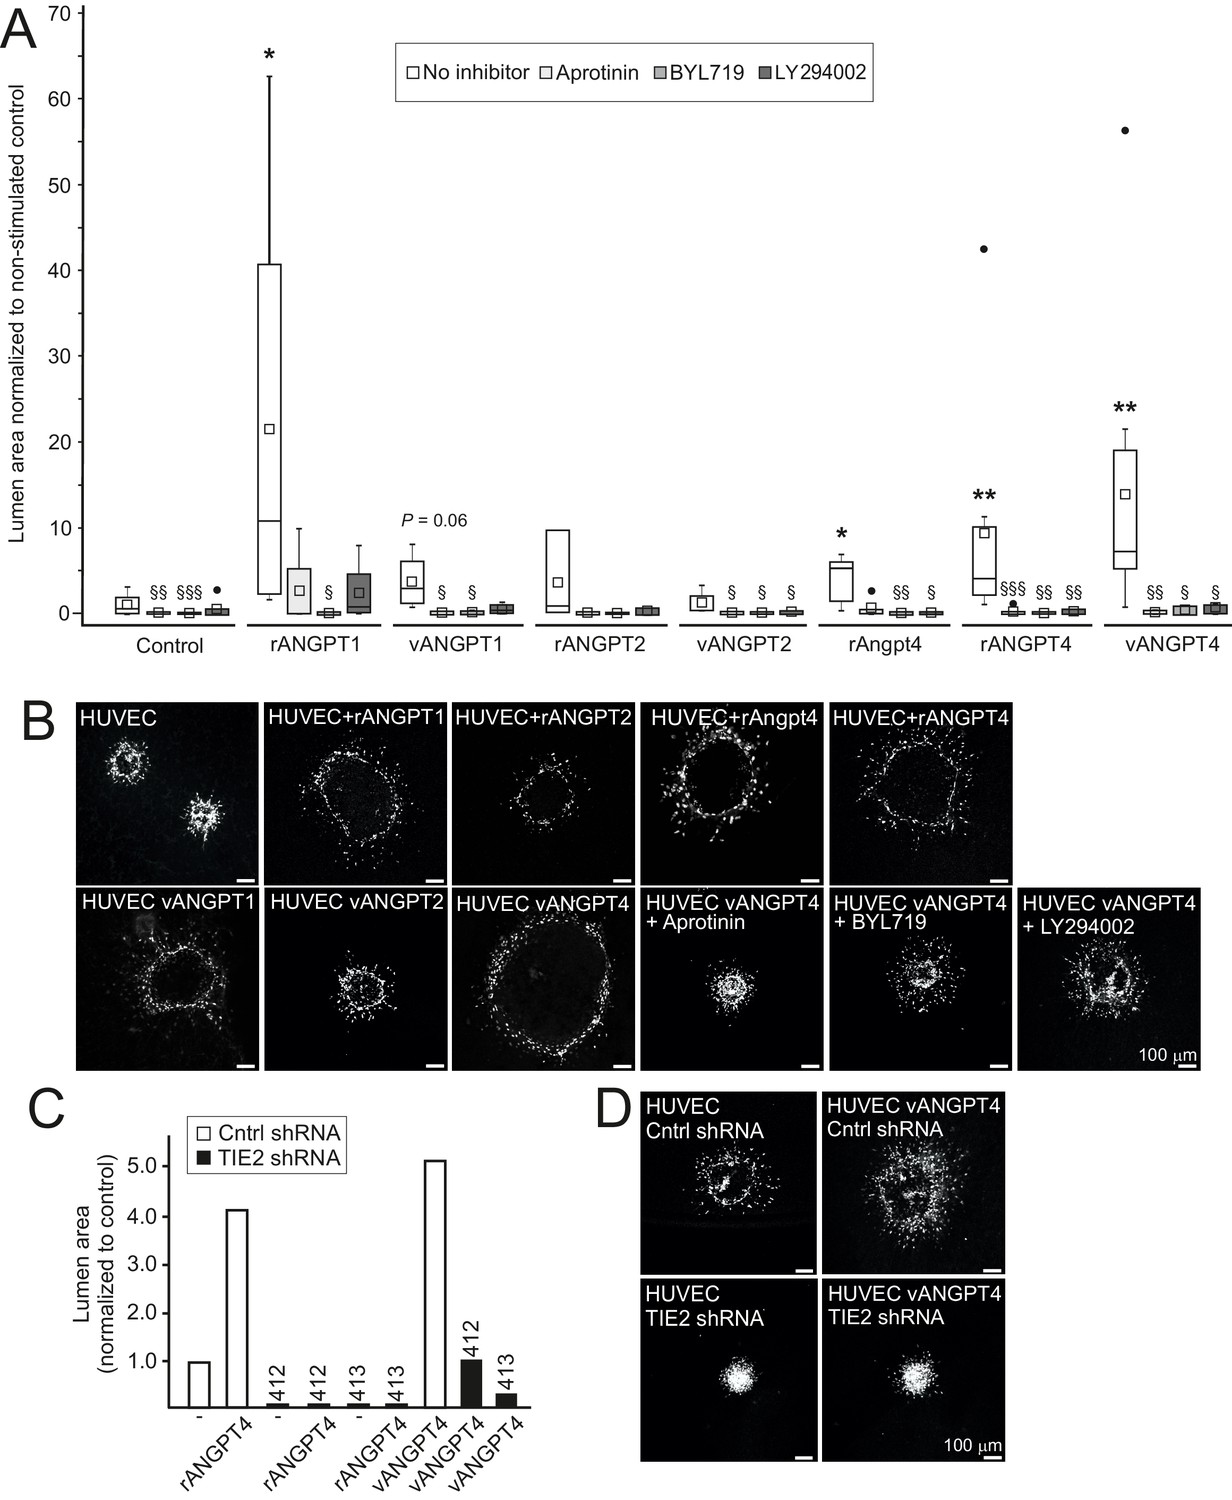
Angpt4 and ANGPT4 expand endothelial lumen structure via TIE2/PI3K/serine protease pathway.
In vitro studies were performed by using mouse Angpt4 and human ANGPT4 purified recombinant proteins. (A) Lumen formation in HUVEC spheroids in fibrin gel angiogenesis model. Spheroids were stimulated with indicated recombinant (r) or virally produced (v) angiopoietins in the presence or absence of inhibitors indicated. Median (line), average (square), 75th quartile (box), 5th and 95th percentile (whiskers), outliers (•). **p<0.01, *p<0.05 stimulation vs. control, §§§p<0.001, §§p<0.01 and §p<0.05 inhibitor vs. no inhibitor in Kruskal–Wallis non-parametric ANOVA followed by Mann–Whitney U-test, n = 3 to 12 experiments. (B) Representative images of spheroids stimulated with angiopoietins and in the presence of inhibitors. (C) Lumen area in control or lentiviral TIE2 shRNA construct (412 or 413) treated HUVEC spheroids. Area of control shRNA lumen was set to 1. (D) Representative images of shRNA-treated spheroids.
Figure 8—figure supplement 1
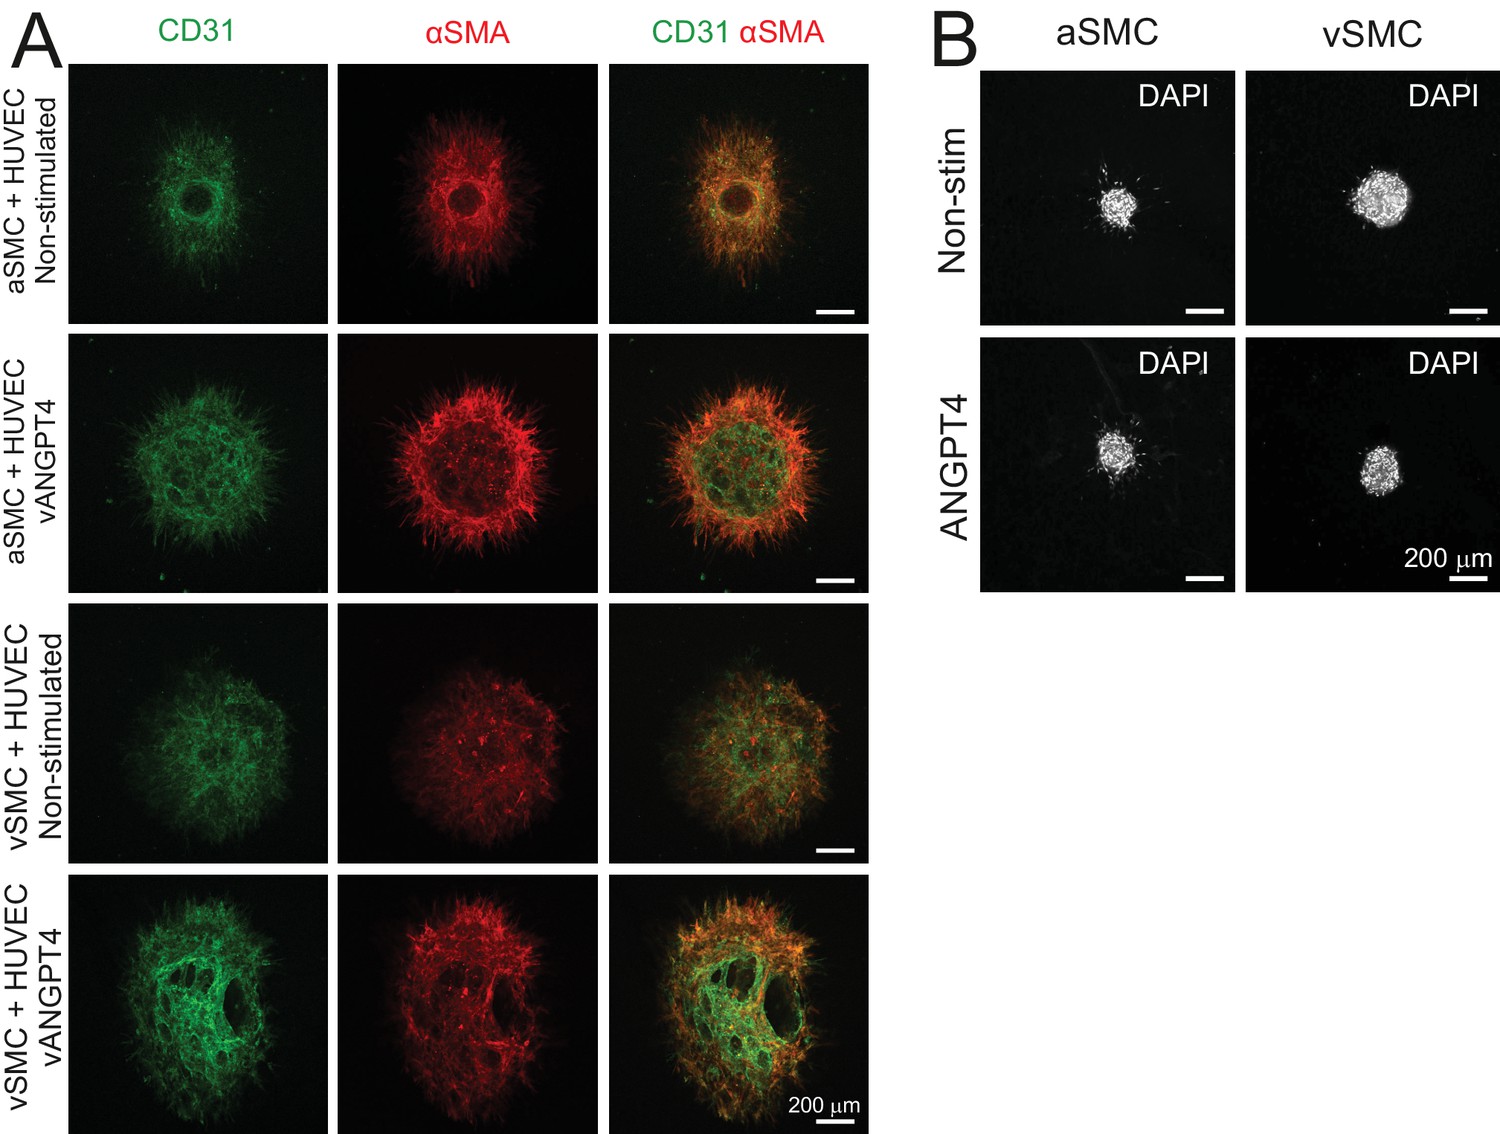
Smooth muscle cells do not enhance responsiveness to ANGPT4 in EC co-cultures nor respond directly to ANGPT4.
(A) Co-culture spheroids of arterial (a) and venous (v) SMC and HUVECs or HUVECs virally (v) transduced with ANGPT4 were stained against CD31 and αSMA indicating ECs and SMCs, respectively. Presence of SMCs does not increase lumen formation of spheroids. (B) aSMC and vSMC spheroids alone do not form lumen structure in the presence of purified recombinant ANGPT4.
Figure 9 with 2 supplements
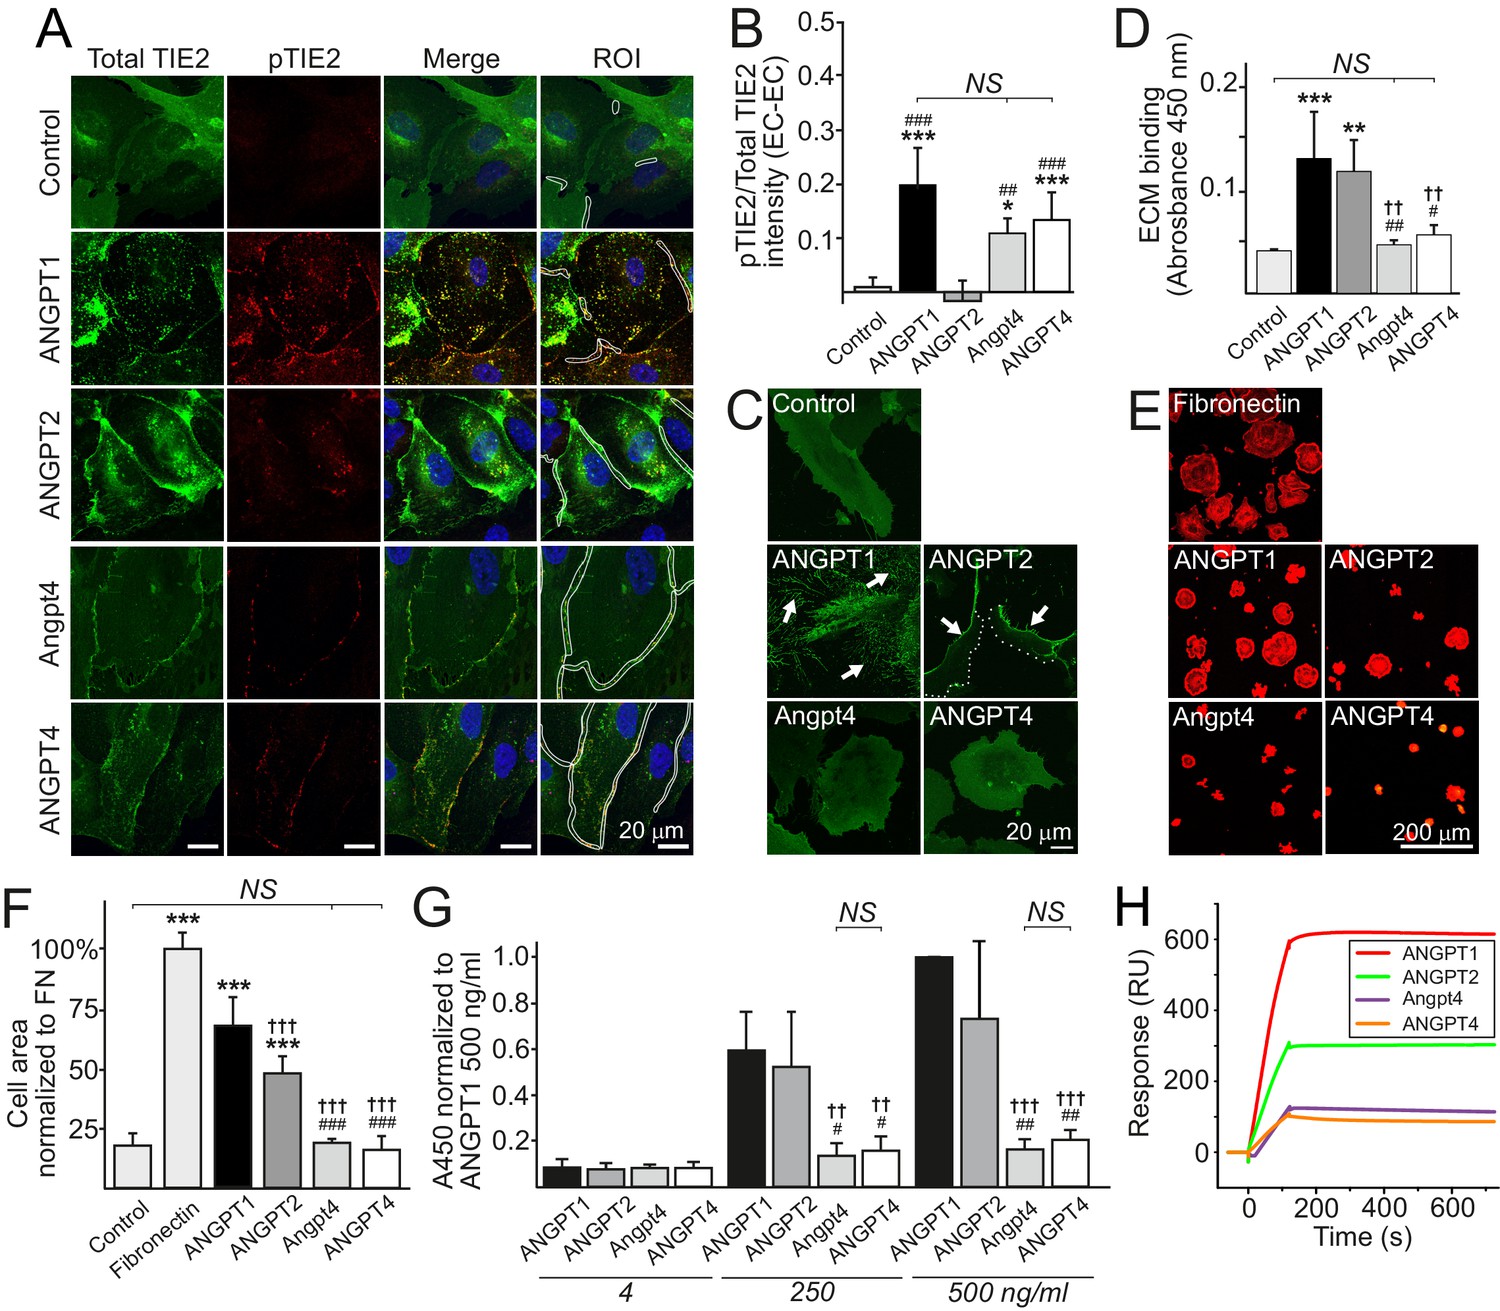
Ligand-specific and redundant functions of Angpt4 and ANGPT4.
(A) Angiopoietin-induced TIE2 translocation and activation in cell–cell junctions. TIE2-WT HUVECs were left non-stimulated (control) or stimulated with recombinant angiopoietins as indicated for 1 hr, fixed, and stained for total TIE2 (green), phosphorylated TIE2 (pTIE2, red) and nuclei (DAPI, blue). White cropping indicates examples of ROIs (sites where cell contacts occurred based on microscopic examination) for TIE2 and pTIE2 intensity measurement from randomly selected cells. (B) Quantification of TIE2 activation (pTIE2/total TIE2) in cell–cell junctions (n = 2 to 7 stimulations, total 330 to 915 cell junctions/stimulation were measured). (C) Sparse TIE2-GFP HUVECs were stimulated with angiopoietins overnight, fixed and imaged. In ANGPT1-stimulated cells, majority of TIE2-GFP is ECM bound (arrows). ANGPT2 promoted TIE2 translocation to the retracting cell edges (arrows) and less in ECM (dotted line indicates leading edge of the cell). Angpt4 and ANGPT4 did not induce long-term effect on TIE2 clustering and translocation into ECM. (D) Angiopoietin binding to acellularized ECM fraction from cultured HUVECs (n = 4 run in triplicate). (E) TIE2-WT HUVECs spreading on fibronectin, ANGPT1, ANGPT2, Angpt4 or ANGPT4. Cells were let to spread on coated coverslips for 1 hr and stained for actin. Quantification of image data is shown in (F). Cell area was normalized to fibronectin (FN) (n = 3 to 9 experiments, 333 to 1778 cells per coating were analyzed). (G) Angiopoietin-TIE2 binding affinity measured by ELISA. ANGPT1 binding to TIE2 (250 ng/ml) was set to one at ANGPT1 concentration 500 ng/ml (n = 4 experiments). (H) Angiopoietin binding to TIE2 in surface plasmon resonance assay. Human purified TIE2-Fc was immobilized on CM5 chip, and angiopoietins were injected onto the TIE2-Fc surface at 100 nM concentration. Mean ±SD, ANOVA followed by the Bonferroni post hoc test. ***p<0.001, **p<0.01, *p<0.05 vs. control; †††p<0.001, ††p<0.01 vs. ANGPT1; ###p<0.001, ##p<0.01, #p<0.05 vs. ANGPT2.
Figure 9—figure supplement 1
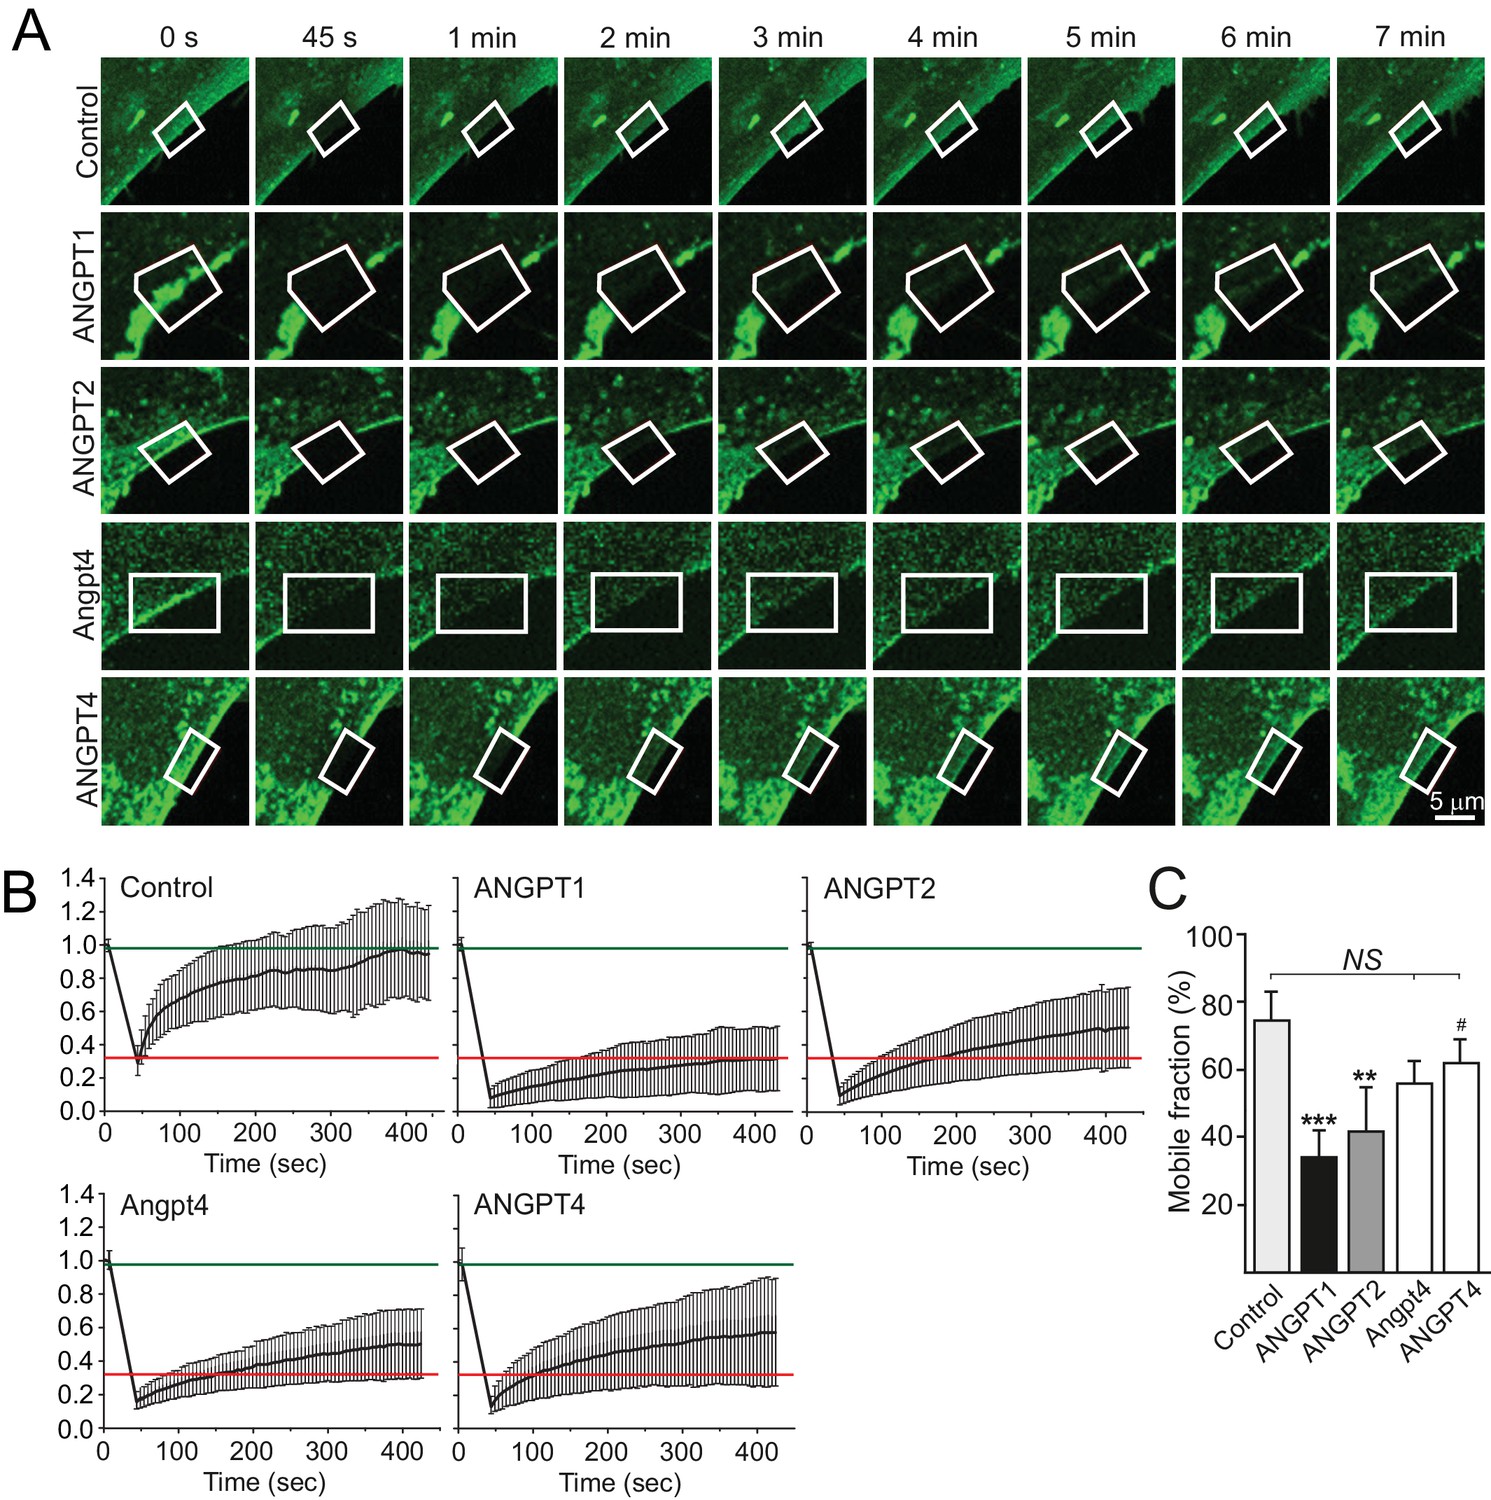
Fluorescence recovery of TIE2/angiopoietin complexes in FRAP analysis.
(A) TIE2-GFP HUVECs were stimulated as indicated, ROIs (framed) at the retracting edges at the cell–ECM interface were photobleached and fluorescence recovery was followed every 5 s. Time point 0 s represents the prebleach situation, while 45 s shows the ROI after bleaching. (B) Normalized signal intensities from the fluorescence recovery follow-up. The curves following the normalized fluorescence intensity versus time (sec) in the ROI areas are shown for control and angiopoietin stimulated samples. Red and green lines indicate average TIE2/ANGPT1 (slowest fluorescence recovery) and control (fastest fluorescence recovery) values, respectively. (C) The mobile fraction was determined from the plateau point of the fluorescence recovery. n = 3 to 5 stimulations, 82 to 123 ROIs per stimulation were measured in each experiment. Mean ±SD, ANOVA followed by the Bonferroni post hoc test. ***p<0.001, **p<0.01 vs control; #p<0.05 vs ANGPT1.
Figure 9—figure supplement 2
SDS polyacrylamide gel electrophoresis of recombinant purified angiopoietins used in this study.
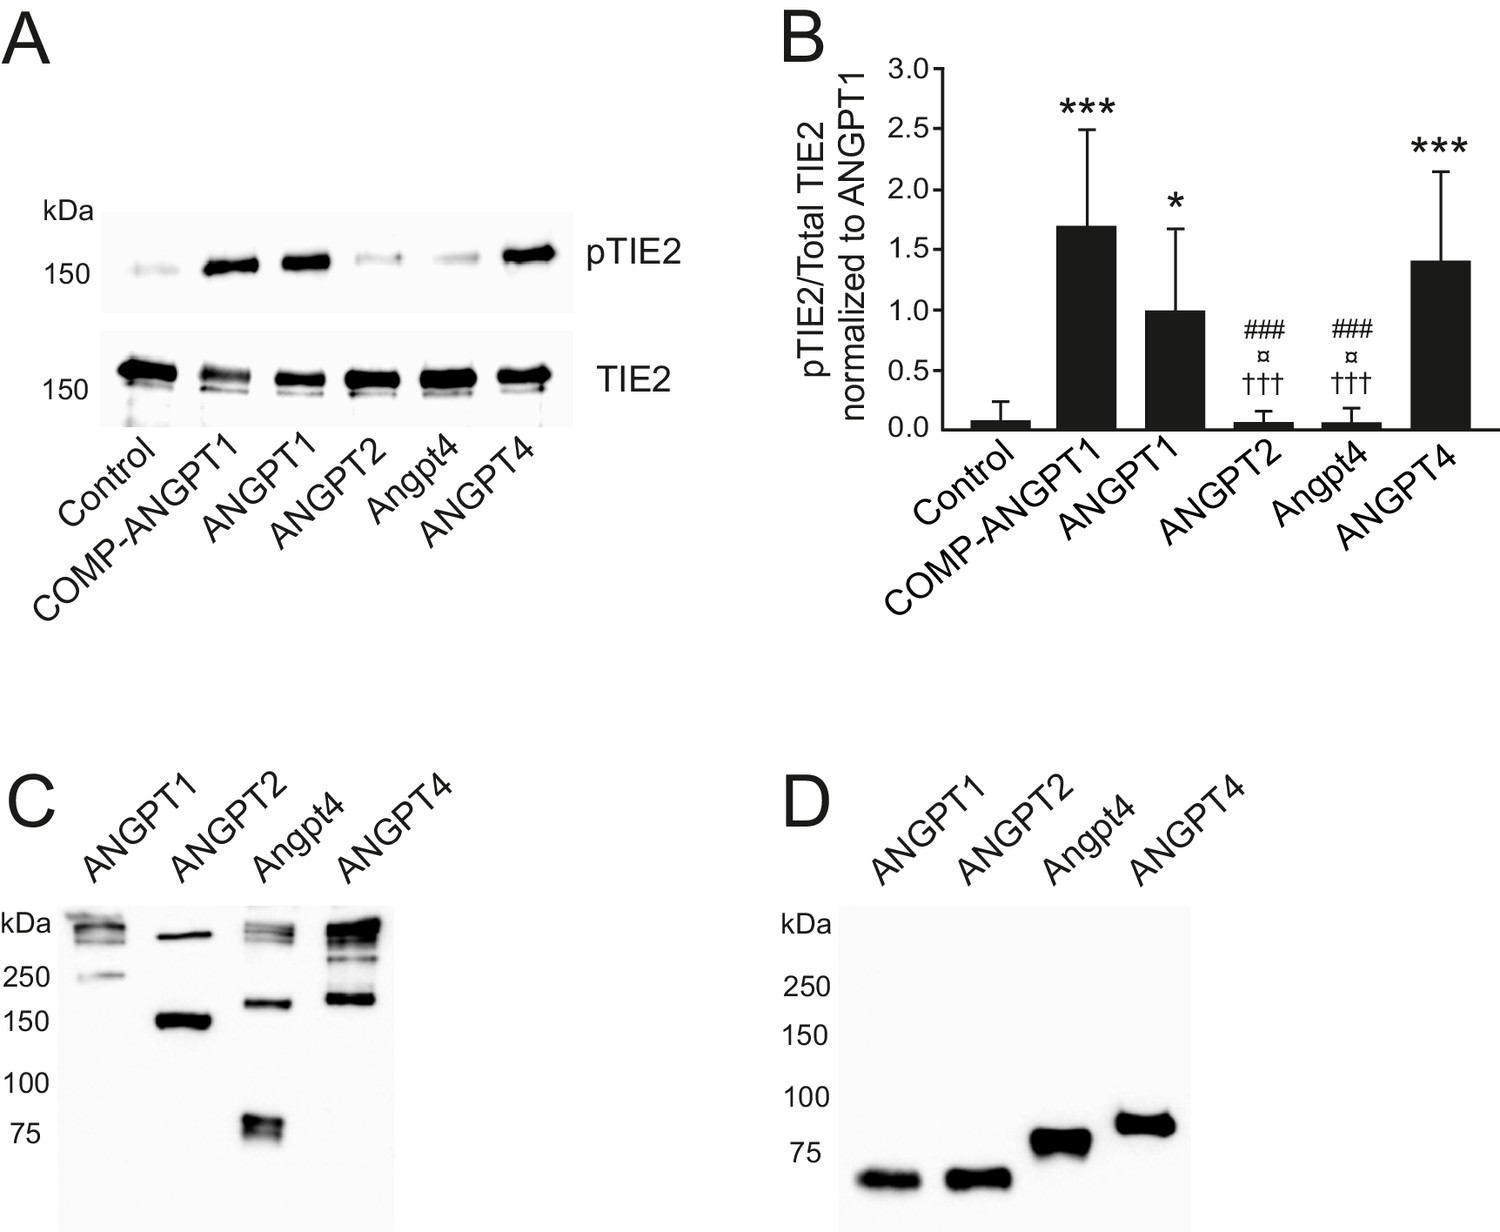
(A-B) TIE2 was immunoprecipitated and analyzed by western blotting using anti-phosphotyrosine (pTIE2) and anti-TIE2 antibodies. (A) Representative images of pTIE2 and total TIE2 protein levels in cell lysates of TIE2-WT HUVECs after 1 hr angiopoietin stimulation. (B) Quantification of the data (n = 6 independent experiments). ANGPT1 stimulated pTIE2/TIE2 ratio was set to 1. Mean ±SD, ANOVA followed by the Bonferroni post-hoc test, ***p<0.001, *p<0.05 vs. control; †††p<0.001 vs. COMP-ANGPT1; ¤p<0.05 vs ANGPT1; ###p<0.001 vs. ANGPT4. (C–D) Oligomerization and multimerization states of angiopoietin ligands under non-reducing (C) and reducing (D) conditions. ANGPT1 forms various-sized large oligomeric/multimeric complexes, ANGPT2 runs predominantly as disulfide-linked dimers, Angpt4 shows monomeric, dimeric and some larger complexes, and ANGPT4 forms dimeric and higher oligomeric/multimeric ligand complexes.
Figure 10 with 1 supplement
Outside of retina, Angpt4 is expressed in muscular arteries in adult mice.
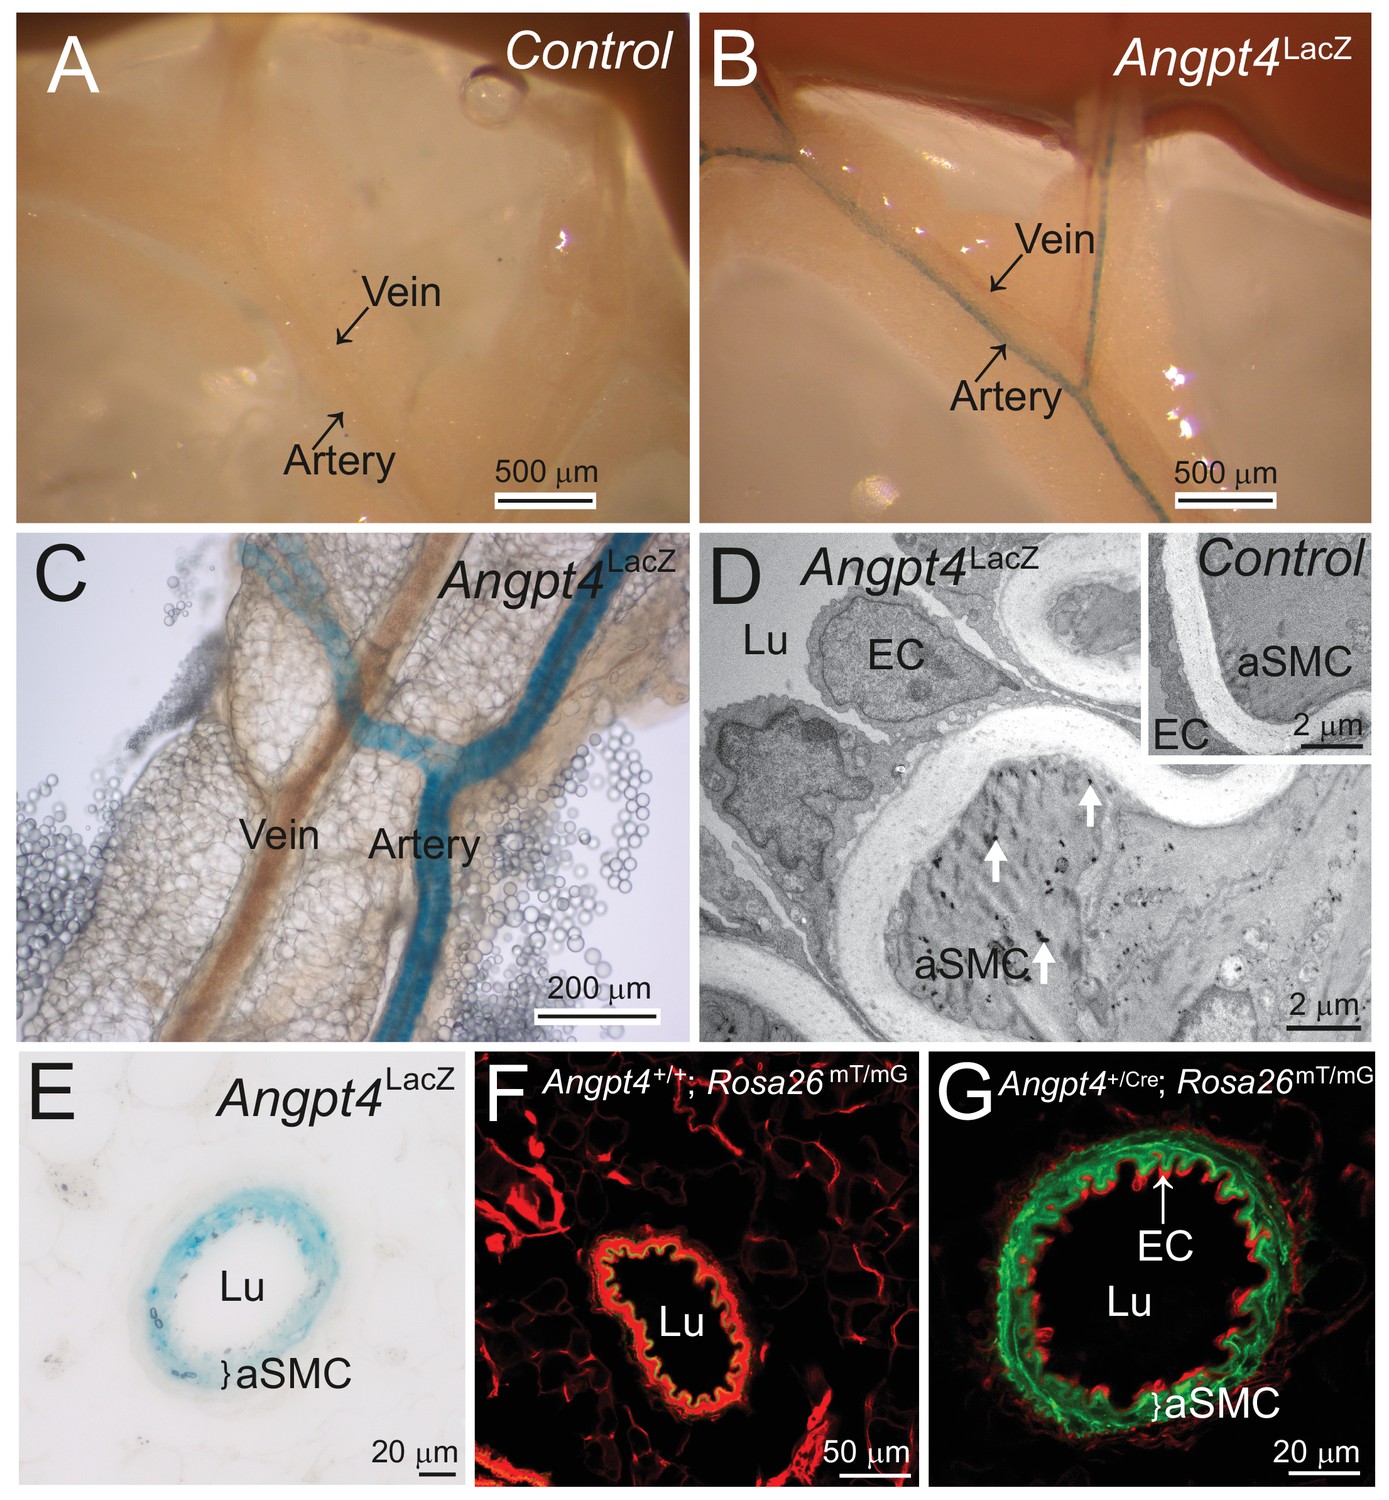
(A) LacZ gene negative control. (B–C) Whole mount preparations of small intestine mesentery showed X-gal staining in Angpt4LacZ mice arteries, but not in veins. (D) TEM analysis of Angpt4LacZ mesentery artery showed X-gal staining as electron-dense precipitation (arrows) inside arterial smooth muscle cell (aSMC) in tunica media layer, whereas the ECs and SMCs in LacZ gene negative control (insert) did not contain precipitate. Lu, vessel lumen. (E) X-gal staining in tunica media layer (bracket) in the cross section of Angpt4LacZ mesenteric artery. (F) Cross-section of mesenteric artery from negative control Angpt4+/+; Rosa26mTmG. Elastin shows green autofluorescence. (G) Angpt4Cre; Rosa26mTmG fate mapping mouse line showed GFP signal in tunica media layer (bracket), whereas ECs were negative.
Figure 10—figure supplement 1
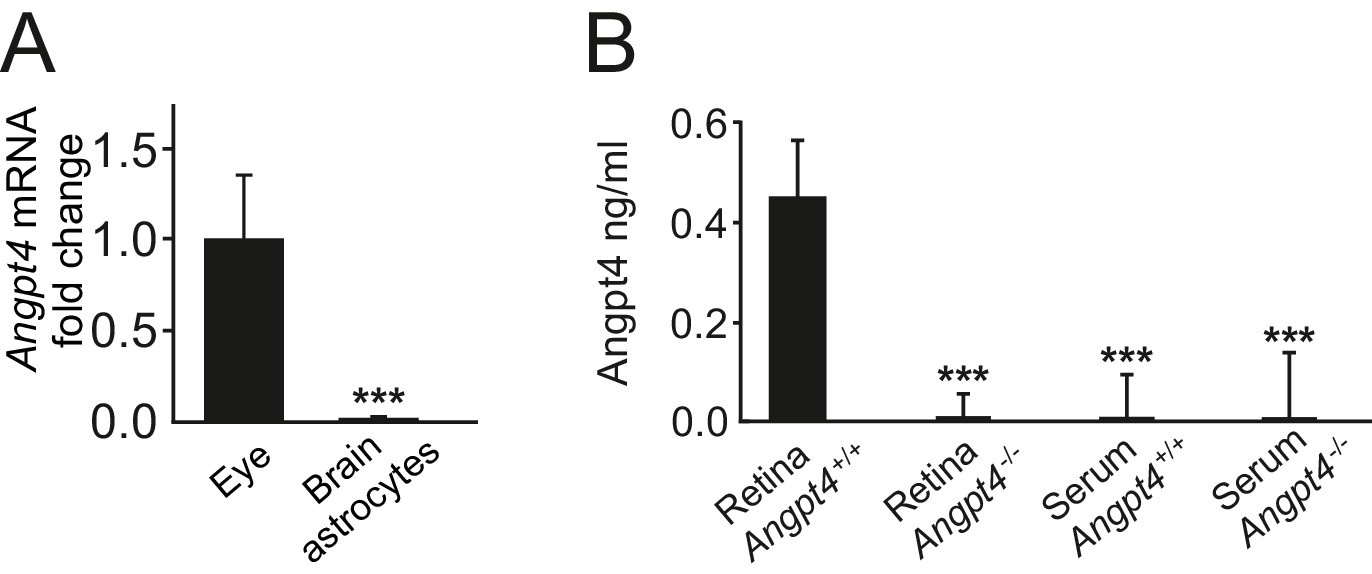
Angpt4 is not present in serum or expressed in brain astrocytes.
(A) Angpt4 mRNA is not expressed in astrocytes isolated from mice brains (n = 3) when compared to WT eyes (n = 9) in relation to β-actin. Fold change was calculated from Ct values. Mean ±SD, ***p<0.001 vs. WT eye. (B) Angpt4 ELISA indicated the presence of Angpt4 in P12 retina preparation but not in serum. Angpt4 is not present in the retinas or in serum in negative controls (Angpt4-/- mice). Retina Angpt4+/+ (n = 8 mice), retina Angpt4-/- (n = 2 mice), serum Angpt4+/+ (n = 10 mice), serum Angpt4-/- (n = 5 mice). Mean ±SD, ANOVA followed by the Bonferroni post-hoc test, ***p<0.001 vs. retina Angpt4+/+.
Figure 11
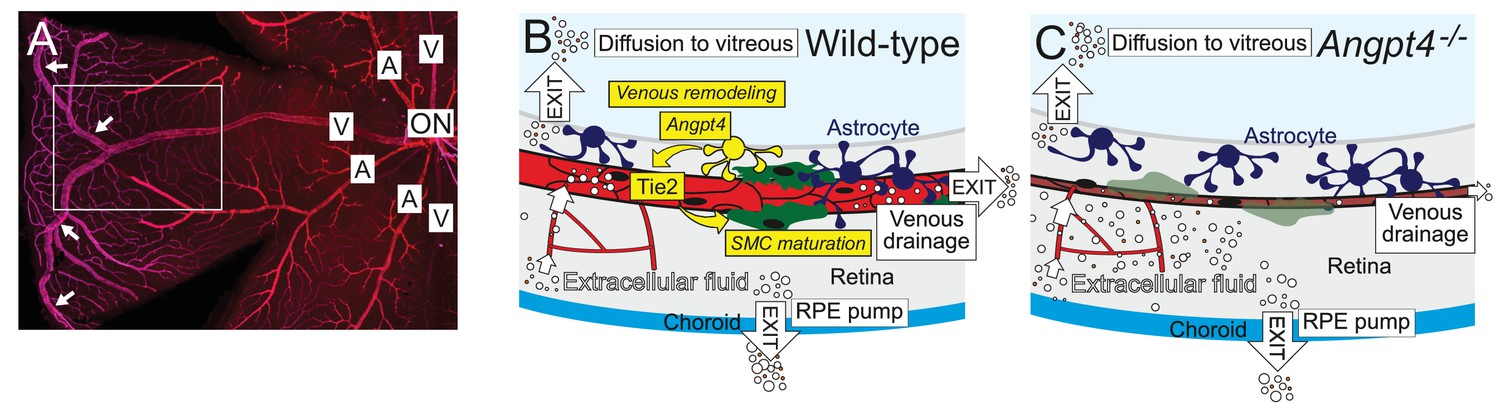
Graphical summary.
(A) Whole mount staining of the superficial vascular plexus of adult mouse retina, one quarter is shown. In mouse, typically two large veins extend to the far periphery of the retina to form an annular vessel structure (arrows), where peripheral capillaries drain. A, artery; V, vein; ON, optic nerve head. Framed area is represented in (B) and (C). (B) Angpt4 is expressed in a specific subpopulation of hypoxia-regulated astrocytes that are enriched in the peripheral retina and locate close to the developing veins to promote venous remodeling and SMC maturation via endothelial cell-expressed Tie2. Potential fluid removal mechanisms from neural retina include retinal pigment epithelial (RPE) cell pumps, venous drainage and diffusion to vitreous (Daruich et al., 2018). (C) Angpt4 deficiency leads to defective circumferential growth and SMC maturation in early postnatal development that secondarily leads to neuronal cell damage due to impaired venous drainage. Tie2 signaling has a special importance in venous development (Chu et al., 2016; Vikkula et al., 1996), and in the peripheral retina, expression of competitive Angpt1 ligand is low that may contribute to the localized, vessel-type specific phenotype in Angpt4 deficient mice.
Tables
Key resources table
| Reagent type (species) or resource | Designation | Source or reference | Identifiers | Additional information |
|---|---|---|---|---|
| Strain, strain background (Mus musculus, C57BL/6N) | WT | Charles River Laboratories | ||
| Strain, strain background (Mus musculus, C57BL/6N) | Angpt4LacZ | This Paper | Generation described in detail in Materials and methods | |
| Strain, strain background (Mus musculus, C57BL/6N) | Angpt4Cre | This Paper | Generation describedin detail in Materials and methods | |
| Strain, strain background (Mus musculus, C57BL/6N) | Angpt4Cre; Rosa26mTmG | This Paper | Generation describedin detail in Materials and methods | |
| Strain, strain background (Mus musculus, C57BL/6N) | Egln1loxP | Other | A gift from Prof. Johanna Myllyharju, University of Oulu | |
| Cell line (human) | Human umbilical vein endothelial cells (HUVEC) | Promocell | C-12203 | |
| Cell line (human) | TIE2-WT HUVEC | Saharinen et al. (2008) | ||
| Cell line (human) | TIE2-GFP HUVEC | Saharinen et al. (2008) | ||
| Cell line (human) | HUVEC vANGPT1 | This Paper | Generation described in detail in Materials and methods | |
| Cell line (human) | HUVEC vANGPT2 | This Paper | Generation describedin detail in Materials and methods | |
| Cell line (human) | HUVEC vANGPT4 | This Paper | Generation described in detail in Materials and methods | |
| Cell line (human) | Human umbilical artery smooth muscle cells | Cell Applications | 252–05 n | |
| Cell line (human) | Human umbilical vein smooth muscle cells | Cell Applications | 250–05 n | |
| Cell line (human) | Human fibroblasts | ATCC | CCL-210; RRID:CVCL_2382 | |
| Antibody | αSMA, alpha smooth muscle cell, Cy3-conjugated (Mouse monoclonal) | Sigma-Aldrich | C6198; RRID:AB_476856 | IF (1:300) |
| Antibody | IB4, biotinylated isolectin B4 | Vector laboratories | B-1205; RRID:AB_2314661 | IF (1:300) |
| Antibody | ColIV (rabbit polyclonal) | Merck Millipore | AB756P; RRID:AB_2276457 | IF (1:300) |
| Antibody | GFAP (rabbit polyclonal) | Abcam | ab7260; RRID:AB_305808 | IF (1:300) |
| Antibody | Pimonidazole (rabbit antisera) | Hypoxyprobe | Pab2627; RRID:AB_1576904 | IF (1:300) |
| Antibody | SM22alpha (goat polyclonal) | Abcam | ab10135; RRID:AB_2255631 | IF (1:300) |
| Antibody | Tie2, clone Ab33 (mouse monoclonal) | Merck Millipore | 05–584; RRID:AB_309820 | IF (1:100); WB (1:1000) |
| Antibody | Tie2 (rabbit polyclonal) | Santa Cruz Biotechnology | sc-324; RRID:AB_631102 | WB (1:1000) |
| Antibody | pTie2 (Tyr992) (rabbit polyclonal) | Cell Signaling | 4221S; RRID:AB_2203198 | IF (1:100); WB (1:1000) |
| Antibody | phospho-tyrosine, clone 4G10 (mouse monoclonal) | Merck Millipore | 05–321; RRID:AB_309678 | WB (1:1000) |
| Antibody | penta-HIS (mouse monoclonal) | Qiagen | 34660; RRID:AB_2619735 | WB (1:1000) |
| Antibody | TRITC-phalloidin | Sigma-Aldrich | P1951; RRID:AB_2315148 | IF (1:2000) |
| Antibody | Alexa Fluor 488, streptavidin-conjugated | Jackson ImmunoResearch | 016-540-084; RRID:AB_2337249 | IF (1:300) |
| Antibody | Alexa Fluor 488, Donkey anti-rabbit | Jackson ImmunoResearch | 711-545-152; RRID:AB_2313584 | IF (1:300) |
| Antibody | Alexa Fluor 488, Donkey anti-mouse | Jackson ImmunoResearch | 715-545-151; RRID:AB_2341099 | IF (1:300) |
| Antibody | Alexa Fluor 647, Goat anti-rabbit | Jackson ImmunoResearch | 111-605-045; RRID:AB_2338075 | IF (1:300) |
| Antibody | Cy3, Donkey anti-goat | Jackson ImmunoResearch | 705-165-147; RRID:AB_2307351 | IF (1:300) |
| Antibody | Peroxidase-conjugated goat anti-mouse | Jackson ImmunoResearch | 115-035-003; RRID:AB_10015289 | WB (1:10000) |
| Antibody | Peroxidase-conjugated goat anti-rabbit | Jackson ImmunoResearch | 111-035-003; RRID:AB_2313567 | WB (1:10000) |
| Antibody | Anti-Digoxigenin-AP, Fab Fragments | Roche | 11093274910; RRID:AB_514497 | ISH (1:1500) |
| Antibody | Protein A/G PLUS-Agarose | Santa Cruz biotechnology | sc-2003; RRID:AB_10201400 | |
| Sequence- based reagent | qPCR primers | Sigma-Aldrich | Supplementary file 1 | |
| Sequence- based reagent | mouse Angpt1 in situ RNA Antisense probe | This Paper | Supplementary file 2; Generation described in detail in Materials and methods | |
| Sequence- based reagent | mouse Angpt2 in situ RNA Antisense probe | This Paper | Supplementary file 2; Generation described in detail in Materials and methods | |
| Sequence- based reagent | mouse Angpt4 in situ RNA Antisense probe | This Paper | Supplementary file 2; Generation described in detail in Materials and methods | |
| Sequence- based reagent | mouse Tie2 in situ RNA Antisense probe | This Paper | Supplementary file 2; Generation described in detail in Materials and methods | |
| Sequence- based reagent | mouse Angpt1 in situ RNA Sense probe | This Paper | Supplementary file 2; Generation described in detail in Materials and methods | |
| Sequence- based reagent | mouse Angpt2 in situ RNA Sense probe | This Paper | Supplementary file 2; Generation described in detail in Materials and methods | |
| Sequence- based reagent | mouse Angpt4 in situ RNA Sense probe | This Paper | Supplementary file 2; Generation described in detail in Materials and methods | |
| Sequence- based reagent | mouse Tie2 in situ RNA Sense probe | This Paper | Supplementary file 2; Generation described in detail in Materials and methods | |
| Sequence- based reagent | Tie2-412 shRNA | The RNAi consortium | http://www.broadinstitute.org/rnai/trc | |
| Sequence- based reagent | Tie2-413 shRNA | The RNAi consortium | http://www.broadinstitute.org/rnai/trc | |
| Sequence- based reagent | PLKO.1 shRNA | The RNAi consortium | http://www.broadinstitute.org/rnai/trc | |
| Peptide, recombinant protein | ANGPT1 | R & D Systems | 923-AN-025 | |
| Peptide, recombinant protein | COMP-ANGPT1 | Other | A gift from Prof. Gou Young Koh, KAIST | |
| Peptide, recombinant protein | ANGPT2 | R & D Systems | 623-AN-025 | |
| Peptide, recombinant protein | Angpt4 | R & D Systems | 738-AN-025 | |
| Peptide, recombinant protein | ANGPT4 | R & D Systems | 964-AN-025 | |
| Commercial assay or kit | Mouse Angiopoietin-3 DuoSet ELISA | R & D Systems | DY738 | |
| Commercial assay or kit | RNeasy Mini Kit | Qiagen | 74104 | |
| Commercial assay or kit | Fibrous Tissue Mini Kit | Qiagen | 74704 | |
| Commercial assay or kit | Caspase-Glo 3/7 Assay | Promega | G8091 | |
| Commercial assay or kit | Cell proliferation ELISA, BrdU | Roche | 11647229001 | |
| Chemical compound, drug | pimonidazole | Hypoxyprobe | HP3-100Kit | |
| Chemical compound, drug | Evans blue | Sigma-Aldrich | E2129 | |
| Chemical compound, drug | Carboxylate-modified fluorescent beads | Invitrogen | F888 | |
| Chemical compound, drug | 5% fluorescein sodium salt | Sigma-Aldrich | F6377 | |
| Chemical compound, drug | Aprotinin | Sigma-Aldrich | A3428 | |
| Chemical compound, drug | BYL719 | LC Laboratories | A-4477 | |
| Chemical compound, drug | LY294002 | Selleck | S1105 | |
| Chemical compound, drug | Protease inhibitor | Sigma-Aldrich | P8340 | |
| Chemical compound, drug | Phosphatase inhibitor | Sigma-Aldrich | P5726 | |
| Chemical compound, drug | Tie2-Fc | R & D Systems | 313-TI | |
| Chemical compound, drug | NBT/BCIP stock solution | Roche | 11681451001 | |
| Software, algorithm | Olympus Fluoview Ver.3.0 Viewer | Olympus | RRID:SCR_014215 | |
| Software, algorithm | ZEN 2012 (blue edition) | Carl Zeiss | RRID:SCR_013672 | |
| Software, algorithm | Fiji (ImageJ) | Fiji | RRID:SCR_002285 | |
| Software, algorithm | Biacore T200 Evaluation Software, version 2.0 | Biacore | ||
| Software, algorithm | OriginPro 2018b | OriginLab Corporation | RRID:SCR_014212 | |
| Software, algorithm | Microsoft Excel 2016 | Microsoft Office | RRID:SCR_016137 | |
| Other | DAPI | Sigma- Aldrich | D9542 | IF (1:500) |
Additional files
-
Supplementary file 1
The sequences of primers used for quantitative RT-PCR.
- https://doi.org/10.7554/eLife.37776.029
-
Supplementary file 2
The sequences of primers used for generating in situ hybridization probe template plasmids.
- https://doi.org/10.7554/eLife.37776.030
-
Transparent reporting form
- https://doi.org/10.7554/eLife.37776.031
Download links
A two-part list of links to download the article, or parts of the article, in various formats.
Downloads (link to download the article as PDF)
Open citations (links to open the citations from this article in various online reference manager services)
Cite this article (links to download the citations from this article in formats compatible with various reference manager tools)
Angiopoietin-4-dependent venous maturation and fluid drainage in the peripheral retina
eLife 7:e37776.
https://doi.org/10.7554/eLife.37776


