Competition for synaptic building blocks shapes synaptic plasticity
- Frankfurt Institute for Advanced Studies, Germany
- Goethe University, Germany
- Max-Planck Institute for Brain Research, Germany
Figures
Figure 1
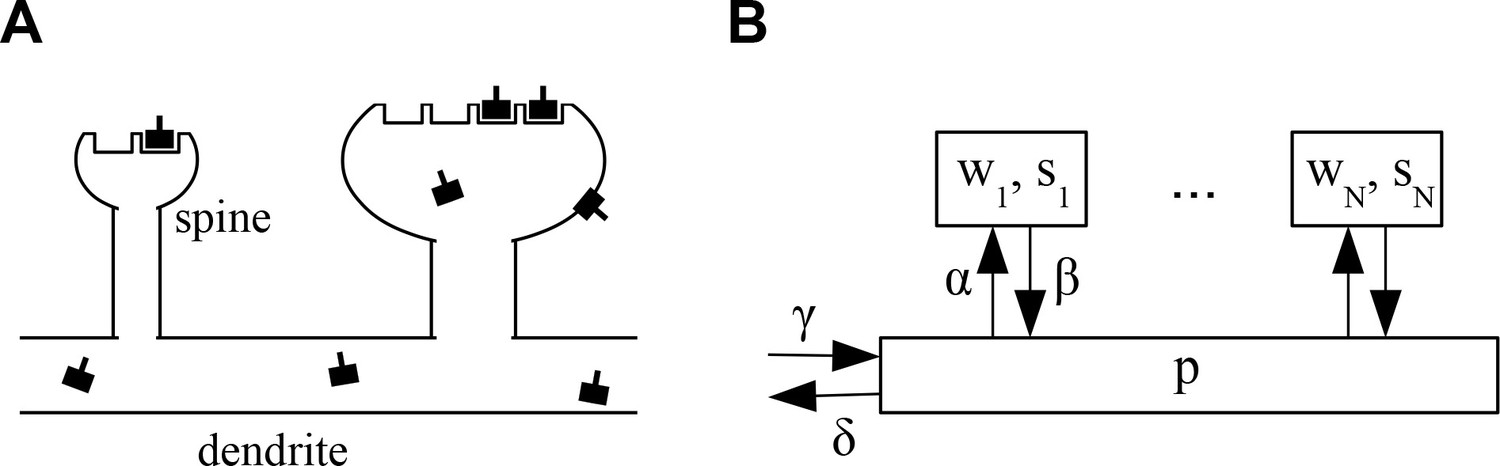
Architecture of the model.
(A) Sketch of the architecture of the model. Neurotransmitter receptors, e.g. AMPA receptors, are trafficked through the dendrite and bind to ‘slots’ inside of dendritic spines. The efficacy of a synapse is assumed to be proportional to the number of receptors attached to its slots. (B) Abstract description of the stochastic process indicating the rates at which receptors move in and out of slots in the synapses and the receptor pool in the dendrite. See text for details.
Figure 2

Synaptic filling fraction.
(A) Filling fraction as a function of the removal ratio . (B) Example empirical cumulative distribution functions (CDFs) of the numbers of receptors bound in individual synapses for fixed numbers of slots drawn from a lognormal distribution and three different filling fractions . The simulated piece of dendrite has 100 synapses and 100 receptor slots per synapse on average.
Figure 3
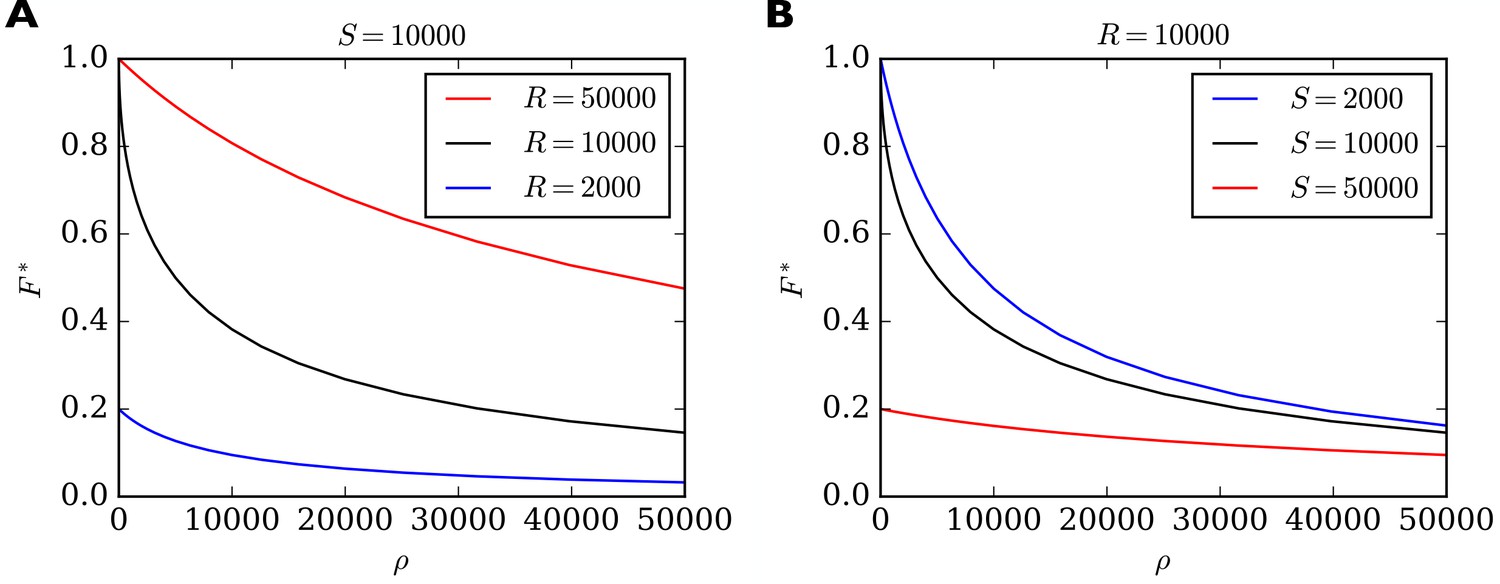
Filling fraction in the short-term approximation of constant receptor number as a function of the ratio of transition rates for different combinations of and .
(A) for a fixed number of slots and three different receptor numbers as a function of . (B) For fixed number of receptors and three different numbers of slots. Note that reacts particularly sensitively to changes in when is small and when (black curves). In this regime, small changes to, say, the rate of detaching from slots have a great influence on the filling fraction. In all cases, the shown solution is only transient. Eventually the filling fraction will assume its steady state value given by Equation 7.
Figure 4
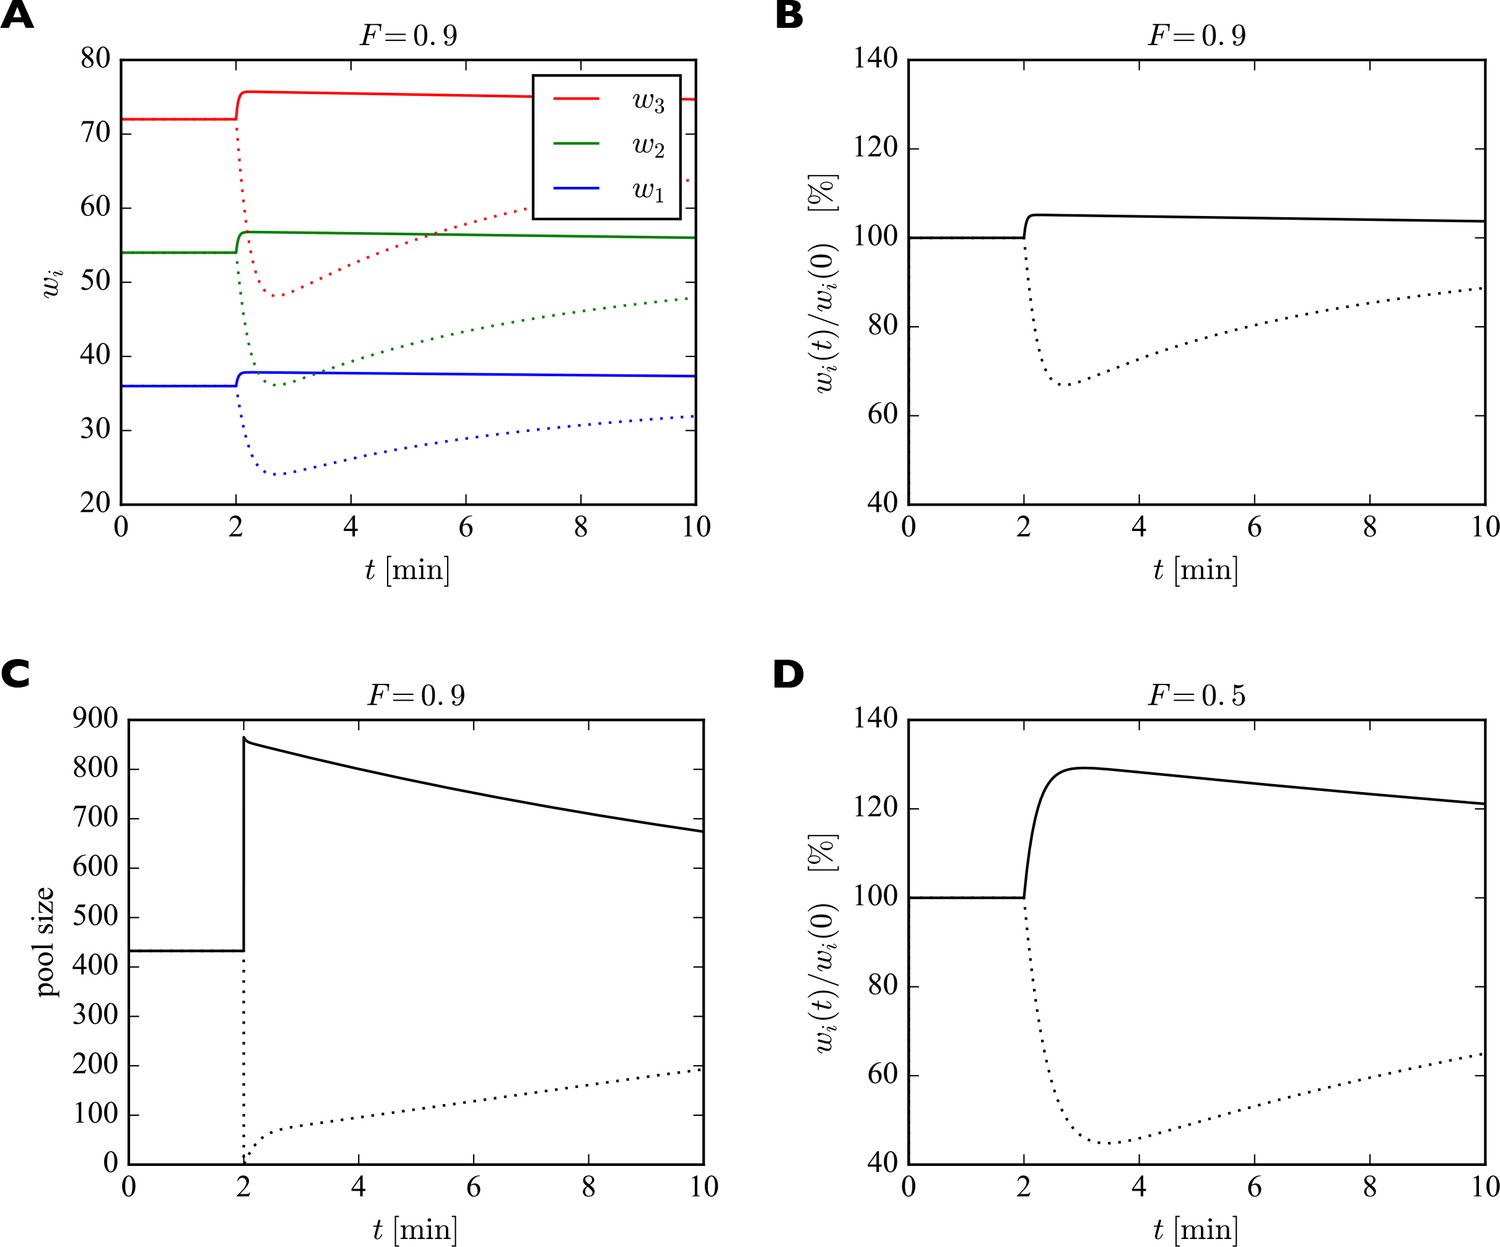
Effect of sudden change of the pool size on synaptic efficacies.
(A) After 2 min, the pool size is either doubled (solid curves) or set to zero (dotted curves). In response, the synaptic efficacies are scaled multiplicatively as receptors are redistributed through the system. Doubling the receptor pool has a relatively weak effect in this example, as the system starts with a high filling fraction of 0.9, meaning that 90% of the slots are already filled at the beginning and there are few empty slots to which the additional receptors can bind. (B) Same as A. but showing relative change in synaptic efficacies, which is identical for all synapses. (C) Change in pool size. After the sudden increase or decrease in pool size at 2 min, there is first a rapid relaxation of the pool size followed by a much slower return towards the original value. (D) Same as B. but for a filling fraction of . The smaller filling fraction leads to bigger relative changes of the synaptic efficacies. Parameters used were: , . The desired relative pool size was set to . The production rate and attachment rate were calculated according to Equation 12 and Equation 13, respectively.
Figure 5
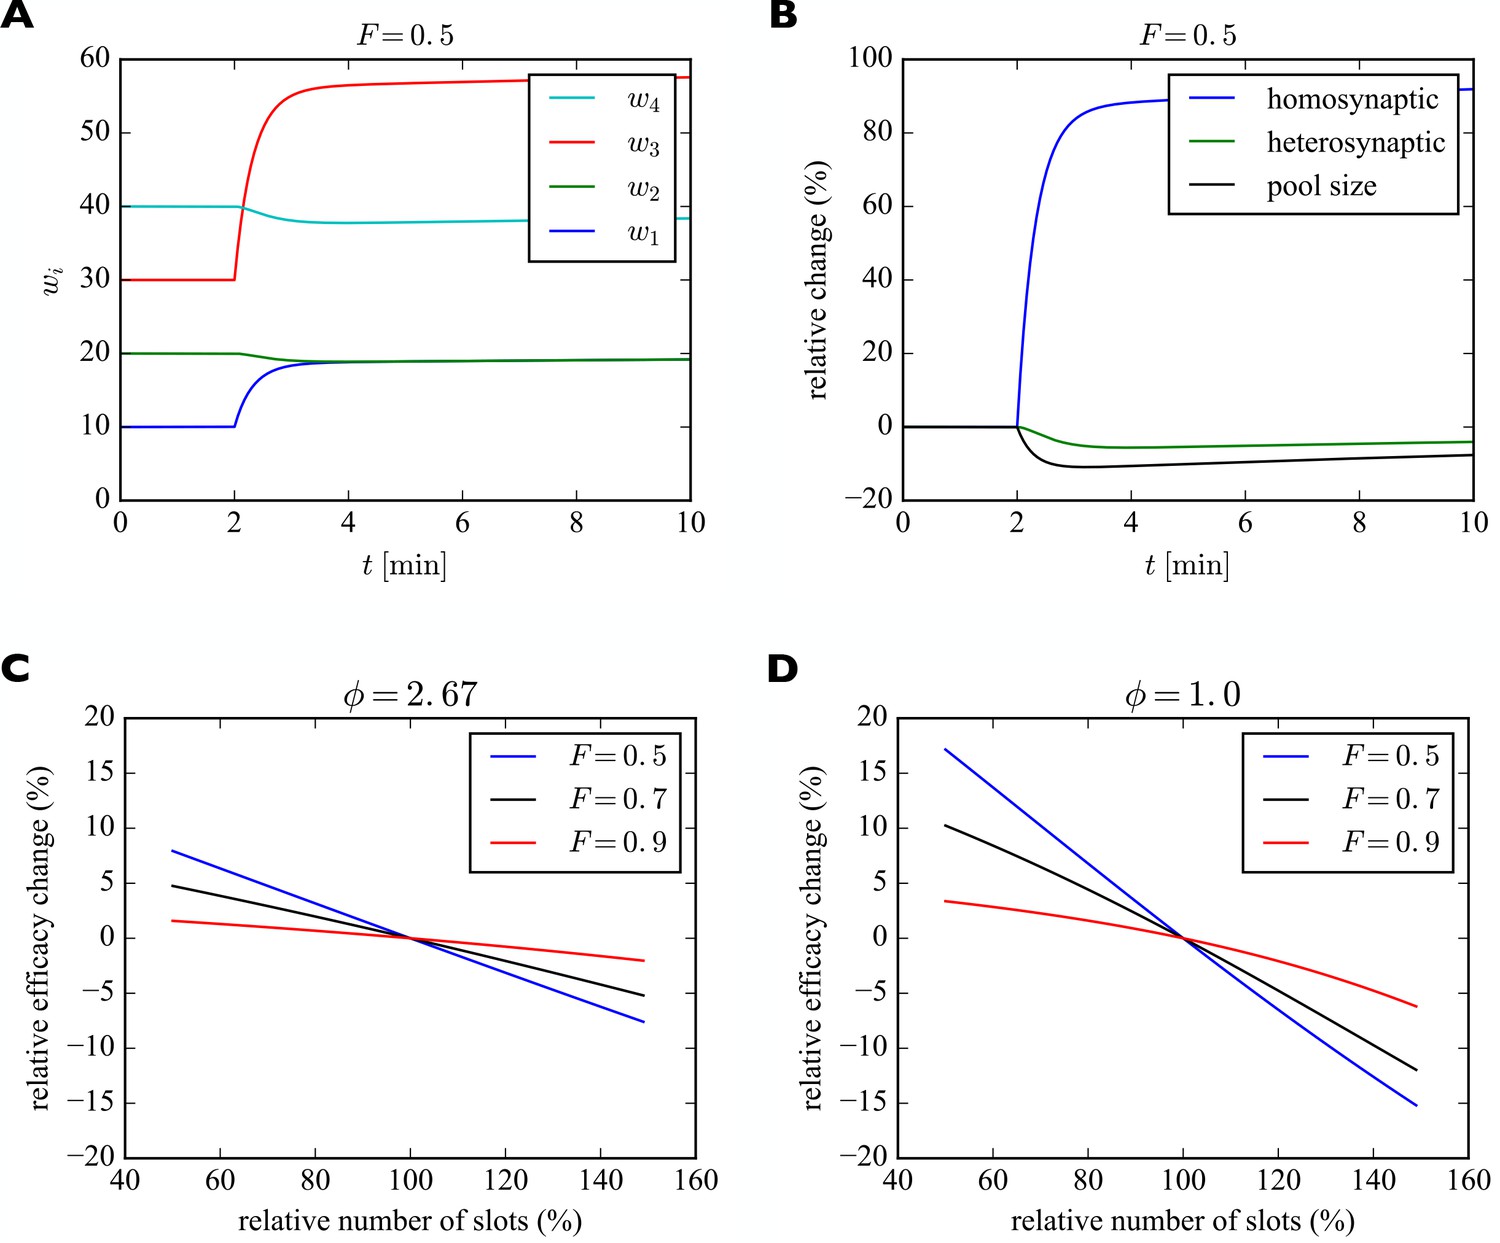
Induction of transient heterosynaptic plasticity.
(A) Illustration of transient heterosynaptic plasticity. After 2 min, the number of slots in synapses 1 and 3 is increased instantaneously. The system quickly reaches a new (transient) equilibrium, where the non-stimulated synapses 2 and 4 are slightly weakened. At the same time, the number of receptors in the pool is reduced. Parameters were: , . The filling fraction was set to and the relative pool size was set to . The production rate and attachment rate were calculated according to Equation 12 and Equation 13, respectively. (B) Time course of relative changes in synaptic efficacies due to homosynaptic and heterosynaptic plasticity for the experiment from A. (C) Approximate maximum relative change of synaptic efficacy due to heterosynaptic plasticity as a function of the number of receptor slots after homosynaptic plasticity induction for different filling fractions. (D) Same as C but for a smaller relative pool size of . See text for details.
Figure 6

Model of homosynaptic LTP accompanied by heterosynaptic LTD.
After 2 min, LTP is induced in synapses 2 and 3. This entails a transient synapse-specific change in the insertion rate of these synapses and a gradual change in their slot numbers. (A) Time course of relative change of receptor insertion rate and slot numbers of stimulated synapses undergoing homosynaptic LTP. (B) Time course of synaptic efficacies for a filling fraction of and a relative pool size of . Only a very small amount of heterosynaptic LTD can be observed in unstimulated synapses 1 and 4. (C) Relative change of synaptic efficacies and pool size due to homosynaptic LTP and heterosynaptic LTD in B as a function of time. (D) Same as C but for a smaller filling fraction of and a smaller relative pool size of . Note the smaller transient increase in efficacy of potentiated synapses (compare peaks of green curves in C and D) and the increased amount of heterosynaptic LTD (compare troughs of blue curves). (E, F) Maximum amount of homosynaptic LTP (E) and heterosynaptic LTD (F) as a function of relative pool size for three different filling fractions.
Figure 7
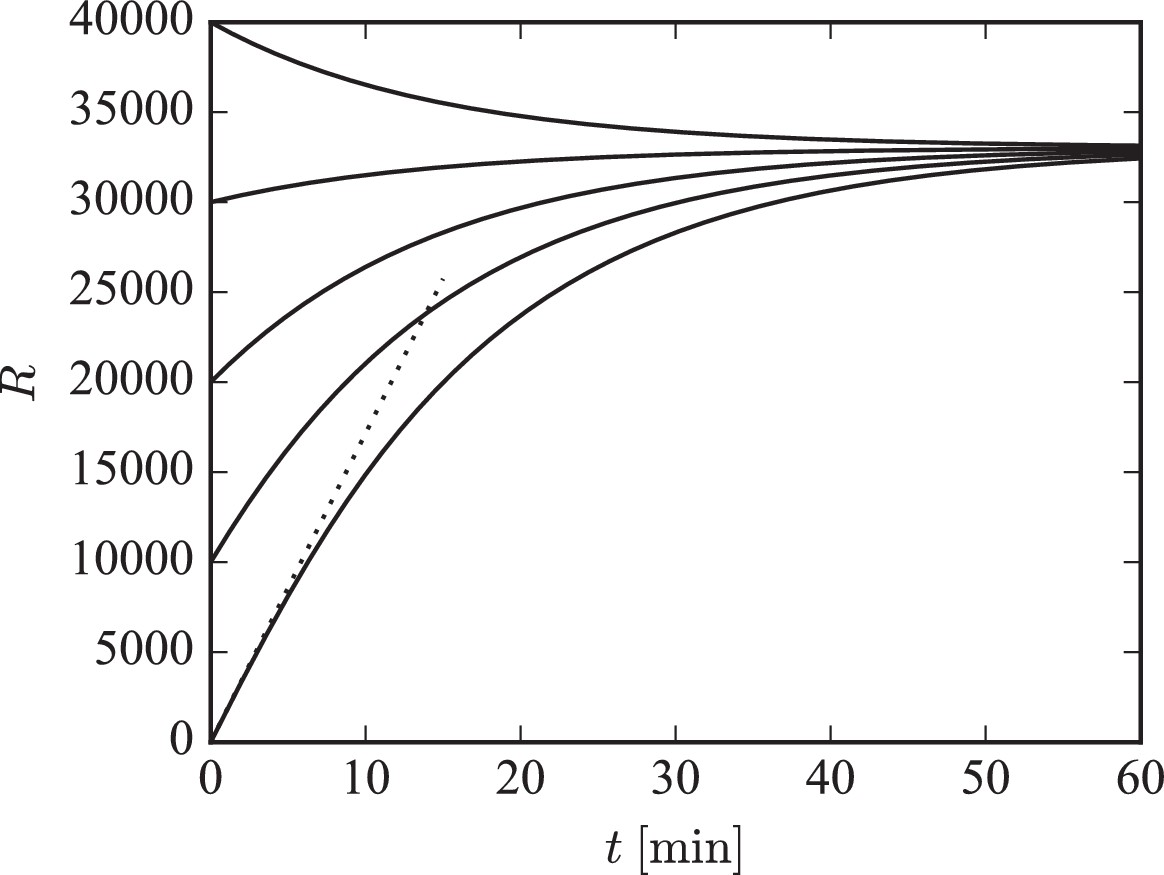
Illustration of long-term behavior under the separation of time scales assumption.
Parameters were: , . The desired relative pool size was set to and the desired filling fraction to . The production rate and attachment rate were calculated according to Equation 12 and Equation 13, respectively. The steady-state total number of receptors in this example is given by .
Figure 8
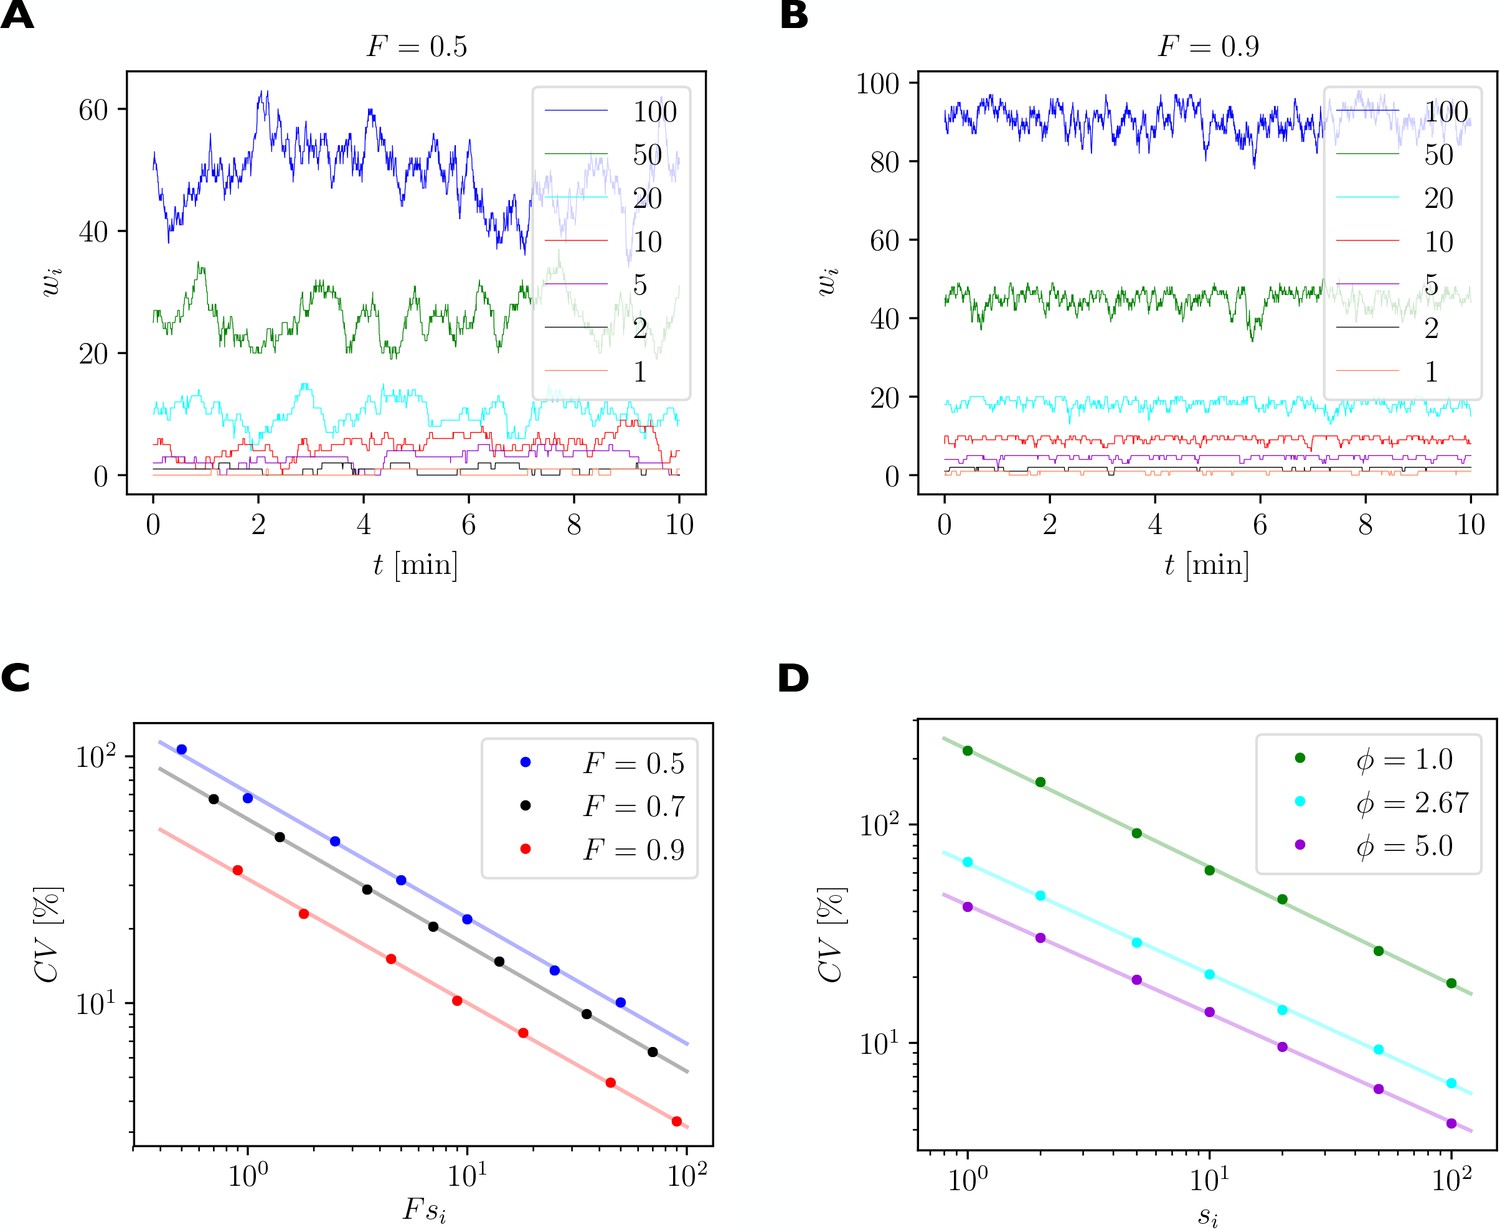
Quantification of spontaneous synaptic efficacy fluctuations due to the fast exchange of receptors between synapses and the receptor pool.
(A) Example simulation of a piece of dendrite with 7 synapses during 10 min of simulated time. The number of receptor slots in each synapse is given in the legend. The relative pool size was set to and the filling fraction was set to by choosing the binding rate to receptor slots via Equation 13. (B) Same as A. but for a higher filling fraction of . (C) Size of synaptic efficacy fluctuations as measured by the coefficient of variation (CV) as a function of the steady state number of receptors in each synapse, which is given by the product of the filling fraction and the number of slots in synapse . The relative pool size was set to . Data points represent averages over 10 simulations of 30 min simulated time each. Lines represent linear fits through the data points in double log space. (D) CV as a function of steady state number of receptors for different relative pool sizes achieved by holding the binding rate to receptor slots fixed and varying the externalization rate .
Tables
Table 1
Standard parameters of the model.
https://doi.org/10.7554/eLife.37836.003| Value | Description | Reference | |
|---|---|---|---|
| unbinding rate from slots | Henley and Wilkinson (2013); Henley and Wilkinson (2016) | ||
| internalization rate | Ehlers et al. (2007) | ||
| 2.67 | relative pool size | M. Renner, personal communication | |
| unknown | filling fraction | set by hand to {0.5, 0.7, 0.9} | |
| unknown | externalization rate | set via Equation 12 to achieve desired | |
| unknown | binding rate to slots | set via Equation 13 to achieve desired |
Table 2
Summary of model predictions.
Further predictions are mentioned in the Discussion.
| Prediction | Explanation |
|---|---|
| Filling fraction | Synapses in a local group have identical filling fractions in the basal state. |
| Pool Size | Manipulation of local pool size scales synapses multiplicatively. |
| Sensitivity | Filling fraction is most sensitive when pool size matches slot numbers. |
| Heterosynaptic I | High pool size and filling fraction reduce heterosynaptic plasticity. |
| Heterosynaptic II | Heterosynaptic plasticity is only transient. |
| Homosynaptic | Pool size and filling fraction modulate homosynaptic plasticity. |
| Fluctuations | Spontaneous efficacy fluctuations are bigger for small synapses. |
Table 3
Fitting results from the stochastic version of the model, cf. Figure 8C.
The externalization rate and the attachment rate of receptors to slots are set to obtain different filling fractions while maintaining a relative pool size of . Parameters and are as in Tab. 1. and give the parameters of the power law fits.
| Scale factor | Exponent | |||
|---|---|---|---|---|
| 0.5 | 0.0056 | 12.1 | 71.4 | −0.52 |
| 0.7 | 0.0093 | 9.4 | 55.6 | −0.51 |
| 0.9 | 0.0278 | 6.7 | 31.8 | −0.50 |
Table 4
Fitting results from the stochastic version of the model, cf. Figure 8D.
The attachment rate of receptors to slots is chosen as to obtain a filling fraction of for a relative pool size of . Parameters and are as in Tab. 1. is varied to obtain different relative pool sizes and filling fractions .
| Relative pool size | Scale factor | Exponent | ||
|---|---|---|---|---|
| 1.0 | 2.67 | 0.20 | 92.6 | −0.54 |
| 2.67 | 25.1 | 0.7 | 55.4 | −0.51 |
| 5.0 | 56.4 | 0.84 | 39.1 | −0.50 |
Additional files
-
Transparent reporting form
- https://doi.org/10.7554/eLife.37836.014
Download links
A two-part list of links to download the article, or parts of the article, in various formats.
Downloads (link to download the article as PDF)
Open citations (links to open the citations from this article in various online reference manager services)
Cite this article (links to download the citations from this article in formats compatible with various reference manager tools)
Competition for synaptic building blocks shapes synaptic plasticity
eLife 7:e37836.
https://doi.org/10.7554/eLife.37836


