PPP1R35 is a novel centrosomal protein that regulates centriole length in concert with the microcephaly protein RTTN
- The Hospital for Sick Children, Canada
- University Health Network, Canada
- University of Toronto, Canada
Figures
Figure 1 with 1 supplement

PPP1R35 localizes to the centrosome.
(a) Confocal microscopy images of live U2OS cells transfected with GFP-PPP1R35 and Centrin1-mCherry. The insets are magnifications of the boxed centrosomes. Scale bar, 5 µm. (b) Still images from time-lapse live-cell spinning-disc confocal microscopy of U2OS cells expressing GFP-PPP1R35. The time elapsed from the start of movie acquisition is printed in each still image. The insets are 5X magnifications of the boxed centrosomes. For clarity, the outlines of mitotic cells are shown. The extra cytosolic green dots observed in the 65 and 108 min panels are due to camera shot-noise. Scale bar, 5 µm. (c) Still images from high-speed live-cell imaging of G1/S or early G2 phase centrosome (assignment based on the engaged nature of the centrosomes) on a Leica HyVolution 2 confocal microscope. The time elapsed from the start of the movie is printed in each still image. The mother and daughter centrioles are indicated by m and d, respectively. Scale bar, 250 nm. (d) Confocal microscopy images of fixed U2OS cells labeled with an antibody against PPP1R35 and γ-tubulin. For clarity, the cell outline is shown by a white dotted line. The insets are 4X magnifications of the boxed centrosomes. Scale bar, 2 µm. (e) 3D Structured Illumination Microscopy images of U2OS cells stained for PPP1R35 and CETN1 (bottom series). For clarity, the cell outline is shown by a white dotted line. The insets are 6X magnifications of the boxed centrosomes. Scale bar, 2 µm. (f) Fluorescence recovery after photobleaching (FRAP) experiments of cytosolic (blue circles) and centrosomal (red diamonds) GFP-PPP1R35. Several images were acquired pre-bleach to establish a baseline and then the respective populations were bleached (at ~3 s) and allowed to recover. Results are a mean of 20 cells and error bars depict the standard deviation. (g) Table summarizing the parameters extracted from the FRAP experiments.
-
Figure 1—source data 1
Source data for Figure 1f and g (FRAP experiment).
- https://doi.org/10.7554/eLife.37846.006
Figure 1—figure supplement 1

Validation of targeting and biological activity of GFP-PPP1R35.
(a) 3DSIM micrographs of WT (left series) or GFP-PPP1R35-expressing (right series) U2OS cells stained with representative centrosomal markers. All scale bars, 250 nm. (b) Distribution of cells with either 0, 1, 2, or greater than 2 CEP152 spots in GFP-PPP1R35-expressing or WT U2OS cells. Statistics conducted with Student’s T-test (ns, not significant).
-
Figure 1—figure supplement 1—source data 1
Source data for Figure 1—figure supplement 1b (CEP152 recruitment comparison: WT U2OS vs GFP-PPP1R35 U2OS).
- https://doi.org/10.7554/eLife.37846.005
Figure 2
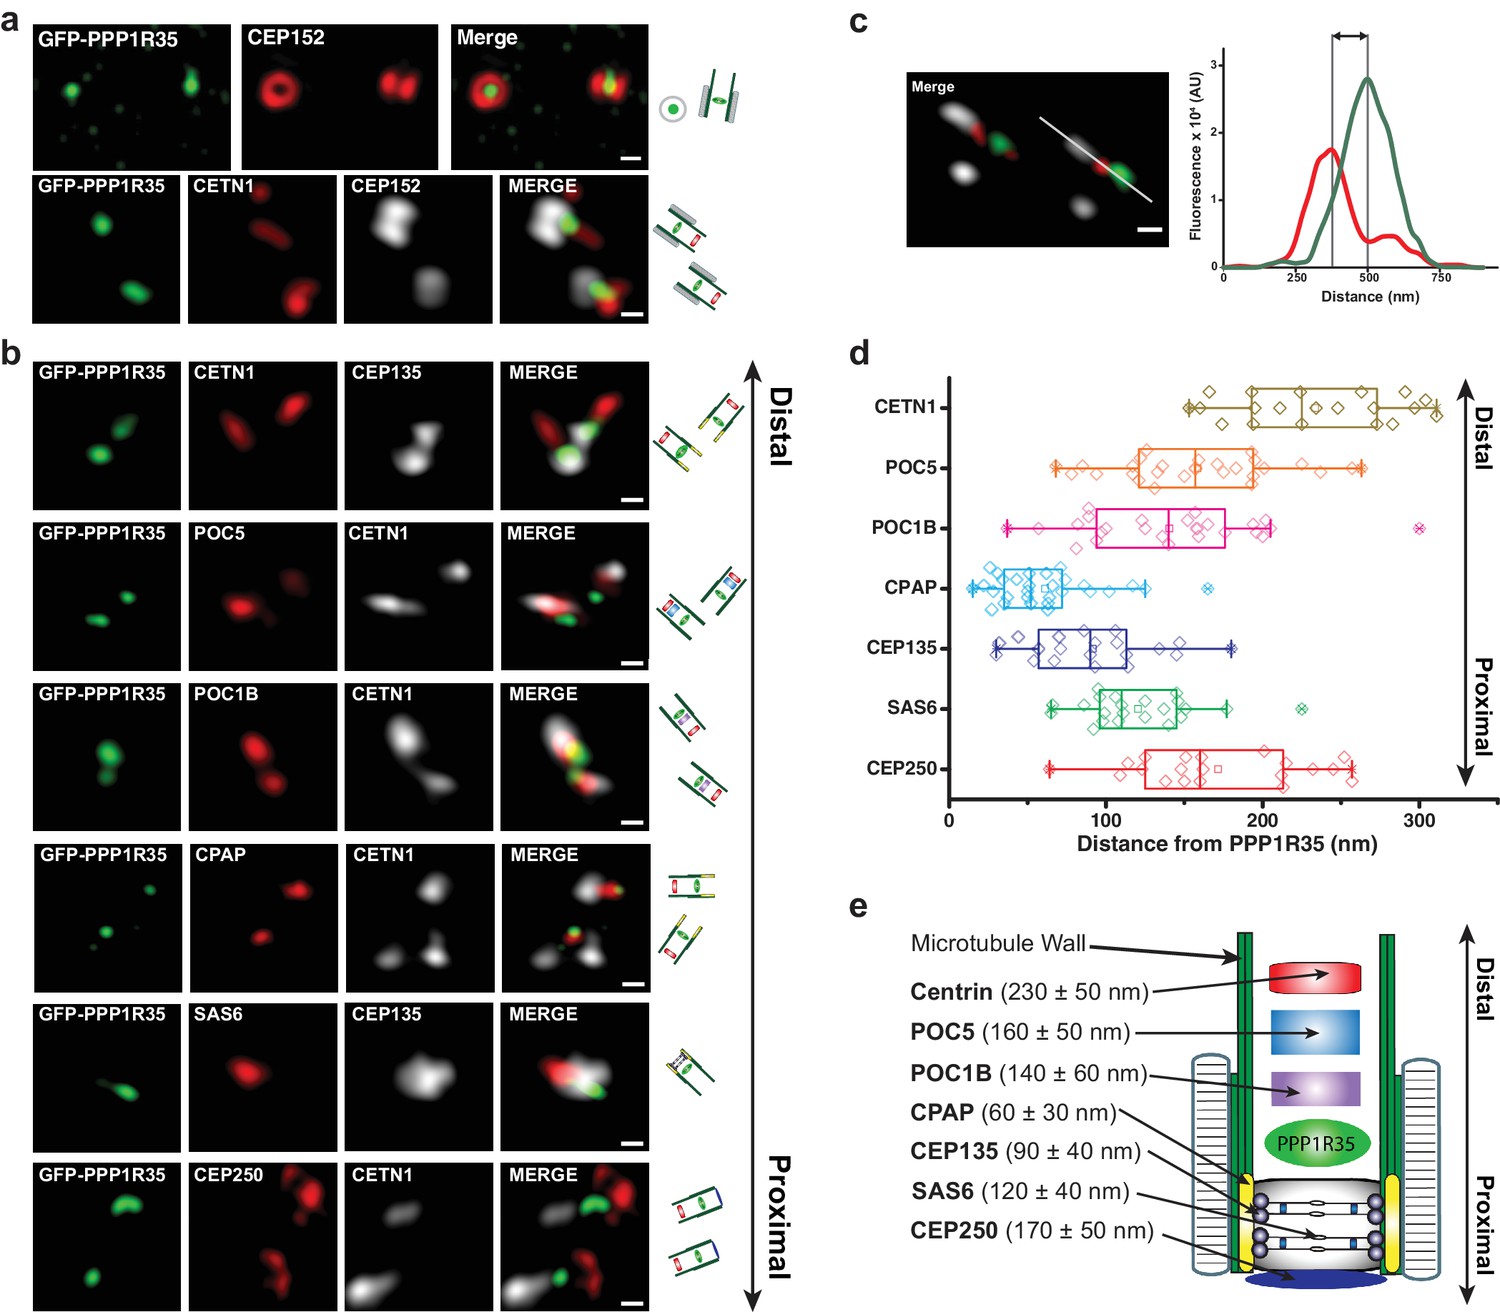
PPP1R35 localizes to the proximal end of the centriolar lumen above the cartwheel.
(a,b) 3D structured illumination microscopy (3DSIM) micrographs of U2OS cells expressing GFP-PPP1R35 (treated with digitonin to remove the cytoplasmic PPP1R35 population) and co-stained with CEP152 (a) and various other markers (b) labeling the distal (POC5, POC1B, CETN1) and proximal (SAS6, CEP135, CPAP, CEP250) regions of the centriole. The cartoon depiction of the centriole is alongside the images to assist in orienting the 3DSIM micrographs. Scale bars, 250 nm. (c) By measuring the distances between the fluorescence maxima of PPP1R35 and various centriolar markers on the same z-plane, the distance between GFP-PPP1R35 and the corresponding marker was determined. The fluorescence intensity along the line drawn in the micrograph (green, GFP-PPP1R35; red, POC5; white, CETN1) is plotted as a function of the distance along the line. The grey lines are centered at the fluorescence maxima and the distance between these lines corresponds to the distance between GFP-PPP1R35 and the corresponding marker (POC5 in this example). (d) By combining the analysis of the micrographs with these measurements, the position of PPP1R35 was mapped on to the centriole and the distances are shown in a Tukey box and whiskers plot, with the whiskers representing datum within an interquartile range of 1.5 and the band in the box as the mean. (e) A cartoon depiction of the localization of PPP1R35 in the centriole relative to the markers depicted in (b) and (d) with the average distances and standard deviations noted.
-
Figure 2—source data 1
Source data for Figure 2d and e (PPP1R35 mapping measurements).
- https://doi.org/10.7554/eLife.37846.009
Figure 3 with 5 supplements
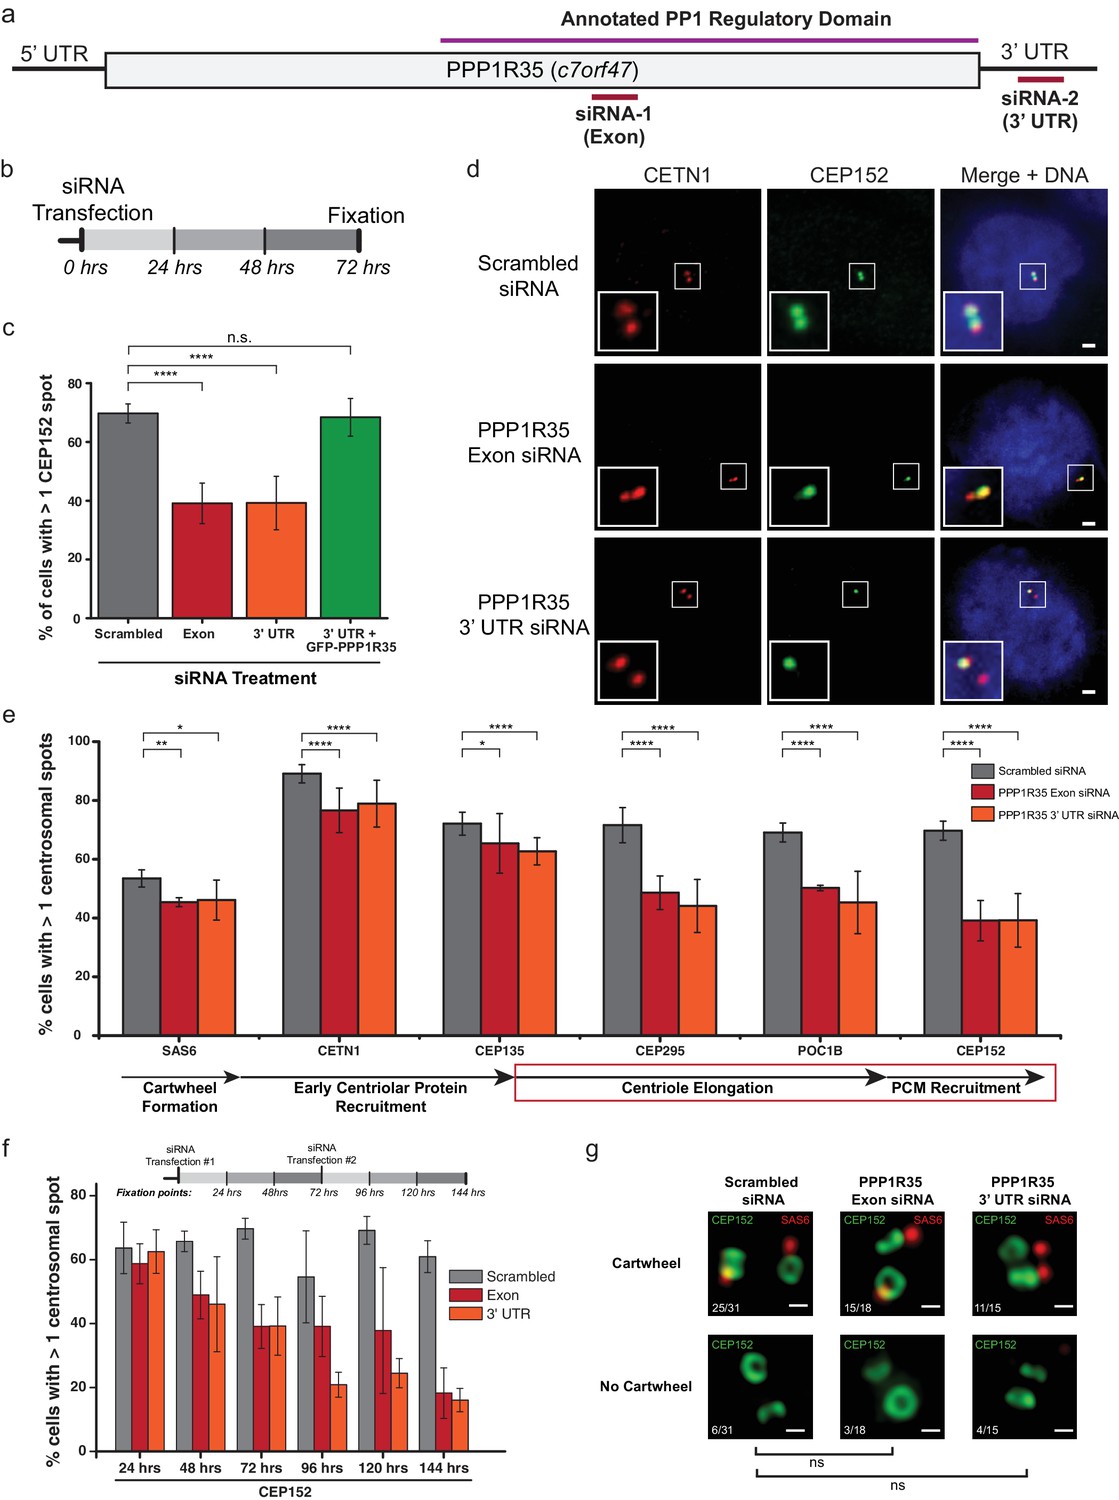
PPP1R35 is critical for centrosome duplication.
(a) Sequence of PPP1R35 with the regions targeted by the siRNA used in this study. (b) Schematic representing the timing of the siRNA treatments used in the PPP1R35 knockdown experiments. (c) PPP1R35 protein levels were reduced in U2OS cells by treatment with siRNAs targeting either an exon (red bars) or the 3’ untranslated region (UTR; orange bars) of the mRNA. The percentage of cells with greater than one CEP152-labeled centrosome, a protein recruited in the later stages of centrosome duplication, is plotted. In this and following figures, the grey bar represents U2OS cells treated with a control scrambled siRNA strand; red bar, U2OS cells treated with a siRNA targeting an exon of PPP1R35; orange bar, U2OS cells treated with a siRNA targeting the 3’ UTR of endogenous PPP1R35; the green bar represents U2OS cells treated with the 3’UTR-targeting siRNA with exogenously expressed GFP-PPP1R35. (d) Representative micrographs showing decreased numbers of CEP152 positive centrioles in cells treated with PPP1R35 siRNA. Note that CETN1 was not severely perturbed upon treatment with PPP1R35 siRNA. High magnifications of the centrosome for each image are shown in the bottom left corner. Scale bars, 2 µm. (e) U2OS cells treated with either an exon (red bars) or the 3’UTR (orange bars) targeting siRNA (grey bars- control siRNA treated) for the different components of the centriole duplication pathway. The corresponding step of centriole duplication to which the different components belong is depicted with arrows below the plot, with the impacted steps highlighted with a red box. (f) PPP1R35 protein levels were reduced in U2OS cells by treatment with either of the two PPP1R35-targeting siRNA strands, for time points ranging from 24 to 144 hr and subsequently stained for CEP152. The timeline depicted indicate the timing of the siRNA treatments and subsequent time points when cells were fixed and stained for immunofluorescence. (g) 3DSIM micrographs of scrambled- and PPP1R35-siRNA treated cells stained for SAS6 (red) and CEP152 (green). Cells in which two engaged centrosomes were present were analyzed for the presence of a SAS6 cartwheel. Fractions of cells falling into each category are indicated in the top left corner of each micrograph. All scale bars, 250 nm. All error bars show the standard deviation of at least three replicate experiments. Statistics for significance were determined using Barnard’s test. All statistical values can be found in Supplementary file 4.
-
Figure 3—source data 1
Source data for Figure 3c and d (blue tabs) (PPP1R35 siRNA phenotype) and 3f (siRNA time-course, labeled with antibodies against CEP152).
The blue tabs are also the source data for Figure 3—figure supplement 4.
- https://doi.org/10.7554/eLife.37846.019
Figure 3—figure supplement 1
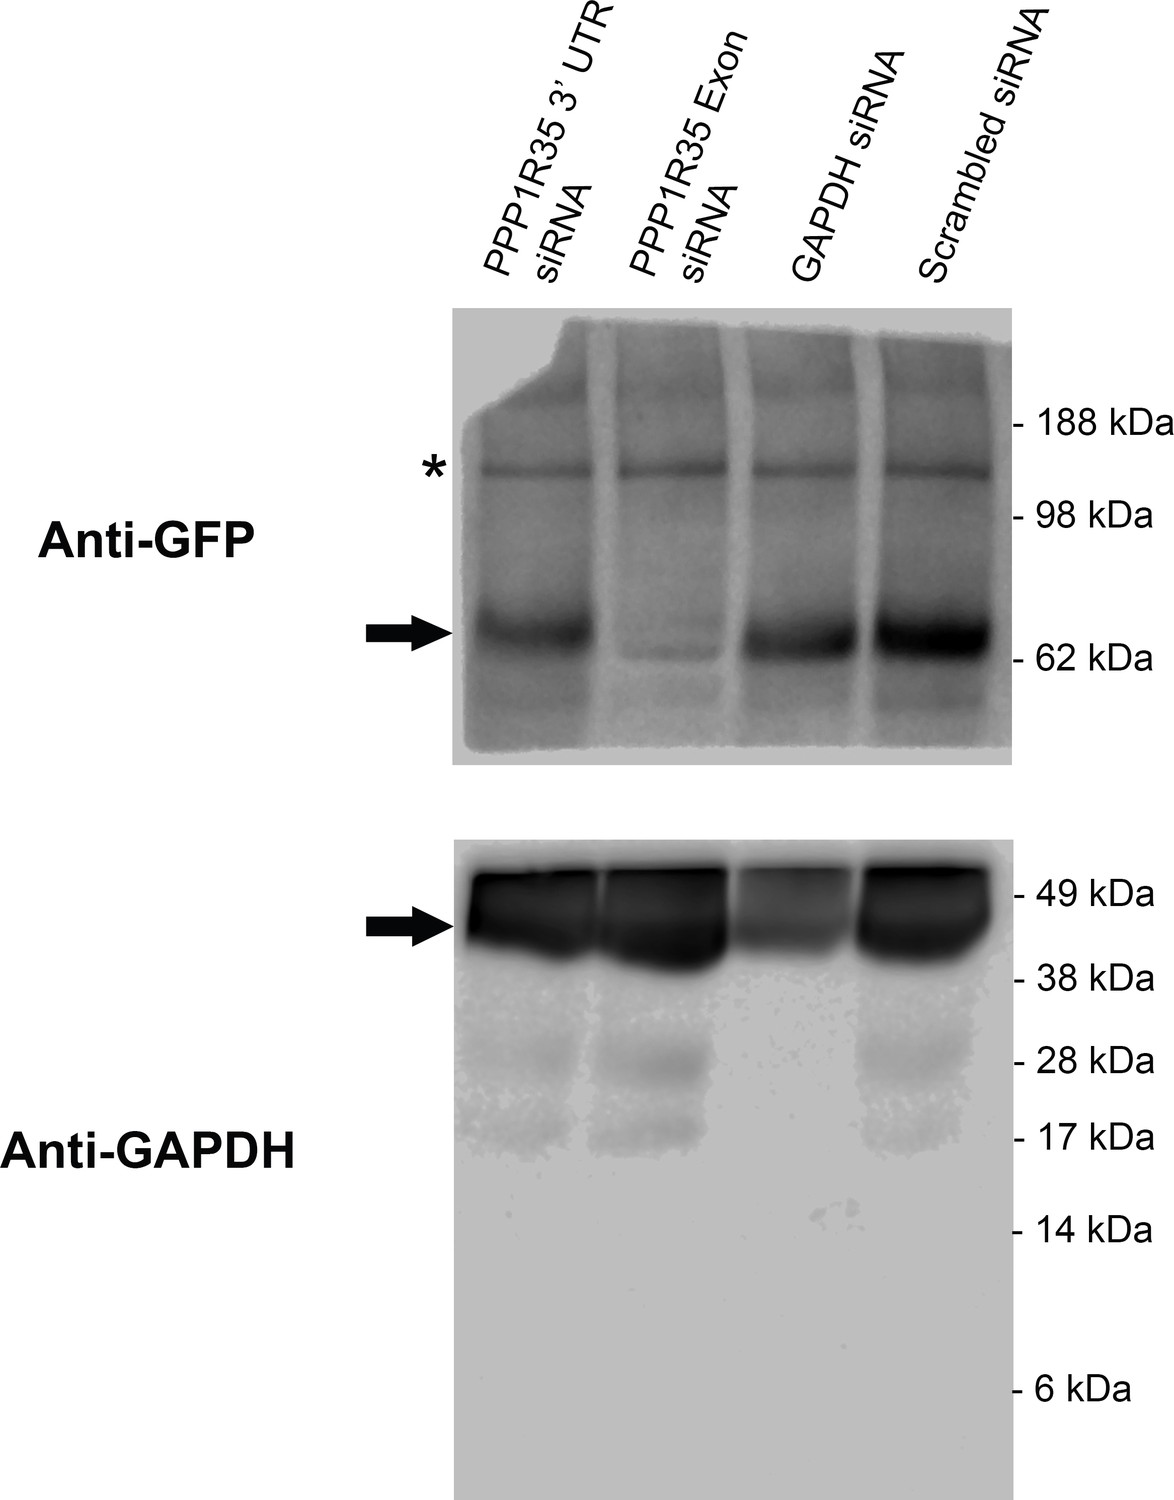
Western blot of siRNA treated GFP-PPP1R35 U2OS cells.
We verified the efficacy of our siRNA strands by monitoring either GFP-PPP1R35 knockdown or rescue by GFP-PPP1R35 (see main text). A single membrane (20 µg total protein per lane) was cut in two parts with the top incubated with an antibody against GFP and the bottom portion incubated with an antibody against GAPDH to serve as both a loading control and positive control (in conjunction with the GAPDH siRNA). Arrows indicate target bands. Expected molecular mass for the GFP-PPP1R35 construct is 62.2 kDa and for GAPDH is 35.8 kDa. Asterisk indicates a major protein band cross-reacting with the anti-GFP antibody.
Figure 3—figure supplement 2

Real-time quantitative PCR analysis of PPP1R35 knockdown by siRNA.
Quantitative PCR was used to analyse the efficacy of PPP1R35 knockdown. Expression of c7orf47 (the gene encoding PPP1R35) was monitored using two different primer pairs targeting the gene (c7orf47-1 and c7orf47-2) and expression levels were normalized to RNA polymerase II and TATA-binding protein transcript levels and relative to the scrambled siRNA-treated samples. All data represent the average values from at least three biological replicates and error bars represent the standard deviation. Statistical analysis was performed using a Student’s T-test.
-
Figure 3—figure supplement 2—source data 1
Source data for Figure 3—figure supplement 2 (RT-qPCR).
- https://doi.org/10.7554/eLife.37846.013
Figure 3—figure supplement 3
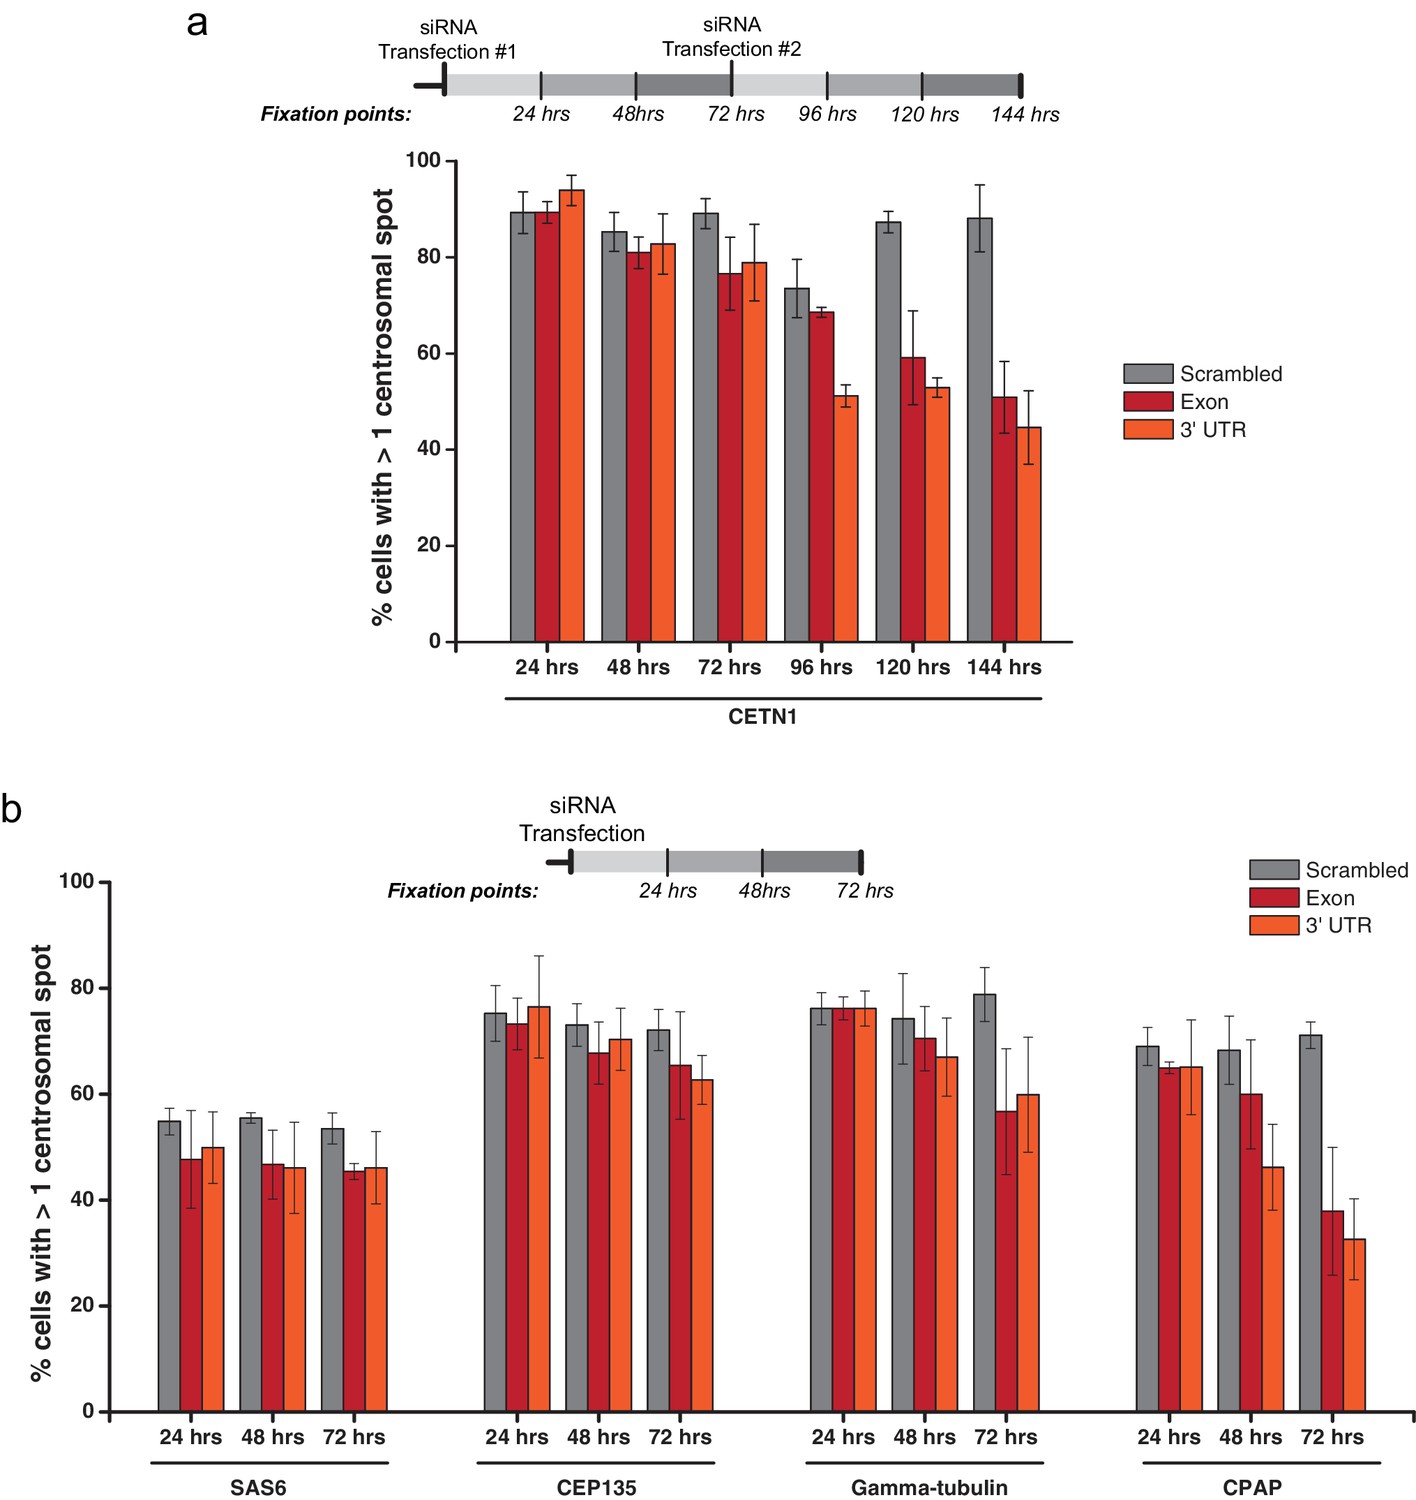
PPP1R35 siRNA time-course.
PPP1R35 protein levels were reduced in U2OS cells by treatment with two siRNAs, one targeting an exon of PPP1R35 and the second targeting the 3’ UTR, for time points ranging from 24 to 144 hr (a) or 24 to 72 hr (b). The cells were subsequently stained for various centrosomal markers (indicated along the x-axis). The timelines depicted indicate the timing of the siRNA treatments and subsequent time points when cells were fixed and stained for immunofluorescence. The average of at least 3 biological replicates is plotted. Error bars indicate the standard deviation.
-
Figure 3—figure supplement 3—source data 1
Source data for Figure 3—figure supplement 3 (PPP1R35 siRNA timecourse).
- https://doi.org/10.7554/eLife.37846.015
Figure 3—figure supplement 4
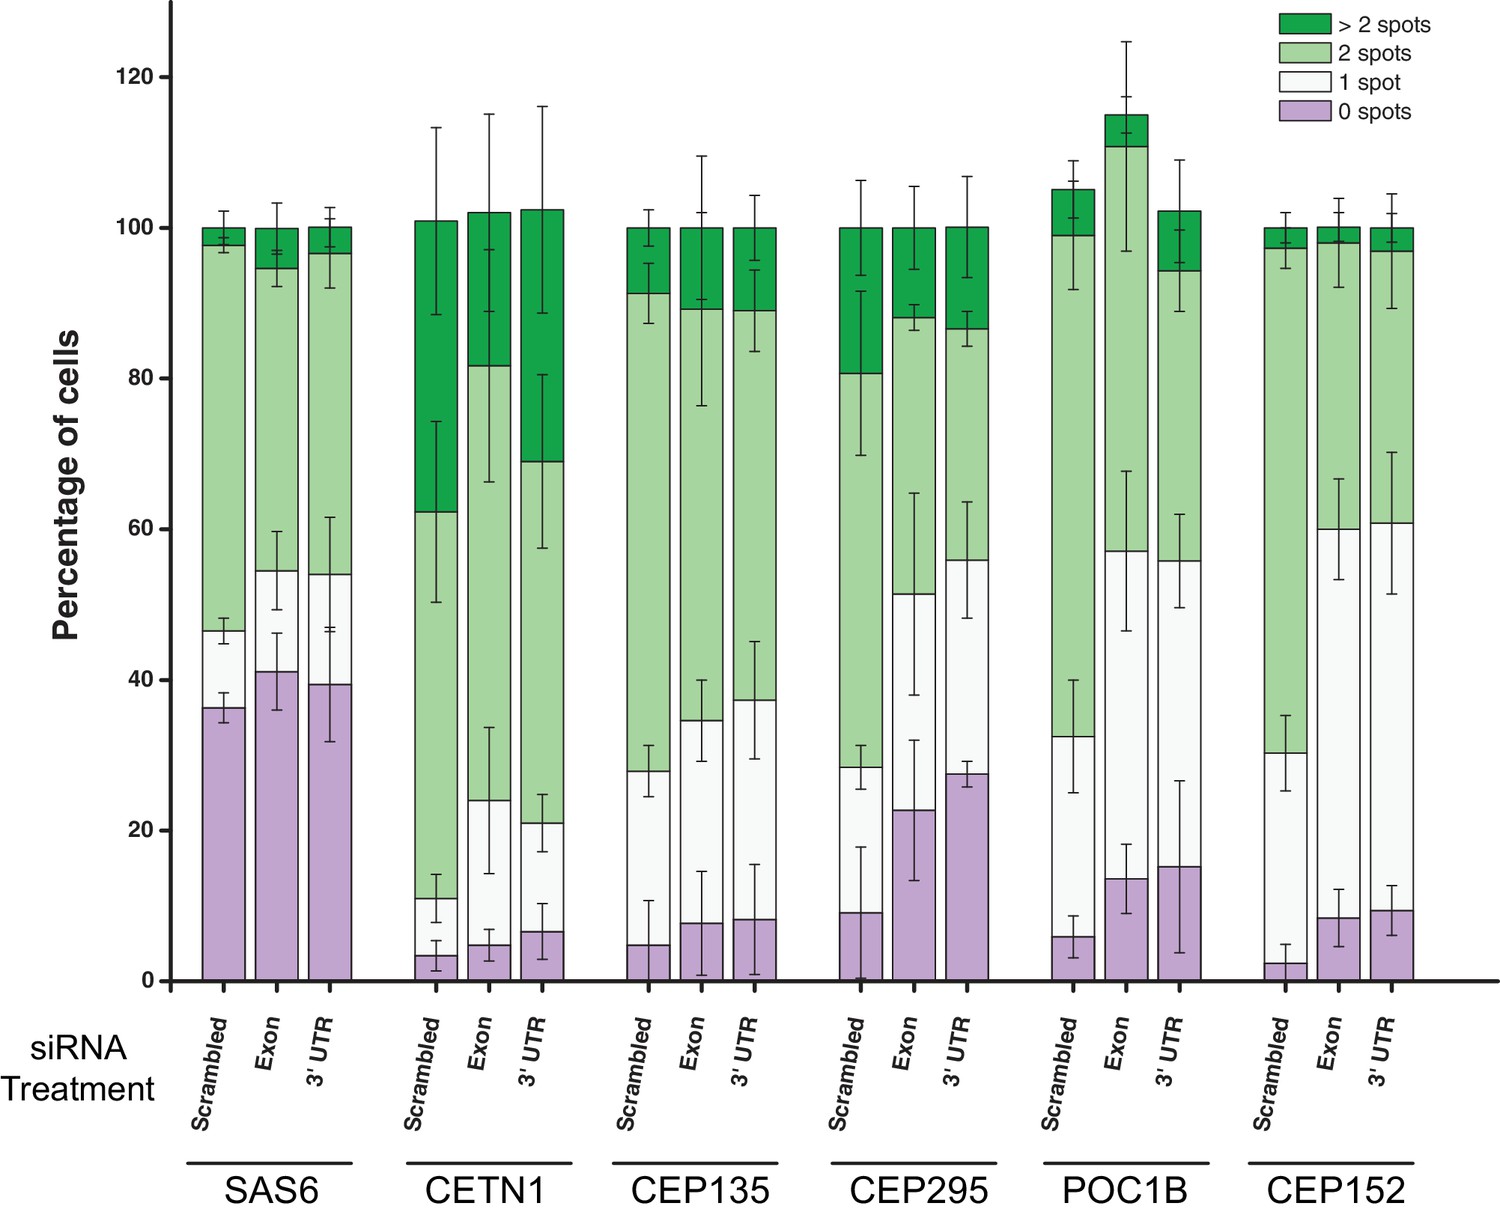
Breakdown of centrosome marker counts of cells treated with PPP1R35 siRNA.
PPP1R35 protein levels were reduced in U2OS cells by treatment with two siRNAs, one targeting an exon of PPP1R35 and the second targeting the 3’ UTR, for 72 hr and the cells subsequently stained for various centrosomal markers (indicated along the x-axis). The average of at least 3 biological replicates in which the percentage of cells with 0, 1, 2 or >2 marker spots was determined is plotted. Error bars indicate the standard deviation.
Figure 3—figure supplement 5
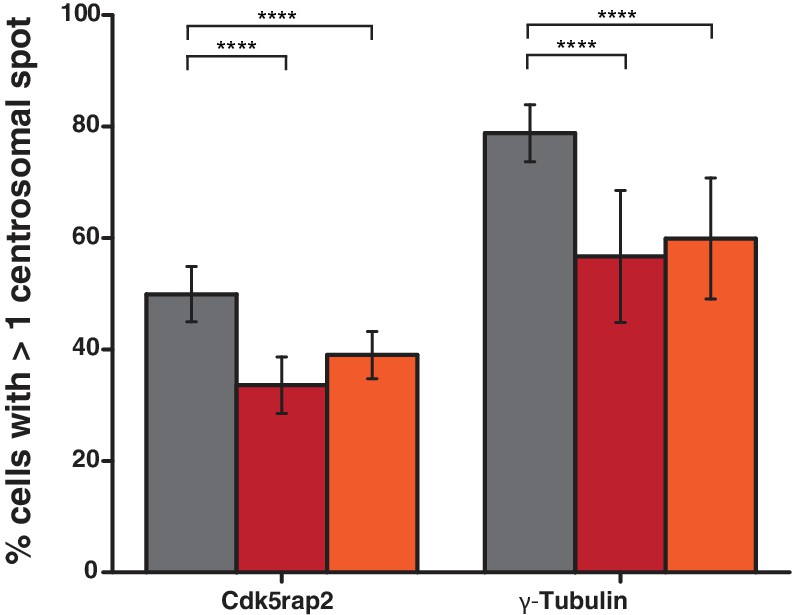
Cdk5rap2 and γ-tubulin staining of U2OS cells treated with siRNA targeting PPP1R35.
PPP1R35 protein levels were reduced in U2OS cells by treatment with siRNAs targeting either an exon (red bars) or the 3’ untranslated region (UTR; orange bars) of the mRNA and the cells were subsequently stained for either Cdk5rap2 (a component of the pericentriolar material) or γ-tubulin. In both cases, PPP1R35 knockdown resulted in a significant decrease in Cdk5rap2 and γ-tubulin stained centrosomes compared with that of a control sample treated with a non-targeting scrambled siRNA sequence (grey bars). All p values were calculated used Barnard’s test and error bars represent the standard deviation of three independent replicate experiments.
-
Figure 3—figure supplement 5—source data 1
Source data for Figure 3—figure supplement 5 (PPP1R35 siRNA; cells labeled with antibodies against Cdk5rap2 and γ-tubulin).
- https://doi.org/10.7554/eLife.37846.018
Figure 4 with 1 supplement
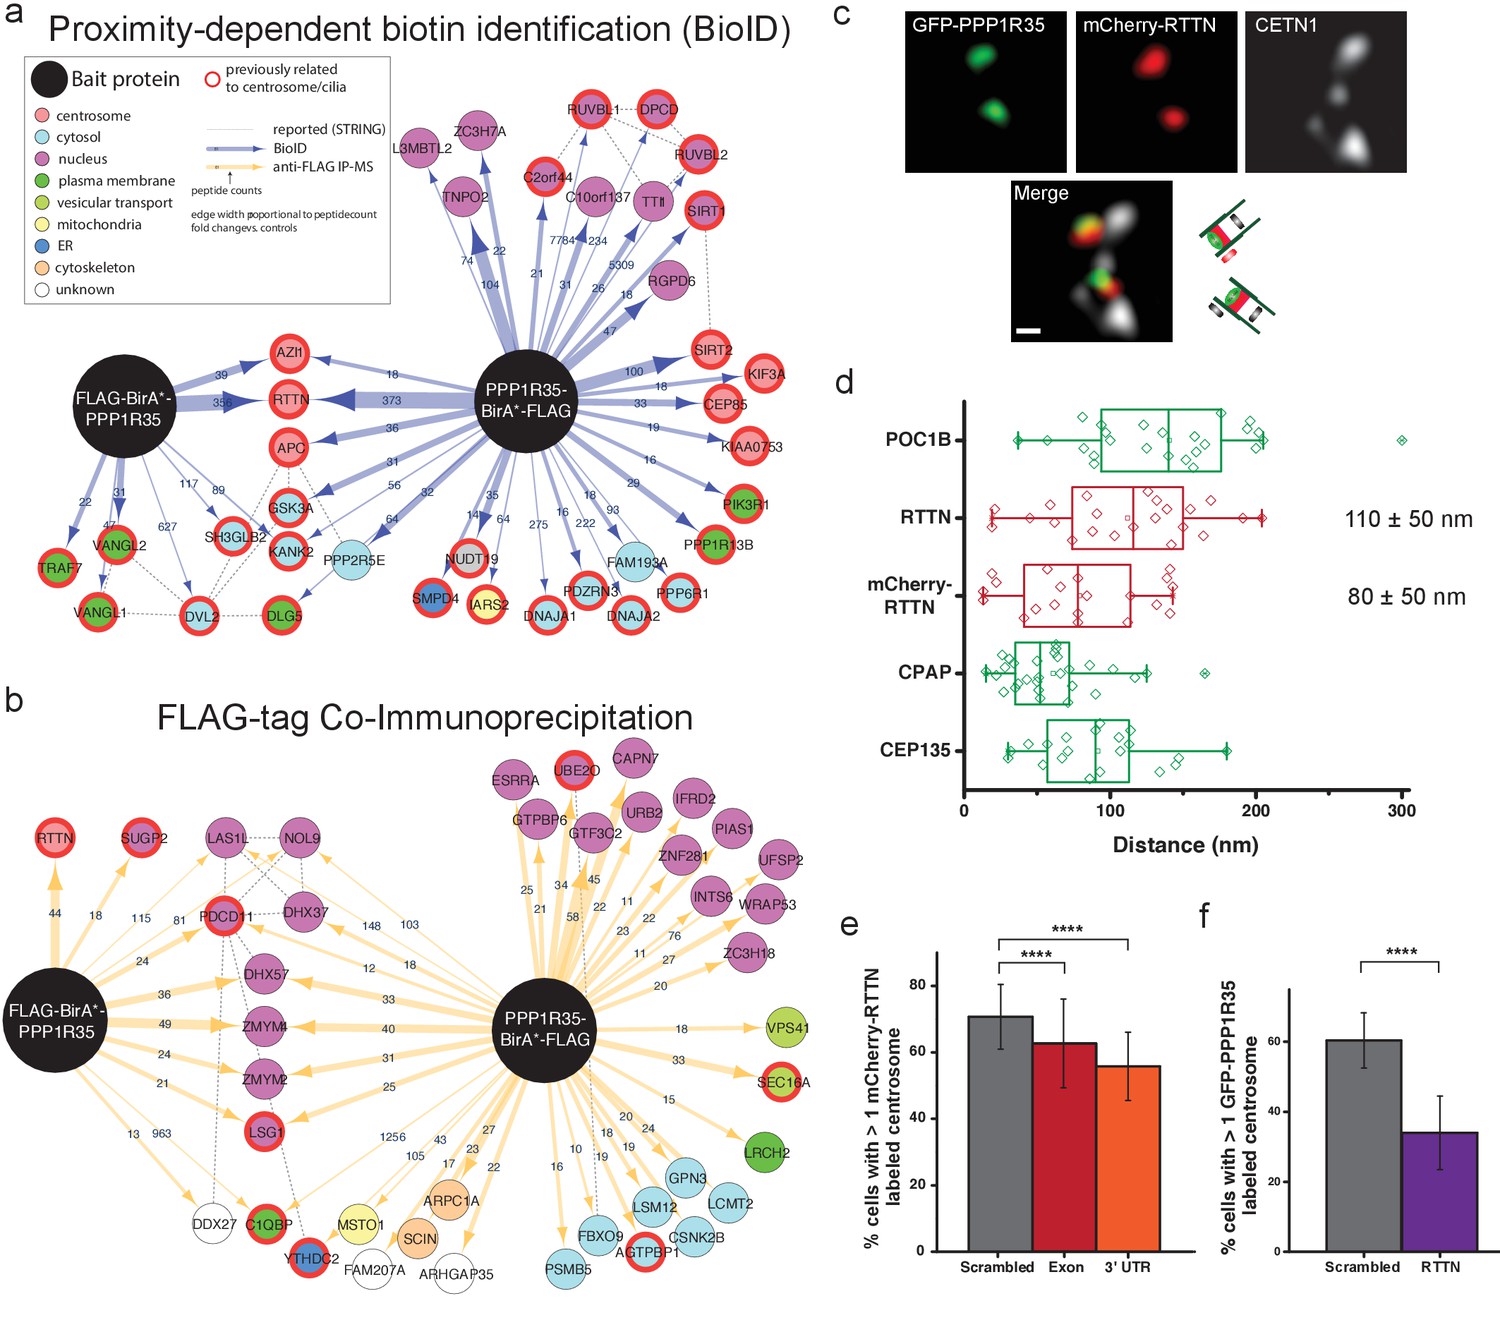
PPP1R35 interacts with the microcephaly protein RTTN, which is required for PPP1R35 recruitment.
PPP1R35 constructs tagged with a FLAG-tag and mutant R118G Biotin-ligase BirA (BirA*) on either the N- or C-terminus were used for identification of proteins in proximity to PPP1R35 via BioID (a) and directly interacting proteins via FLAG-tag immunoprecipitation (b), of which the top hits are shown. The arrow thickness indicates number of peptides identified for each hit and the colour of the circle indicates previously annotated sub-cellular localizations. All hits previously related to centrosomes/cilia are indicated by a red outline. (c) Localization of mCherry-RTTN relative to centrin-1 and GFP-PPP1R35 in U2OS cells as determined by 3DSIM. Representative cartoons to assist in orientating the images are shown to the right of the merge micrograph. Scale bar, 250 nm. (d) 3DSIM mapping of RTTN (via an anti-RTTN antibody and mCherry-RTTN construct) in relation to PPP1R35, conducted using the same methodology as in Figure 2c and plotted similarly to Figure 2d. The values noted are the average distances and standard deviations. (e) U2OS cells expressing mCherry-RTTN were treated with 40 pmol of either a control, scrambled siRNA (grey bars), siRNA targeting the PPP1R35 exon (red bars) or 3’UTR of endogenous PPP1R35 (orange bars). (f) U2OS cells expressing GFP-PPP1R35 were treated with 40 pmol control siRNA (grey bars) or siRNA targeting RTTN (purple bars) All error bars depict the standard deviation of at least three experimental replicates. Statistics for significance were determined using Barnard’s test. All statistical values can be found in Supplementary file 4.
-
Figure 4—source data 1
Source data for Figure 4d (PPP1R35 mapping measurements), 4e (mCherry-RTTN U2OS + PPP1 R35 siRNA), and 4 f (GFP-PPP1R35 U2OS + RTTN siRNA).
- https://doi.org/10.7554/eLife.37846.023
Figure 4—figure supplement 1
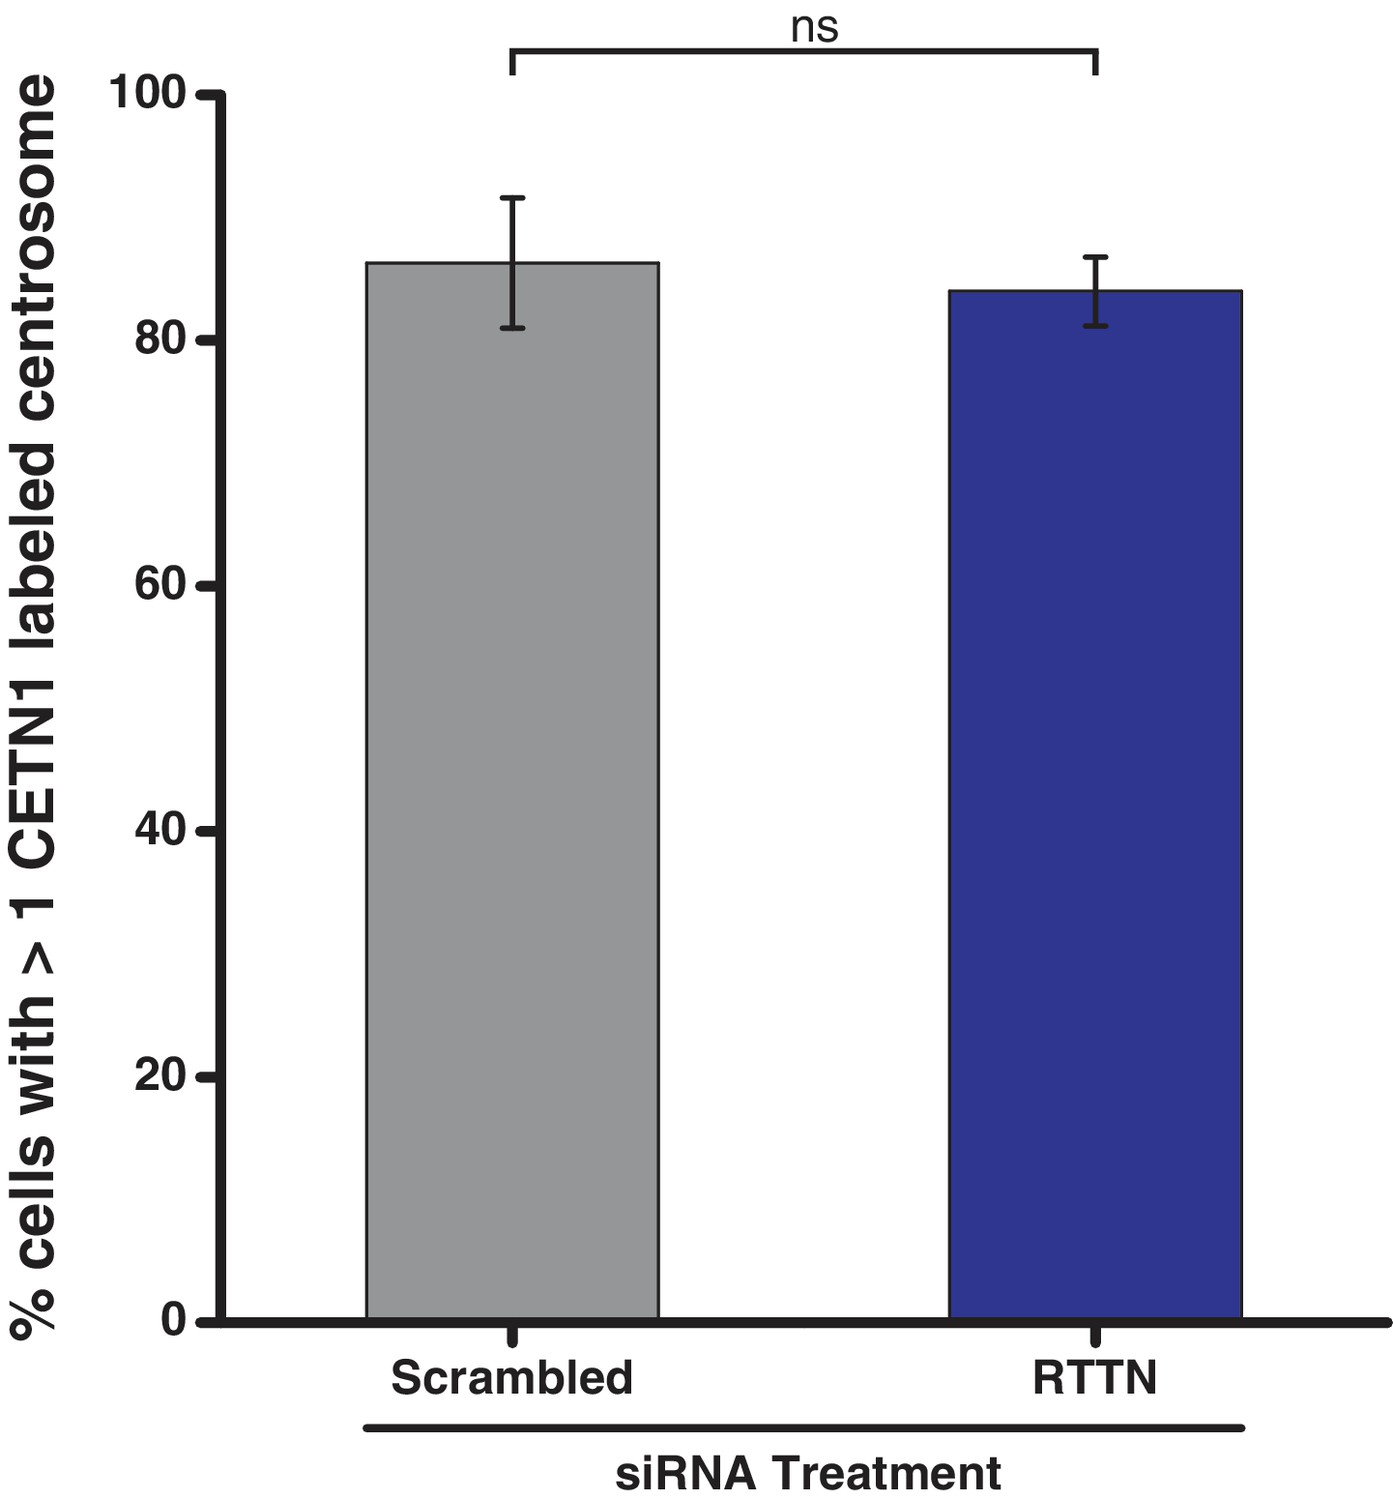
Analysis of centrin-positive centrosomes in U2OS cells treated with RTTN siRNA.
RTTN protein levels were reduced in U2OS cells by treatment with siRNA targeting RTTN for 72 hr and the cells subsequently stained with antibodies against centrin-1. The percentage of cells with greater than one centrin-1-stained centrosome is plotted. The p value was calculated used Barnard’s test and error bars represent the standard deviation of three independent replicates.
-
Figure 4—figure supplement 1—source data 1
Source data for Figure 4—figure supplement 1 (RTTN siRNA labeled with antibody against CETN1).
- https://doi.org/10.7554/eLife.37846.022
Figure 5 with 4 supplements
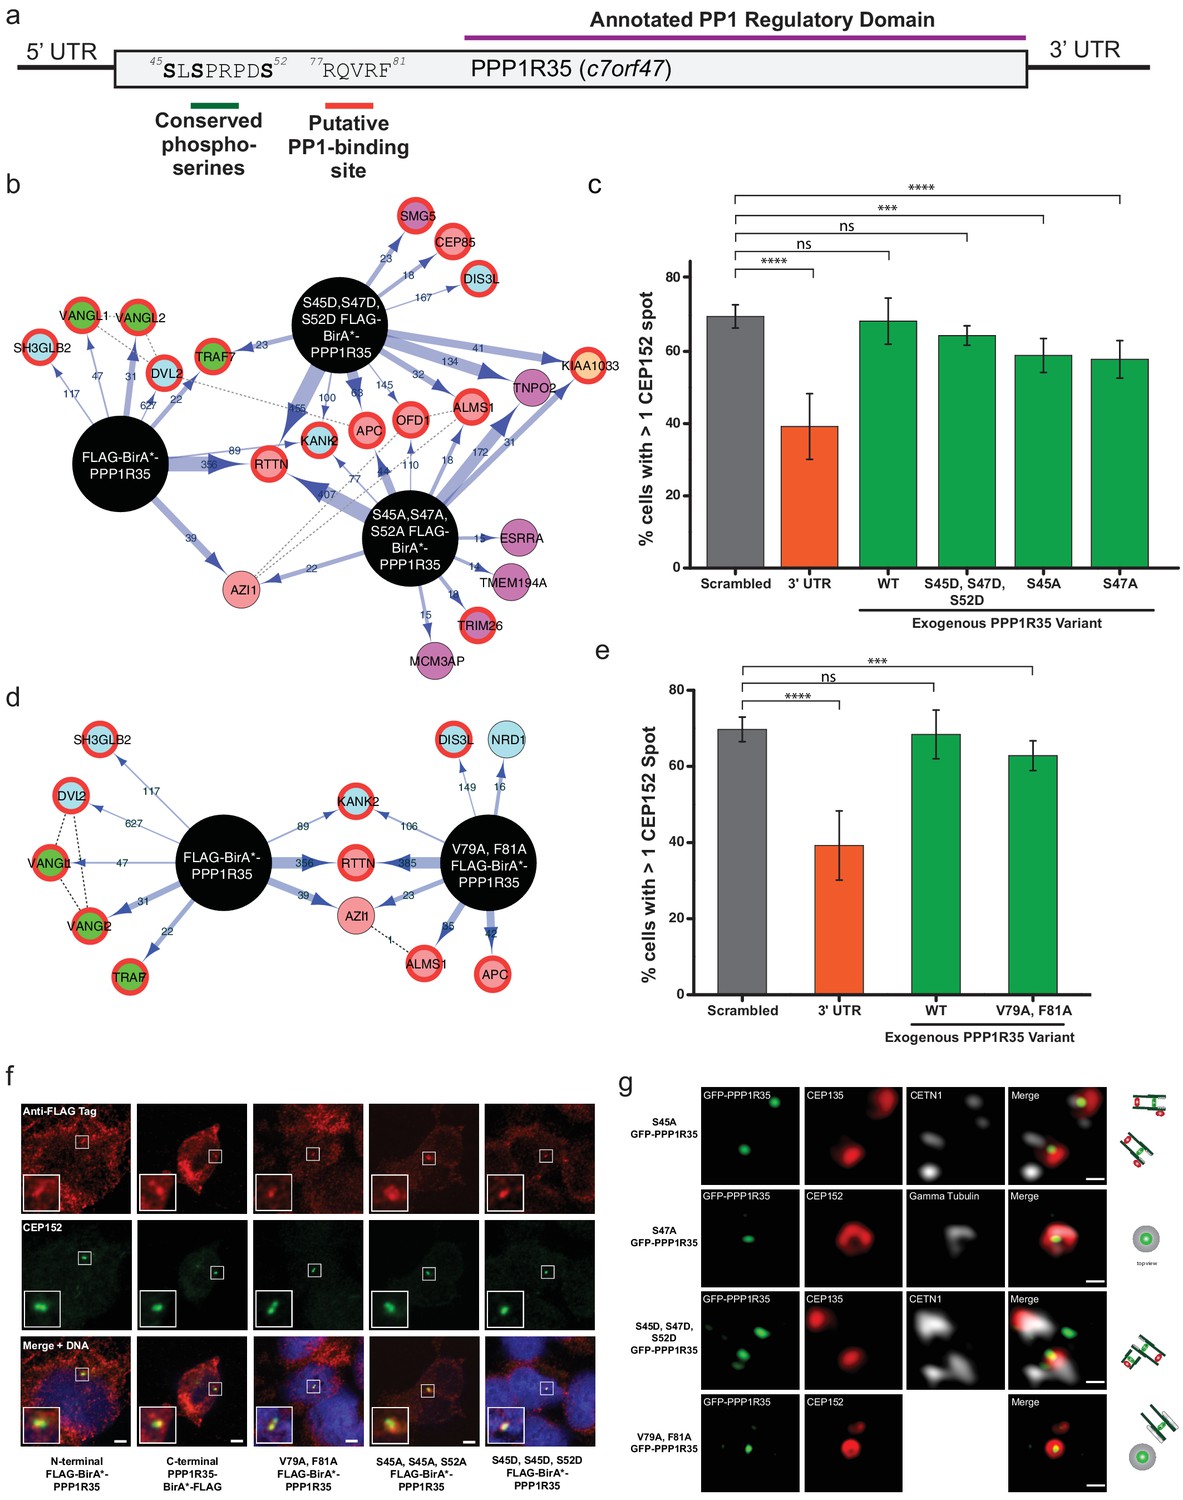
Conserved serines and putative PP1-binding site are not critical for centriole formation or interaction with RTTN.
(a) PPP1R35 contains a series of conserved serine residues that have been previous shown to be Cdk phosphorylation sites and are conserved in mammalian homologs. Furthermore, mammalian PPP1R35 homologs also possess a canonical PP1-binding site. The corresponding residues in both motifs are indicated on the PPP1R35 cartoon. (b) BioID results from N-terminal FLAG-BirA*-PPP1R35 mutants carrying non-phosphorylatable (S45A, S47A, S52A) or phospho-mimetic (S45D, S47D, S52D) mutations. Please refer to Figure 4a for map legend. (c) To probe the role of the conserved serine residues in centriole duplication, amino acids were mutated to either aspartic acids (to mimic the phosphorylated state) or alanine (to mimic the non-phosphorylated state) of the GFP-PPP1R35 construct and tested to see if they could rescue the reduced CEP152-staining phenotype observed upon treatment of U2OS cells with the 3’UTR siRNA. Similar to the triple alanine mutant, we were unable to generate a S52A mutant, suggesting that this residue may be critical for cell viability. (d) BioID results from N-terminal FLAG-BirA*-PPP1R35 mutants carrying the PP1-binding mutation (V79A, F81A). Please refer to Figure 4a for map legend. (e) To probe the role of the putative PP1-binding site in centriole duplication, the V79 and F81 were mutated to alanine to abolish PP1-binding in the GFP-PPP1R35 construct and tested to see if they could rescue the reduced CEP152-staining phenotype observed upon treatment of U2OS cells with the 3’UTR siRNA. (f) Localization of HEK293 Flp-In TREX BirA*-tagged PPP1R35 cell lines. Confocal microscopy micrographs of HEK293 Flp-In TREX cells expressing BirA*-tagged WT and mutant PPP1R35 constructs, stained for the FLAG tag (red channel) and CEP152 (green channel). Scale bars, 5 µm. Insets are high magnification of the centrosome. (g) Localization of GFP-PPP1R35 mutants in U2OS Flp-In cells. 3DSIM micrographs of U2OS cells expressing various mutant GFP-PPP1R35 constructs (treated with digitonin to remove the cytoplasmic PPP1R35 population) and co-stained with centriolar markers. The cartoon depiction of the centriole is alongside to assist in orienting the 3DSIM micrographs. Scale bars, 200 nm.
-
Figure 5—source data 1
Source data for Figure 5c and e (mutant GFP-PPP1R35 rescue experiments).
- https://doi.org/10.7554/eLife.37846.030
Figure 5—figure supplement 1
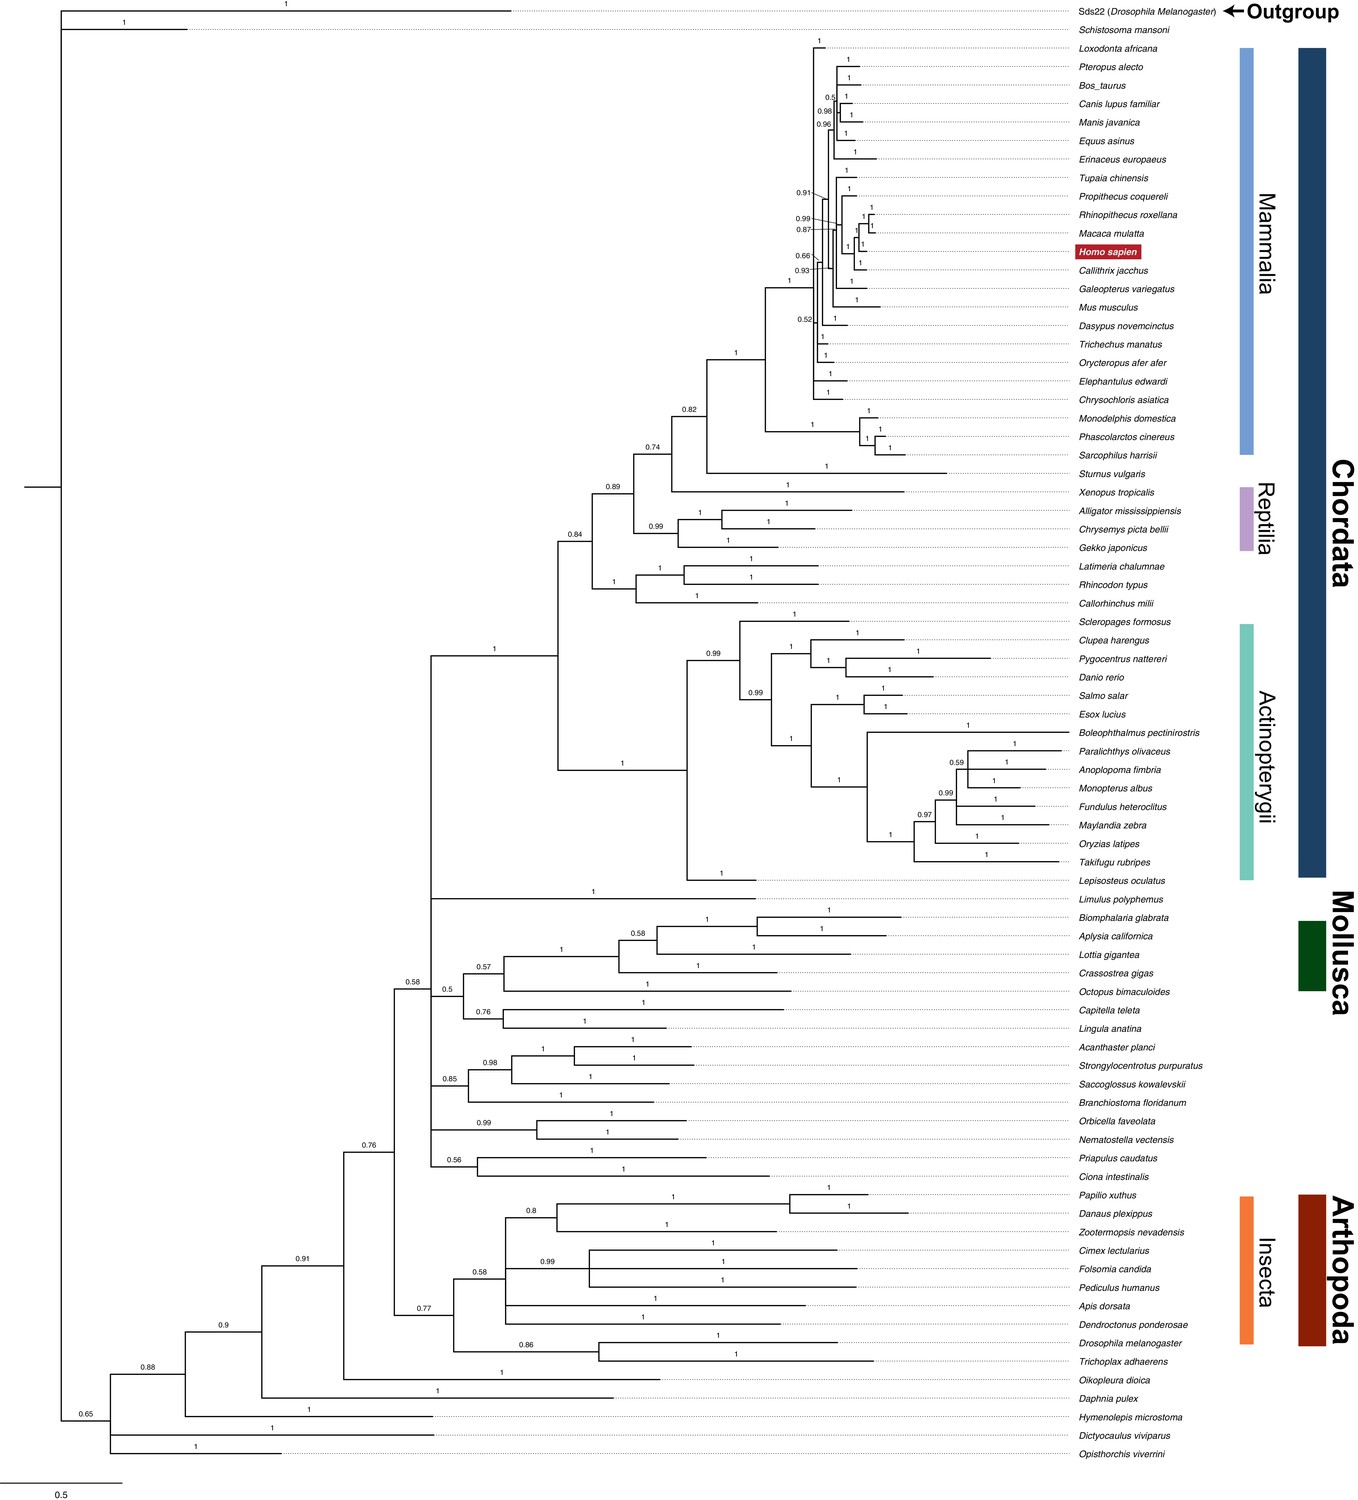
Phylogenetic tree of PPP1R35 homologs.
The phylogeny was inferred using the Bayesian method implemented with MrBayes 3.2.6. Drosophila melanogaster Sds22, a PP1 regulator protein identified to have diverged early from homologous PP1 regulatory proteins, was used as an outgroup to root the tree. The bootstrap values for each branching point are indicated and major phylogenetic groupings are highlighted. Branch lengths indicate relative evolutionary distances.
Figure 5—figure supplement 2
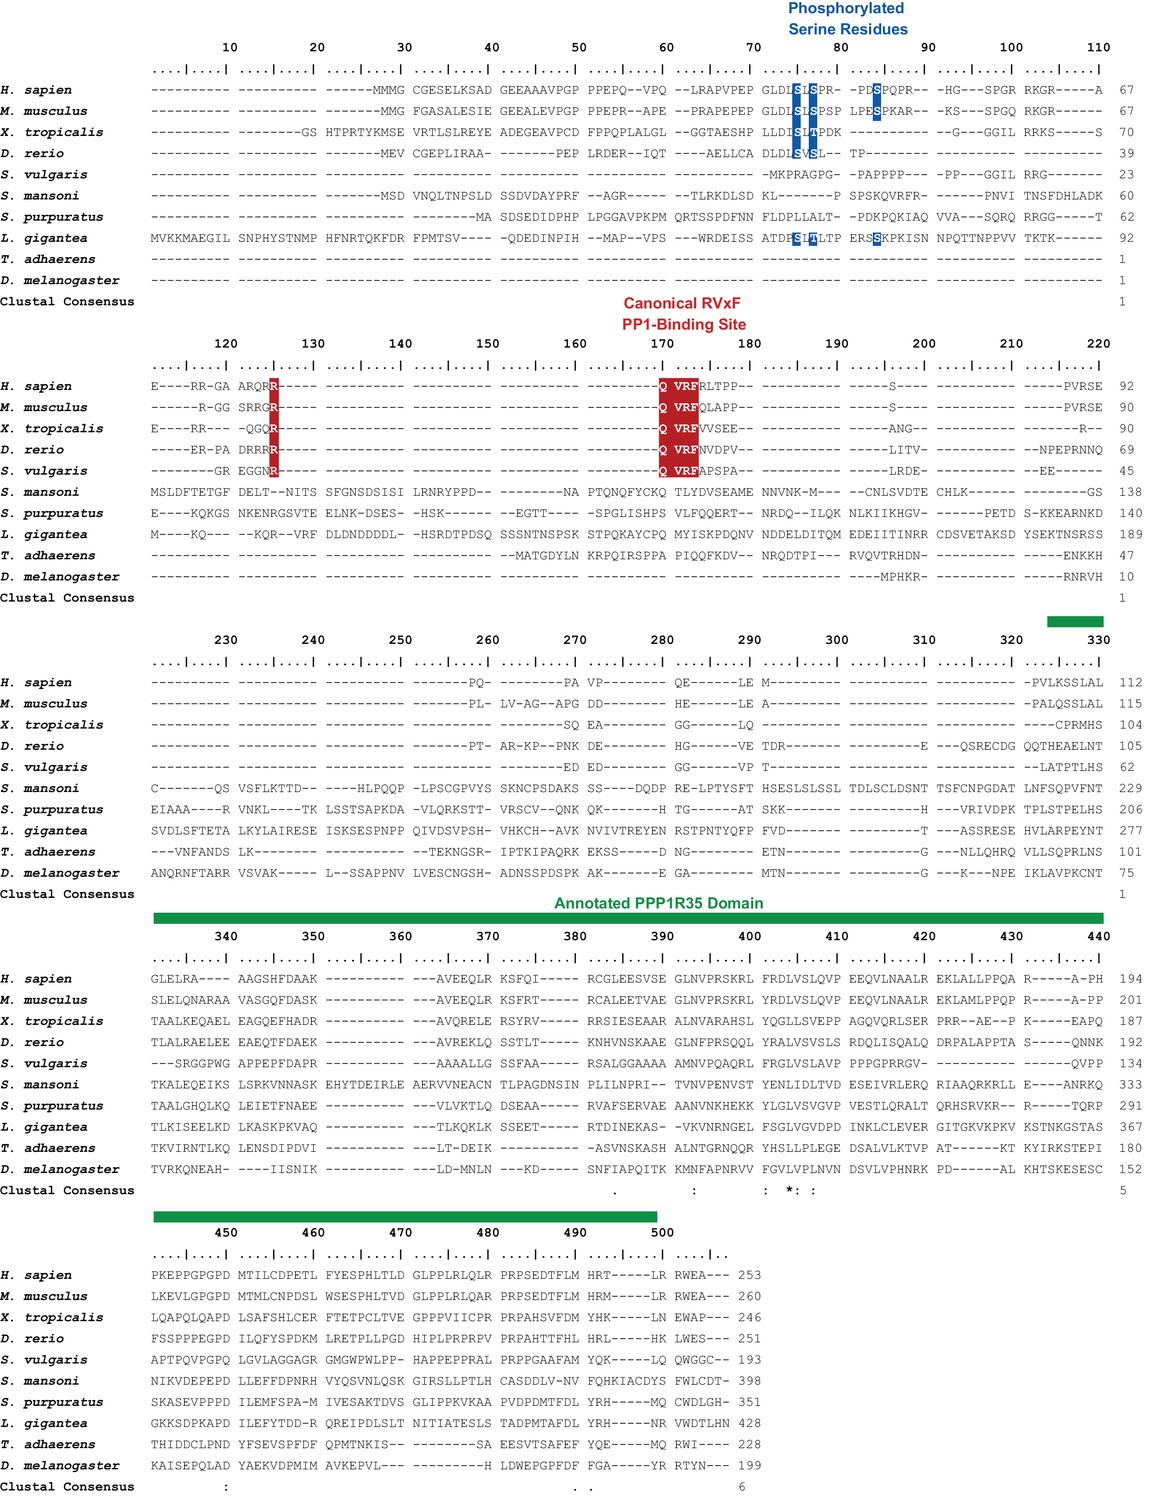
Alignment of selected PPP1R35 homologs.
Relevant motifs and regions are highlighted in color and noted above the alignment.
Figure 5—figure supplement 3
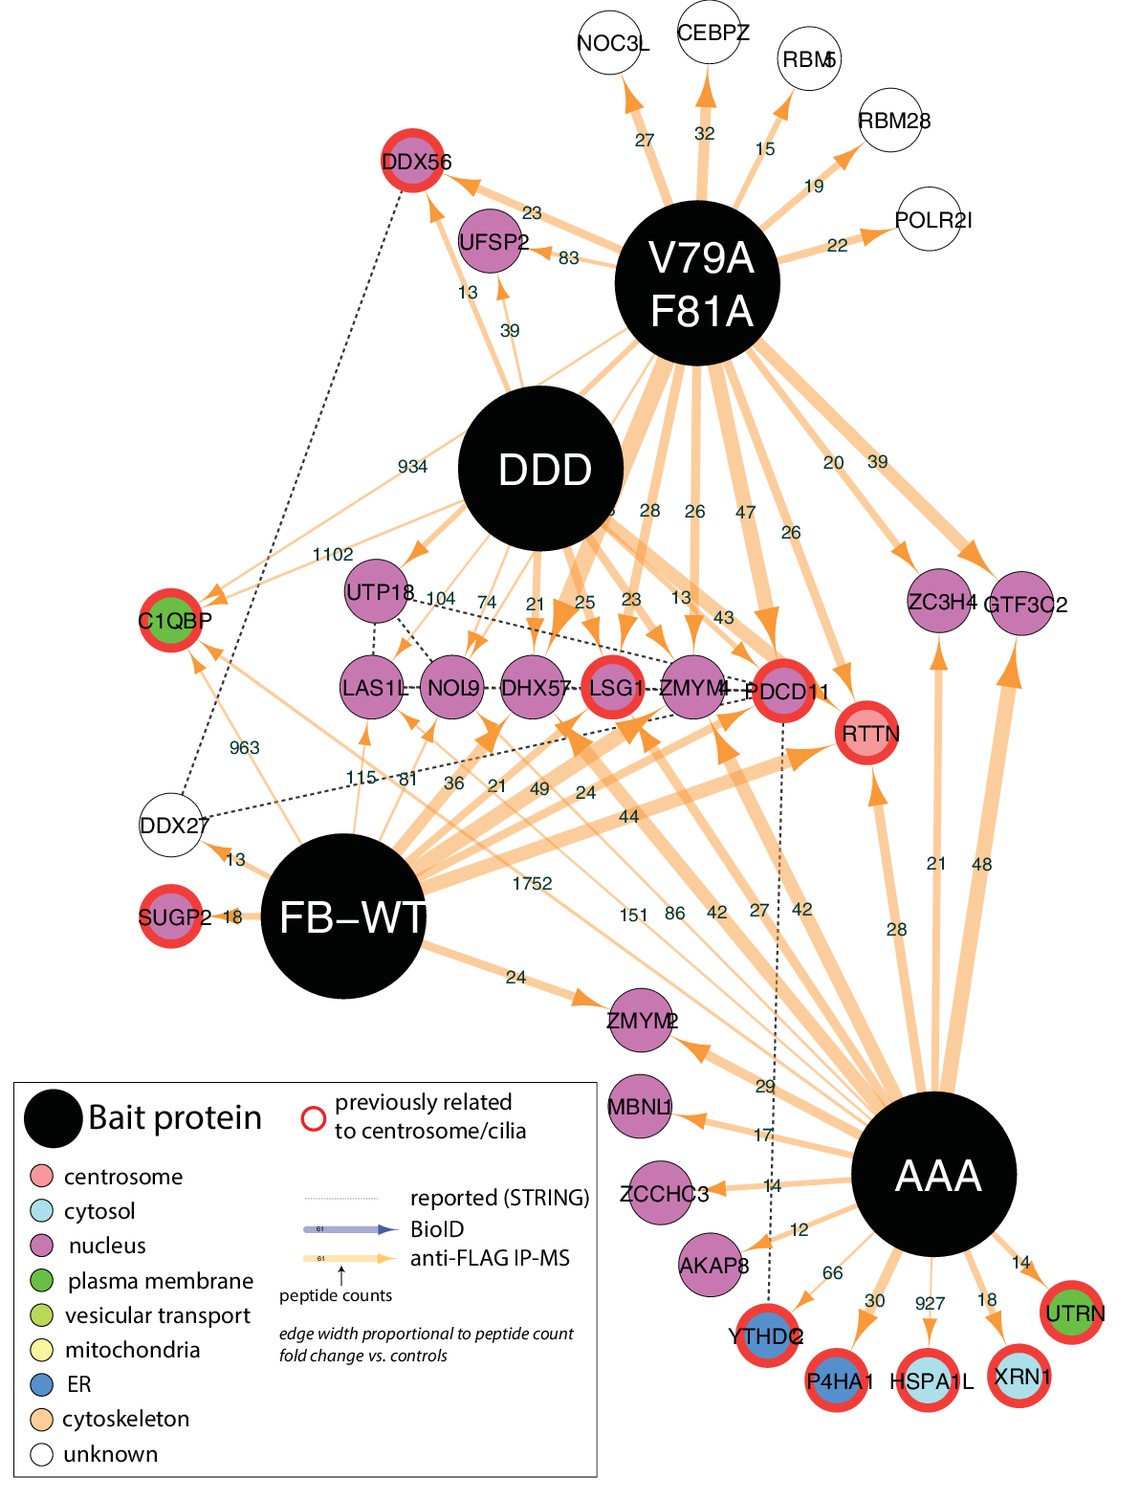
Summary of high-confidence immunoprecipitation hits for V79A, F81A PPP1R35 and phosphomutants.
FB-WT, FLAG-BirA*-PPP1R35 (WT); DDD, S45D,S47D,S52D mutant; AAA, S45A,S47A,S52A mutant.
Figure 5—figure supplement 4
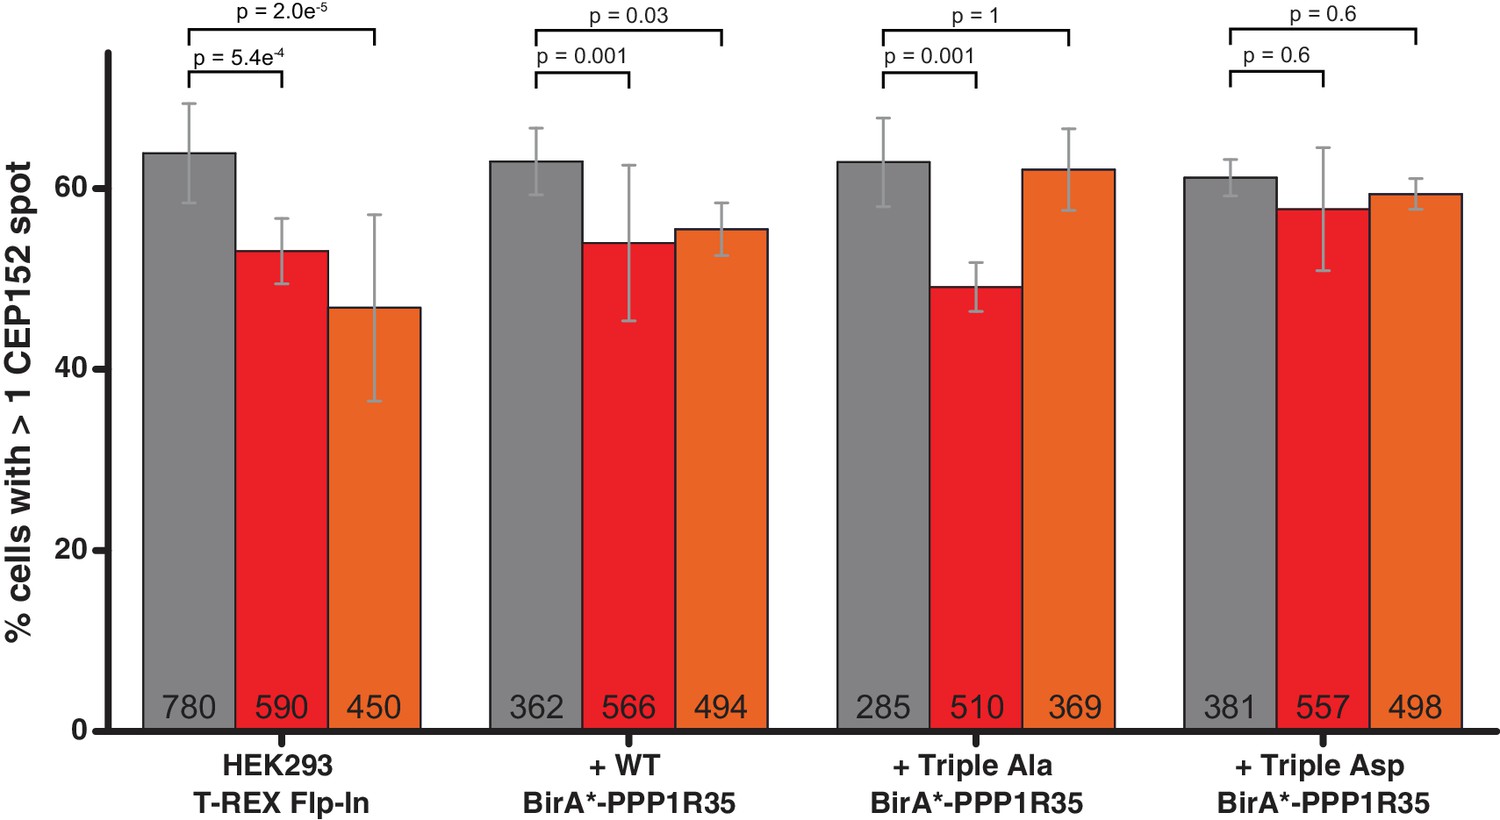
siRNA and rescue of HEK293 Flp-In TREX expressing GFP-PPP1R35.
PPP1R35 protein levels were reduced in HEK293 Flp-In TREX cells by treatment with siRNAs targeting either an exon (red bars) or the 3’ untranslated region (UTR; orange bars) of the mRNA. In both cases, PPP1R35 knockdown resulted in decreased centrosome number in cells as measured by staining for CEP152, a protein recruited in the later stages of centrosome duplication, compared with that of a control sample treated with a non-targeting scrambled siRNA sequence (grey bars). This phenotype was rescued by exogenously expressing either the WT BirA*-PPP1R35 construct or either the Triple Ala (S45A,S47A,S52A) BirA*-PPP1R35 or Triple Asp (S45D,S47D,S52D) BirA*-PPP1R35 constructs. All p values were calculated used Barnard’s test and error bars represent the standard deviation of at least two independent replicates. The numbers in the base of the bars denote the number of cells counted per treated group.
-
Figure 5—figure supplement 4—source data 1
Source data for Figure 5—figure supplement 4 (HEK293 mutant PPP1R35 siRNA).
- https://doi.org/10.7554/eLife.37846.029
Figure 6 with 1 supplement
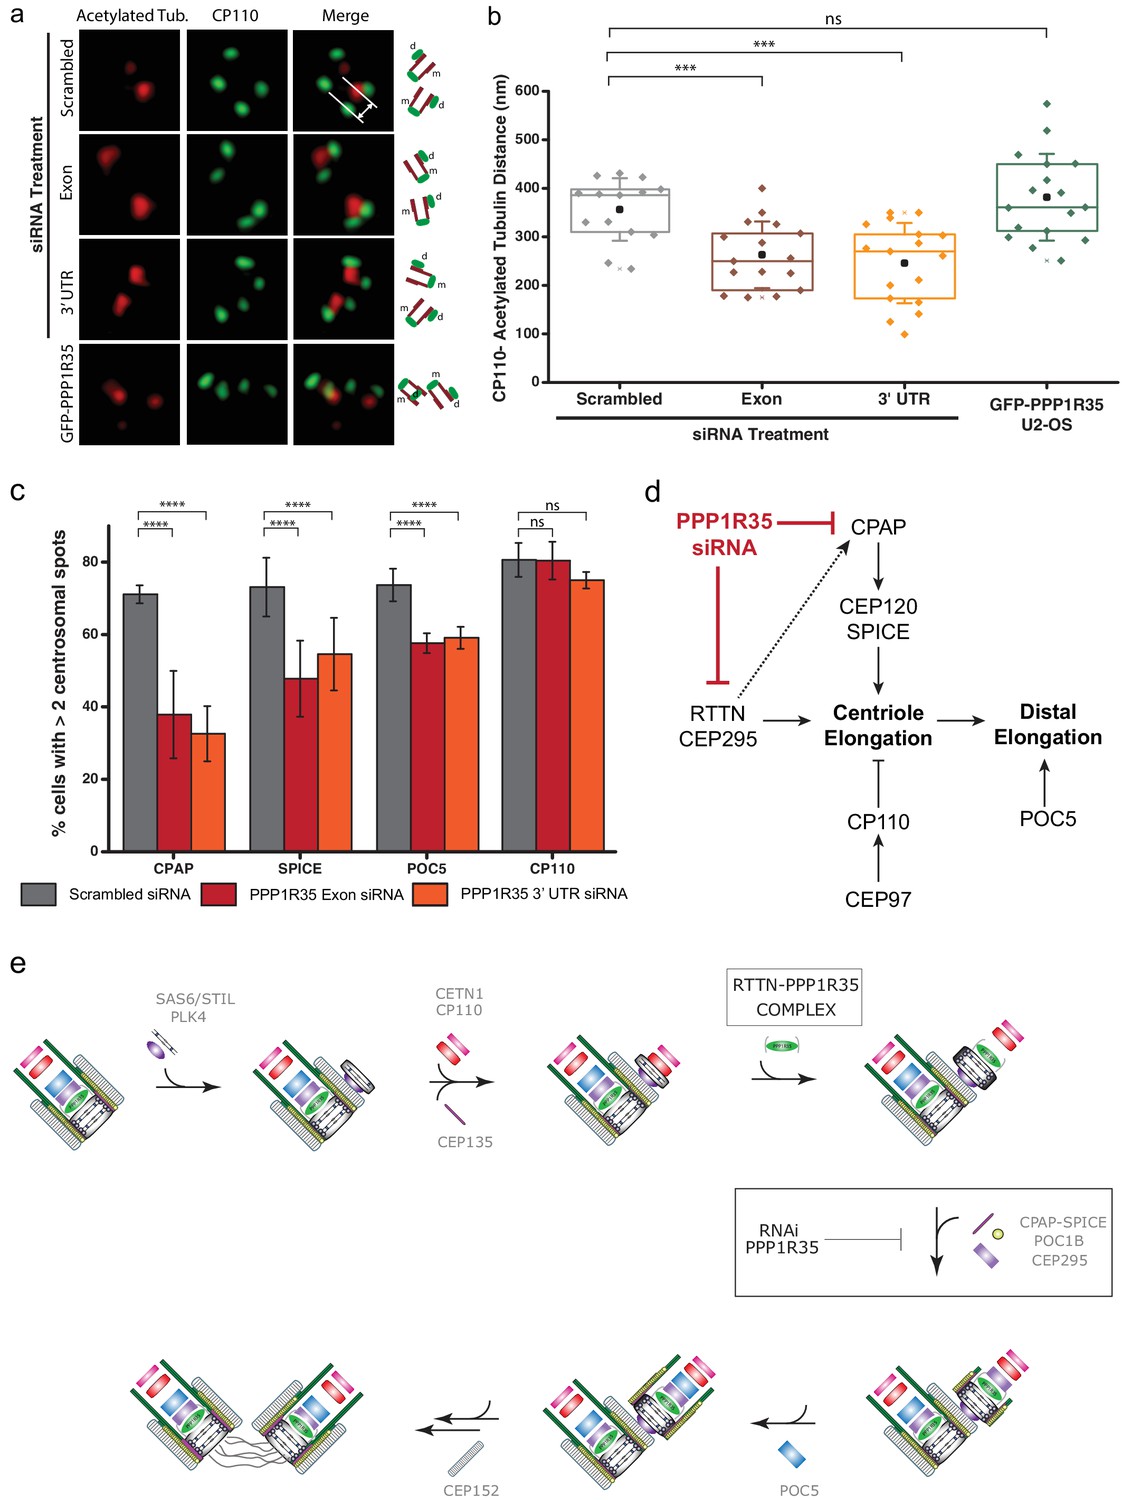
PPP1R35 loss results in short centrioles and impacts recruitment of positive-growth centriolar elongation factors.
(a) Micrographs of representative centrosomes in U2OS cells stained with CP110 (green) and acetylated tubulin (red) with corresponding cartoon representation. By measuring the distances between the fluorescence maxima of CP110 and the proximal end of the acetylated tubulin signals (designated on the top micrograph by the grey lines) on the same z-plane using 3DSIM, the length of the centrioles was measured. (b) The lengths of centrioles from U2OS cells expressing GFP-PPP1R35 (n = 17) or treated with either control, scrambled siRNA (n = 14) or siRNA targeting an exon (n = 16) or 3’UTR of PPP1R35 (n = 17) for 72 hr plotted as a Tukey box and whisker plot. The average distances and standard deviations are noted in the plot. Statistical significance was determined by a two-tailed T-test. (c) To investigate the centriole elongation phenotype, U2OS cells were depleted of PPP1R35 by siRNA targeting an exon (red bars) or 3’UTR (orange bars) of PPP1R35 (grey bars, control siRNA) and subsequently stained for various proteins involved in centriole elongation. Statistics for significance were determined using Barnard’s test. Statistical values can be found in Supplementary file 4. (d) Our data demonstrate that PPP1R35 is involved in the CPAP-CEP120-SPICE pathway of centriole elongation and does not impact the CP110-CEP97 pathway, which restricts centriole elongation. (e) Proposed model of PPP1R35 function and mechanism in centriole biogenesis. In this study, we localized PPP1R35 to the proximal lumen of the centriole. By depleting cells of PPP1R35 via siRNA, we identify the step of its recruitment during centriole biogenesis to after cartwheel formation together with the microcephaly protein RTTN. Loss of PPP1R35 results in diminished CPAP, SPICE, POC1B and CEP295 with concomitant loss of downstream components including POC5 and CEP152. The loss of these components, implicated in centriole elongation, results in shortened centrioles.
-
Figure 6—source data 1
Source data for Figure 6b (centriole length measurements) and 6c (centriole elongation protein recruitment).
- https://doi.org/10.7554/eLife.37846.034
Figure 6—figure supplement 1
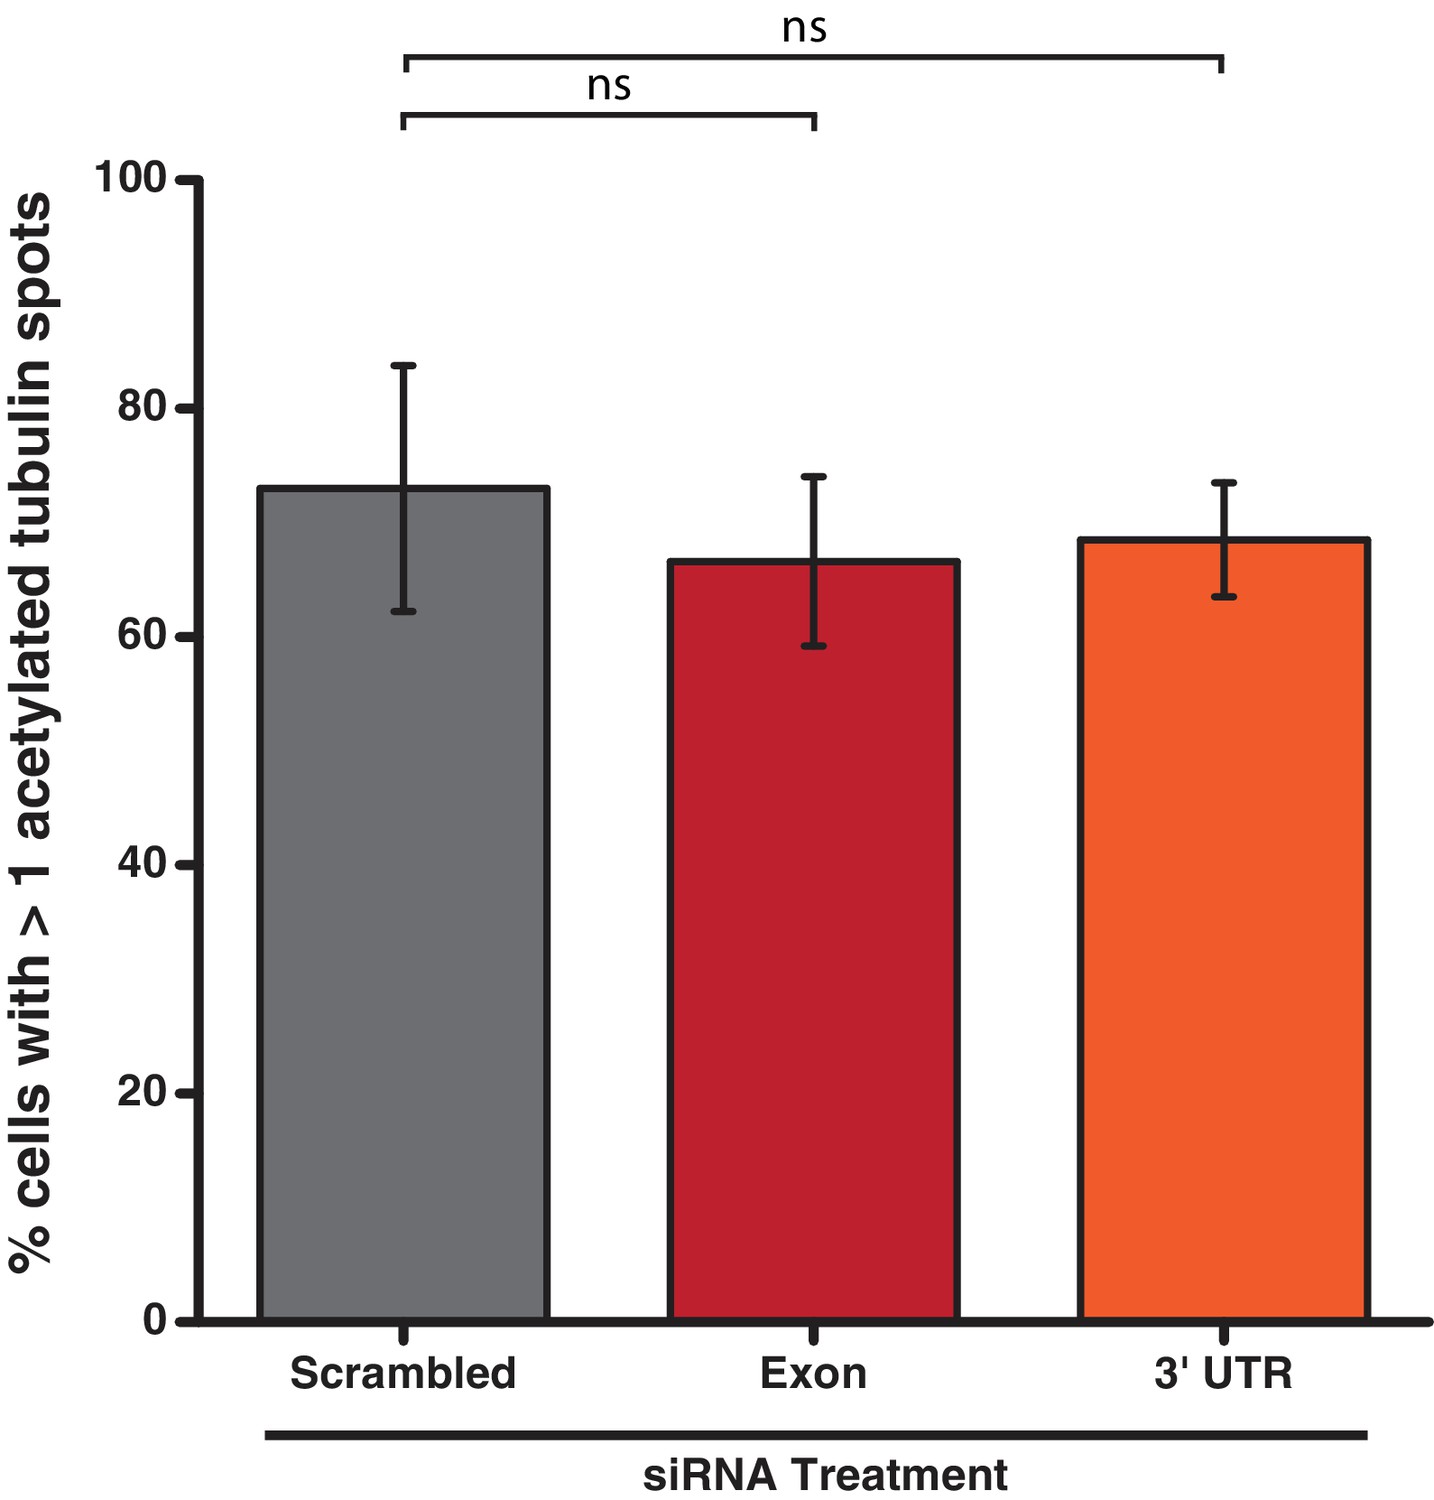
Acetylated tubulin staining of U2OS cells treated with siRNA targeting PPP1R35.
PPP1R35 protein levels were reduced in U2OS cells by treatment with siRNAs targeting either an exon (red bars) or the 3’ untranslated region (UTR; orange bars) of the mRNA. In both cases, PPP1R35 knockdown did not result in a significant decrease in acetylated tubulin stained centrosomes compared with that of a control sample treated with a non-targeting scrambled siRNA sequence (grey bars). All p values were calculated used Barnard’s test and error bars represent the standard deviation of three independent replicates.
-
Figure 6—figure supplement 1—source data 1
Source data for Figure 6—figure supplement 1 (PPP1R35 siRNA labeled with antibody against acetylated tubulin).
- https://doi.org/10.7554/eLife.37846.033
Videos
Video 1
Live-cell imaging movie of U2OS cells expressing GFP-PPP1R35.
Confocal microscopy movie of live U2OS cells stably expressing GFP-PPP1R35.
Tables
Key resources table
| Reagent type (species) or resource | Designation | Source or reference | Identifiers | Additional information |
|---|---|---|---|---|
| Gene (human) | PPP1R35 | MGC clone, TCAG (SickKids) | 4773899 | |
| Gene (human) | RTTN | GE Dharmacon ORFeome | 25914 | |
| Cell line (human) | U2OS | ATCC | HTB-96, RRID: CVCL_0042 | |
| Cell line (human) | HEK293 TREX Flp-In | Thermo Fisher Scientific | R78007, RRID: CVCL_U427 | |
| Cell line (human) | U2OS Flp-In | Trimble Lab/SickKids | Generous gift from Trimble Lab | |
| Antibody | GFP | Abcam | ab13970, RRID: AB_300798 | 1:2000 (IF) |
| Antibody | mCherry | Life Technologies | M11217, RRID: AB_2536611 | 1:200 (IF) |
| Antibody | CETN1 | Millipore | 04–1624, RRID: AB_10563501 | 1:200 (IF) |
| Antibody | CEP152 | Bethyl | A302-480A, RRID: AB_1966084 | 1:500 (IF) |
| Antibody | CEP135 | Bethyl | A302-250A, RRID: AB_1730796 | 1:500 (IF) |
| Antibody | CPAP | ProteinTech | 11517–1-AP, RRID: AB_2244605 | 1:50 (IF) |
| Antibody | SAS6 | Santa Cruz | sc-81431, RRID: AB_1128357 | 1:200 (IF) |
| Antibody | POC5 | Bethyl | A303-341A, RRID: AB_10971172 | 1:500 (IF) |
| Antibody | POC1B | Invitrogen | PA5-24495, RRID: AB_2541995 | 1:50 (IF) |
| Antibody | Gamma-Tubulin | Sigma | T6557, RRID: AB_477584 | 1:5000 (IF) |
| Antibody | CEP250 | ProteinTech | 14498–1-AP, RRID: AB_2076918 | 1:50 (IF) |
| Antibody | CEP295 | Abcam | ab122490, RRID: AB_11129892 | 1:100 (IF) |
| Antibody | RTTN | Abcam | ab113541 | 1:50 (IF) |
| Antibody | Polyglutamylated tubulin | AdipoGen | AG-20B-0020-C100 | 1:400 (IF) |
| Antibody | CP110 | ProteinTech | 12780–1-AP, RRID: AB_10638480 | 1:200 (IF) |
| Antibody | SPICE | Atlas | HPA064843, RRID: AB_2685367 | 1:500 (IF) |
| Antibody | GAPDH | Abcam | ab181602, RRID: AB_2630358 | 1:500 (IF); 1:1000 (Western Blot) |
| Antibody | GAPDH | Millipore | MAB374, RRID: AB_2107445 | 1:200 (IF) |
| Antibody | GFP (for Westerns) | Life Technologies | A11122, RRID: AB_221569 | 1:2000 (Western Blot) |
| Antibody | FLAG-tag | Sigma | F3165-1MG | 1:500 (IF) |
| Antibody | Anti-rabbit HRP (for Westerns) | Cell Signalling | 7074S, RRID: AB_2099233 | 1:2000 (Western Blot) |
| Antibody | PPP1R35 | ProteinTech | 24214–1-AP | 1:50 (IF) |
| Antibody | Acetylated tubulin | Sigma | T7451, RRID: AB_609894 | 1:400 (IF) |
| Antibody | γ-tubulin | Sigma | T6557, RRID: AB_477584 | 1:5000 (IF) |
| Recombinant DNA reagent | pIRES Centrin 1 mCherry | Addgene | 64338 | Deposited by Matthieu Piel |
| Recombinant DNA reagent | pcDNA5-FRT- To-Sept2p | DOI: 10.1083/jcb.201106131 | Created by Moshe Kim | |
| Recombinant DNA reagent | pcDNA5/FLAG/ TO-FLAG-BirA* | 10.1074/mcp.M114.045658 | Created by the Raught Lab | |
| Recombinant DNA reagent | pcDNA5/FLAG/ TO-BirA*-FLAG | 10.1074/mcp.M114.045658 | Created by the Raught Lab | |
| Recombinant DNA reagent | pOG44 | Thermo Fisher Scientific | V600520 | |
| Sequence-based reagent | Scrambled siRNA | Ambion (Life Technologies) | 4390844 | |
| Sequence- based reagent | GAPDH siRNA | Ambion (Life Technologies) | 4390850 | |
| Sequence-based reagent | PPP1R35, exon siRNA | Ambion (Life Technologies) | s48124 | |
| Sequence-based reagent | PPP1R35, 3' UTR siRNA | Ambion (Life Technologies) | s195859 | |
| Sequence-based reagent | RTTN siRNA | Ambion (Life Technologies) | RTTNHSS119506 | |
| Commercial assay or kit | PureLink PCR Purification Kit | Thermo Fisher Scientific | K310001 | |
| Commercial assay or kit | DNA Gel Extraction Kit | Qiagen | 28704 | |
| Commercial assay or kit | Gibson Assembly Kit0 | New England Biolabs | E2611S | |
| Commercial assay or kit | QuikChange II XL Lightning Mutagenesis Kit | Agilent | 200523 | |
| Commercial assay or kit | Mycoplasma Detection Kit | Invitrogen | M7006 | |
| Commercial assay or kit | JetPrime Transfection Reagent | Polyplus | 114–07 | |
| Commercial assay or kit | Lipofectamine RNAiMax | Invitrogen | 13778150 | |
| Commercial assay or kit | GeneJet RNA Purification Kit | Thermo Fisher Scientific | K0731 | |
| Commercial assay or kit | RapidOut DNA Removal Kit | Thermo Fisher Scientific | K2981 | |
| Commercial assay or kit | iScript cDNA Synthesis Kit | BioRad | 1708890 | |
| Commercial assay or kit | SsoAdvanced Universal SYBR Green Supermix | BioRad | 1725271 | |
| Software, algorithm | Barnard's Test (R Package) | Kamil Erguler | https://github.com/kerguler/Barnard |
Additional files
-
Supplementary file 1
Raw BioID and Immunoprecipitation Data.
Compilation of all BioID and immunoprecipitation data for all BirA*-tagged constructs used in this study.
- https://doi.org/10.7554/eLife.37846.035
-
Supplementary file 2
Primers used in this study.
Unless otherwise noted, all primers were used as a part of a Gibson Assembly based cloning strategy.
- https://doi.org/10.7554/eLife.37846.036
-
Supplementary file 3
Sequences and manufacture’s ID for siRNAs used in this study.
All siRNAs were from Ambion (by Life Technologies) except for RTTN that was from Thermo/Invitrogen. Upper case letters represent bases that are present in the target’s mRNA sequence.
- https://doi.org/10.7554/eLife.37846.037
-
Supplementary file 4
Summary of all statistics used in this study.
Corresponding figure numbers are indicated. All statistics in this table were conducted using Barnard's Exact Test, unless otherwise noted.
- https://doi.org/10.7554/eLife.37846.038
-
Transparent reporting form
- https://doi.org/10.7554/eLife.37846.039
Download links
A two-part list of links to download the article, or parts of the article, in various formats.
Downloads (link to download the article as PDF)
Open citations (links to open the citations from this article in various online reference manager services)
Cite this article (links to download the citations from this article in formats compatible with various reference manager tools)
PPP1R35 is a novel centrosomal protein that regulates centriole length in concert with the microcephaly protein RTTN
eLife 7:e37846.
https://doi.org/10.7554/eLife.37846


