Cis-activation in the Notch signaling pathway
- California Institute of Technology, Howard Hughes Medical Institute, United States
Figures
Figure 1 with 4 supplements

Engineered CHO-K1 N1D1 + Rfng cells show ligand-dependent cis-activation.
(A) Schematic of actual and potential cis- and trans-interaction modes in the Notch pathway. (B) Schematic of the N1D1 + Rfng cell line. CHO-K1 cells were engineered to express a chimeric receptor combining the Notch1 extracellular domain (‘N1ECD’, green) with the Gal4 transcription factor (orange) in place of the endogenous intracellular domain. When activated, released Gal4 activates a stably integrated fluorescent H2B-Citrine reporter gene (yellow) through UAS sites (brown) on the promoter. Cells also contain a stably integrated construct expressing Dll1 (red) with a co-translational (2A, white) H2B-mCherry readout (‘mCH’, red), from a 4-epiTc-inducible promoter. Cells also constitutively express Rfng (purple) and H2B-Cerulean (‘H2B-Cer’, blue). (C) (Left) Schematic of cis-activation assay conditions. A minority of N1D1 + Rfng (blue nuclei) cells were mixed with an excess of wild-type CHO-K1 cells (white nuclei). The typical distance between N1D1 + Rfng cells is ∆x. (Right) Filmstrip showing activation (Citrine fluorescence, green) of an isolated N1D1 + Rfng cell using time-lapse microscopy. Constitutive cerulean fluorescence (blue) in the same cell nucleus is also shown (see Video 1 for additional examples). (D) Peak Notch activation rate in isolated N1D1 + Rfng cells (y-axis) versus distance to each of its closest neighboring N1D1 + Rfng cell (x-axis) at the point of maximum activity. One cell width is indicated by gray shaded area. Solid blue line indicates linear fit, whose flat slope suggests a cell-autonomous, distance-independent process. (E) Box plots showing the distribution of peak Notch activation rates in isolated N1D1 + Rfng cells prior to the first cell division in the cis-activation assay, for three different median Dll1 induction levels (indicated by numbers below bars; see Figure 1—figure supplement 2A for corresponding distributions).
Figure 1—figure supplement 1
Cis-activation assay enables isolation of individual engineered cells.
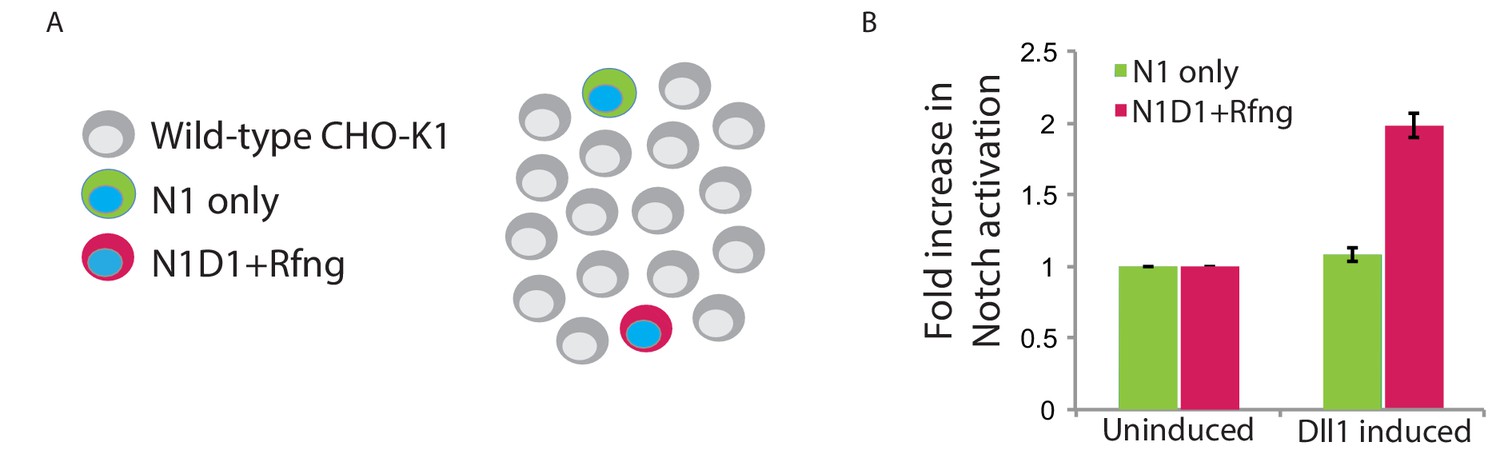
(A) Schematic of ‘control’ cis-activation assay used to verify that the relative density of cells was low enough to prevent trans-interactions. N1D1 + Rfng cells lacking H2B-Cerulean expression (magenta, 0.5%) were mixed with Notch receiver cells containing H2B-Cerulean expression (‘N1 only’, green, 0.5%), and plated with an excess of wild-type CHO-K1 cells (grey), with or without addition of 80 ng/ml 4-epiTc for Dll1 induction. Blue nuclei represent constitutive H2B-Cerulean expression. (B) Mean Notch activation levels (measured by flow cytometry) in N1D1 + Rfng (magenta) and N1-only (green) cells. N1D1 + Rfng and N1-only cell activation was determined by Citrine levels in cells gated on mCherry expression or Cerulean expression, respectively (Note: uninduced N1D1 + Rfng cells express a low basal level of mCherry protein which enables identification). Data was normalized to background Citrine levels in cells not induced to express Dll1 (‘uninduced’). Dll1 expression increases activation of N1D1 + Rfng cells but not N1-only cells. Error bars represent the s.e.m of n = 3 replicates. $$BOX_TXT_END$$.
Figure 1—figure supplement 2
Cis- and trans-activation share similar features.
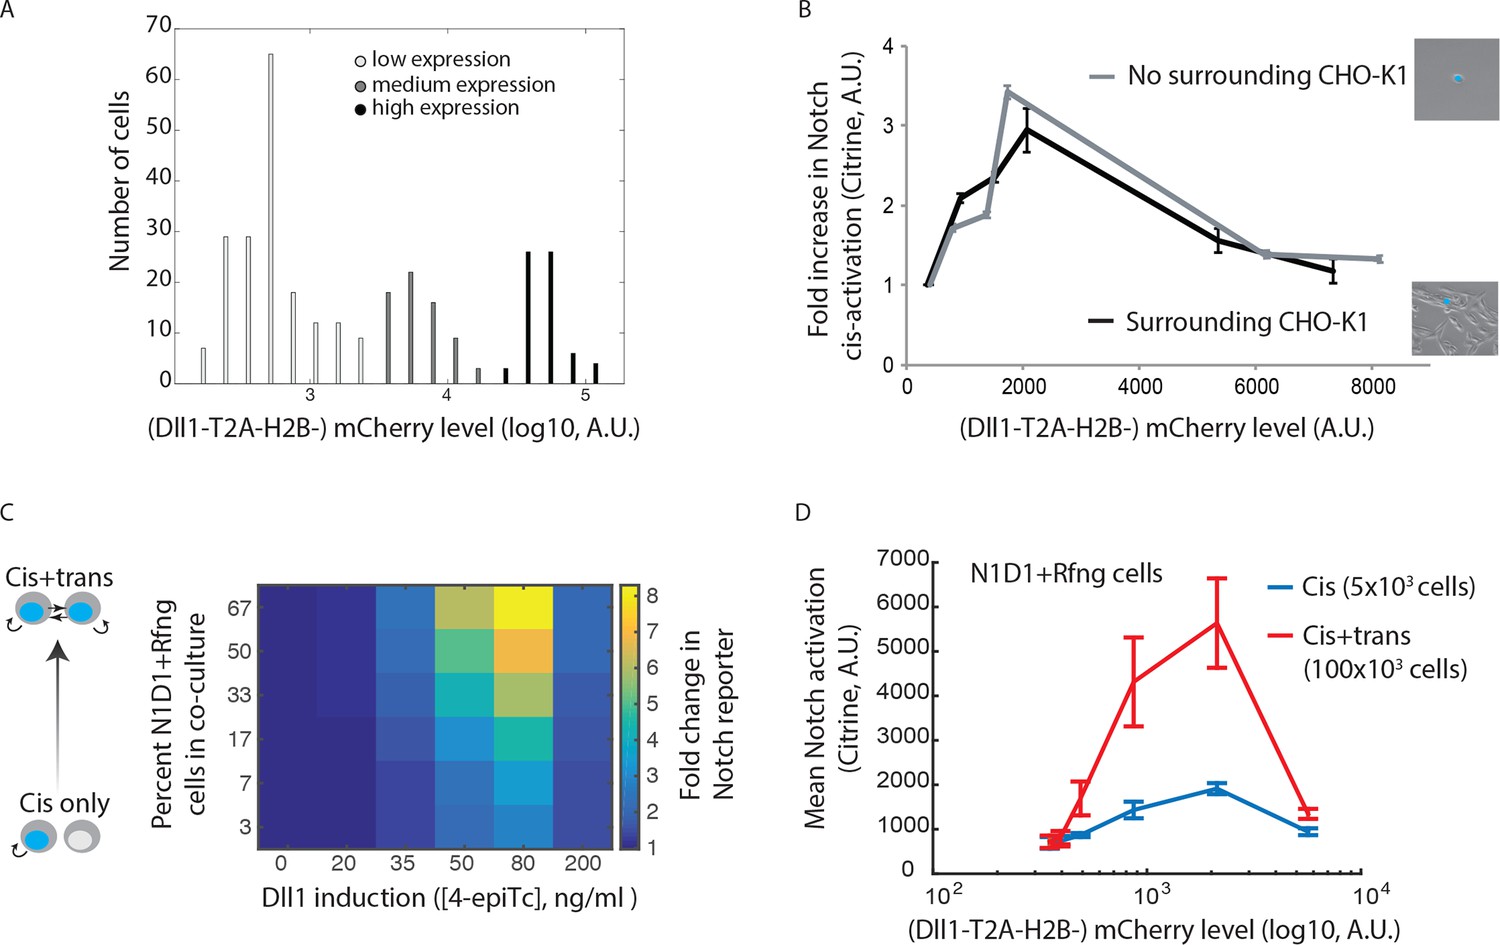
(A) Histograms of mCherry fluorescence in cells analyzed in Figure 1E. Cells were categorized as expressing low, medium, or high Dll1 levels (shades of grey). (B) Fold increase in isolated, or CHO-K1 surrounded, N1D1+Rfng cells’ mean Notch activation levels compared to uninduced cells. N1D1+Rfng cells (represented by blue dot in images), either plated alone or surrounded by CHO-K1 wild-type cells, were used in a cis-activation assay (see Materials and methods). Notch activation levels (Citrine expression) were measured using flow cytometry. The same ligand dependent, non-monotonic cis-activation behavior was observed for isolated and CHO-K1 surrounded N1D1_Rfng cells. Error bars represent s.e.m. of 2 replicates. (C) (Left) Schematic showing that total activation levels represent different relative contributions from cis- and trans-activation as the fraction of N1D1+Rfng cells increases. At the lowest fraction analyzed (lowest row of matrix, 5x10³ N1D1+Rfng and 150x103 wild-type CHO-K1 cells), activation represents cis-activation, while increasing the fraction of N1D1+Rfng cells (higher rows) leads to a larger contribution of trans-activation to the total signal. (Right) Heatmap of the fold change in mean Citrine levels in N1D1+Rfng cells, relative to background Citrine levels, for a range of relative cell fractions and Dll1-induction levels. Rows defined above. Columns correspond to different concentrations of the inducer, 4-epiTc. Cells were plated under the indicated conditions and analyzed less than 24 hr later by flow cytometry. Data represents 3 replicate experiments. (D) Comparison of mean activation in N1D1+Rfng cells plated at lowest (cis, blue line) or highest (cis+trans, red line) relative density as a function of mCherry levels, which provide a co-translational readout of Dll1 expression. Error bars represent s.e.m. of 3 replicates.
Figure 1—figure supplement 3
Cis-activation occurs with the wild-type Notch1 receptor and in multiple cell types.
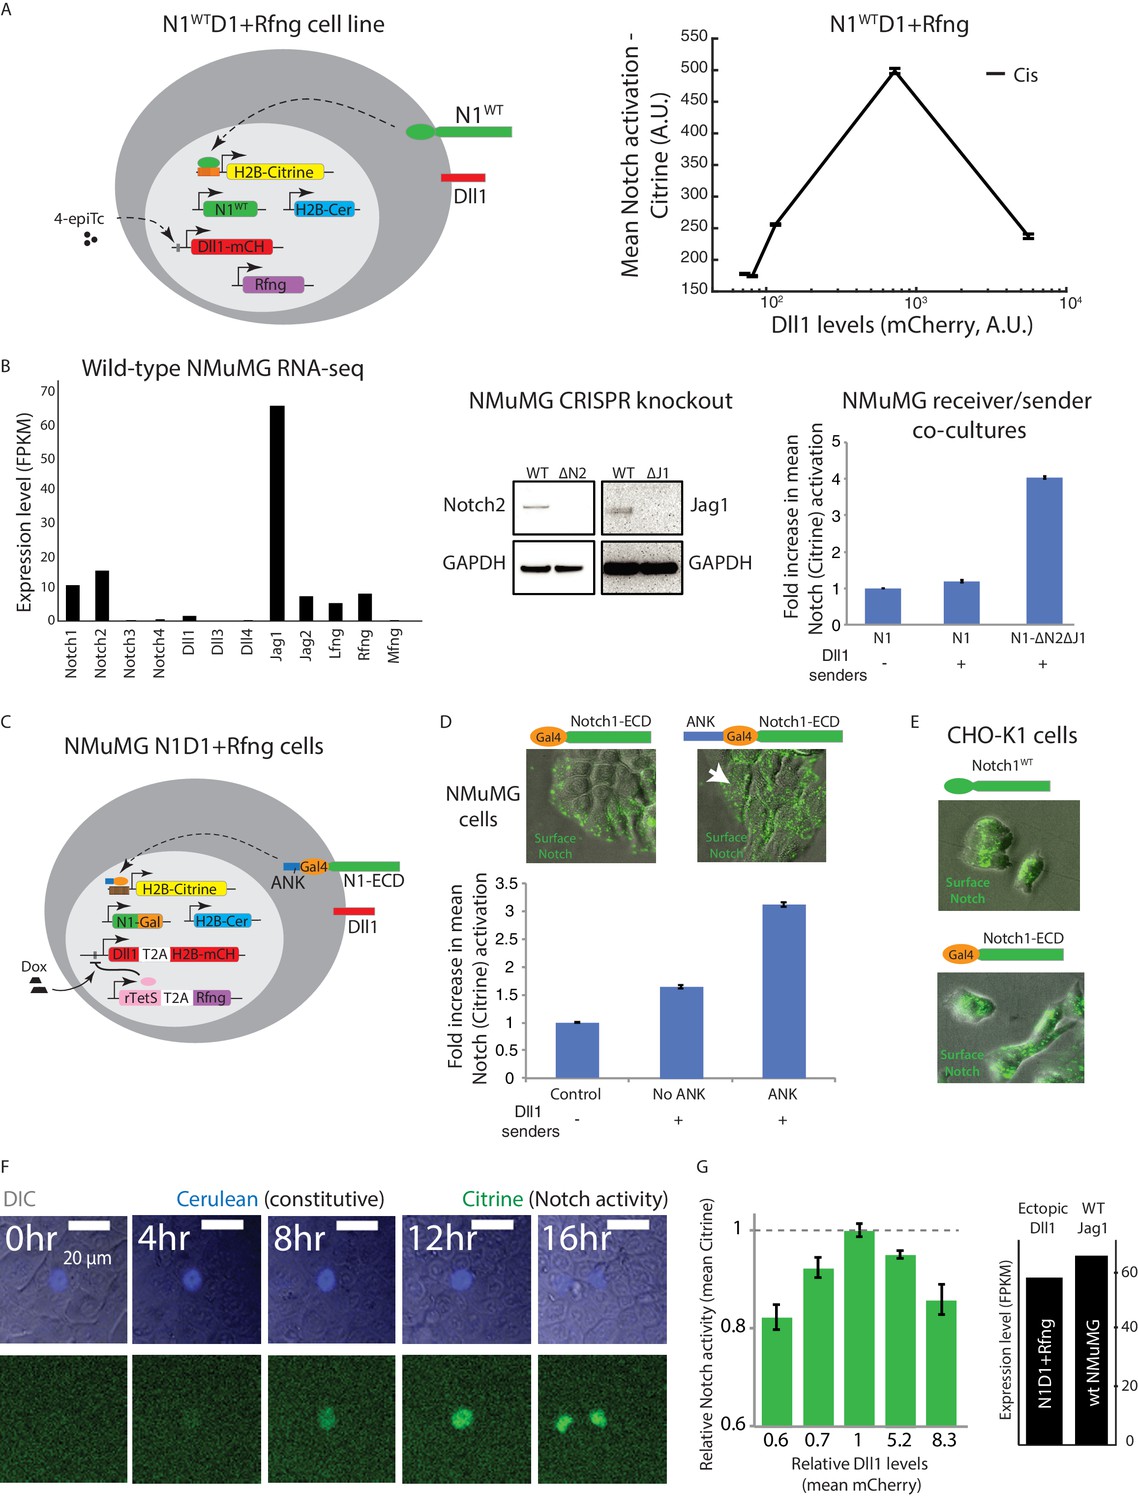
(A) (Left) The N1WTD1+Rfng cell line (schematic). CHO-K1 cells were engineered to express wild-type Notch1 receptor (‘N1WT’, green), an H2B-Citrine reporter (yellow) activated by cleaved NICD through 12 multimerized CSL binding sites in the promoter region (orange), and a Dll1-mCherry protein (red), from a 4-epiTc inducible promoter. Constructs for constitutive expression of Rfng (purple) and H2B-Cerulean (‘H2B-Cer’, blue) were also stably integrated. (Right) Flow cytometry analysis of the mean activation of N1WTD1+Rfng cells in the cis-activation assay. The non-monotonic dependence of activation on ligand levels qualitatively resembles that observed for N1D1 + Rfng cells (Figure 1). (B) (Left) Expression levels of Notch receptors, ligands, and Fringes in wild-type NMuMG cells, measured using RNAseq. (Middle) Western blot analysis of endogenous Notch2 and Jagged1 after CRISPR-Cas9 mediated knockout in NMuMG cells. Notch2 and Jagged1 are visible in wild-type (WT) cells but absent in knockout cells (ΔN2ΔJ1). (Right) Activation level of WT NMuMG N1ECD-Gal4 (N1) and ΔN2ΔJ1 NMuMG N1ECD-Gal4 (N1-ΔN2ΔJ1) receiver cells by co-culture with NMuMG Dll1 sender cells. An equal number of Dll1 cells were cultured with either N1 or N1-ΔN2ΔJ1 receiver cells and analyzed for Notch activation (Citrine levels) by flow cytometry after 48 hr of co-culture. (C) Schematic of the NMuMG N1D1 + Rfng cell line. NMUMG ΔN2ΔJ1 cells were engineered to express a chimeric receptor combining the Notch1 extracellular domain (‘N1ECD’, green) with the Gal4 transcription factor (orange) in place of the endogenous intracellular domain, and fused to the Ankyrin domain of the Notch1ICD (ANK, dark blue). When activated, Gal4-ANK is released and enables activation of a stably integrated fluorescent H2B-Citrine reporter gene (yellow) through UAS sites (brown) on the promoter. A Dll1 (red) with co-translational (T2A, white) H2B-mCherry readout (red), expressed from a Tet-off promoter was also stably integrated. A constitutively expressed rTetR-HDAC4 (‘rTetS’) gene (pink) suppresses expression of the Dll1-T2A-H2B-mCherry cassette in the presence of doxycyline (‘Dox’). Rfng (purple) is expressed co-translationally with rTetS. Cells also constitutively express H2B-Cerulean (‘H2B-Cer’, blue). (D) Representative images showing surface staining (green) of N1ECD-Gal4 (top, left) or N1ECD-Gal4-ANK (top, right) receptors in NMuMG cells (gray overlay shows DIC channel). Notch receptor accumulated baso-laterally and was not observed on apical surfaces in the absence of the ANK domain. Inclusion of the ANK domain restored apical localization (white arrow). Bottom plot shows activation of N1ECD-Gal4 receiver (No ANK) and N1ECD-Gal4-ANK receiver (ANK) cells by co-cultured Dll1 senders. Inclusion of the ANK domain increased Notch activation (Citrine expression). Control cells are Notch receiver cells plated without Dll1 sender cells. (E) Wild-type (top) and engineered (bottom) Notch receptor show similar staining patterns in non-polarized CHO-K1 cells, resembling polarized NMuMG N1ECD-Gal4-ANK cells (D, upper right). (F) Filmstrip showing activation of an isolated NMuMG N1D1 + Rfng cell using time-lapse microscopy in reporter (green) and cerulean (blue) channels (See Video 2 for additional examples). (G) (Left) Mean relative Notch activation (Citrine reporter fluorescence) vs. relative Dll1 expression levels (measured using the co-translational mCherry fluorescent protein) in NMuMG N1D1 + Rfng cells in the cis-activation assay. Values are normalized to Citrine and mCherry expression in untreated cells. Dll1 expression was varied by treating cells with 0, 1, or 10 µg/ml doxycycline or by transfecting in additional Dll1 (Materials and methods). Data represent the mean values across three replicate experiments, and error bars represent s.e.m. (Right) Expression level of ectopic Dll1 in NMuMG N1D1 + Rfng cells (untreated, equivalent to value of 1 in plot on left) compared to endogenous Jag1 expression in wild-type NMuMG cells, measured by RNA-seq.
Figure 1—figure supplement 4
Cis-activation occurs with endogenous ligands and receptors in Caco-2 and NMuMG cells.
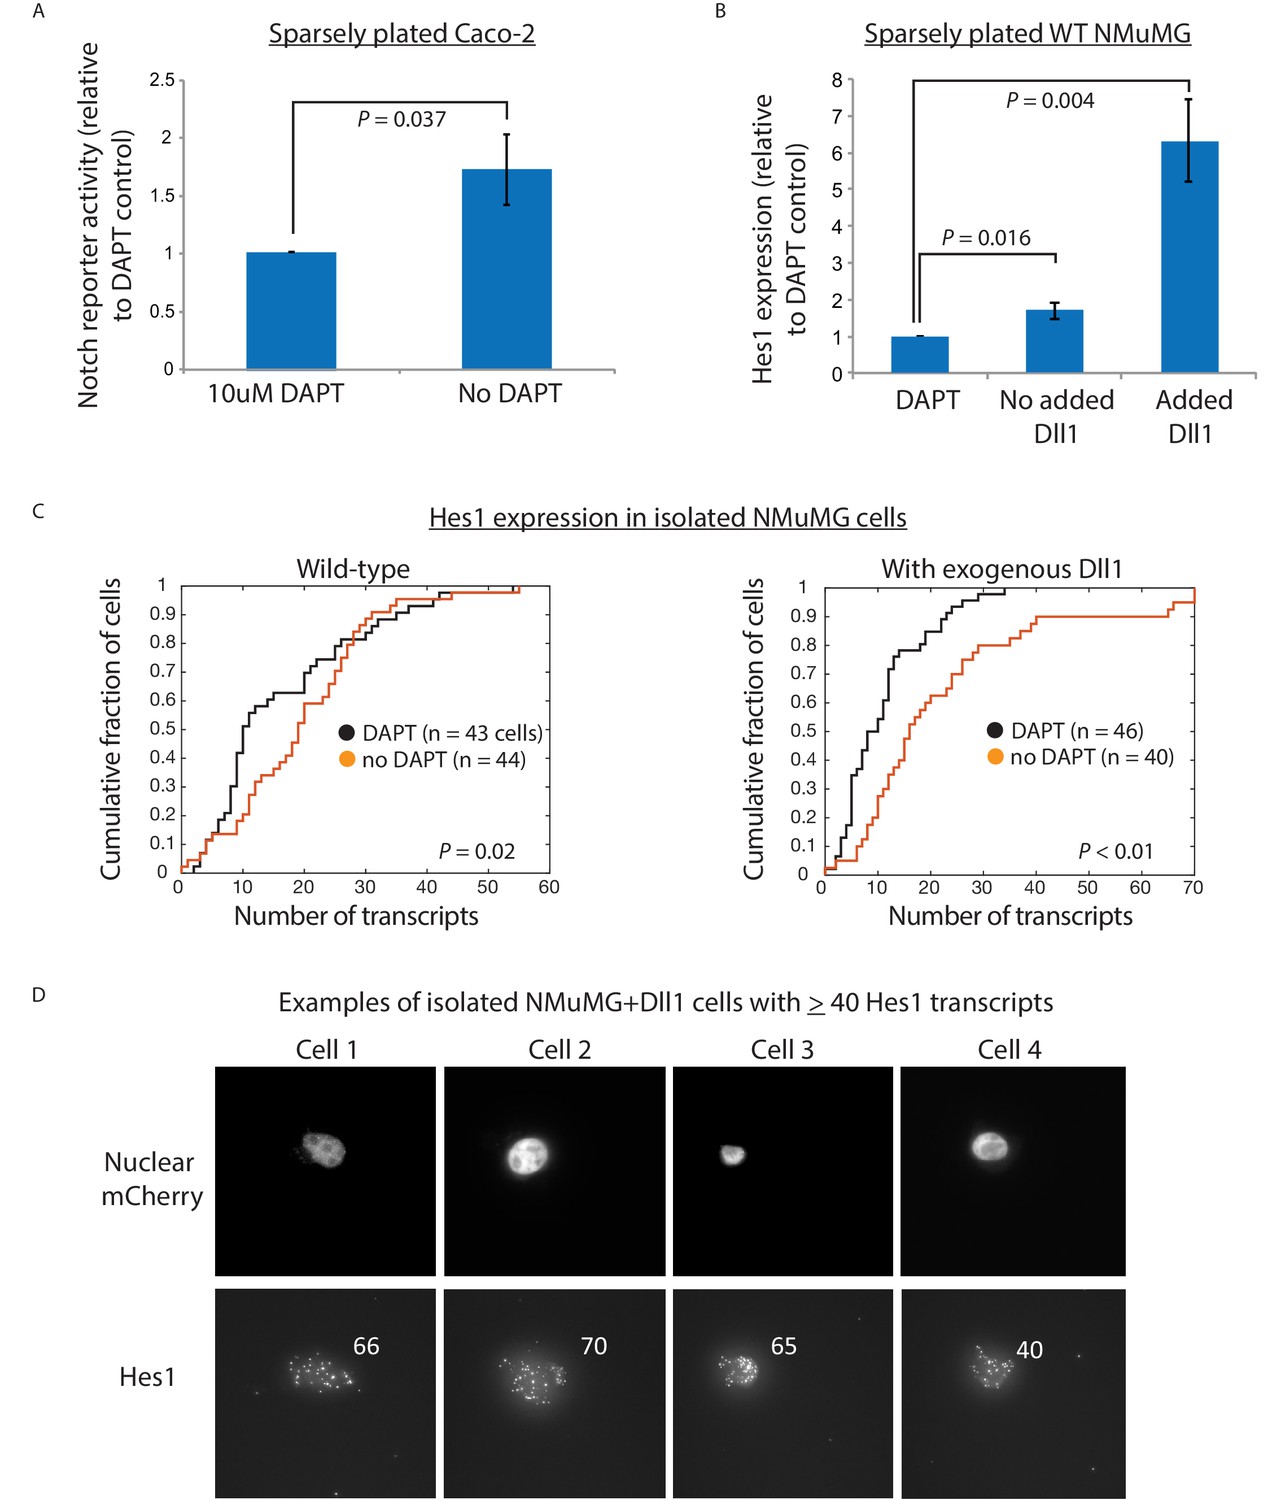
(A) Fold increase in mean Notch activation levels in sparsely plated Caco-2 cells, transfected with the 12xCSL-H2B-Citrine reporter construct, with or without 10 uM DAPT. < 24 hr after plating, endogenous Notch activation was analyzed by flow cytometry. (B) Fold increase in the Notch target gene Hes1 expression levels as assayed by qRT-PCR, 6 hr after DAPT removal from sparsely plated Dll1-expressing or wild-type (WT) NMuMG cells (cells were pre-treated with 10 uM DAPT before plating). Error bars represent s.e.m of 3 replicate experiments. P-values calculated using the one-sided Student T-test. (C) Hes1 mRNA transcript levels (detected using single-molecule HCR-FISH) in isolated wild-type NMuMG cells (left plot) or Dll1-expressing NMuMG cells (right plot), treated with DAPT (black) or left untreated (orange). P-values calculated using two-sided KS-test. (D) Examples of isolated Dll1-expressing NMuMG cells, plated for 6 hr without DAPT, showing > 40 transcripts of Hes1. Note that there are no cells in the DAPT-treated sample that show comparable Hes1 levels (see panel C, right plot).
Figure 2 with 2 supplements

Cis-activation is affected by changes in ligand-receptor affinity.
(A) (Top) Cell lines used for analyzing effect of Rfng on cis-activation. (Bottom) Plots showing mean Notch activation (reporter Citrine fluorescence normalized to background fluorescence in uninduced cells) in N1D1 (black) or N1D1 + Rfng (purple) cells expressing different levels of Dll1 (measured using co-translational mCherry fluorescence). Error bars indicate s.e.m (n = 3 replicate experiments). (B) Heatmaps of mean Notch activation (n = 3 replicates), relative to background reporter fluorescence, in N1D1 + Rfng (upper panel) or N1D1 (lower panel) cells induced with different [4epi-Tc] (columns) and cultured at different relative fractions (rows). Upper panel is the same data in Figure 1—figure supplement 2C, replotted for direct comparison. Rfng expression predominantly affects signal amplitude (compare intensity scales). (C,D) (Top) Cell lines used for analyzing effect of ligand on cis-activation of Notch1 (C) or Notch2 (D). (Bottom) Comparison of mean cis-activation in polyclonal populations (‘Pop’) of cells co-expressing Dll1 or the higher affinity ligand Dll4 with the indicated receptor, as a function of ligand expression, read out by co-translated H2B-mCherry fluorescence. Values represent mean of 3 replicates. Error bars indicate s.e.m. Note difference in y-axis scales between panels C and D.
Figure 2—figure supplement 1
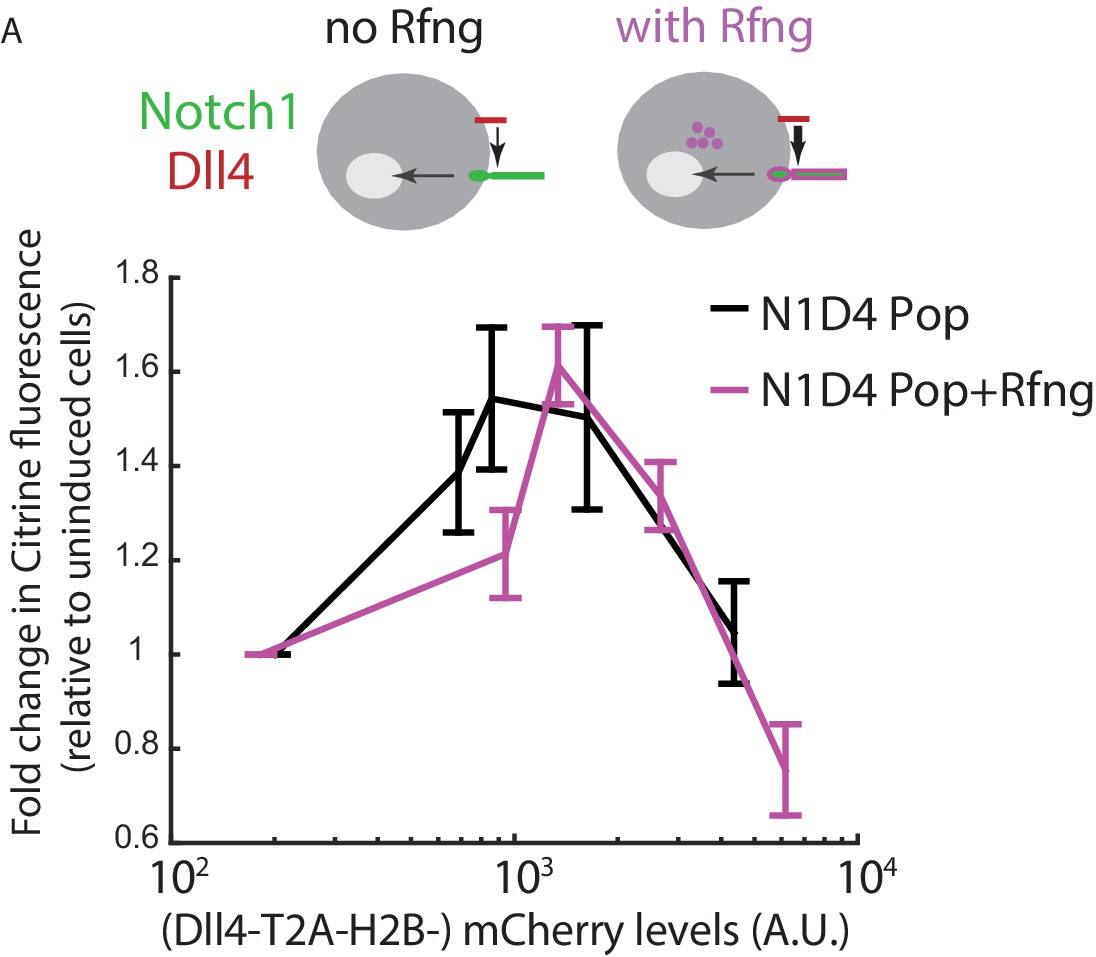
Rfng does not modify the cis-activation behavior of N1D4 cells.
(A) (Top) Cell lines used for analyzing effect of Rfng (purple) on cis-activation, in the context of Notch1 and Dll4. (Bottom) Comparison of mean cis-activation in polyclonal N1D4 cells with (purple, ‘N1D4 Pop + Rfng’) or without (black, ‘N1D4 Pop’) expression of Rfng, as a function of ligand expression (measured using fluorescence of the co-translated H2B-mCherry protein). Values represent mean of 3 replicate experiments, and error bars indicate s.e.m.
Figure 2—figure supplement 2

Notch2 lacks cis-inhibition with Dll1 or Dll4.
(A) Mean Notch activation levels, relative to background reporter fluorescence, in polyclonal N2D1 Pop cells plated on surfaces coated with (black) or without (blue) 2.5 ug/ml recombinant human Dll1 ext -IgG fusion protein (Materials and methods). (B) Mean Notch activation levels, relative to background reporter fluorescence, in polyclonal N2D4 Pop cells plated on surfaces coated with (black) or without (red) 2.5 ug/ml recombinant human Dll1 ext -IgG fusion protein. Values represent the mean of three replicate experiments and error bars represent s.e.m. In A and B, cells were induced to express a range of Dll1/4 levels (measured using co-translated mCherry fluorescence) and cultured under cis-activation assay conditions (5 x 10³ N2D1/4 + 150 x 103 CHO-K1 cells). Note similar activation levels on Dll1 ext -IgG-coated surfaces for all cis Dll1/4 expression levels, suggesting that the Notch2 receptor is not inhibited by co-expressed ligand. Also note that the strength of cis-activation is similar to trans-activation by an excess of plate-bound ligand, suggesting that cis ligands can maximally activate Notch2-expressing cells.
Figure 3 with 1 supplement
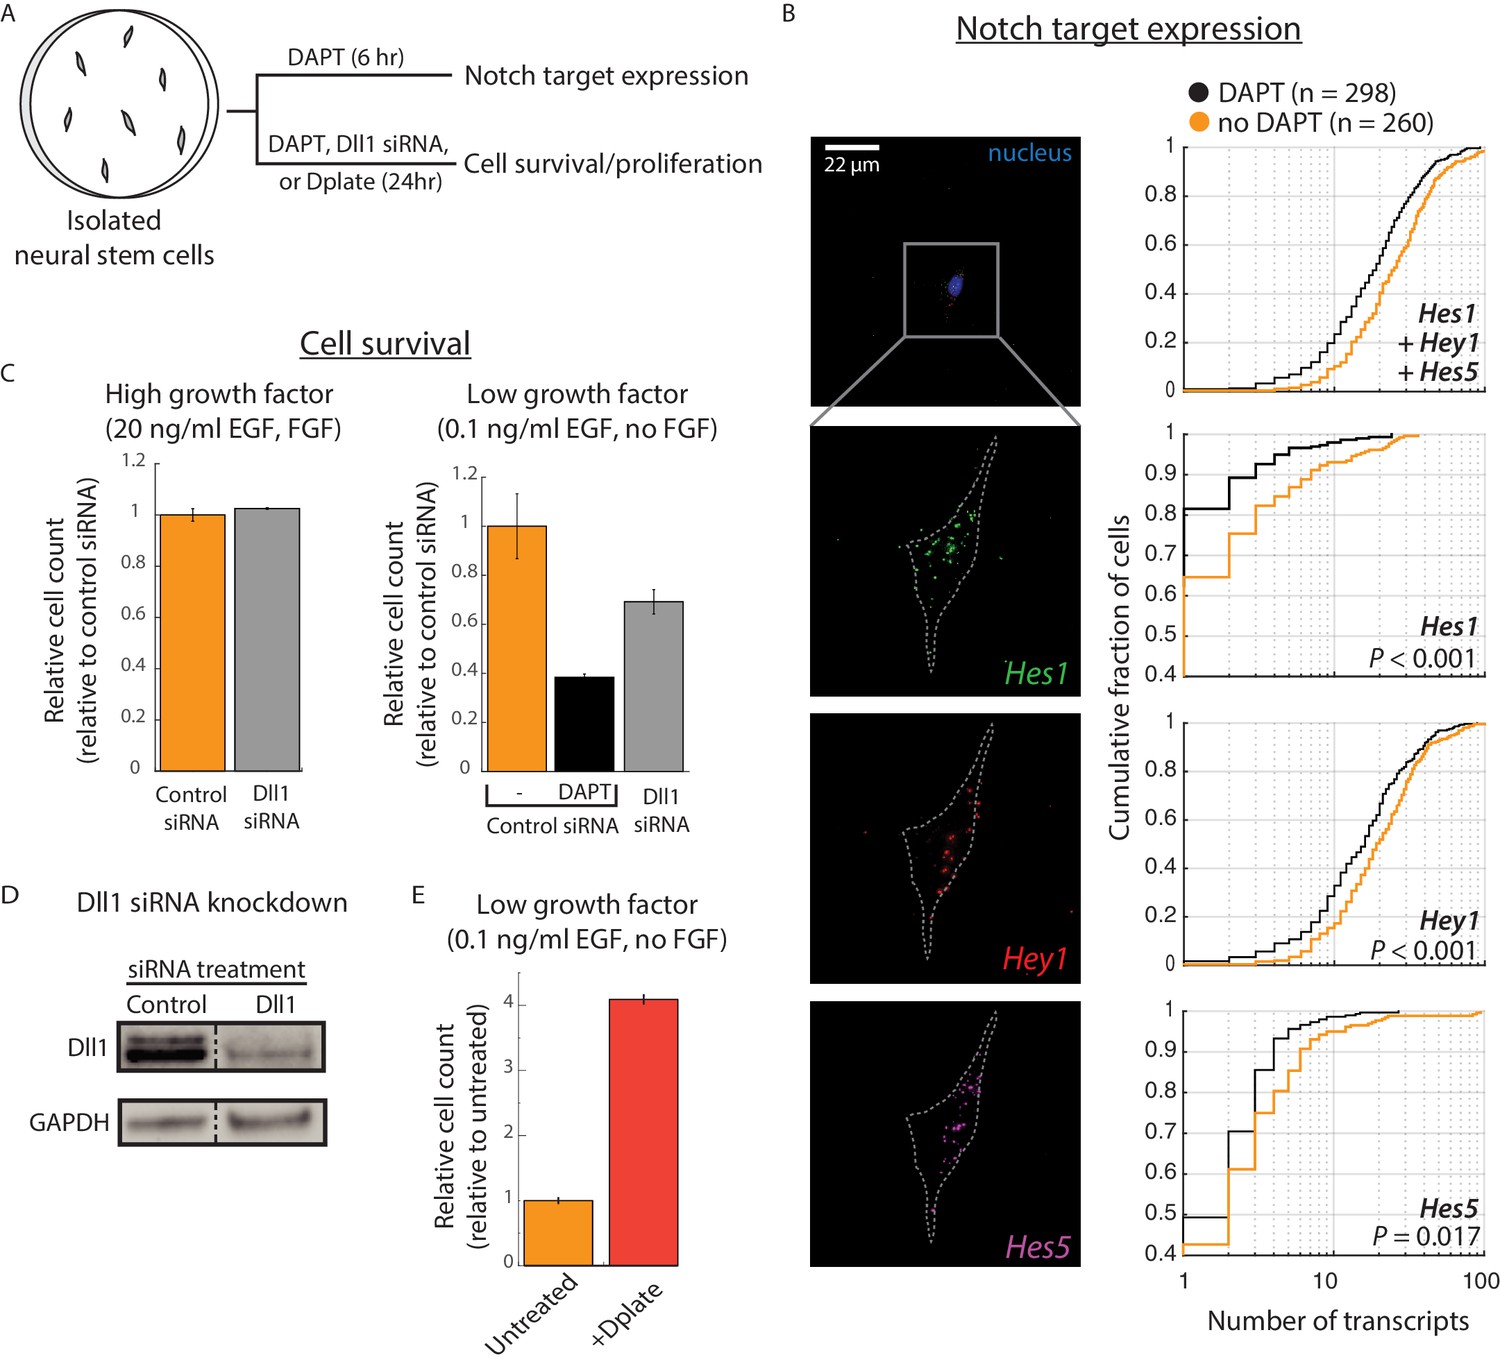
Cis-activation occurs in neural stem cells and regulates survival.
(A) E14.5 mouse cortical neural stem cells (NSCs) were plated sparsely and treated with ± 10 μM DAPT, cultured under growth conditions with low growth factors, and subsequently assayed for expression of Notch target genes and cell survival. (B) (Left) Representative example of an isolated NSC (top panel, DAPI-stained nucleus shown; note lack of neighboring cells within ~ 50 μm) not treated with DAPT, assayed for expression of Hes1 (green), Hey1 (red), and Hes5 (magenta) mRNA using multiplexed single-molecule HCR-FISH (see Materials and methods). (Right) Cumulative distribution plots of gene expression in DAPT-treated (black) and untreated (orange) cells (see Materials and methods for transcript quantification). P-values calculated using two-sided KS-test. See Figure 3—figure supplement 1C for additional examples of isolated cells showing Hes/Hey expression. (C) (Left) Median of relative cell number in samples of isolated cells that were pre-treated with control siRNA (orange, see Materials and methods) or Dll1-targeting siRNA (grey) and cultured in complete growth medium for 24 hr. (Right) Median of relative cell number when the same siRNA-treated cells were cultured in low growth factor medium for 24 hr. Control siRNA treated cells were additionally treated with DAPT for this period. Error bars represent s.e.m, n = 2 biological replicates (D) Western blot analysis of endogenous Dll1 protein after siRNA mediated knockdown in NSCs. Note that Dll1 protein is reduced, but not eliminated, in NSC cells treated with Dll1-targeting siRNA compared to cells treated with control siRNA. GAPDH detection was used to assess protein loading. Dashed line indicates lanes spliced together from a single protein gel. (E) Median of relative cell number after 24 hr in samples of isolated cells plated on normal culture surfaces (orange) or on surfaces coated with recombinant Dll1ext-IgG protein (‘Dplate’, red, see Materials and methods). Cells were cultured in low growth factor conditions. Error bars represent s.e.m, n = 4 biological replicates.
Figure 3—figure supplement 1
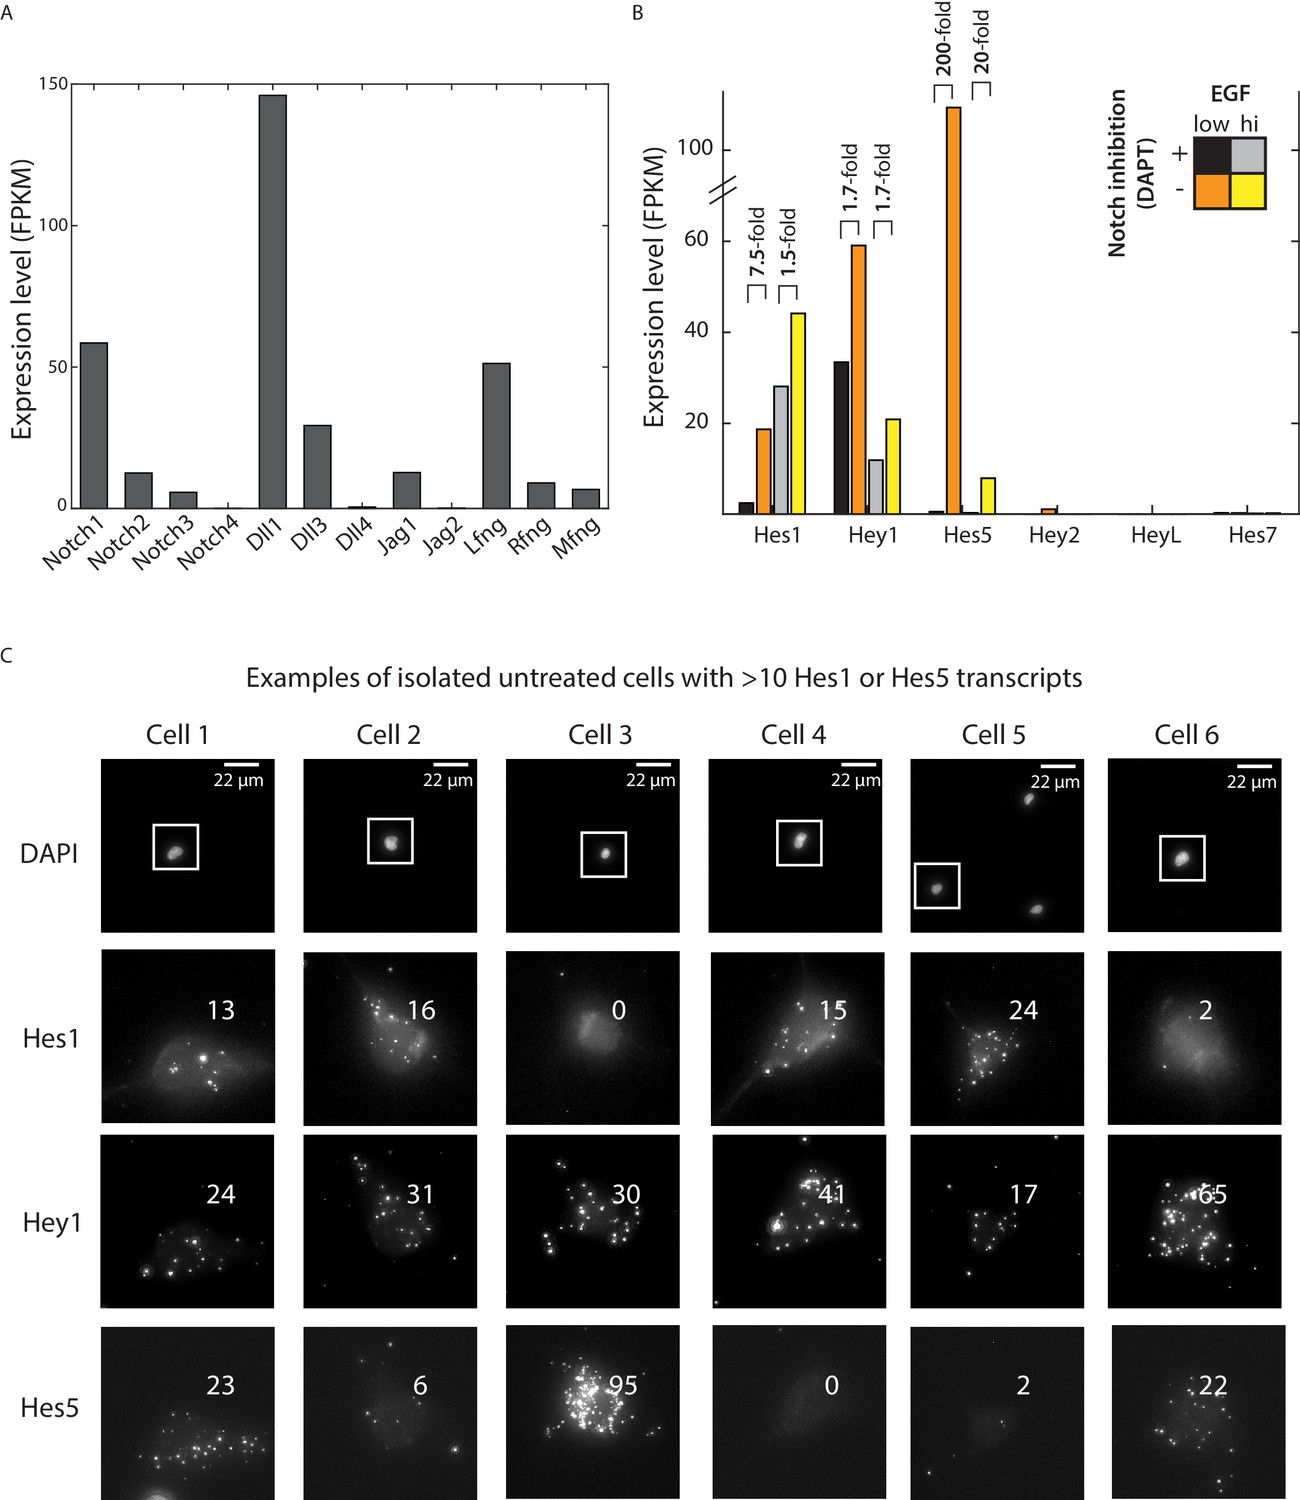
RNAseq analysis of Notch pathway component expression in neural stem cells.
(A) Expression levels of Notch receptors, ligands, and Fringes, measured using RNAseq (see Materials and methods), in neural stem cells cultured in the presence of 0.5 ng/ml EGF and 10 μM DAPT for 12 hr. (B) Expression levels of canonical Notch target genes Hes1, Hey1, and Hes5 cultured in low or high growth factor conditions, with or without 10 μM DAPT treatment for 12 hr (see Materials and methods). (C) Examples of isolated NSCs, plated for 6 hr without DAPT, showing >10 transcripts of either Hes1 or Hes5. <3% of DAPT-treated cells pass this criteria. Across the three target genes, the DAPT-treated sample has zero cells (out of 298 total cells) similar to Cells 1, 3, or 6, and only one cell similar to Cells 2, 4, and 5. The top row of images shows DAPI stained nuclei. Note lack of neighboring cells. Lower rows show zoomed in views of regions outlined in white, showing the cell in three fluorescent channels in which Hes1, Hey1, and Hes5 are labeled in the multiplexed smHCR-FISH experiment. Numbers indicate computationally detected number of transcripts (see Materials and methods).
Figure 4 with 1 supplement
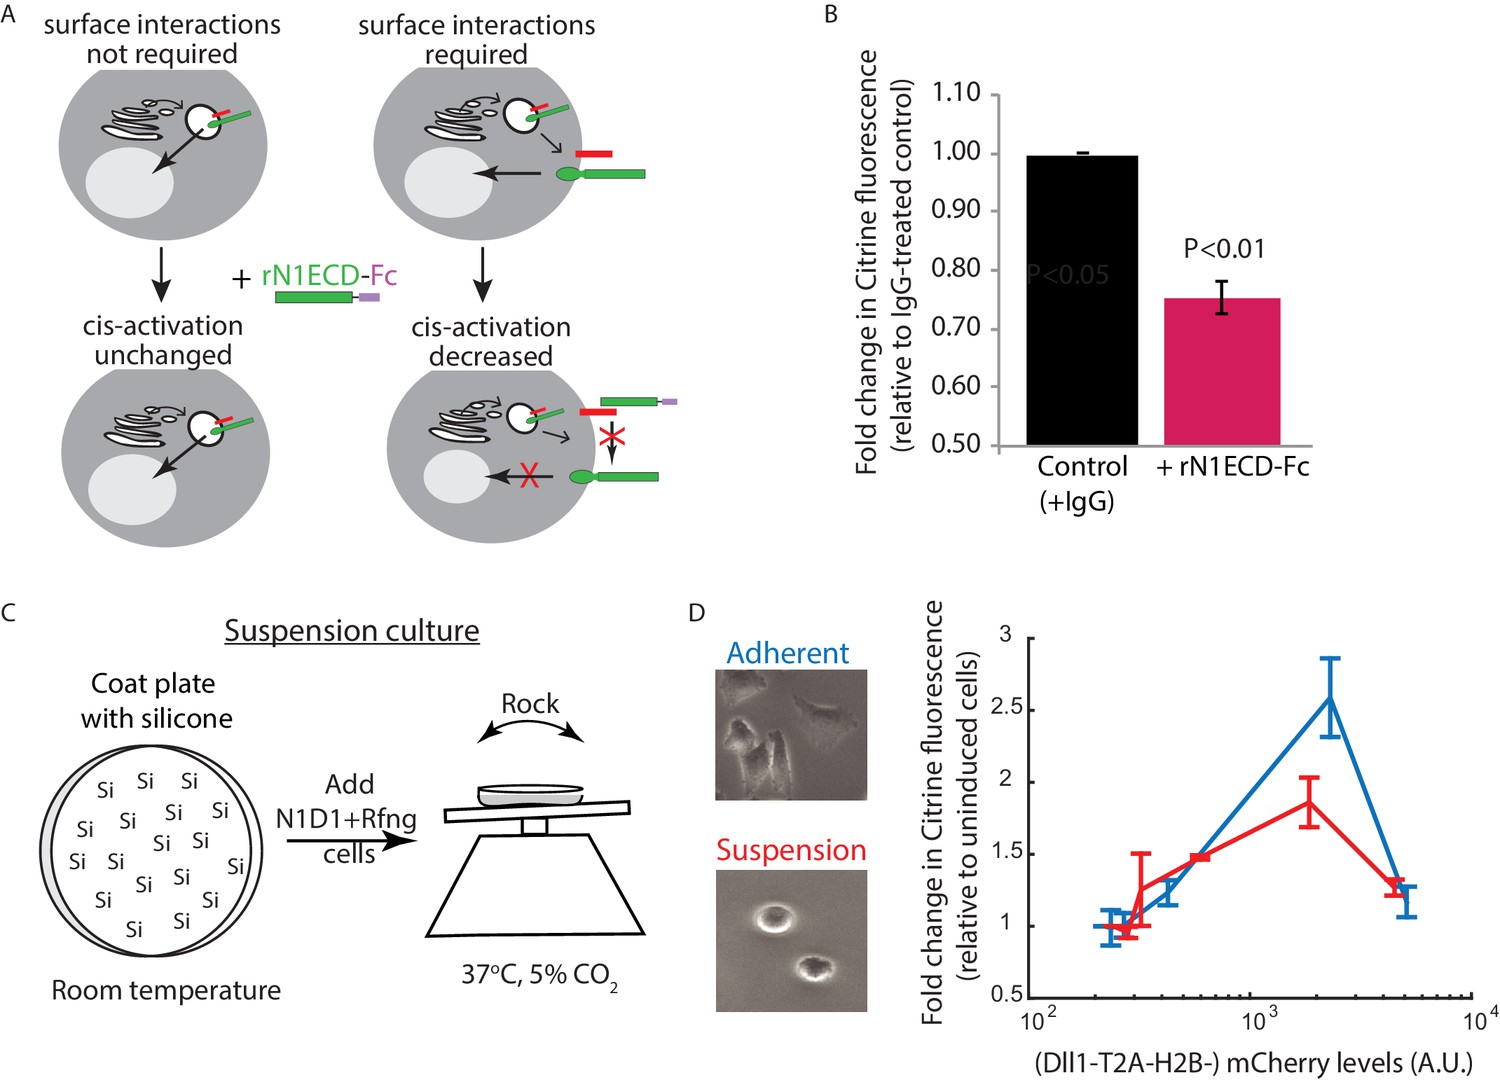
Receptor-ligand cell surface interactions are necessary for cis-activation.
(A) Schematics showing how soluble recombinant N1ECD-Fc protein (rN1ECD-Fc) can be used to test whether surface interactions between ligand (red) and receptor (green) are necessary for cis-activation. (Left) With intracellular cis-activation, addition of extracellular rN1ECD-Fc should not affect cis-activation levels. (Right) If surface interactions are necessary for cis-activation, rN1ECD-Fc treatment should reduce activation levels by competing with receptors for cell-surface ligands. (B) Comparison of mean Notch activation in N1D1 + Rfng cells incubated with rNotch1ECD-Fc receptors (magenta) or an IgG control (black) for 24 hr (see Materials and methods). Cells were plated for a cis-activation assay and analyzed by flow cytometry < 24 hr post-plating. Error bars represent s.e.m (n = 3 replicate experiments). P-values calculated using the one-sided Student T-test. (C) Schematic of procedure for culturing N1D1 + Rfng cells in suspension. Plates were coated with a Silicone solution (‘Si’), and cells were subsequently plated for a cis-activation assay (co-culture of 5 × 10³ N1D1 + Rfng + 150 × 103 CHO-K1 cells). The plate was incubated at 37°C, 5% CO2 on a rocker to prevent cells from adhering to the plate surface. (D) (Left) Representative image of cells grown in adherent (blue) or suspension (red) conditions. (Right) Comparison of mean Notch activation levels, relative to background reporter fluorescence, in N1D1 + Rfng cells cultured for 24 hr in suspension (red) or in adherent conditions (blue), for different Dll1 expression levels (measured using co-translated mCherry fluorescence). Cells were in cis-activation co-culture conditions (5 × 10³ N1D1 + Rfng + 150 × 103 CHO-K1 cells). Error bars represent s.e.m (n = 3 replicates).
Figure 4—figure supplement 1
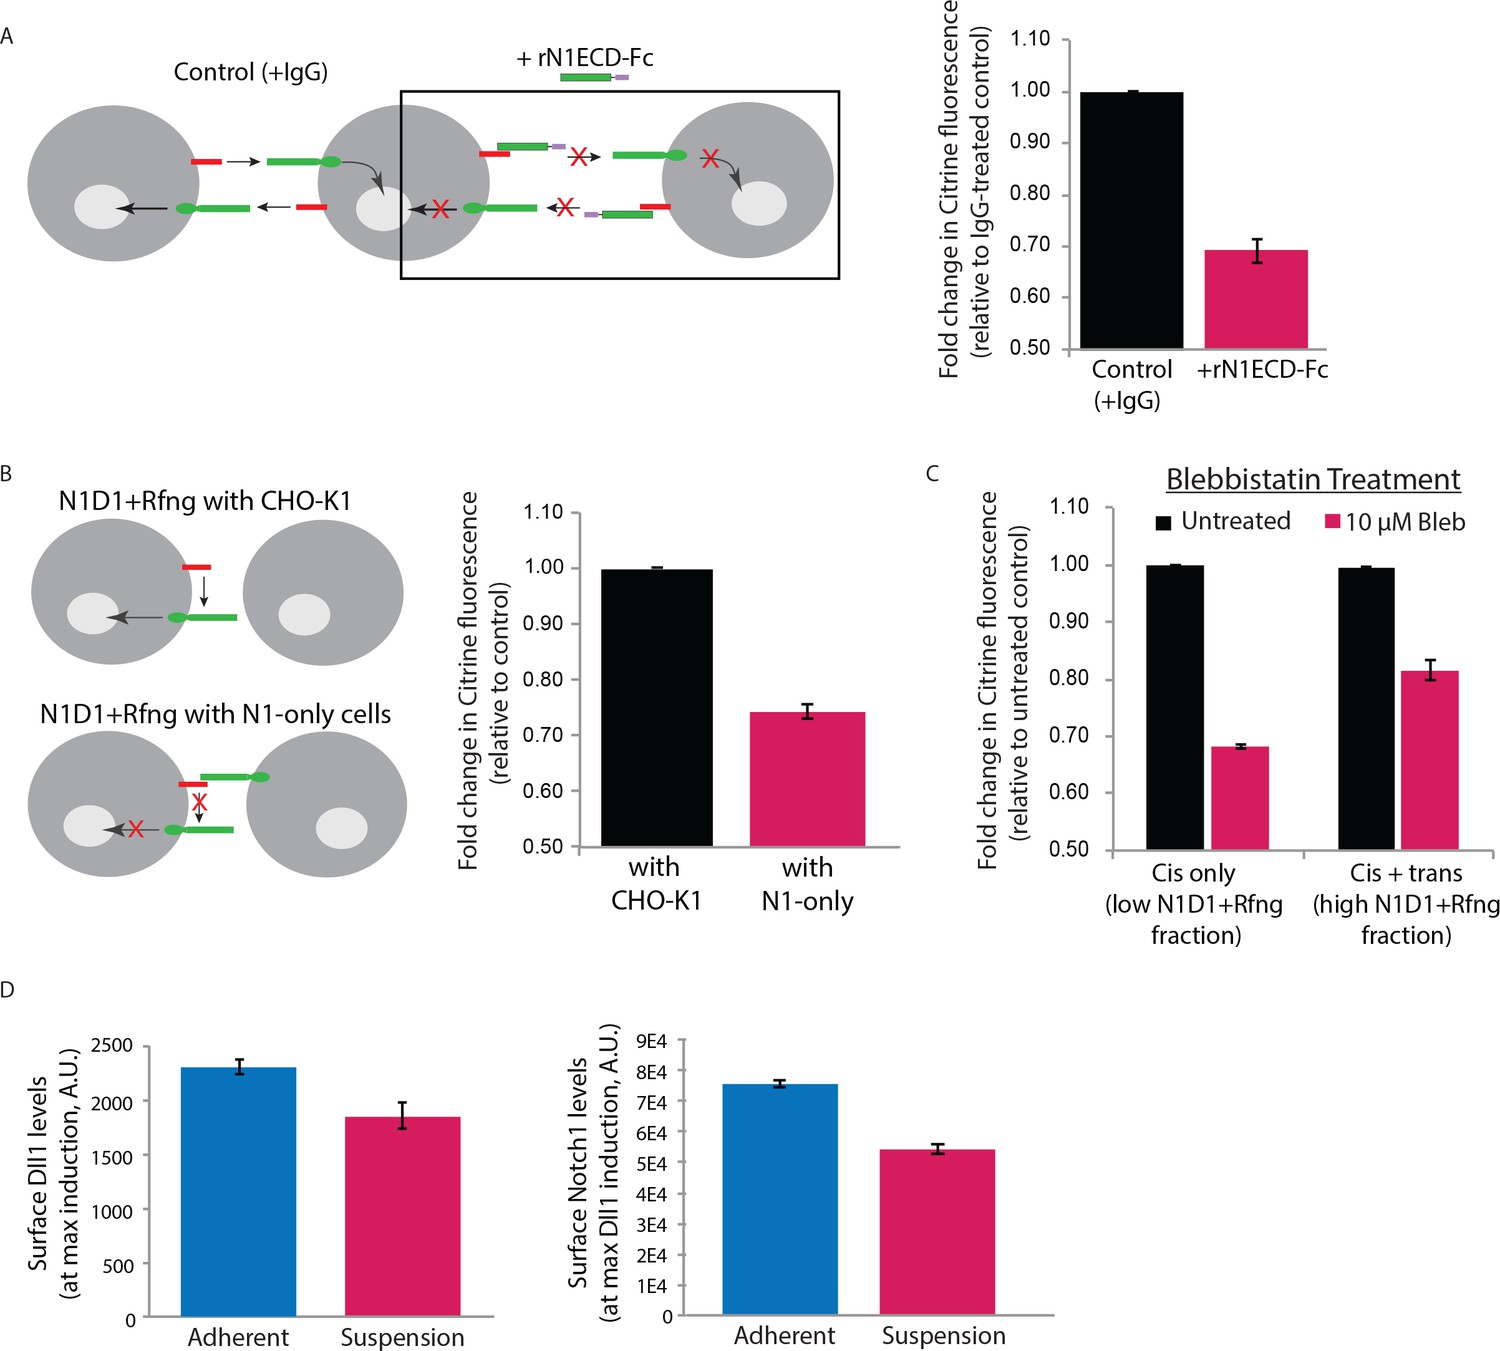
Surface perturbations affect N1D1+Rfng cis-activation.
(A) (Left) Schematic showing how recombinant N1ECD-Fc protein (rN1ECD-Fc) affects trans-activation between cells expressing ligands (red) and receptors (green). rN1ECD-Fc protein, present in excess, binds to surface ligands and prevents their interactions with receptors on neighboring cells. This is expected to reduce overall Notch activation in cells relative to the control (cells incubated with IgG protein). (Right) Comparison of mean Notch activation in N1D1+Rfng cells incubated with rNotch1ECD-Fc receptors (magenta) and those that were incubated with IgG (black) for 24 hr (see Materials and methods). Cells were plated densely to allow trans-activation and analyzed by flow cytometry <24 hr post-plating. (B) (Left) Schematic of N1D1+Rfng cells co-cultured with CHO-K1 cells (top) or Notch1 cells (‘N1-only cells’) that express receptor but no ligand. Notch1 cells can bind to the Dll1 ligand on the N1D1+Rfng cells and block it from interacting with Notch1 on the same cell. If surface interactions are necessary for cis-activation, this will decrease Notch activation. (Right) Comparison of mean Notch activation in N1D1+Rfng cells co-cultured with an excess (95% of culture) of CHO-K1 cells (black) or N1-only cells (magenta). (C) Mean Notch activation in N1D1+Rfng cells co-cultured at low (mostly cis-activation, ‘Cis-only’) or high (cis+trans-activation, ‘Cis + trans’) relative density with CHO-K1 cells and treated with 10 μM Blebbistatin (Materials and methods). Data is shown as fold-change relative to control untreated samples plated similarly. (D) Compared to adherent culture (blue), suspension culture (magenta) of N1D1+Rfng cells results in a slight decrease in cell-surface levels of mean Dll1 (left) and Notch1 (right), measured by immunostaining (see Materials and methods). In all panels, error bars represent s.e.m (n=3 replicate experiments).
Figure 5 with 1 supplement
Mathematical model of cis-activation reveals potential roles in signal processing.
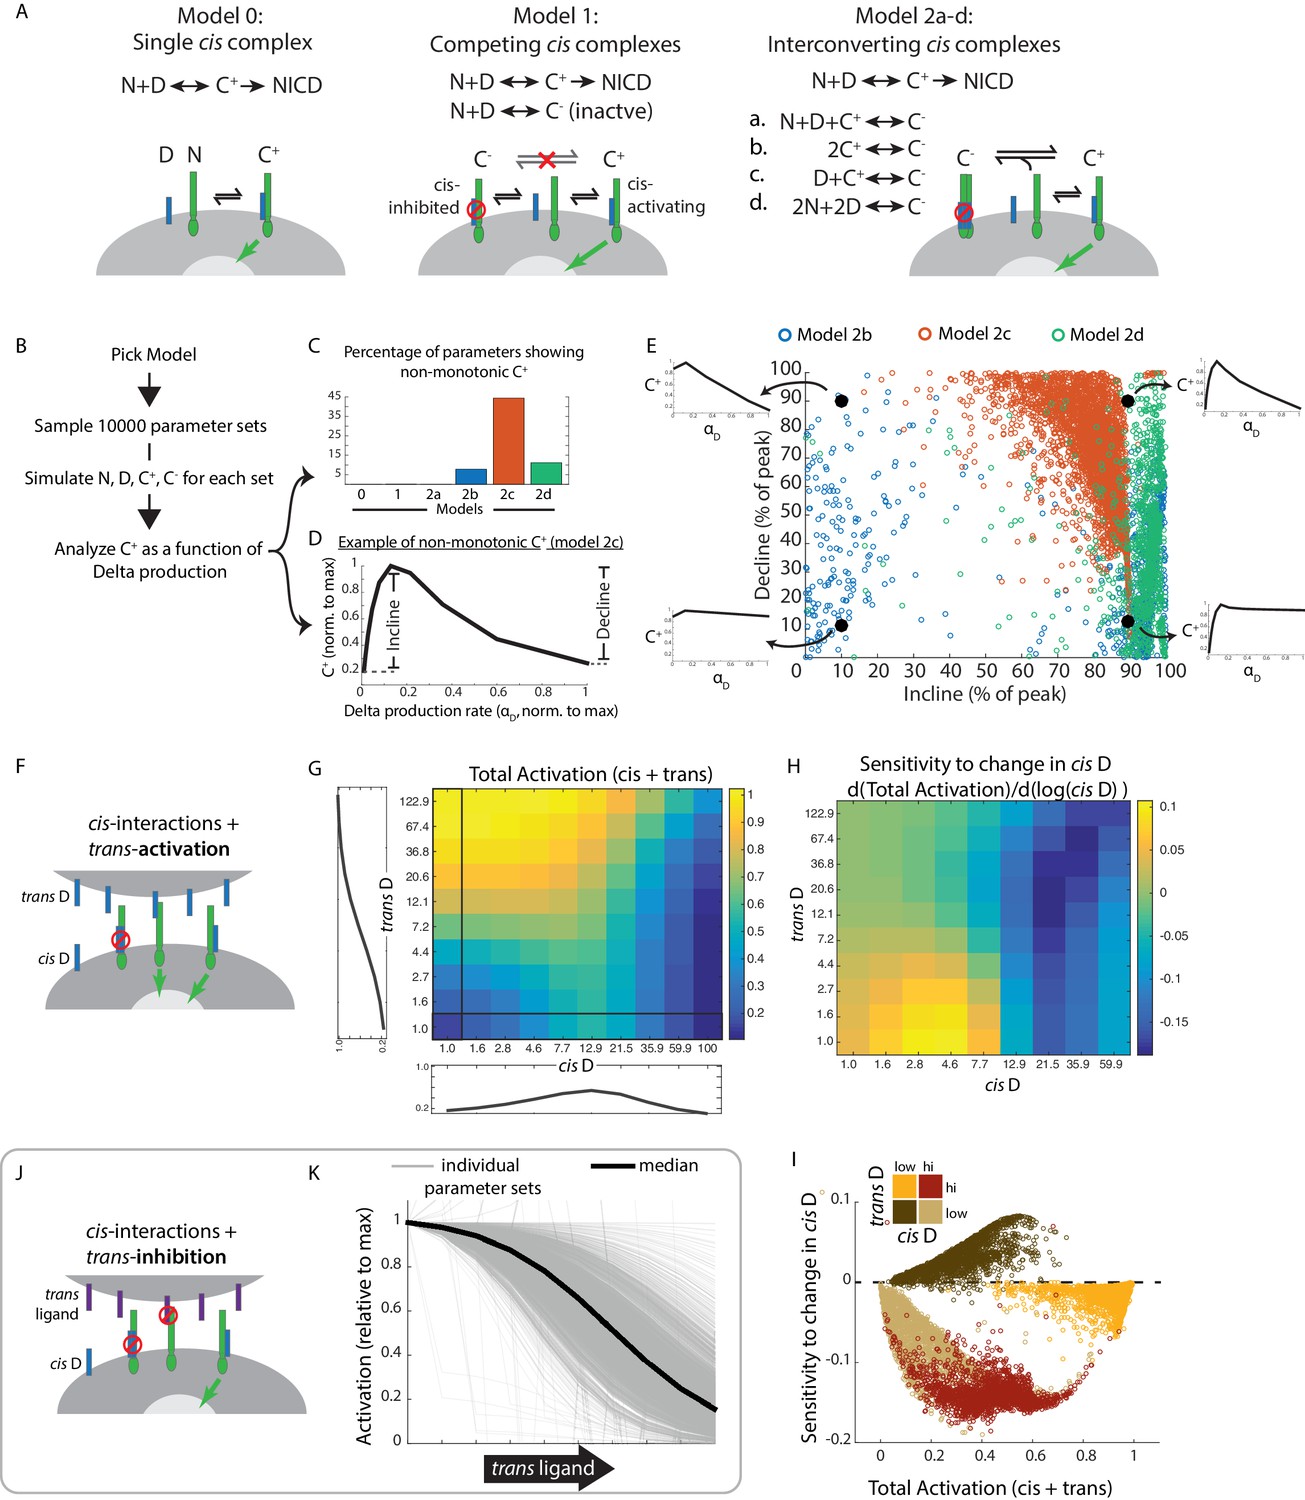
(A) In each cis-activaiton model, Notch (‘N’, green) and Delta (‘D’, blue) interact to produce one or more cis-complexes, which can be active (‘C+’), producing NICD (green arrow) or inhibited (‘C-’, red circle). In Models 2a-d, C+ is formed through the same interaction, but C- formation differs for each of the included models. (B) Overview of simulations (see Materials and methods). (C-E) Results of simulations shown. (C) Percentage of parameters that lead to non-monotonic C+ behavior in each of the models (see Material and methods for assessment of this feature) (D) Example of non-monotonic dependence of C+ on Delta production rate (‘αD’), generated in Model 2 c for one choice of parameter values. The fractional incline and decline features used to characterize the degree of non-monotonicity (and plotted in panel E) are shown. (E) Scatter plot of fractional incline vs. decline for each non-monotonic C+ profile produced by Models 2b-d. Filled black circles and associated schematic plots highlight C+ profile shapes corresponding to different incline vs. decline levels. (F) Schematic of model including both cis- and trans-activation. Notch receptors can interact with intracellular Delta (‘cis D’) or extracellular Delta (‘trans D’) to form cis- and trans-complexes, respectively. Cis-complexes can be either inhibited (red circle) or activating (green arrow), while trans complexes are activating. (G) Example of total activation (levels of activating cis + trans complexes) as a function of cis and trans D, for a single set of parameters producing non-monotonic cis-activation. (H) Corresponding sensitivity to change in cis D for the example in G. This sensitivity (‘d(Total Activation)/d(log(cis D))’) is defined as the change in total activation upon constant fold-changes in cis D levels, and is derived from G by computing the difference between adjacent columns of the total activation matrix. (I) Scatter plot showing median values of total activation vs. sensitivity to change in cis D in different regimes of cis and trans D (high cis/high trans - red, high cis/low trans - beige, low cis/high trans - orange, low cis/low trans - brown). Each circle represents results obtained using a single set of parameters in Model 2c (with trans-activation). (J) Schematic of model including cis- and trans-inhibition. Notch receptors can interact with intracellular Delta (‘cis D’, blue) or extracellular ligand (‘trans ligand’, purple) to form cis- and trans-complexes, respectively. Cis-complexes can be either inhibited (red circle) or activating (green arrow), while trans complexes cannot activate. (K) Dependence of total activation levels on trans-ligand, for cis D production rate corresponding to peak cis-activation. Each grey line represents behavior for a single set of parameters, while the black line represents the median response across all tested parameters.
-
Figure 5—source data 1
MATLAB code and parameter sets used for models in Figure 5.
- https://doi.org/10.7554/eLife.37880.018
Figure 5—figure supplement 1
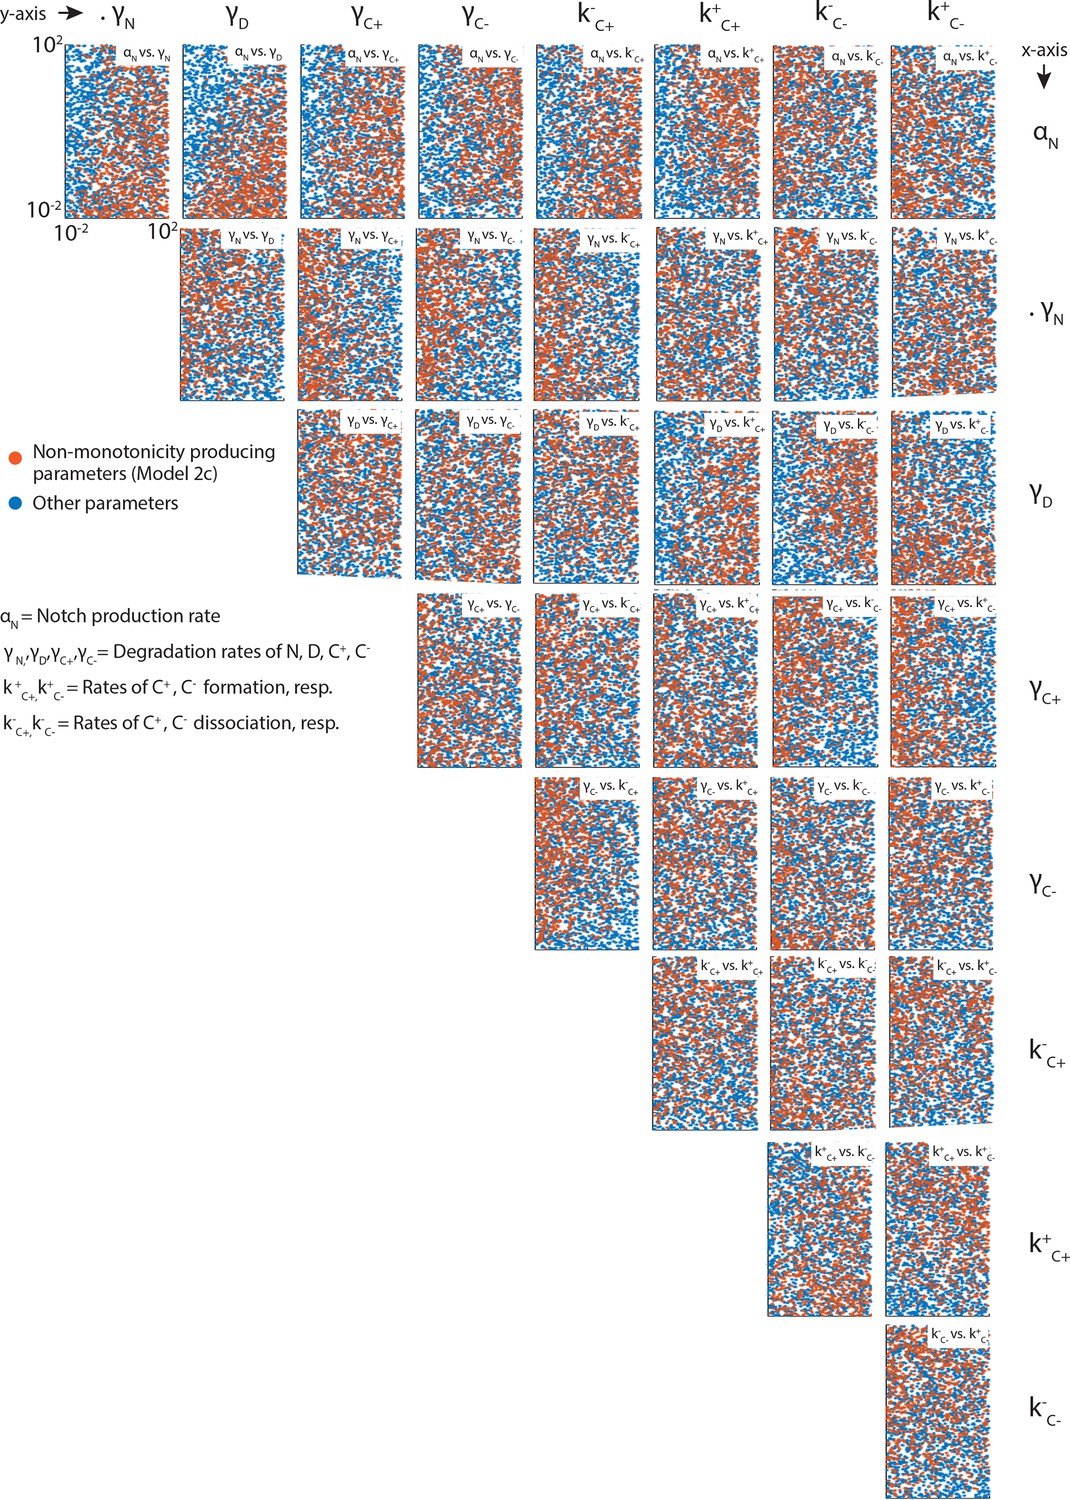
1Latin Hypercube Sampling generates evenly distributed parametersScatter plots showing pairwise distributions of parameters tested in Models 1 and 2a-d.
For clarity, each plot only shows 3000 parameter pairs, randomly subsampled from the 10,000 total parameters sets analyzed. Orange dots are subsampled from parameters that produce non-monotonic C+ profiles in Model 2c, while the blue dots are subsampled from the complete set of analyzed parameters. Note the even distribution of parameters across sampled space in each plot.
Videos
Video 1
Cis-activation of isolated engineered CHO-K1 cells.
Examples of isolated CHO-K1 N1D1 + Rfng cells activating prior to cell division in the cis-activation assay. (Top row) Blue channel shows fluorescence of the constitutively expressed nuclear H2B-Cerulean protein. (Bottom row) Green channel shows fluorescence of the Notch-activated H2B-Citrine reporter protein (also nuclear). The same intensity scales have been applied to each frame of the movie and for all cells. Interval between individual frames of the movie is 30 min. Non-fluorescent CHO-K1 cells surround each isolated fluorescent cell but are not visible.
Video 2
Cis-activation of isolated engineered NMuMG cells.
Examples of isolated NMuMG N1D1 + Rfng cells activating prior to cell division in the cis-activation assay. (Top row) Blue channel shows fluorescence of the constitutively expressed nuclear H2B-Cerulean protein. (Bottom row) Green channel shows fluorescence of the Notch-activated H2B-Citrine reporter protein (also nuclear). The fluorescence image is overlaid on the DIC image (grey), in which surrounding non-fluorescent NMuMG cells can be seen. The same intensity scales have been applied to each frame of the movie and for all cells. Interval between individual frames of the movie is 30 min.
Tables
Key resources table
| Reagent type (species) or resource | Designation | Source or reference | Identifiers | Additional information |
|---|---|---|---|---|
| Gene (Mus musculus) | Dll1 | NCBI ID: 13388 | ||
| Gene (Homo sapiens) | Dll1 | NCBI ID: 28514 | ||
| Gene (Homo sapiens) | Dll4 | NCBI ID: 54567 | ||
| Gene (Mus musculus) | R-fringe | NCBI ID: 19719 | ||
| Gene (Homo sapiens) | Notch1 | NCBI ID: 4851 | ||
| Gene (Homo sapiens) | Notch2 | NCBI ID: 4853 | ||
| Cell line (Cricetulus griseus) | CHO-K1 | Thermo Fisher Scientific (T-REx CHO-K1) | Cat# R71807 RRID:CVCL_D586 | Figures 1, 2 and 4; Figure 1—figure supplements 1, 2 and 3; Figure 2—figure supplements 1 and 2; Figure 4—figure supplement 1 |
| Cell line (Cricetulus griseus) | N1D1 | Derived from CHO-K1 | CHO-K1 expressing pEF-hNECD-Gal4esn + pcDNA5- TO-Dll1-T2A-H2B-mCherry + pEV-UAS-H2B-Citrine | Figure 2 |
| Cell line (Cricetulus griseus) | N1D1 + Rfng | Derived from N1D1 | CHO-K1 expressing pEF-hNECD-Gal4esn + pcDNA5- TO-Dll1-T2A-H2B-mCherry + pEV-UAS-H2B-Citrine + pLenti- CMV-R-fringe-T2A-Puromycin | Figures 1, 2 and 4;Figure 1—figure supplements 1 and 2; Figure 4—figure supplement 1 |
| Cell line (Cricetulus griseus) | N1WTD1 + Rfng | Derived from CHO-K1 | CHO-K1 expressing pcDNA3‐hN1‐mod1 + pcDNA5-TO-Dll1-mCherry + pEV-12xCSL-H2B-Citrine + piggyBac CMV-R-fringe+pCS- H2B-Cerulean | Figure 1—figure supplement 3 |
| Cell line (Mus musculus) | NMuMG | ATCC | Cat# CRL-1636 (Wild-type cells used to transfect in piggyBac-12xCSL- H2B-Citrine) RRID:CVCL_0075 | Figure 1—figure supplement 4 |
| Cell line (Mus musculus) | NMuMG + Dll1 | Derived from NMuMG | Base wild-type cell line expressing piggyBac-12xCSL-H2B-Citrine + piggyBac-TO-Dll1-T2A -H2B-mCherry-P2A-Hygromycin | Figure 1—figure supplement 4 |
| Cell line (Mus musculus) | NMuMG N1D1 + Rfng | Derived from NMuMG | NMuMG ΔN2ΔJ1 expressing piggyBac- CMV-hNECD-Gal4-ANK -T2A-H2B-Cerulean + piggyBac CMV-TO Dll1-T2A-H2B-mCherry- P2A-Hygromycin + pEV -2xHS4-UAS-H2B-Citrine- T2A-tTS-2xHS4-Blast-T2A- rTetR-HDAC4-P2A-R-fringe | Figure 1—figure supplement 3 |
| Cell line (Homo sapiens) | Caco-2 | ATCC (Caco-2 C2BBe1) | Cat# CRL-2102 (Wild-type cells used to transfect in pEV-12xCSL-H2B-Citrine) RRID:CVCL_1096 | Figure 1—figure supplement 4 |
| Cell line (Cricetulus griseus) | N1D1 Pop | Derived from CHO-K1 | CHO-K1 with pEV-UAS- H2B-Citrine + pCS-H2B- Cerulean + piggyBac-TO-Dll1-T2A-H2 B-mCherry + piggyBac- CMV-hN1ECD-Gal4 - Cell population (Pop) | Figure 2 |
| Cell line (Cricetulus griseus) | N1D4 Pop | Derived from CHO-K1 | CHO-K1 with pEV-UAS- H2B-Citrine + pCS-H2B- Cerulean + piggyBac- TO-Dll4-T2A-H2B-mCherry + piggyBac-CMV-hN1ECD-Gal4 - Cell population (Pop) | Figure 2; Figure 2—figure supplement 1 |
| Cell line (Cricetulus griseus) | N2D1 Pop | Derived from CHO-K1 | CHO-K1 with pEV-UAS-H2B- Citrine + pCS-H2B-Cerulean + piggyBac-TO-Dll1-T2A-H2B -mCherry + piggyBac- CMV-hN2ECD-Gal4 - Cell population (Pop) | Figure 2; Figure 2—figure supplement 2 |
| Cell line (Cricetulus griseus) | N2D4 Pop | Derived from CHO-K1 | CHO-K1 with pEV-UAS- H2B-Citrine + pCS-H2B- Cerulean + piggyBac -TO-Dll4-T2A-H2B-mCherry + piggyBac-CMV-hN2ECD-Gal4 - Cell population (Pop) | Figure 2; Figure 2—figure supplement 2 |
| Cell line (Mus musculus) | NSC | EMD Millipore | Cat# SCR029 (E14.5 mouse neural cortical stem cells - NSC) | Figure 3; Figure 3—figure supplements 1 and 2 |
| Transfected construct (recombinant DNA) | pEV‐UAS‐H2B‐ Citrine | Sprinzak et al., 2010 | N/A | Reporter for Notch1ECD-Gal4 receptor in CHO cells |
| Transfected construct (recombinant DNA) | pEV-2xHS4-UAS- H2B-Citrine-T2A- tTS-2xHS4-Blast- T2A-rTetR-HDAC4- P2A-R-fringe | This paper | N/A | Reporter for Notch1ECD- Gal4-ANK receptor in NMuMG cells (tTS was not relevant for this work and was inactivated by 4-epiTc); rTetR-HDAC4 was used to decrease Delta expression in the presence of Dox; Constitutive R-fringe expression in NMuMG cells |
| Transfected construct (recombinant DNA) | pEV-12xCSL‐ H2B‐Citrine | Sprinzak et al., 2010 | N/A | Reporter for Notch1 wild-type receptor in CHO and Caco-2 cells |
| Transfected construct (recombinant DNA) | pEF-hN1ECD -Gal4 | This paper | N/A | Notch1ECD-Gal4 synthetic receptor used in CHO clones |
| Transfected construct (recombinant DNA) | pX330 (CRISPR-Cas9 plasmid system) | Cong et al., 2013 | N/A | Plasmid used to insert RNA guide sequence for CRISPR knockdown |
| Transfected construct (recombinant DNA) | piggyBac-12x CSL-H2B-Citrine | This paper | N/A | NotchWT reporter placed into NMuMG WT cells but not used in this study |
| Transfected construct (recombinant DNA) | piggyBac-CMV -hN1ECD-Gal4 | This paper | N/A | Notch1ECD-Gal4 synthetic receptor used in CHO populations |
| Transfected construct (recombinant DNA) | piggyBac-CMV -hN2ECD-Gal4 | This paper | N/A | Notch2ECD-Gal4 synthetic receptor used in CHO populations |
| Transfected construct (recombinant DNA) | pcDNA3‐hN1‐mod1 | Sprinzak et al., 2010 | N/A | Wild-type Notch1 receptor used in CHO clones |
| Transfected construct (recombinant DNA) | piggyBac-CMV- hNECD-Gal4-ANK -T2A-H2B-Cerulean | This paper | N/A | Notch1ECD-Gal4-ANK synthetic receptor used in NMuMG clones |
| Transfected construct (recombinant DNA) | pcDNA5-TO-Dll1 -T2A-H2B-mCherry | Nandagopal et al., 2018 | N/A | Inducible Delta-like1 ligand used in CHO clones and populations |
| Transfected construct (recombinant DNA) | pcDNA5-TO‐ Dll1‐ mCherry | Sprinzak et al., 2010 | N/A | Inducible Delta-like1-mCherry fusion used in CHO clones with Notch1WT receptor |
| Transfected construct (recombinant DNA) | piggyBac-CMV-TO Dll1-T2A-H2B- mCherry-P2A- Hygromycin | Nandagopal et al., 2018 | N/A | Inducible Delta-like1 ligand used in CHO populations and NMuMG clones |
| Transfected construct (recombinant DNA) | piggyBac-CMV-TO- Dll4-T2A-H2B-mCherry-P2A-Hygromycin | Nandagopal et al., 2018 | N/A | Inducible Delta-like4 ligand used in CHO populations |
| Transfected construct (recombinant DNA) | pLenti-CMV-R- fringe-T2A- Puromycin | This paper | N/A | Constitutive R-fringe expression in CHO N1D1 + Rfng cells |
| Transfected construct (recombinant DNA) | pCS‐H2B‐Cerulean | Sprinzak et al., 2010 | N/A | Segmentation color used in CHO cells |
| Transfected construct (siRNA) | Allstar Negative Control | Qiagen | SI03650318 | Control siRNA, Figure 3C |
| Transfected construct (siRNA) | Dll1 siRNA | Thermo Fisher Scientific | Cat# 4390771 (ID: s65000) | Dll1 siRNA, Figure 3C |
| Antibody | rabbit anti- mouse Notch2 | Cell Signaling Technologies | Cat# 5732 RRID:AB_10693319 | WB (1:1000) |
| Antibody | rabbit anti- mouse Jagged1 | Cell Signaling Technologies | Cat# 2620 RRID:AB_659968 | WB (1:1000) |
| Antibody | rabbit anti- mouse GAPDH | Cell Signaling Technologies | Cat# 2118 RRID:AB_561053 | WB (1:3000) |
| Antibody | rabbit anti- mouse Dll1-ICD | Kindly provided by Gerry Weinmaster, UCLA | Antibody 88 c | WB (1:2000) |
| Antibody | ECL Rabbit IgG HRP-linked whole antibody from Donkey Secondary | GE Healthcare Life Sciences | Cat #NA934 RRID:AB_772206 | WB (1:2000) |
| Antibody | Anti-mouse AlexFluor 488 Secondary | Thermo Fisher Scientific | Cat# A21202 RRID:AB_141607 | ICC (1:1000) |
| Other | SuperSignal West Pico Chemiluminescent Substrate | Thermo Fisher Scientific | Cat# 34580 | as recommended per the manufacturer |
| Other | SuperSignal West Femto Chemiluminescent Substrate | Thermo Fisher Scientific | Cat# 34095 | as recommended per the manufacturer |
| Recombinant DNA reagent | Lipofectamine LTX plasmid transfection reagent | Thermo Fisher Scientific | Cat# 15338–100 | as recommended per the manufacturer |
| Recombinant DNA reagent | ViraPower Lentiviral Expression System | Thermo Fisher Scientific | Cat# K497500 | as recommended per the manufacturer |
| Peptide, recombinant protein | Recombinant mouse IgG2A Fc Protein | R and D Systems | Cat# 4460 MG-100 | 10 ug/ml |
| Peptide, recombinant protein | Recombinant mouse Dll1 Fc chimera | R and D Systems | Cat# 5026 DL-050 | 10 ug/ml |
| Peptide, recombinant protein | Recombinant mouse Notch-1 Fc chimera | R and D Systems | Cat# 5267-TK-050 | 10 ug/ml |
| Peptide, recombinant protein | Recombinant human Dll1ext-Fc fusion proteins | Sprinzak et al., 2010 | Kindly provided by Irwin Bernstein, MD at Fred Hutchinson Cancer Research Center | 2.5 ug/ml |
| Chemical compound, drug | DAPT | Sigma Aldrich | Cat# D5942 | 1 uM (CHO cells); 10 uM (all other cells) |
| Chemical compound, drug | 4-epi tetracycline Hydrochloride | Sigma Aldrich | Cat# 37918 | 0–200 ng/ml |
| Chemical compound, drug | Doxycycline | Takara Bio USA Inc | Cat# 631311 | 1 ug/ml or 10 ug/ml |
| Chemical compound, drug | Dexamethasone | Sigma Aldrich | Cat# D4902 | 100 ng/ml |
| Commercial assay or kit | Miniprep kit | Qiagen | Cat# 27106 | |
| Commercial assay or kit | QIAquick PCR Purification kit | Qiagen | Cat# 28104 | |
| Commercial assay or kit | RNeasy mini kit for RNA extraction | Qiagen | Cat# 74106 | |
| Commercial assay or kit | iScript cDNA synthesis kit | Bio-Rad | Cat# 1708890 | |
| Commercial assay or kit | iQ SYBR Green Supermix | Bio-Rad | Cat# 1708880 | |
| Commercial assay or kit | SsoAdvanced Universal Probes Supermix | Bio-Rad | Cat# 172–5282 | |
| Commercial assay or kit | DNA HCR kit | Molecular Instruments | ||
| Software, algorithm | Cell segmentation and tracking | Nandagopal et al., 2018 | N/A | Figure 1, Figure 1—figure supplement 2 |
| Software, algorithm | FISH Transcript detection and quantification | This paper | https://github.com/nnandago/elife2018-dot_detection; Nandagopal, 2018a | MATLAB code for visualizing, segmenting, and detecting transcript dots in FISH-labeled cells. Used to generate Figure 1—figure supplement 2, Figure 3—figure supplement 1 |
| Software, algorithm | cis-activation model | This paper | https://github.com/nnandago/elife2018-cis_activation_modeling; Nandagopal, 2018b | MATLAB code for modeling steady state concentrations of ligand, receptors and complexes for a range of parameters. Used to generate Figure 5, Figure 5—figure supplement 5– |
Additional files
-
Transparent reporting form
- https://doi.org/10.7554/eLife.37880.019
Download links
A two-part list of links to download the article, or parts of the article, in various formats.
Downloads (link to download the article as PDF)
Open citations (links to open the citations from this article in various online reference manager services)
Cite this article (links to download the citations from this article in formats compatible with various reference manager tools)
Cis-activation in the Notch signaling pathway
eLife 8:e37880.
https://doi.org/10.7554/eLife.37880


