Par3 interacts with Prickle3 to generate apical PCP complexes in the vertebrate neural plate
- Icahn School of Medicine at Mount Sinai, United States
Figures
Figure 1
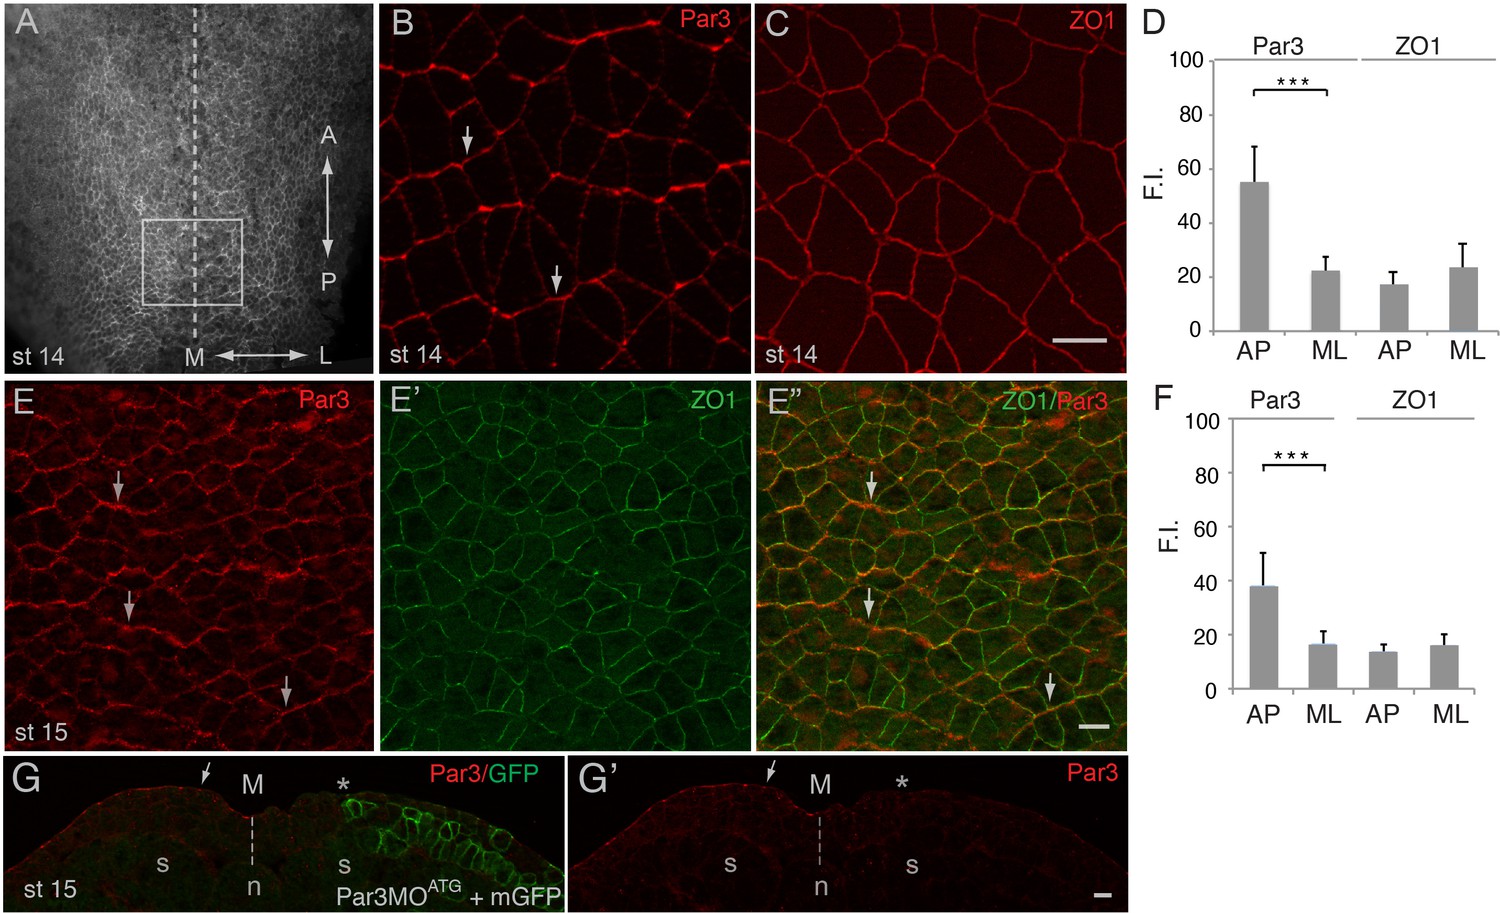
Planar polarization of Par3 in the Xenopus neural plate.
(A–C, E) Representative images show en face view of immunostained neural plate explants prepared from fixed Xenopus embryos at stages (st) 14–15. (A) Neural plate explant with the approximate position of the imaged area (B–E) (boxed). Dashed line indicates the neural midline (M). The anteroposterior (AP) and the mediolateral (ML) axes are shown. (B) Par3 is enriched at AP, horizontal, cell borders (arrows) as compared to ML, vertical, cell borders. (C) ZO1 is equally distributed to all junctions. (D, F) Fluorescence intensity (F.I.). Means ± s. d. represent three different experiments. At least 30 cells from three to four different embryos were analyzed per group. Significance was determined by the two-tailed Student’s t-test, p<0.001. (E–E”) Double staining with Par3 and ZO1-specific antibodies reveals planar polarization of Par3 but not ZO1 along the AP axis. (G, G’) Validation of the Par3 antibody. Cross-section of a neurula embryo, stage 15, unilaterally injected with Par3MOATG (20 ng, asterisk) and GFP-CAAX, membrane GFP (mGFP) RNA (100 pg) as lineage tracer. Arrow points to apical Par3 at the uninjected side, whereas the neural plate is flat on the injected side; n, notochord; s, somite, M, midline (dashed line). Control MO did not alter Par3 distribution (see Figure 2—figure supplement 3). Scale bars are 20 µm.
Figure 2 with 4 supplements
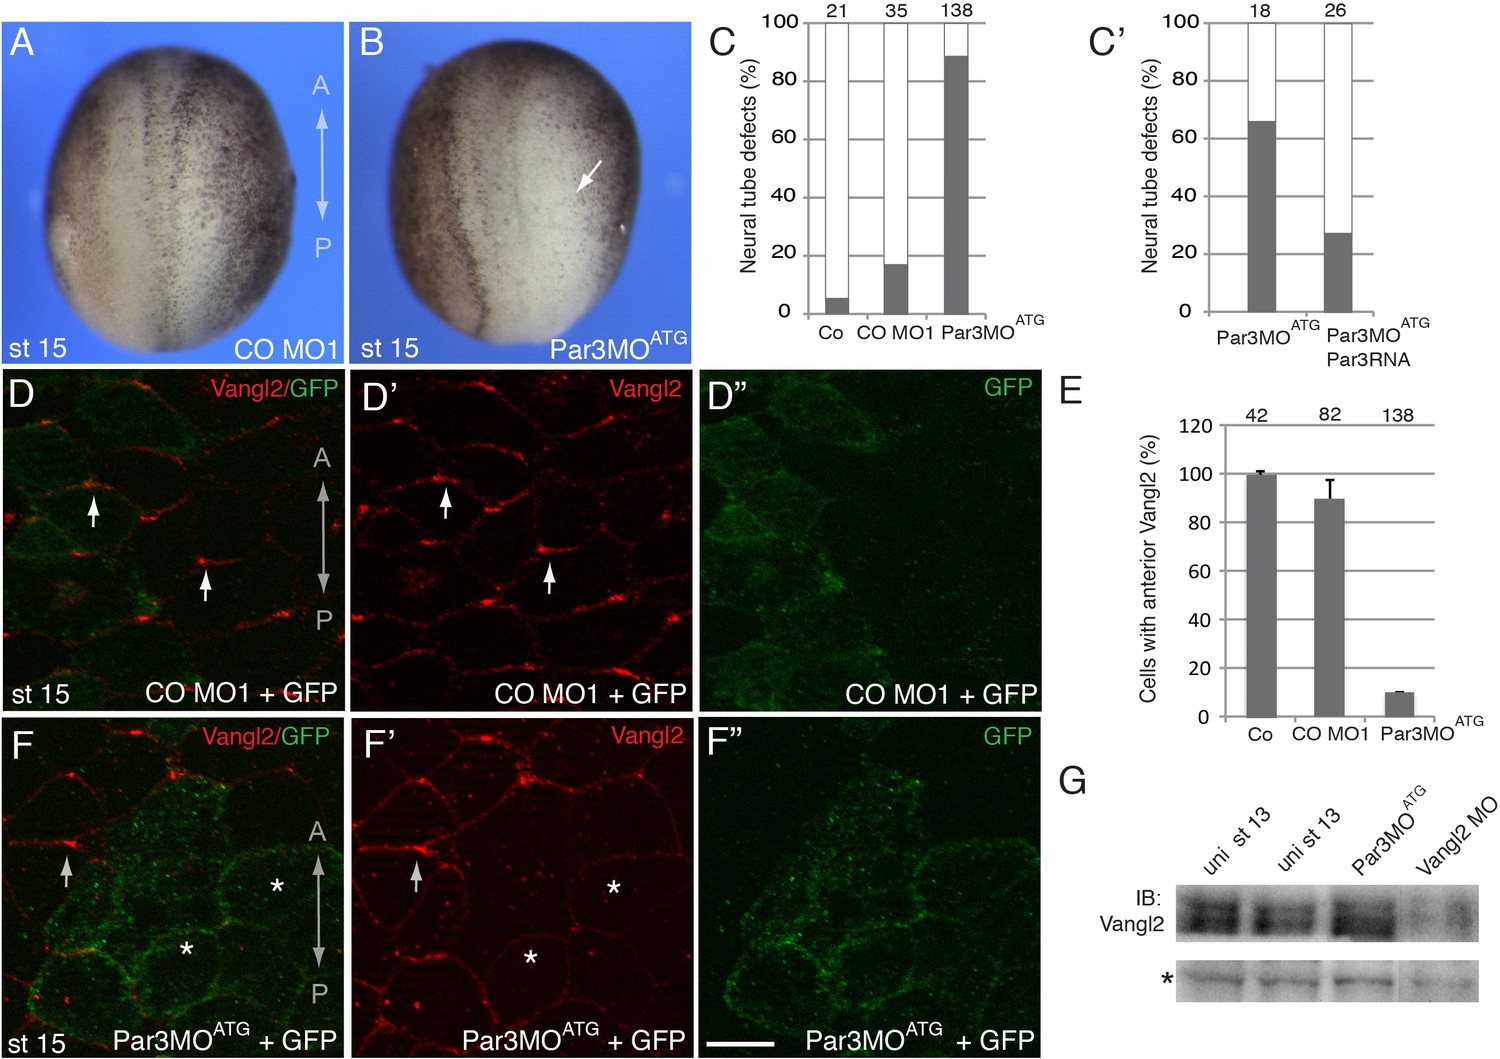
A requirement for Par3 in neural plate PCP and neural tube closure.
(A–F), Eight-cell embryos were unilaterally injected into two animal blastomeres with control morpholino 1 (CO MO1), 20 ng, or Par3MOATG, 20 ng, as indicated, with GFP RNA, 0.1 ng, as a lineage tracer. Dorsal view is shown, and the anteroposterior (AP) axis of the neural plate and embryonic stage 15 (st 15) are indicated. (A–C) Par3 depletion results in neural tube defects. Arrow points to the open neural fold. (C) Frequencies of neural tube defects were scored by the lack of neural fold formation. Numbers of scored embryos per group are shown above each bar. (C’) Partial rescue of the defect with Par3 RNA, 0.2 ng, is shown. Data are from three different experiments. (D–F), Embryos were injected as described above. Neural plate cells mosaically depleted of Par3 (labeled by GFP) lack Vangl2 enrichment at the anterior border of each cell (asterisks) as compared to control GFP-negative cells (arrows). D', D'', F', F'' are single-channel images corresponding to D and F. CO MO1 injection had no effect on the anterior distribution of Vangl2. Scale bar, 20 µm. (E) Quantification of data from the experiments with Par3MOATG showing mean frequencies ± s. d. of cells with anterior Vangl2. At least 5–10 embryos were examined per each treatment. Numbers of scored cells are shown on top of each bar. Co, uninjected control. (G) Immunoblot analysis of Vangl2 in embryo extracts. Xenopus embryos were injected with the indicated MOs into animal pole blastomeres at the two-cell stage and collected at stage 13 for immunoblotting (IB) with Vangl2 antibodies. Asterisk marks a non-specific band indicating loading. Uni, uninjected.
Figure 2—figure supplement 1
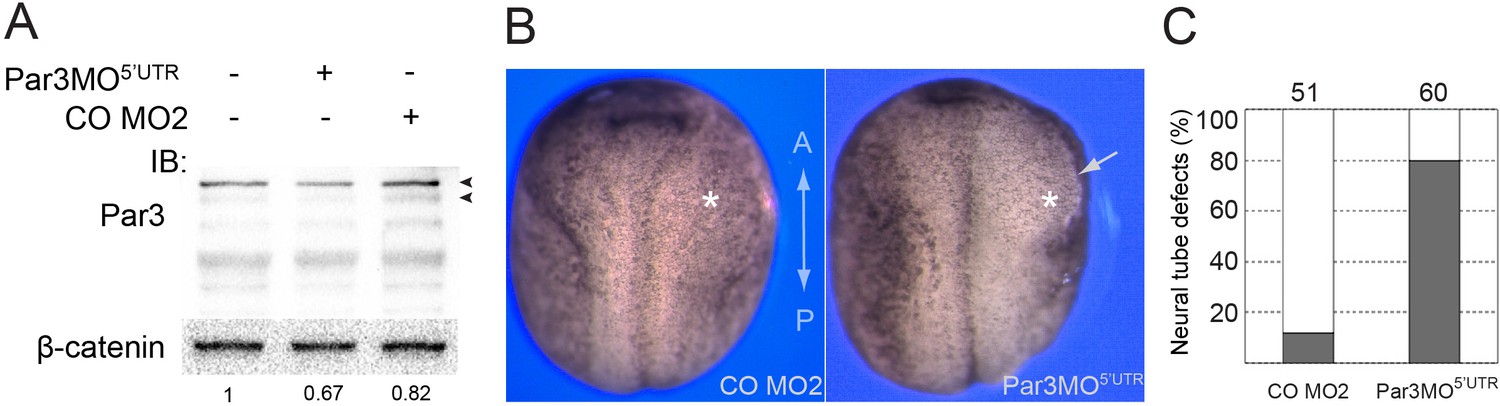
Depletion of Par3 with Par3MO5’UTR causes neural tube closure defects.
(A) Four-to eight-cell embryos were injected with Control MO2 (CO MO2) and Par3MO5’UTR into each of the animal blastomeres (10 ng per blastomere). Ectoderm explants (animal caps) were prepared from the injected embryos at midblastula stages. The explants were lysed at the equivalent of stage 14 for immunobloting with anti-Par3 and anti-β-catenin antibodies. The decrease in the intensity of two bands is observed in Par3MO5’UTR but not CO MO2 injected explants (arrowheads); β-catenin is a control for loading. Band intensity ratios of the highest molecular weight Par3 isoform to β-catenin are shown. This ratio is set to one in uninjected explants. (B) Eight-cell embryos were unilaterally injected into two animal blastomeres with CO MO2, 20 ng, or Par3MO5’UTR, 20 ng, as indicated. Dorsal view is shown, and the anteroposterior (AP) axis of the neural plate is indicated. (B, C) Par3 depletion results in neural tube defects. Arrow points to the open neural fold, asterisk indicates the injected side. (C) Frequencies of neural tube defects were scored by the lack of neural fold formation at the injected side. Numbers of scored embryos per group are shown above each bar. Data are representative of two experiments.
Figure 2—figure supplement 2
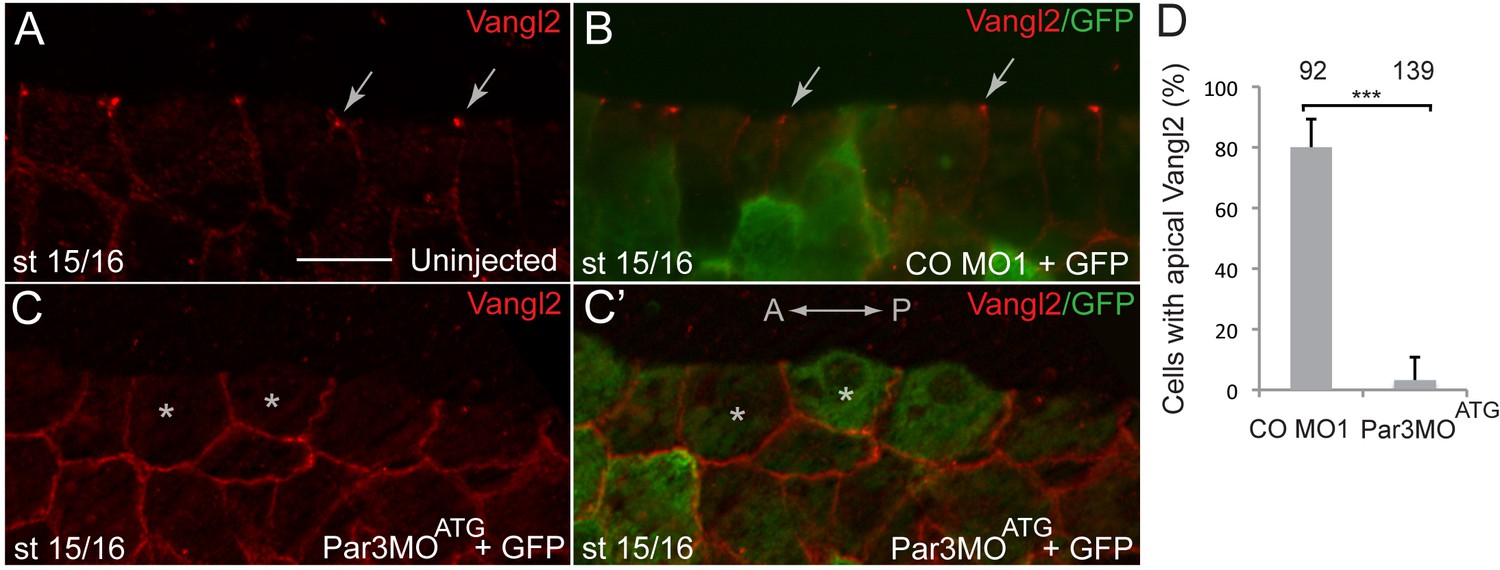
Par3MOATG inhibits apical accumulation of Vangl2 at the neural plate midline.
Sagittal sections of stage 15/16 embryos were immunostained with anti-Vangl2 and anti-GFP antibody. The anteroposterior (AP) axis is indicated. Apical surface is at the top. (A, B) Vangl2 is enriched at the apical corners of cells at the neural midline in uninjected and CO MO1-injected embryos (arrows). (C, C’) Basolateral localization of Vangl2 at the cell junctions of Par3MOATG-injected embryos (asterisks). (D) Quantification of apical Vangl2 staining in CO MO1 and Par3MOATG-injected tissue. Number of counted cells is shown above the bars. Error bars represent standard deviation. Significance was determined by the two-tailed Student’s t-test, p<0.001 (asterisks). Scale bar, 20 mm.
Figure 2—figure supplement 3
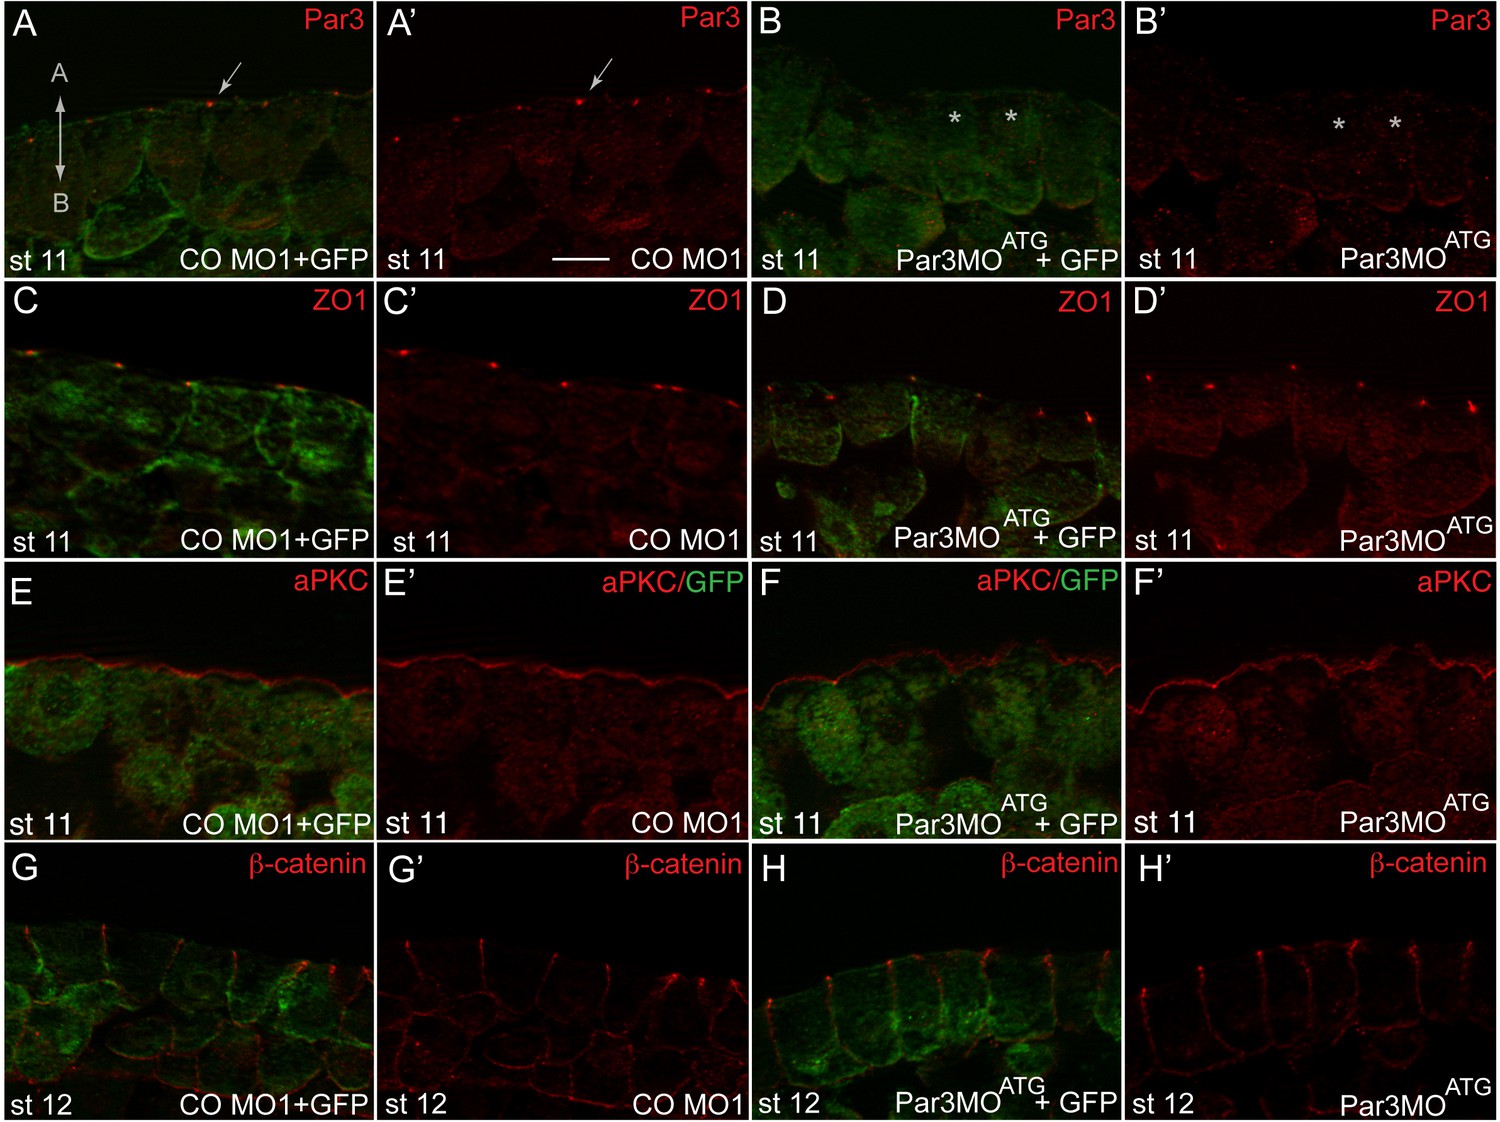
Par3 depletion does not affect the localization of aPKC, b-catenin and ZO1 in gastrula ectoderm.
Early embryos were injected with control morpholino (CO MO1) or Par3MOATG (20 ng each) and GFP RNA (100 pg) as a lineage tracer, cultured until stage 11 or stage 12, sectioned and stained for junctional, polarity markers and GFP as indicated. CO MO1 has no effect on (A) Par3 (arrow), (C) ZO1, (E) aPKC and (G) b-catenin. (B, D, F, H) Par3MOATG reduced levels of (B) Par3 (asterisks), but not (D) ZO1, (F) aPKC or (H) b-catenin. (A–H) merged images showing co-staining with GFP. Scale bar, 20 µm. Apicobasal (A–B) axis is indicated. Images are representative of 3 independent experiments, each containing 15–20 embryos per group.
Figure 2—figure supplement 4
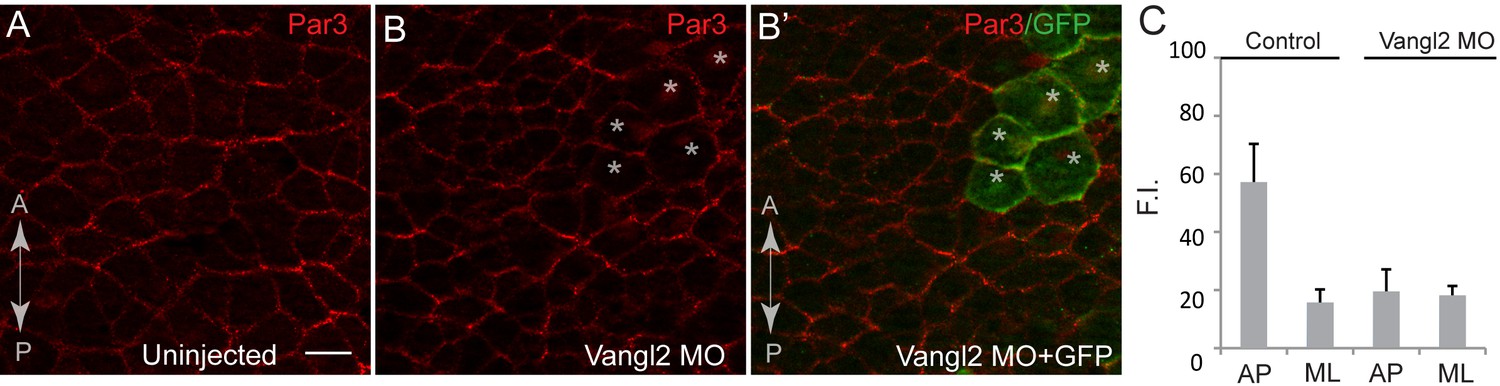
Planar polarity of Par3 is lost in Vangl2-depleted cells in the neural plate.
(A, B) En face view of immunostained neural plate explants from fixed Xenopus embryos at stages 15/16. The anteroposterior (AP) axis is shown. (A) Par3 is enriched at the anteroposterior cell borders in untreated cells. (B, B’) Polarization of Par3 at the anteroposterior cell borders is no longer detected in Vangl2 MO injected cells (asterisks). (C) Results are shown as means ± s. d., with each group containing ten embryos. At least 15 cells from two embryos were analyzed per group. F.I., Fluorescence intensity. The experiment was repeated two times. Scale bar, 20 µm.
Figure 3

Par3 interacts with Pk3 in HEK293T cells and Xenopus embryos.
(A–C) Physical interaction of Par3 and Pk3 in transfected HEK293T cells. Myc-Par3 is pulled down from cell lysates with FLAG-Pk3 (A) or FLAG-GFP(FG)-Pk3∆PET (B). FG-Pk3∆PET is pulled down with Myc-Par3 (C). (D, E) Interaction of Par3 and Pk3 in Xenopus embryos assessed by proximity biotinylation. (D) Experimental scheme. Biotin and RNAs encoding FLAG-Biotin Ligase (BL)-Pk3 or FLAG-BL-Vangl2, 0.5 ng each, with or without GFP-Par3 RNA, 0.1 ng, were injected into the animal region of four- to eight- cell embryos. Injected embryos were lysed at stages 12.5–13 for immunodetection of biotinylated proteins. (E) Exogenous (left) and endogenous (right) Par3 is biotinylated by BL-Pk3 but not BL-Vangl2. Three bands that correspond to endogenous Par3 isoforms (bracket) are pulled down and detected by anti-Par3 antibodies, however only the top band corresponds to exogenous GFP-Par3 (arrowheads). Protein levels are shown by immunoblotting with anti-Myc and anti-FLAG antibodies in (A–C) and anti-biotin, anti-Par3, anti-FLAG and anti-GFP antibodies in (E).
Figure 4
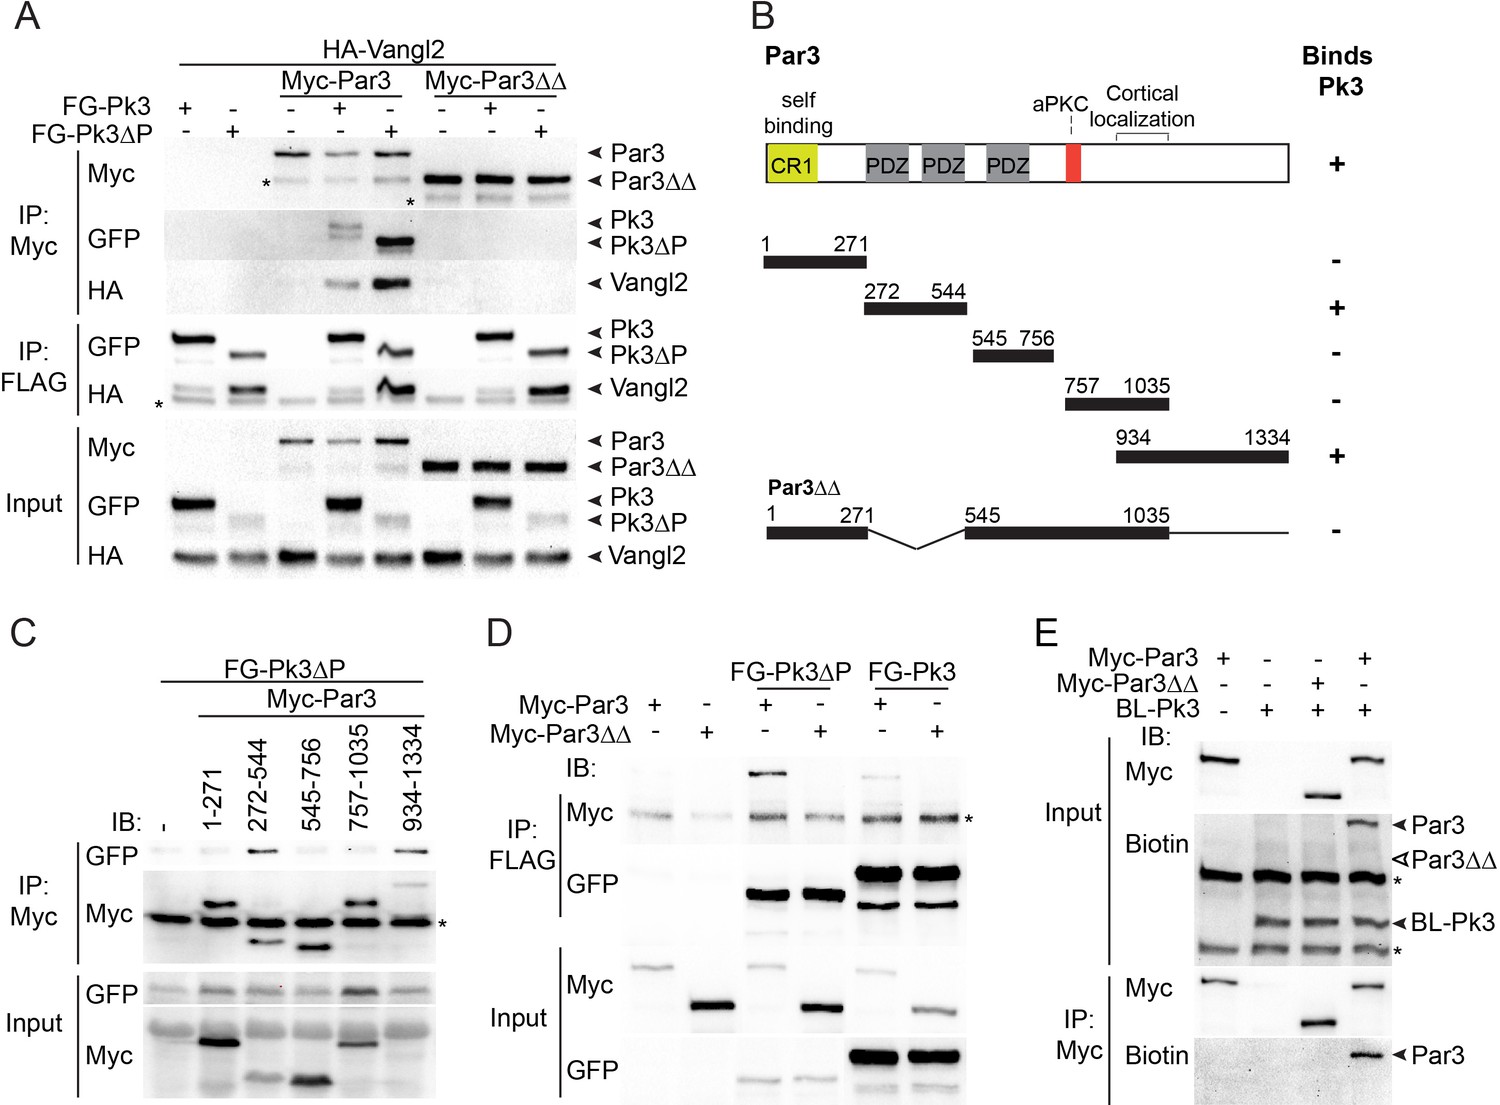
The association of Par3 with the Pk3/Vangl2 complex and the identification of Pk3-interacting domains.
(A) HEK293T cells were transfected with Par3, Pk3 or Pk3∆PET (Pk3∆P) and Vangl2 constructs as indicated. Sequential pulldowns of protein complexes containing Myc-Par3, FLAG-GFP(FG)-Pk3 or FG-Pk3∆P and HA-Vangl2 with Myc-Trap and anti-FLAG (M2) beads are shown. Note that Par3 binds Vangl2 only in the presence of Pk3 or Pk3∆P. Asterisks mark nonspecific bands. (B). Schematic showing the Par3 constructs used in these experiments and the summary of Par3 binding. (C) Co-immunoprecipitation of Myc-Par3 constructs with FG-Pk3∆P (see Figure 3 legend). (A sterisk indicates IgG heavy chain. (D) Pulldowns of FG-Pk3∆P or wild type FG-Pk3 with Myc-Par3 or Myc-Par3∆∆. Asterisk shows a nonspecific band. (E) Interaction of Par3 and Pk3 assessed by proximity biotinylation in Xenopus embryos. Exogenous Par3 but not Par3∆∆ is biotinylated by BL-Pk3. Black arrowheads point to biotinylated Par3 and BL-Pk3, and white arrowheads indicate the expected position of Par3∆∆. Asterisks indicate endogenous proteins detected by anti-biotin antibodies. Protein levels are shown by immunoblotting with anti-Myc, anti-HA, anti-GFP and anti-biotin antibodies as indicated.
Figure 5 with 3 supplements
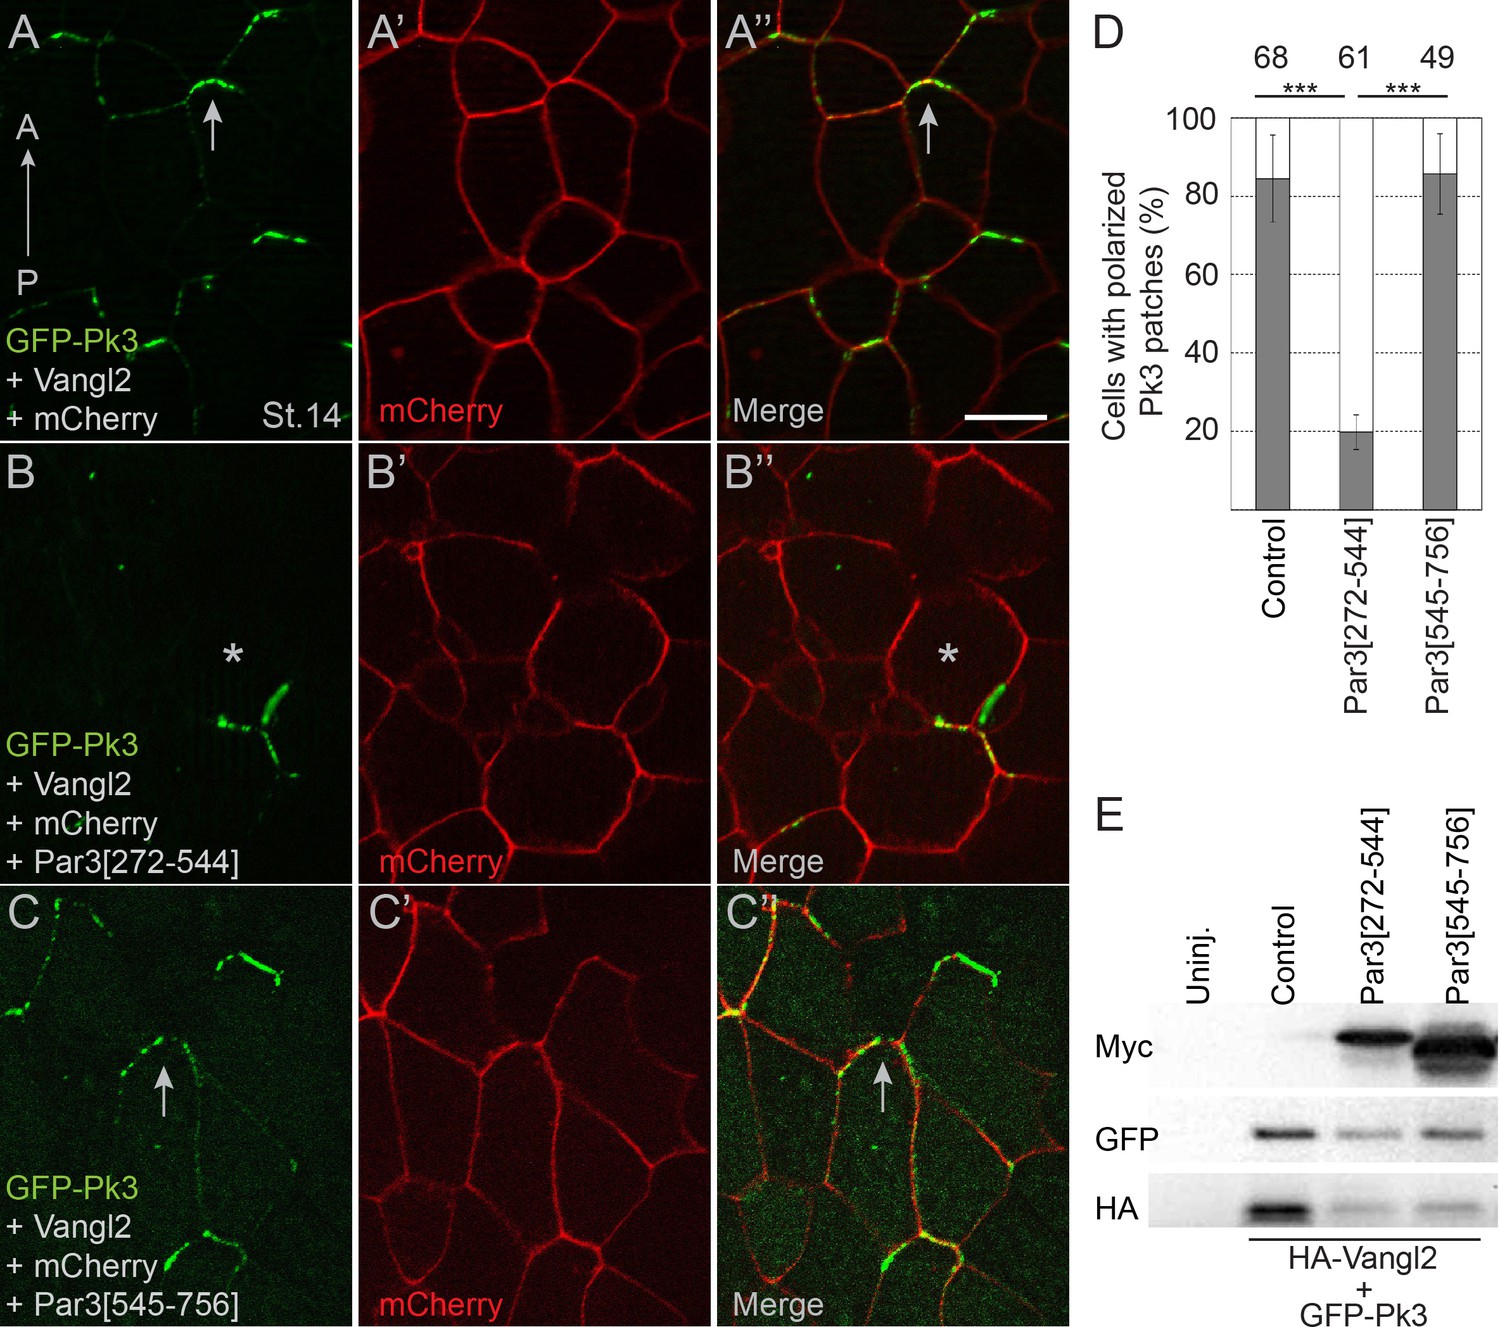
Pk3-interacting fragment of Par3 interferes with neural plate PCP.
Two dorsal blastomeres of 16 cell embryos were injected with RNAs encoding GFP-Pk3 (100 pg), HA-Vangl2 (25 pg) and mCherry (70 pg) without (A–A”) or with Par3[272-544] (0.5 ng) (B–B’’) or Par3[545-756] (0.5 ng) (C–C’’). Cells from embryos at stage 14 (St.14) with anteriorly polarized (arrows) and mislocalized (asterisks) GFP-Pk3 patches are shown. Anteroposterior (AP) axis of the neural plate is indicated. Scale bar, 20 µm. (D) Quantification of data in (A–C) shown as mean frequencies ± s. d. of polarized GFP-Pk3 patches in neuroepithelial cells. Total numbers of scored cells are shown above each bar; 5 to 25 cells were scored per embryo with five embryos taken for each experimental condition, statistical significance was determined by two-tailed Student’s t-test, p<0.001. Data are representative of two experiments. (E) Protein expression levels were assessed in stage 14 embryos by immunoblotting with anti-Myc, anti-GFP and anti-HA antibodies. Control, embryos injected with HA-Vangl2 and GFP-Pk3 RNAs without Par3 constructs, Uninj., uninjected embryos.
Figure 5—figure supplement 1
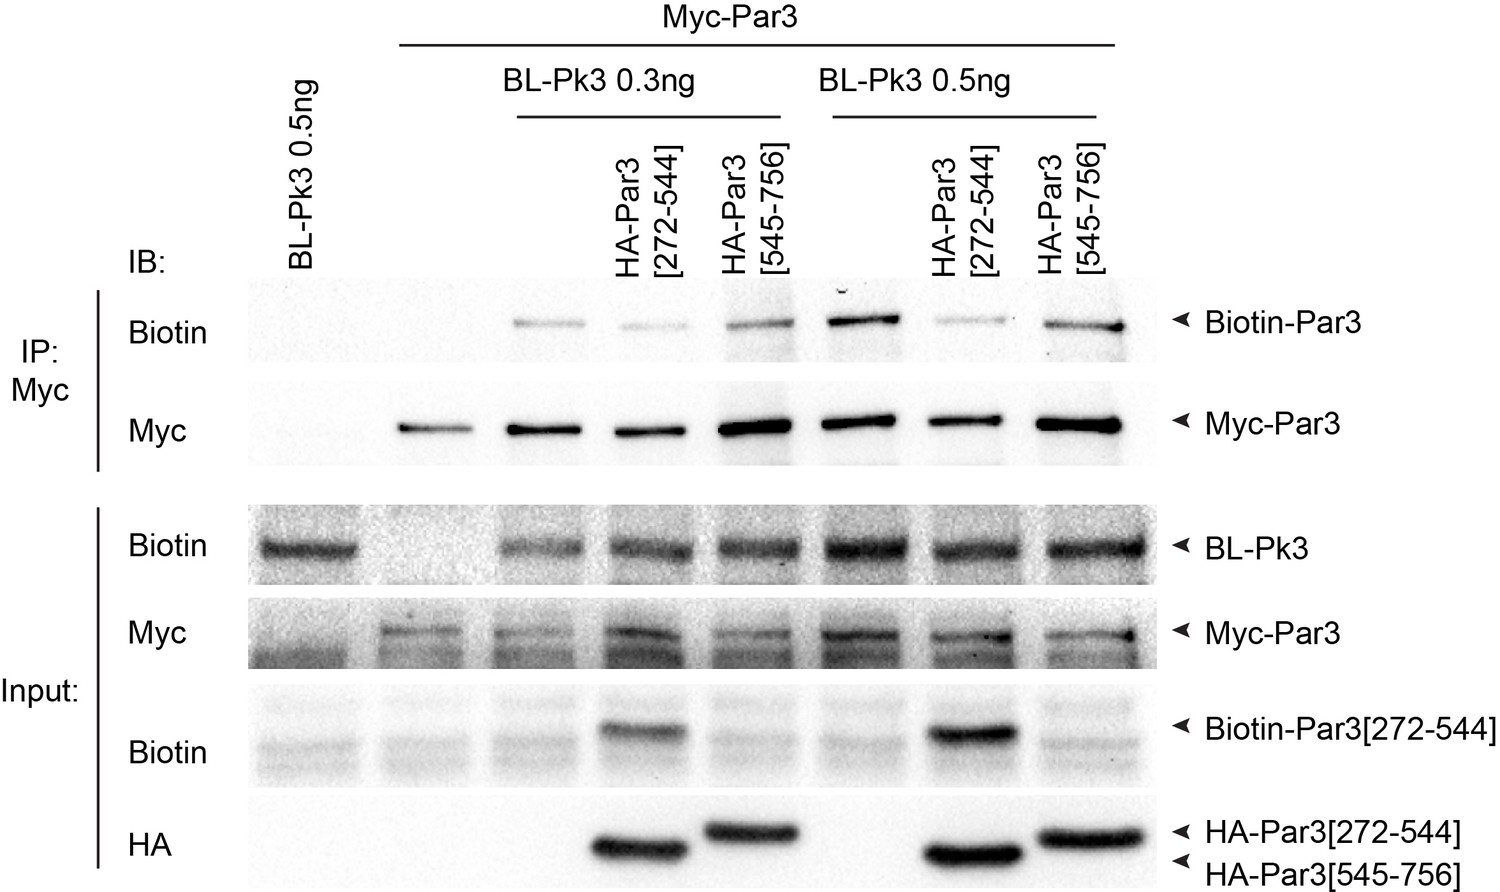
Interaction of Pk3 and Par3 in Xenopus embryos is inhibited by Pk3 binding fragment of Par3.
Interaction of Par3 and Pk3 was assessed by proximity biotinylation. Biotin and RNAs encoding FLAG-BL-Pk3, with or without Myc-Par3 RNA, 0.1 ng, and HA-Par3[272-544] or HA-Par3[545-756] were injected into the animal region of four- to-eight-cell embryos. Injected embryos were lysed at stage 13 for immunodetection of biotinylated proteins. Levels of Par3 biotinylation were assessed in Myc pulldowns. Biotinylation of HA-Par3[272-544] and HA[545-756] constructs was compared in embryo lysates. Only HA-Par3[272-544] was biotinylated. Protein levels are shown by immunoblotting with anti-biotin, anti-Myc and anti-HA antibodies.
Figure 5—figure supplement 2
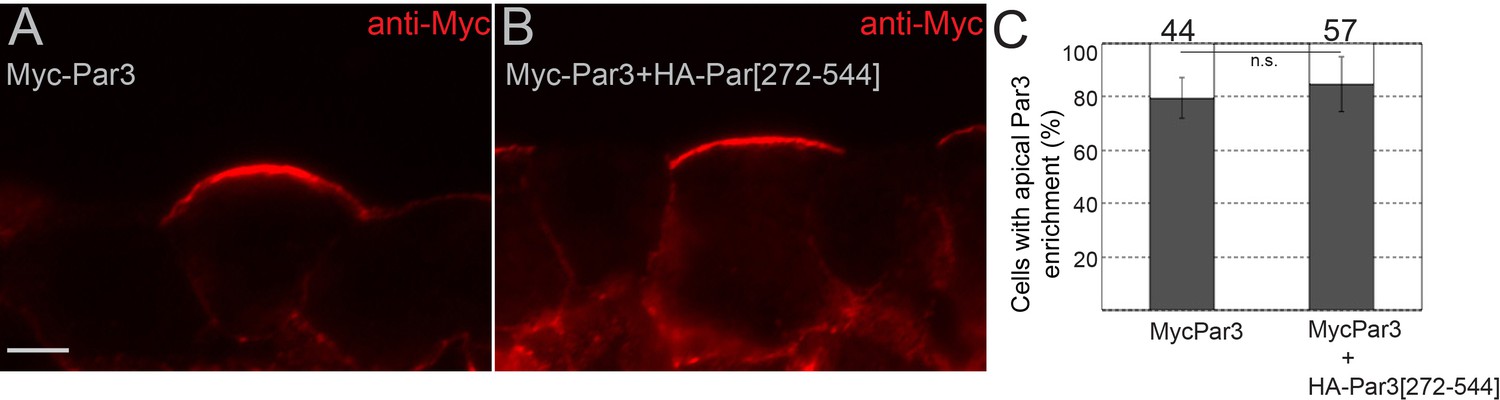
Par3[272-544] construct does not affect Par3 localization.
(A–C) Four animal blastomeres of 16 cell embryos were injected with Myc-Par3 RNA, 70 pg with or without 0.5 ng of HA-Par3[272-544] RNA. Injected embryos were cultured until stage 11, cryosectioned and immunostained for Myc (A, B). (A, B) Myc-Par3 with is enriched at the apical membrane. Scale bar, 10 µm. (C) Quantification of data in (A, C) shown as mean frequencies ± s. d. of superficial ectoderm cells with apically enriched Myc-Par3. Total numbers of scored cells are shown above each bar; 13 to 26 cells were scored per embryo with three embryos taken for each experimental condition, statistical difference determined by two-tailed Student’s t-test was not significant, p>0.05. Data are representative of two experiments.
Figure 5—figure supplement 3
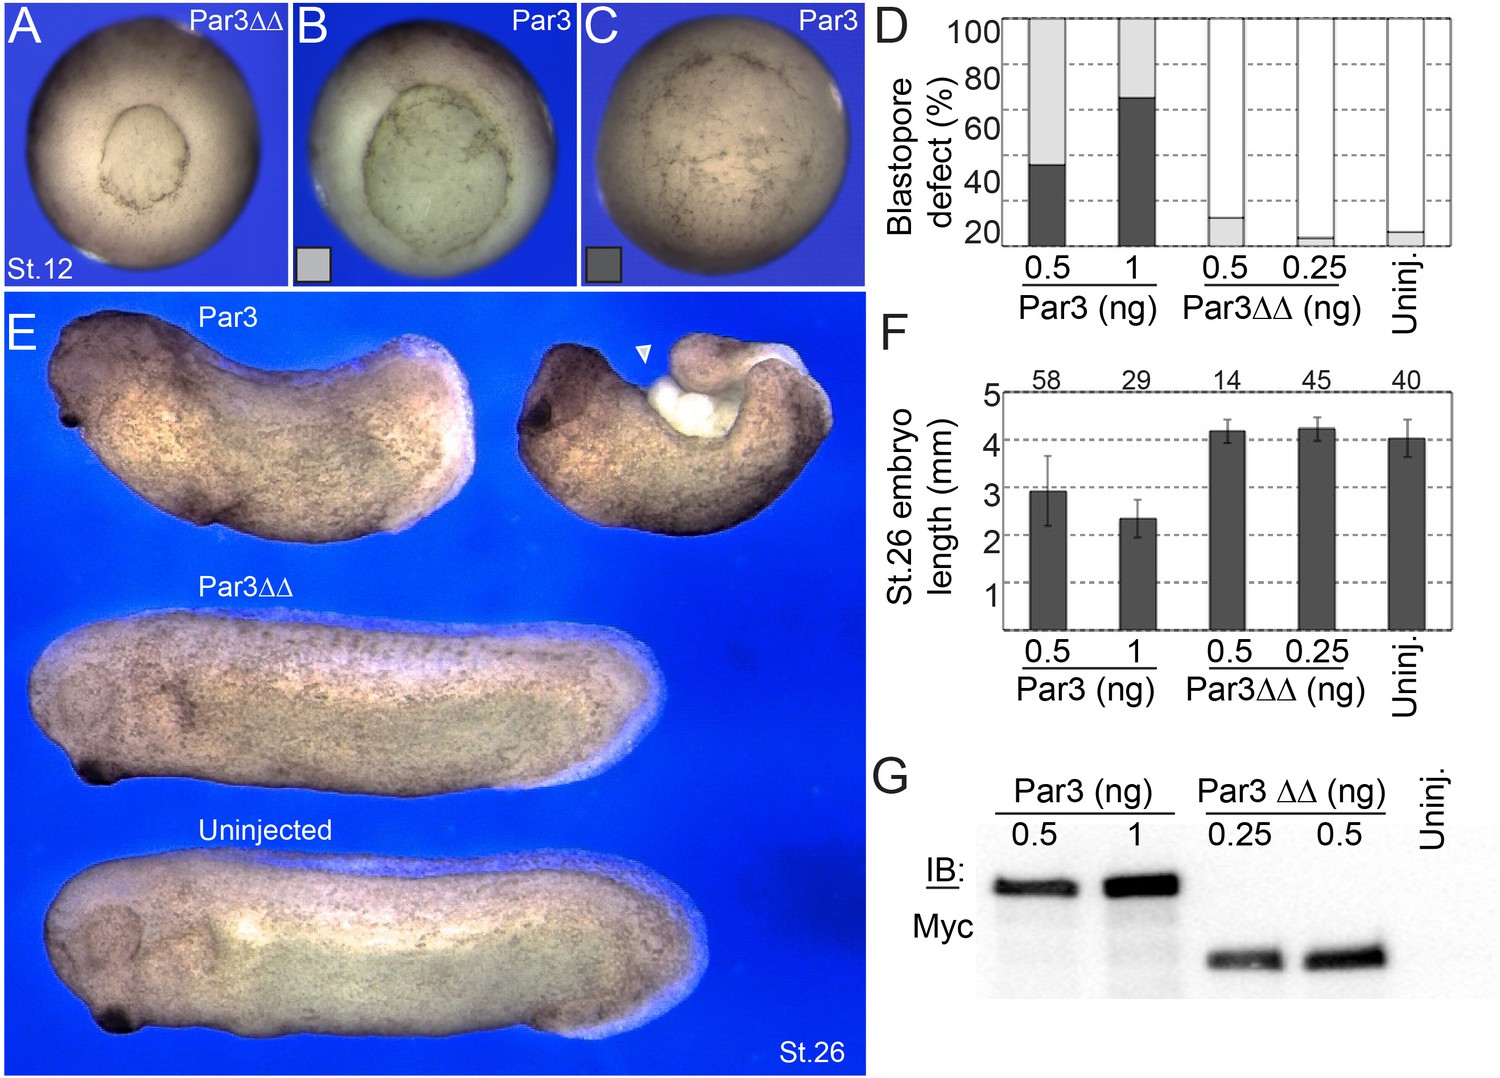
The ability of Par3 to inhibit blastopore closure and body axis elongation is lost upon the disruption of Pk3 binding.
Four-cell stage embryos were injected with Par3 constructs into the marginal zone of two dorsal blastomeres. (A–C) Vegetal views of stage 12 (St. 12) embryos injected with Par3∆∆ RNA (A, 0.5 ng), and wild type Par3 RNA (B, C, 0.5 ng). (D) Frequencies of mild (B) and severe (C) blastopore defects. (E) Representative images of stage 26 (St. 26) embryos injected with Par3 (0.5 ng) and Par3∆∆ (0.5 ng) RNAs. Par3-expressing embryos were shortened (top left) and often exhibited protruding endoderm due to incomplete blastopore closure (arrowhead). By contrast, Par3∆∆-injected embryos were similar to uninjected embryos. (F) Average length of embryos ± s. d. is shown. (G) Comparison of Par3 protein levels in injected stage 12 embryos by immunoblotting with anti-Myc antibodies. Each sample has been pooled from five embryos. Each lane was loaded with lysate amount equivalent to half-embryo.
Figure 6 with 1 supplement
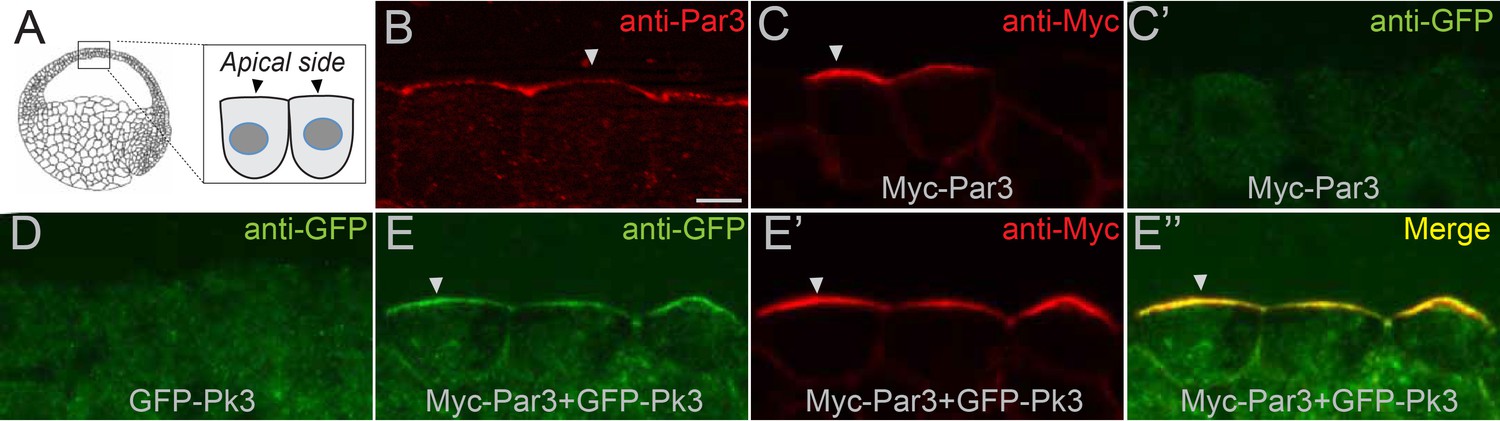
Par3 recruits Pk3 to the apical side of the cell in vivo.
Embryos were injected with GFP-Pk3 and Myc-Par3 RNAs (100 pg each), cryosectioned at stage 10.5 and immunostained with indicated antibodies (A) Scheme showing a relative position of imaged superficial ectoderm cells. Both endogenous Par3 (B), and exogenous Myc-Par3 (C, E’, E’’) are apically localized. (C’) Lack of Myc-Par3 staining with anti-GFP antibody. (D) Lack of apical enrichment of exogenous GFP-Pk3. (E–E’’) Myc-Par3 recruits GFP-Pk3 to the apical surface. (B, C, E) Apical enrichment is shown by arrowheads. The apical recruitment of Pk3 was observed in > 90% of cells coinjected with Pk3 and Par3. Each group contained five embryos. The same results were obtained in five independent experiments. Scale bar 10 µm.
Figure 6—figure supplement 1
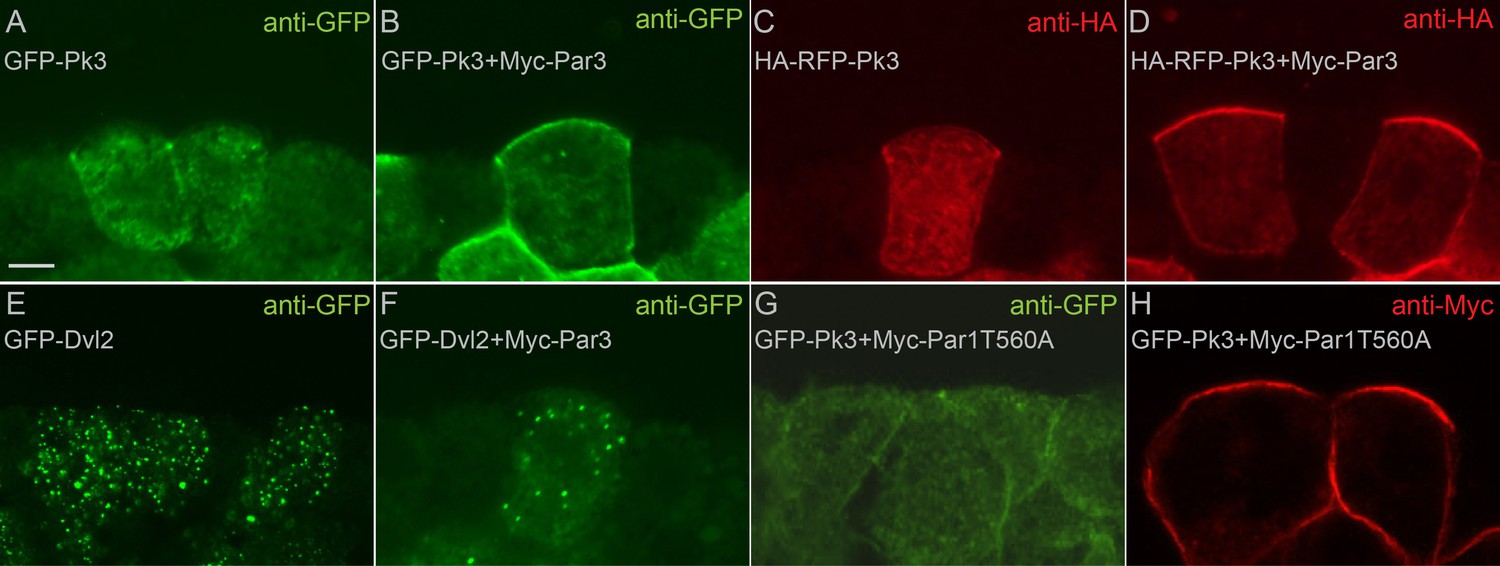
Par3 recruits Pk3 but not Dvl2 to the apical cell membrane.
8–16 cell Xenopus embryos were injected animally with 100 pg of the RNAs encoding GFP-Pk3 (Pk3), HA-RFP-Pk3, GFP-Dvl2, Myc-Par3 and Myc-Par1T560A as indicated, cultured until stage 10.5, cryosectioned and immunostained for GFP (A, B, E–G), HA (C, D) or Myc (H). Myc-Par3 recruits GFP-Pk3 (A, B), but not GFP-Dvl2 (E, F), to the apical membrane. (C, D) Myc-Par3 promotes the apical localization of HA-RFP-Pk3. (G) Myc-Par1T560A does not promote GFP-Pk3 apical localization. (H) Myc-Par1T560A is cortically localized. Scale bar, 10 µm. The apical recruitment of Pk3 was observed in the majority (>90%, n > 100) of cells co-expressing Pk3 and Par3, but not in cells expressing Pk3 alone.
Figure 7 with 2 supplements
Par3 is required for the interaction of Pk3 and Vangl2 in vivo.
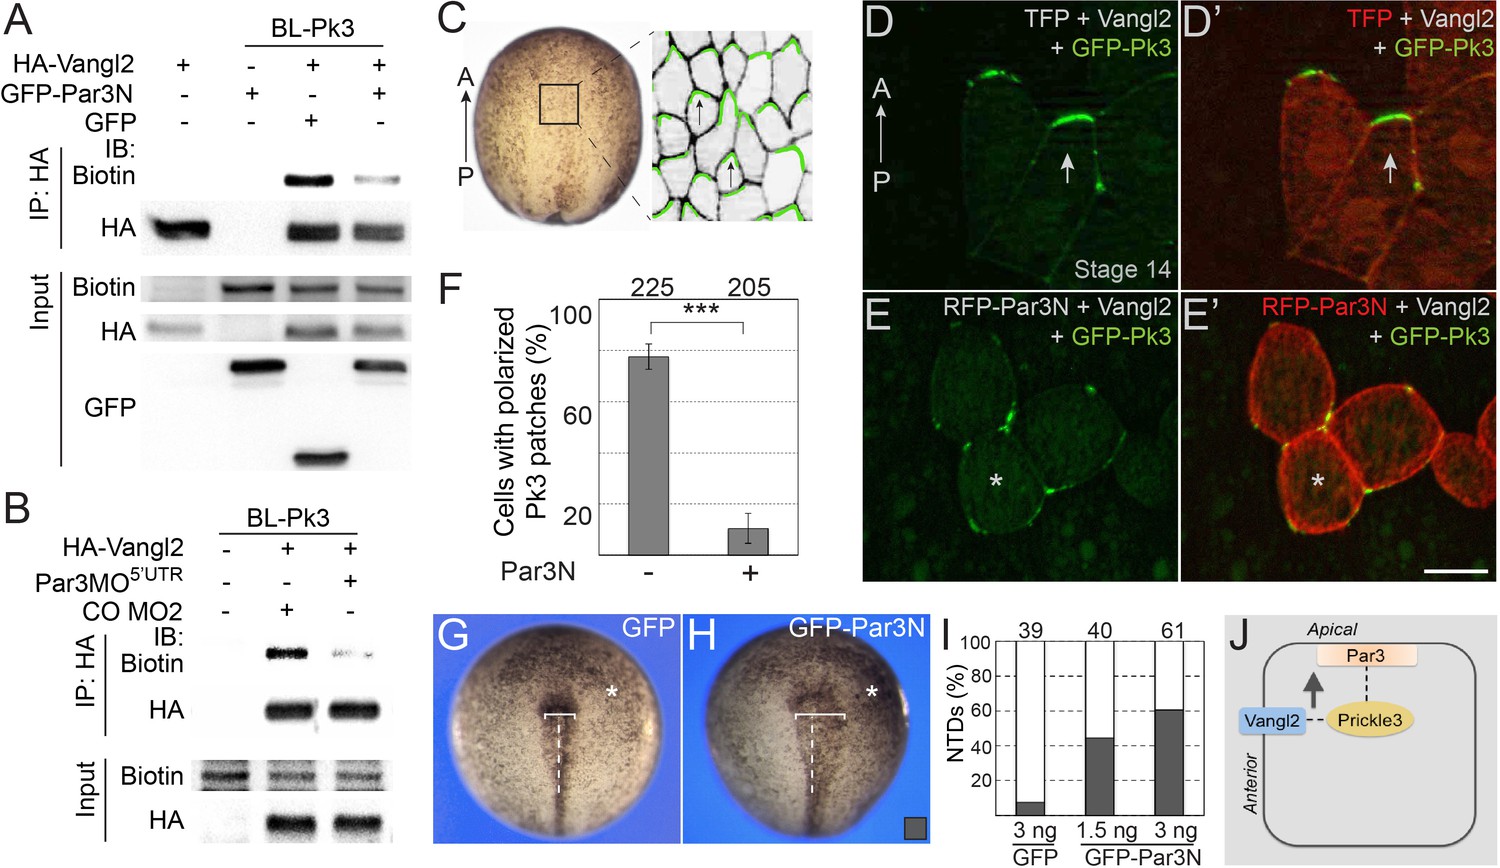
(A, B) Decrease of Vangl2 biotinylation by BL-Pk3 (see Figure 3) in embryos injected with Par3MO or Par3N RNA. Embryos were coinjected into animal blastomeres with biotin and RNAs encoding BL-Pk3, 0.1 ng, and HA-Vangl2, 50 pg, GFP, 1 ng, GFP-Par3N, 1 ng (A), or MOs (CO MO2 or Par3MO5’UTR, 10 ng each, (B) as indicated. Biotinylated HA-Vangl2 was detected with anti-biotin antibodies in pulldowns with anti-HA antibodies. (A, B). Protein expression levels in stage 13 embryos were assessed by immunoblotting of lysates with anti-HA, anti-GFP and anti-biotin (for FLAG-BL-Pk3 protein) antibodies (A, B). (C–I) Par3N disrupts neuroepithelial PCP. (C–E) Two dorsal blastomeres of 16 cell embryos were injected with GFP-Pk3 RNA, 100 pg, HA-Vangl2 RNA, 25 pg, and Turbo FP635 (TFP) RNA, 0.1 ng, or RFP-Par3N RNA, 0.4 ng. Injected embryos were cultured until stage 14, fixed and the neural plate explants were imaged. (C) En face view of a neurula embryo. Polarized cells from the boxed area used for imaging are shown schematically on the right. Anterior PCP complexes are in green (arrows), the anterior-posterior (AP) axis is indicated. (D–E’) Representative images. (D, D’) Anterior enrichment of Pk3/Vangl2 complexes (arrows) in a control embryo. (E, E’) Lack of PCP (asterisks) in a Par3N-expressing embryo. Scale bar, 20 µm. (F) Frequencies of neuroepithelial cells containing polarized Pk3 cortical patches. Means ± s. d. are shown for three independent experiments. Total numbers of scored cells are above each bar. Significance was determined by the two-tailed Student’s t-test, p<0.001 (asterisks). (G–I) Neural tube defects in representative stage 17/18 embryos unilaterally injected with GFP RNA (3 ng, (G) or GFP-Par3N RNA (3 ng, (H). Asterisk indicates the injected side. Note the difference in the distance between the neural fold and the midline (white line) at the injected side as compared to the uninjected side. (I) Frequencies of neural tube defects shown in G, H. Numbers of embryos from two experiments are shown above each bar. (J) Working model: Par3 recruits Pk3 to the apical surface to promote the interaction of Pk3 and Vangl2 at the apical junctions that is necessary for planar polarization.
Figure 7—figure supplement 1
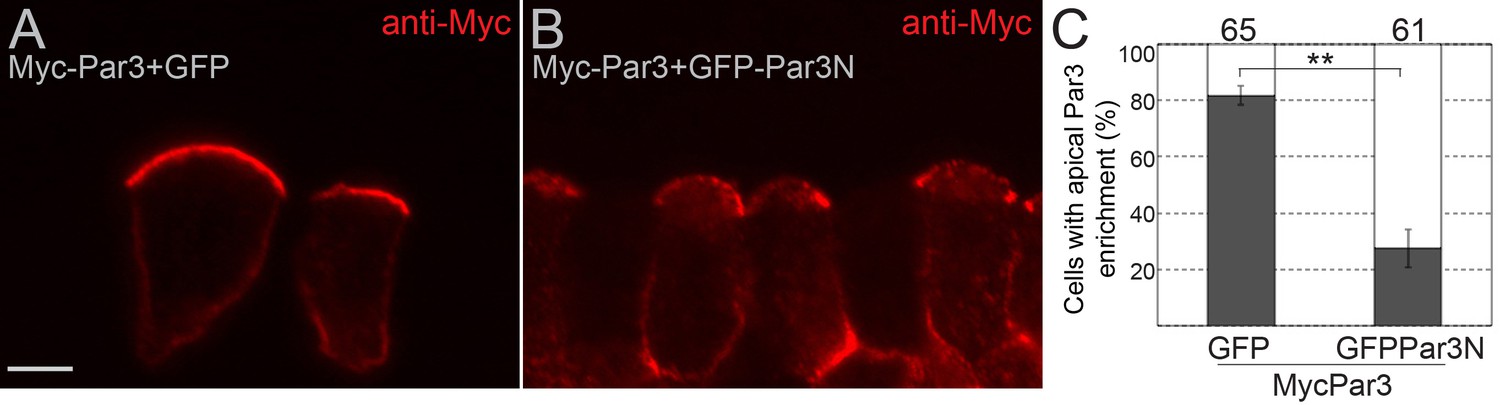
Par3N inhibits the apical localization of Par3.
(A–C) Four animal blastomeres of 16 cell embryos were injected with 70 pg of Myc-Par3 RNA and 0.8 ng of GFP or GFP-Par3N RNAs. Injected embryos were cultured until stage 11, cryosectioned and immunostained for Myc (A, B). (A) Myc-Par3 co-expressed with GFP is enriched at the apical membrane. (B) This apical enrichment of Myc-Par3 is reduced by coinjection of GFP-Par3N RNA. Scale bar, 10 µm. (C) Data in (A, C) are shown as mean frequencies (±s. (d).) of superficial ectoderm cells with apically enriched Myc-Par3. Total numbers of scored cells are shown above each bar; 4 to 15 cells were scored per embryo with six embryos in each experimental group. Statistical significance was determined by two-tailed Student’s t-test, p<0.01. Data are representative of two experiments.
Figure 7—figure supplement 2
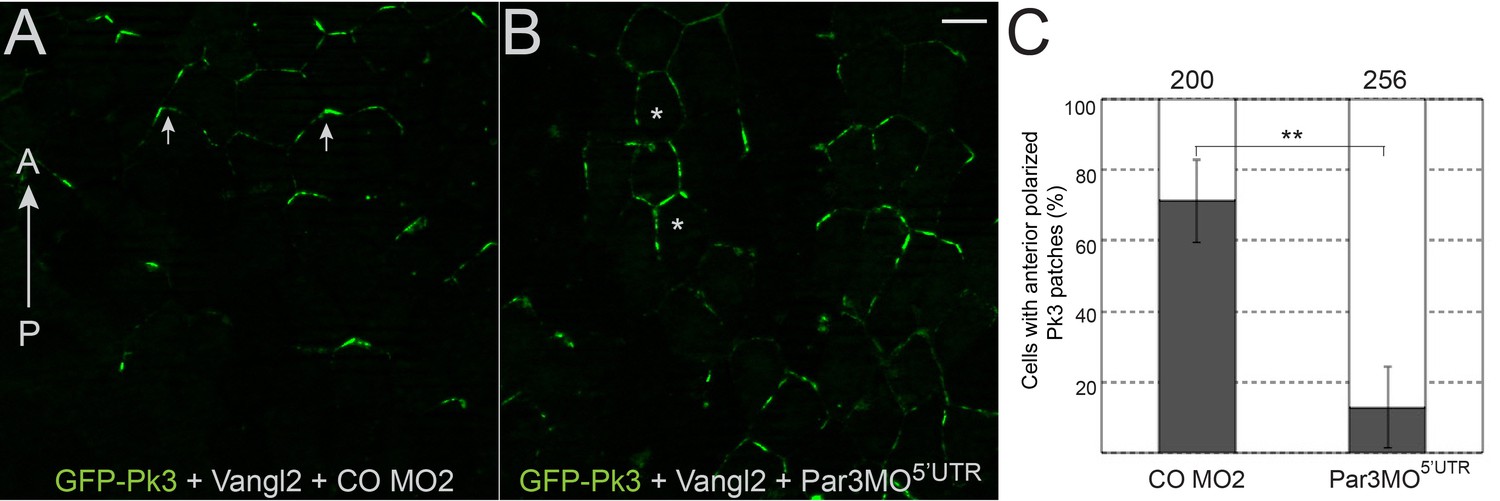
Par3 depletion disrupts the polarization of Pk3-Vangl2 complexes in the neural plate.
(A, B) Par3 depletion disrupts neuroepithelial PCP. Two dorsal blastomeres of 16 cell embryos were injected with GFP-Pk3 RNA, 100 pg, HA-Vangl2 RNA, 25 pg, and CO MO2 or Par3MO5’UTR, 10 ng each. Injected embryos were cultured until stage 14, fixed and imaged. (A–B) Representative images of the neural plates. (A) Anterior enrichment of Pk3/Vangl2 complexes (arrows) in a CO MO2 injected embryo. (B) Lack of PCP (asterisks) in a Par3MO5’UTR-injected embryo. Scale bar, 20 µm. (C) Frequencies of neuroepithelial cells containing polarized Pk3 cortical patches. 7 to 40 cells were scored per embryo with three embryos per each group. Means ± s. d. represent three independent experiments. Total numbers of scored cells are above each bar. Significance was determined by the two-tailed Student’s t-test, p<0.01 (asterisks).
Tables
Key resources table
| Reagent type (species) or resource | Designation | Source or reference | Identifiers | Additional information |
|---|---|---|---|---|
| Gene (Mus musculus) | Par3 | PMID: 10934475 | accession number AY026057 | |
| Gene (Xenopus laevis) | Par3 | PMID: 25070955 | Xl.16888 | Brian Mitchell lab |
| Gene (X. laevis) | Prickle3 (Pk3) | PMID: 27062996 | GenBank BC154995 | Sergei Sokol lab |
| Gene (X. laevis) | Vangl2 | PMID: 27658614 | GeneID: 398271 | Sergei Sokol lab |
| Gene (Aquifex aeolicus) | Biotin Ligase (BL) | PMID: 26912792 | Sergei Sokol lab | |
| Genetic reagent (X. laevis) | Par3 morpholino, Par3MOATG | this paper | ||
| Genetic reagent (X. laevis) | Par3 morpholino, Par3MO5'UTR | this paper | ||
| Genetic reagent (X. laevis) | Vangl2 MO | PMID: 26079437 | ||
| Cell line (Homo sapiens) | HEK293T | ATCC | RRID:CVCL_0063 | |
| Antibody | anti-PKCζ (rabbit polyclonal, C20) | Santa Cruz | RRID:AB_2300359 | (1:200 IHC) |
| Antibody | anti-Biotin (goat polyclonal) | Cell Signaling | RRID:AB_10696897 | (1:3000 IB) |
| Antibody | anti-β-Catenin (rabbit polyclonal) | Sigma | RRID:AB_476831 | (1:200 IHC) |
| Antibody | anti-FLAG (mouse monoclonal, M2) | Sigma | RRID:AB_439685 | (1:1000 IB) |
| Antibody | anti-GFP (mouse monoclonal, B2) | Santa Cruz | RRID:AB_627695 | (1:100 IHC, 1:4000 IB) |
| Antibody | anti-GFP (rabbit polyclonal) | Invitrogen | RRID:AB_221569 | (1:600) |
| Antibody | anti-HA (mouse monoclonal, 12CA5) | NA | RRID:AB_2532070 | (1:100 IHC, 1:1000 IB) |
| Antibody | anti-HA (rabbit polyclonal) | Bethyl Laboratories | RRID:AB_67465 | (1:3000 IB) |
| Antibody | anti-Myc (mouse monoclonal, 9E10) | RRID:CVCL_G671 | (1:60 IHC) | |
| Antibody | anti-Par3 (rabbit polyclonal) | Millipore | RRID:AB_11213581 | (1:200 IHC, 1:4000 IB) |
| Antibody | anti-Vangl2 (rabbit polyclonal) | PMID: 25910938 | RRID:AB_2744499 | (1:100 IHC, 1:500 IB) |
| Antibody | anti-ZO1 (mouse monoclonal) | Invitrogen | RRID:AB_2533147 | (1:200 IHC) |
| antibody | anti-ZO1 (rabbit polyclonal) | Zymed | RRID:AB_138452 | (1:200 IHC) |
| Recombinant DNA reagent | BL-Pk3 | this paper | (plasmid) | |
| Recombinant DNA reagent | BL-Vangl2 | this paper | (plasmid) | |
| Recombinant DNA reagent | GFP-C1 | PMID: 22778024 | (plasmid) | |
| Recombinant DNA reagent | GFP-CAAX | PMID: 24818582 | (plasmid) | |
| Recombinant DNA reagent | GFP-Dvl2 | PMID: 15720724 | (plasmid) | |
| Recombinant DNA reagent | GFP-Par3 | PMID: 25070955 | (plasmid) | |
| Recombinant DNA reagent | GFP-Par3N | PMID: 25070955 | (plasmid) | |
| Recombinant DNA reagent | RFP-Par3N | PMID: 25070955 | (plasmid) | |
| Recombinant DNA reagent | mCherry | PMID: 19096028 | (plasmid) | |
| Recombinant DNA reagent | Myc-Par1T560A | PMID: 17993468 | (plasmid) | |
| Recombinant DNA reagent | Myc-Par3 | this paper | (plasmid) | |
| Recombinant DNA reagent | Myc-Par3[1-271] | this paper | (plasmid) | |
| Recombinant DNA reagent | Myc-Par3[272-544] | this paper | (plasmid) | |
| Recombinant DNA reagent | HA-Par3[272-544] | this paper | (plasmid) | |
| Recombinant DNA reagent | HA-Par3[545-756] | this paper | (plasmid) | |
| Recombinant DNA reagent | Myc-Par3[545-756] | this paper | (plasmid) | |
| Recombinant DNA reagent | Myc-Par3[757–1035] | this paper | (plasmid) | |
| Recombinant DNA reagent | Myc-Par3[934–1334] | this paper | (plasmid) | |
| Recombinant DNA reagent | Myc-Par3∆∆ | this paper | (plasmid) | |
| Recombinant DNA reagent | HA-RFP-Pk3 | this paper | (plasmid) | |
| Recombinant DNA reagent | HA-Vangl2 | PMID: 27658614 | (plasmid) | |
| Recombinant DNA reagent | GFP-Pk3 | PMID: 27062996 | (plasmid) | |
| Recombinant DNA reagent | FLAG-Pk3 | PMID: 27062996 | (plasmid) | |
| Recombinant DNA reagent | FLAG-GFP-Pk3 | PMID: 27062996 | (plasmid) | |
| Recombinant DNA reagent | FLAG-Pk3∆PET | PMID: 27062996 | (plasmid) | |
| Recombinant DNA reagent | FLAG-GFP-Pk3∆PET | PMID: 27062996 | (plasmid) | |
| Recombinant DNA reagent | turboFP635 | this paper | (plasmid) | |
| Immunoprecipitation reagent | Myc-Trap beads | Chromotek |
Additional files
-
Transparent reporting form
- https://doi.org/10.7554/eLife.37881.019
Download links
A two-part list of links to download the article, or parts of the article, in various formats.
Downloads (link to download the article as PDF)
Open citations (links to open the citations from this article in various online reference manager services)
Cite this article (links to download the citations from this article in formats compatible with various reference manager tools)
Par3 interacts with Prickle3 to generate apical PCP complexes in the vertebrate neural plate
eLife 7:e37881.
https://doi.org/10.7554/eLife.37881


