SETD3 protein is the actin-specific histidine N-methyltransferase
- University of Warsaw, Poland
- Université Catholique de Louvain, Belgium
- German Cancer Research Center (DKFZ), Germany
- Heidelberg University, Germany
Figures
Figure 1 with 3 supplements
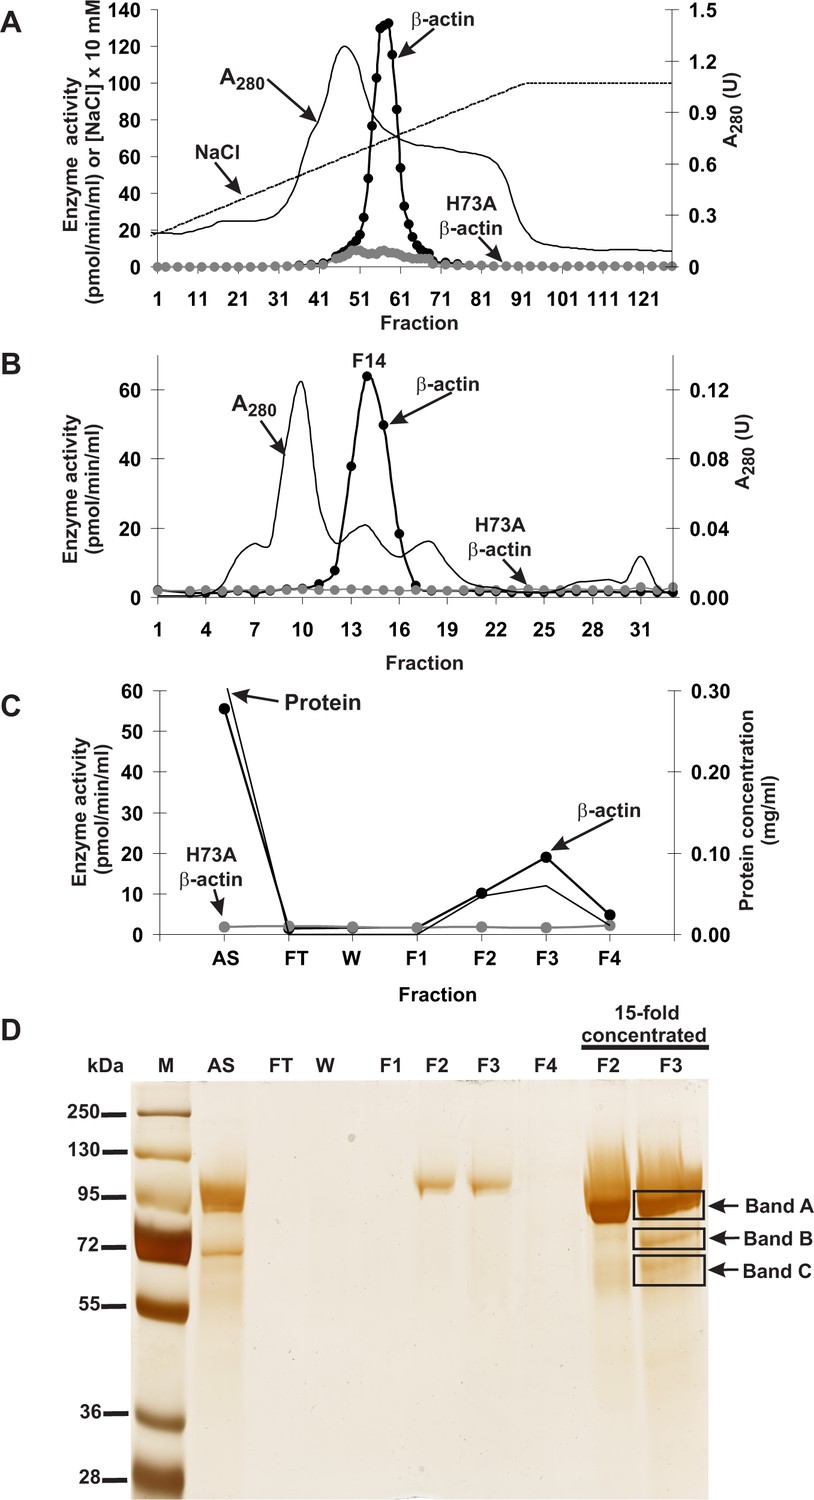
Purification of the rat actin-specific histidine N-methyltransferase.
The enzyme was purified by chromatography on (A) DEAE-Sepharose, (B) Q-Sepharose, Phenyl-Sepharose, HiScreen Blue-Sepharose (shown in Figure 1—figure supplement 3), Superdex 200, and (C) Reactive Red 120 Agarose, as described in the 'Materials and methods' section. Fractions were tested for actin-specific histidine N-methyltransferase activity using either homogeneous recombinant human β-actin or its mutated form H73A. (D) The indicated fractions eluted from the Reactive Red 120 Agarose column were analyzed by SDS-PAGE and the gel was silver-stained (Shevchenko et al., 1996). M, prestained protein marker; AS, applied sample (Fraction 14 from Superdex 200); FT, flow through; W, wash. Fractions F1, F2, F3 and F4 were eluted with 200, 400, 900 and 1400 mM NaCl, respectively. In addition, fractions F2 and F3 were concentrated 15-fold by ultrafiltration (Vivaspin 500) before being analyzed. The indicated bands were cut out of the gel for mass spectrometry analysis.
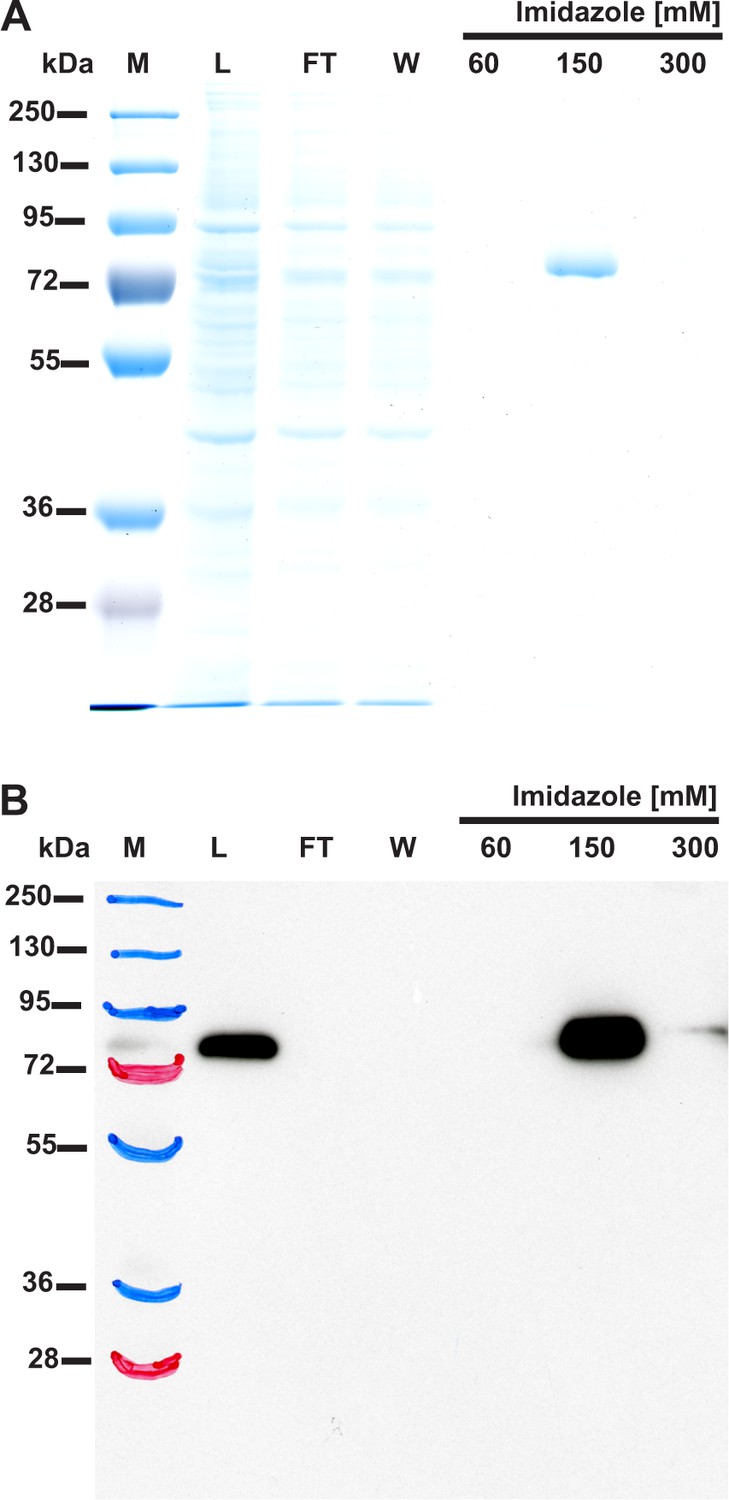
Figure 1—figure supplement 1
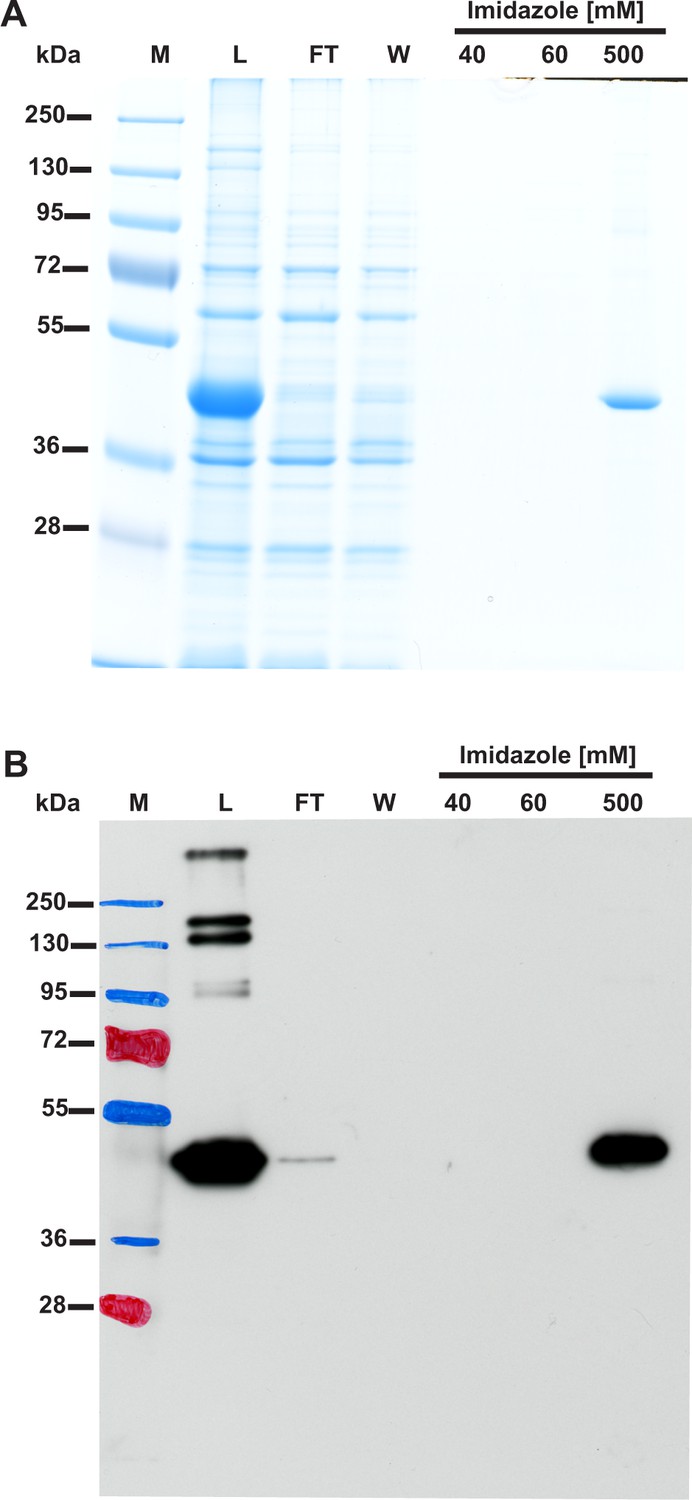
(A) SDS-PAGE and (B) Western-blot analysis of fractions obtained during the purification of recombinant human β-actin overexpressed in E. coli.
Human β-actin was purified to homogeneity by affinity chromatography on nickel-Sepharose (HisTrap HP) as described in the 'Materials and methods'. For the SDS-PAGE analysis, 20 µl of sample from each fraction was loaded onto a 10% gel, electrophoresed and the resulting gel was then stained with colloidal Coomassie blue. For the Western-blot analysis, 1 µl of each fraction was loaded onto a 10% gel, electrophoresed and blotted onto nitrocellulose membrane, which was then sequentially probed with a mouse primary antibody against His6 tag and a horseradish peroxidase-conjugated goat anti-mouse antibody. The secondary antibody was detected employing enhanced chemiluminescence. M, prestained protein marker; L, urea-washed inclusion bodies of E. coli applied on the column; FT, flow through; W, wash. Fractions 40 to 500 were eluted with the indicated concentrations of imidazole.
Figure 1—figure supplement 2
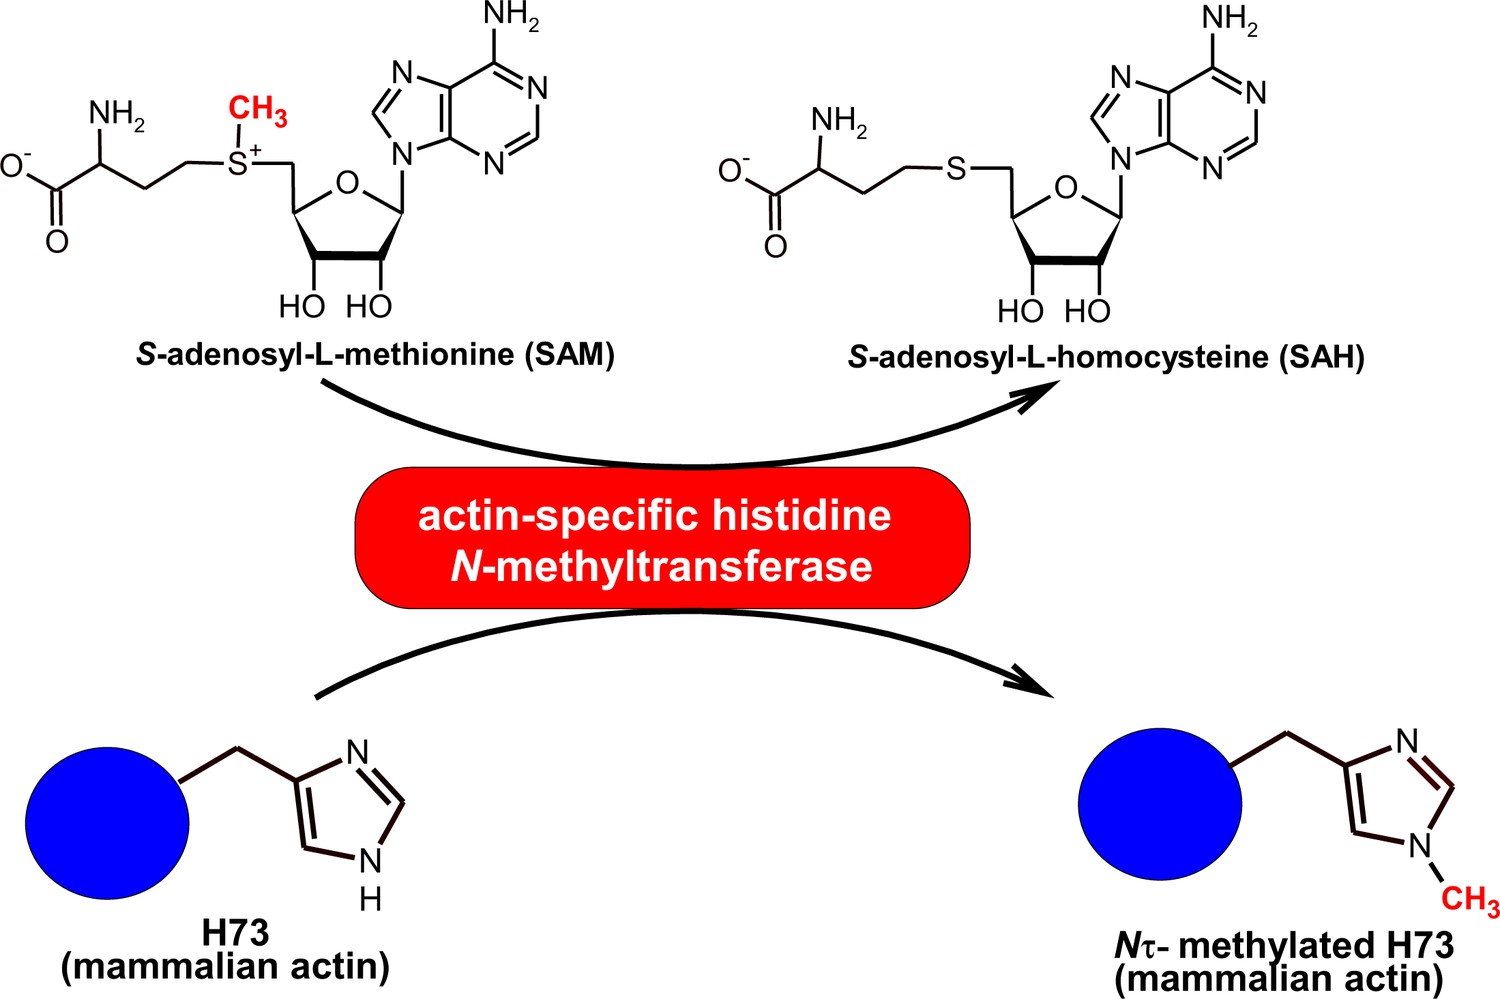
The Nτ-methylation of the actin H73 residue catalyzed by mammalian actin-specific histidine N-methyltransferase (EC 2.1.1.85).
The specific methylation of the Nτ-position of H73 by actin-specific histidine methyltransferase was previously shown by Raghavan et al. (1992). In the present work, we provide evidence for the molecular identity of the actin-methylating enzyme as SETD3 methyltransferase.
Figure 1—figure supplement 3
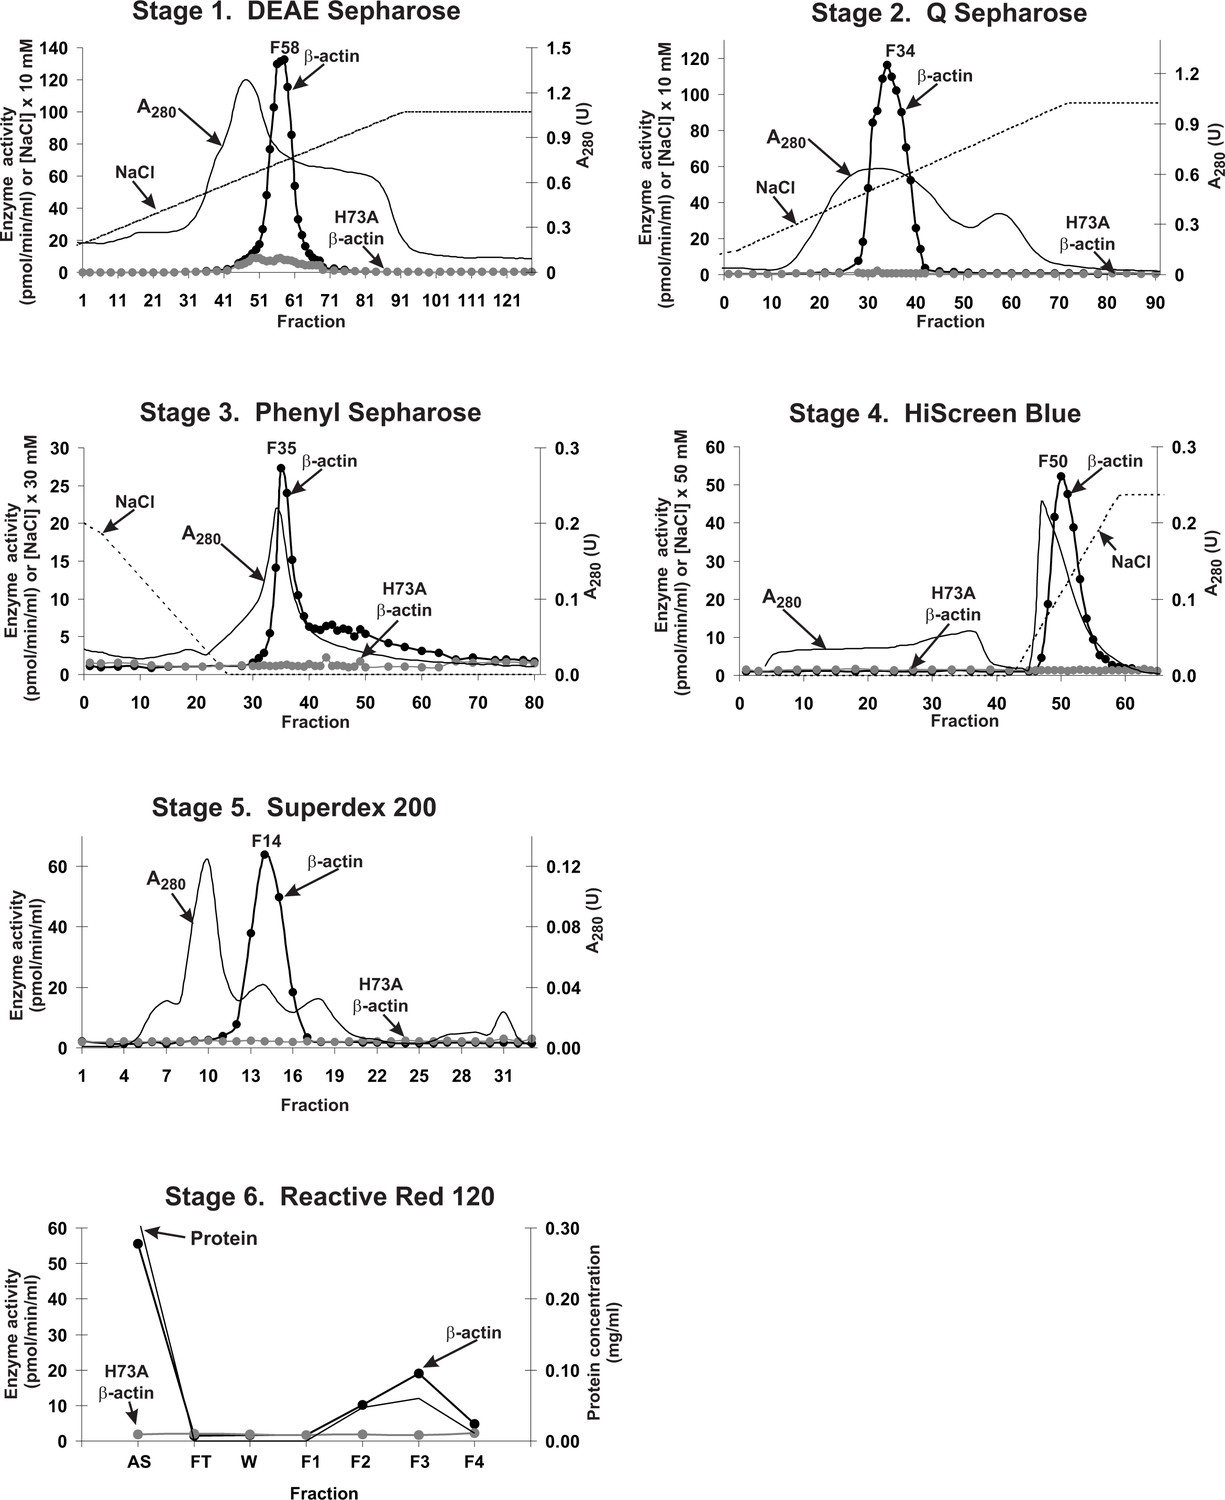
Purification of the rat actin-specific histidine N-methyltransferase.
The enzyme was purified by chromatography on DEAE-Sepharose, Q-Sepharose, Phenyl-Sepharose, HiScreen Blue-Sepharose, Superdex 200, and Reactive Red 120 Agarose as described in the 'Materials and methods' section. Fractions were tested for actin-specific histidine N-methyltransferase activity using either homogeneous recombinant human β-actin or its mutated form H73A.
Figure 2
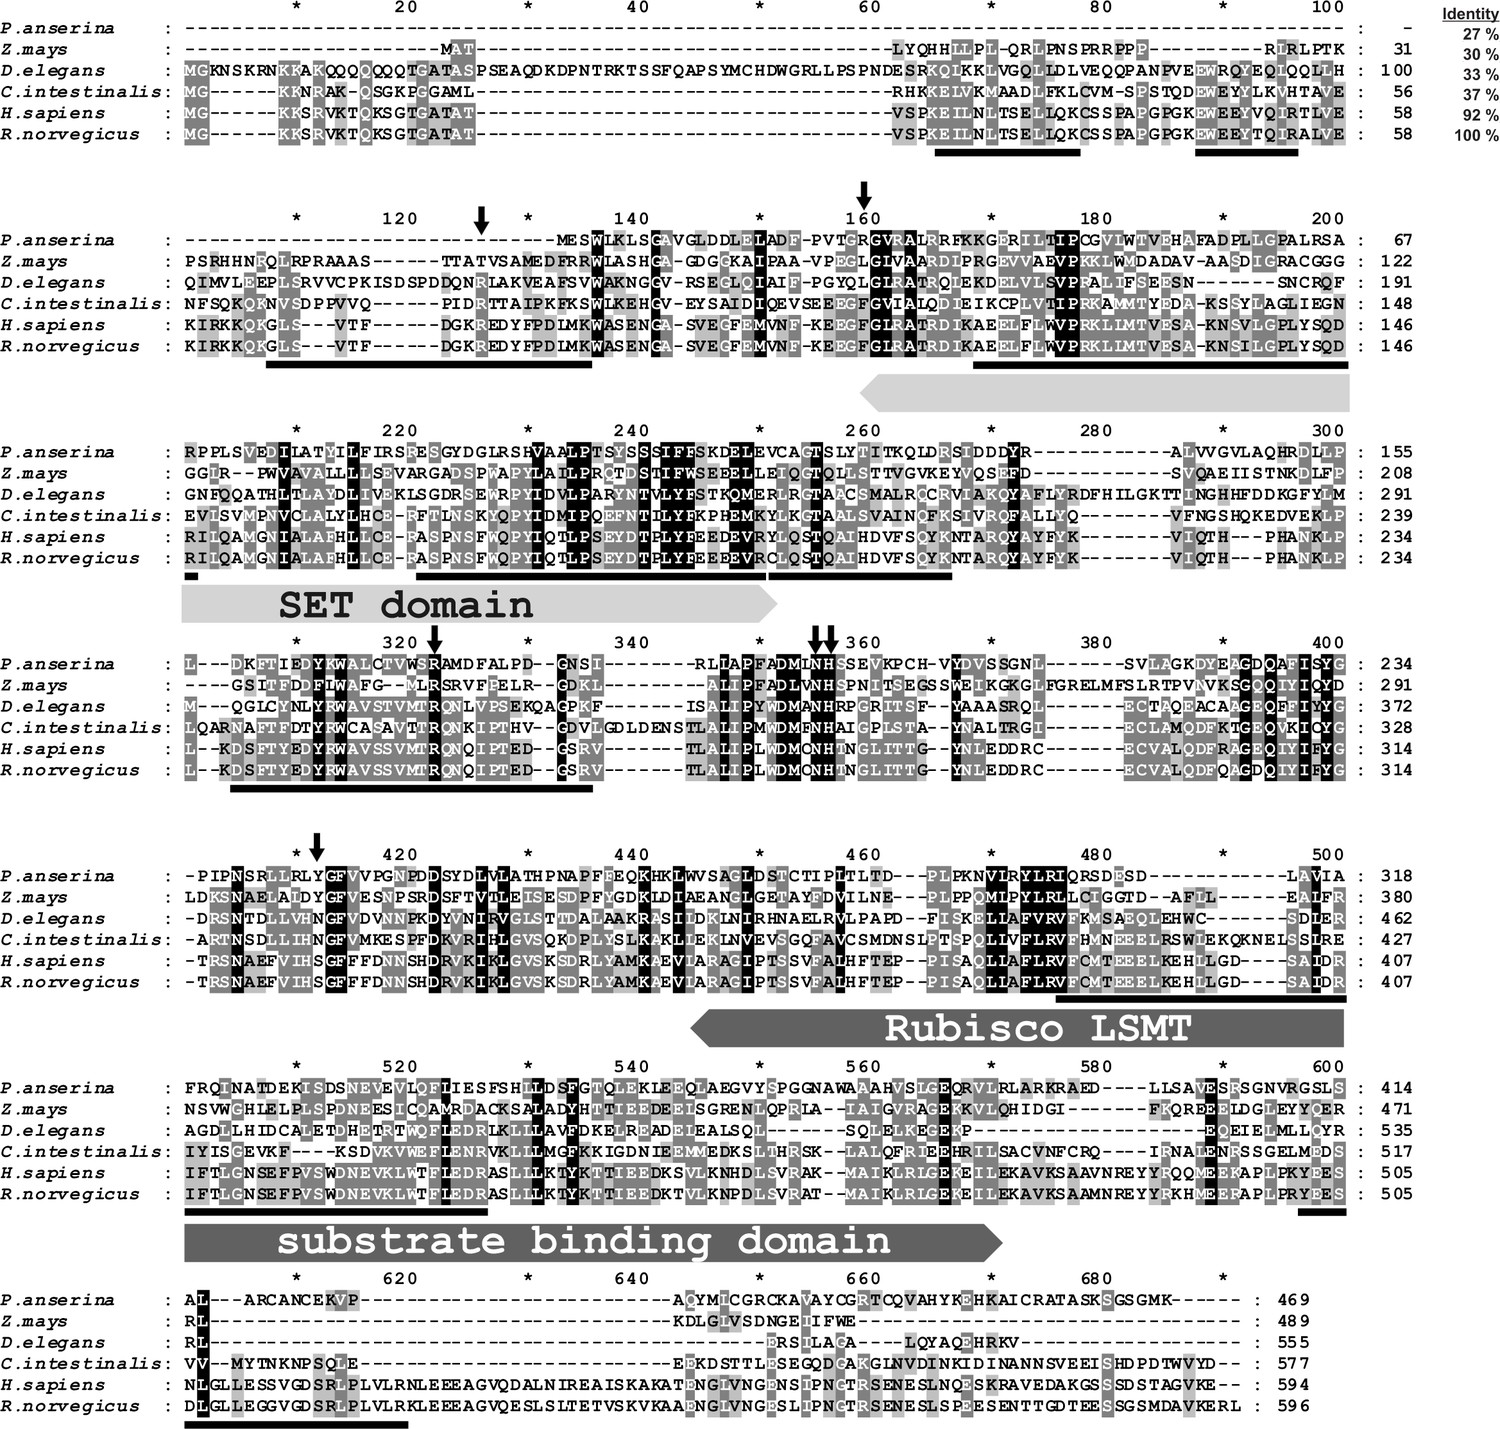
Amino-acid sequence alignment of the rat SETD3 protein with its orthologs.
Sequences of rat (Rattus norvegicus, XP_002726820.2), human (Homo sapiens, NP_115609.2), Ciona intestinalis (C. intestinalis, XP_002131202.1), Drosophila elegans (D. elegans, XP_017114801.1), Podospora anserina (P. anserina, CDP29262.1) and Zea mays (Z. mays, NP_001168589.1) protein were obtained from the National Center for Biotechnology Information (NCBI) Protein database. Both the rat and the human sequences have been confirmed by PCR amplification of the cDNA and DNA sequencing. The percentage of amino-acid identities with the rat SETD3 protein is given in the top right corner of the figure. The conserved protein substrate-binding domains (SET and Rubisco large subunit methyltransferase (LSMT) substrate binding) are labeled above the alignment, while amino-acid residues that interact with S-adenosyl-L-methionine (SAM) are indicated by arrows, as inferred from the crystal structure of the human SETD3 enzyme (PDB 3SMT). The peptides identified by mass spectrometry in the protein purified from rat leg muscle are underlined in the rat sequence. The level of residue conservation is indicated by black (100%), dark grey (70% and more) and light gray (50% and more) background.
Figure 3
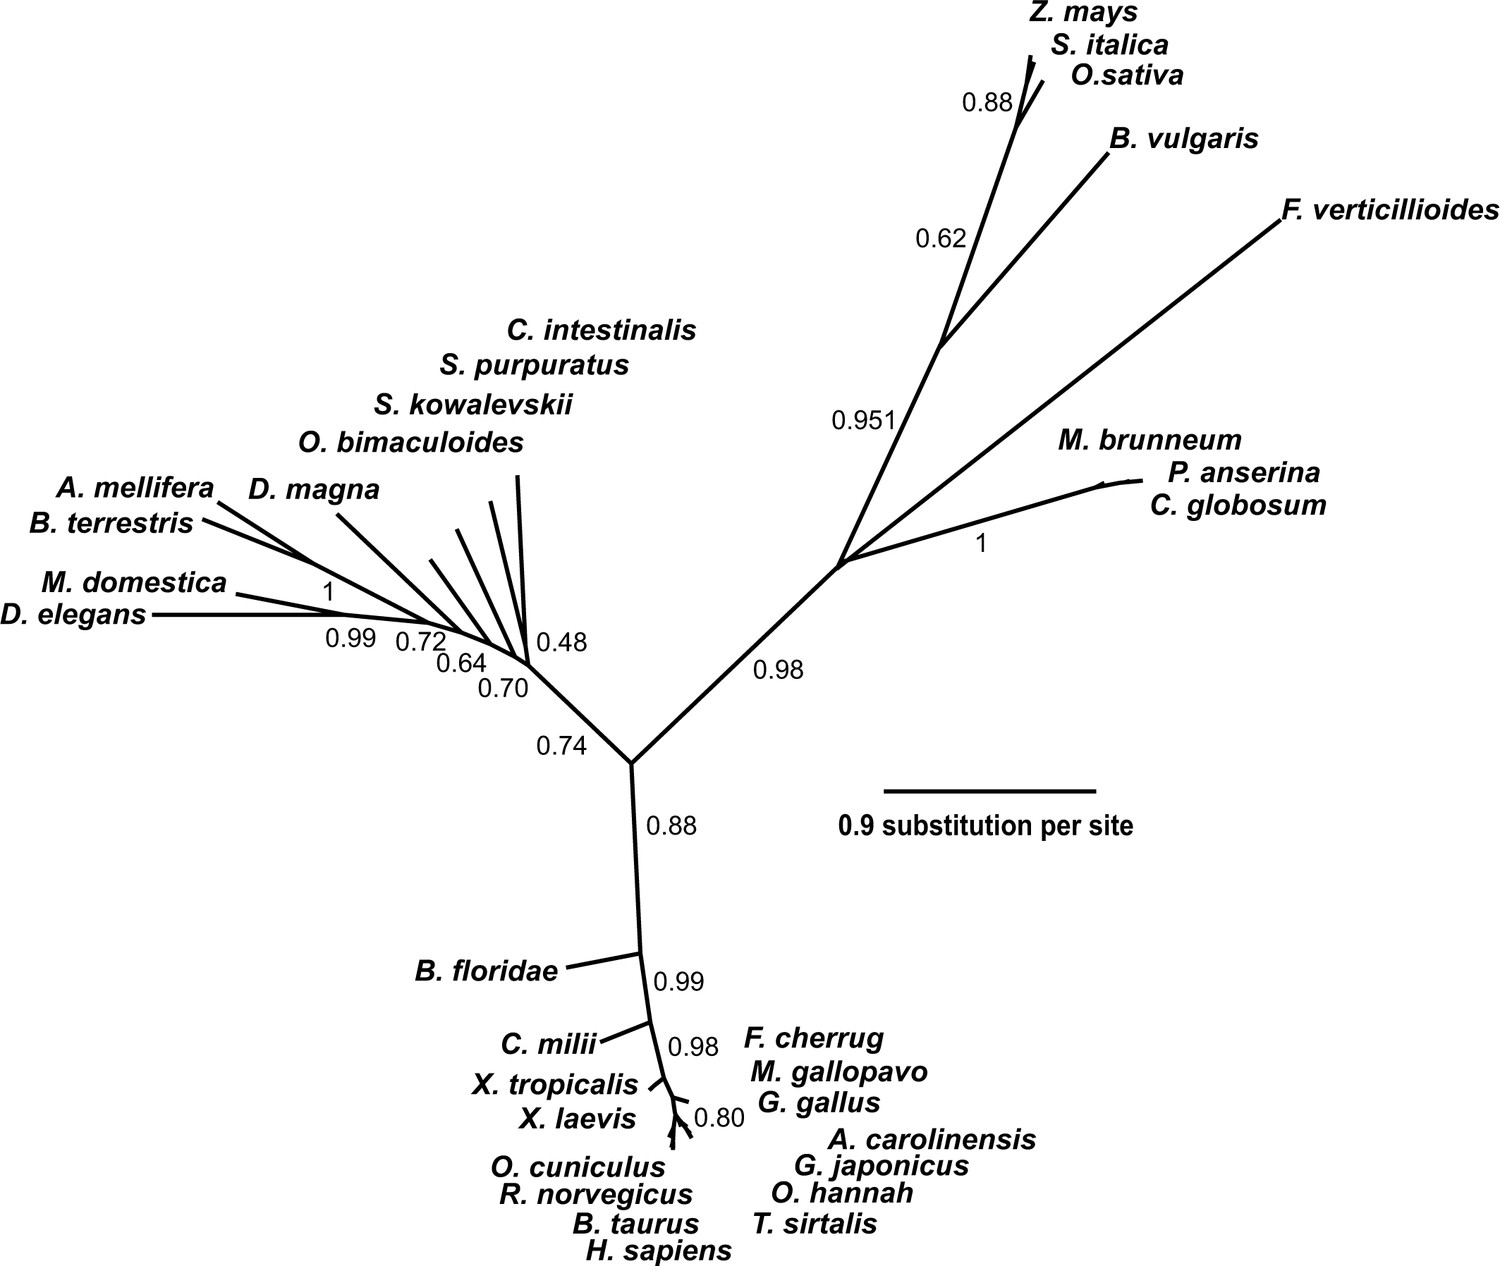
Phylogenetic tree of the SETD3 proteins.
Protein sequences were aligned using Muscle (Edgar, 2004), and the phylogenetic tree was inferred with the use of PhyML (Guindon and Gascuel, 2003) implemented in phylogeny.fr web service (Dereeper et al., 2008). Branch support values assessed using the aLRT test are indicated (Anisimova and Gascuel, 2006). The protein sequences used for the analysis are as follows: Anolis carolinensis (XP_003214383.2); Apis mellifera (XP_016770011.1); Beta vulgaris (XP_010683122.1); Bombus terrestris (XP_003398458.1); Bos taurus (XP_589822.3); Branchiostoma floridae (XP_002596839.1); Callorhinchus milii (XP_007906724.1); Chaetomium globosum (XP_001224775.1); Ciona intestinalis (XP_002131202.1); Daphnia magna (KZS12928.1); Drosophila elegans (XP_017114801.1); Falco cherrug (XP_005438913.1); Fusarium verticillioides (XP_018752240.1); Gallus gallus (NP_001006486.1); Gekko japonicus (XP_015275964.1); Homo sapiens (NP_115609.2); Meleagris gallopavo (XP_003206761.2); Metarhizium brunneum (XP_014542924.1); Musca domestica (XP_011294563.1); Octopus bimaculoides (XP_014787293.1); Ophiophagus hannah (ETE71402.1); Oryctolagus cuniculus (XP_008247172.2); Oryza sativa (XP_015651332.1); Podospora anserina (CDP29262.1); Rattus norvegicus (XP_002726820.2); Saccoglossus kowalevskii (XP_006819296.1); Setaria italica (XP_004956796.1); Strongylocentrotus purpuratus (XP_798530.2); Thamnophis sirtalis (XP_013914404.1); Xenopus laevis (OCT68299.1); Xenopus tropicalis (XP_012823880.1); and Zea mays (NP_001168589.1).
Figure 4
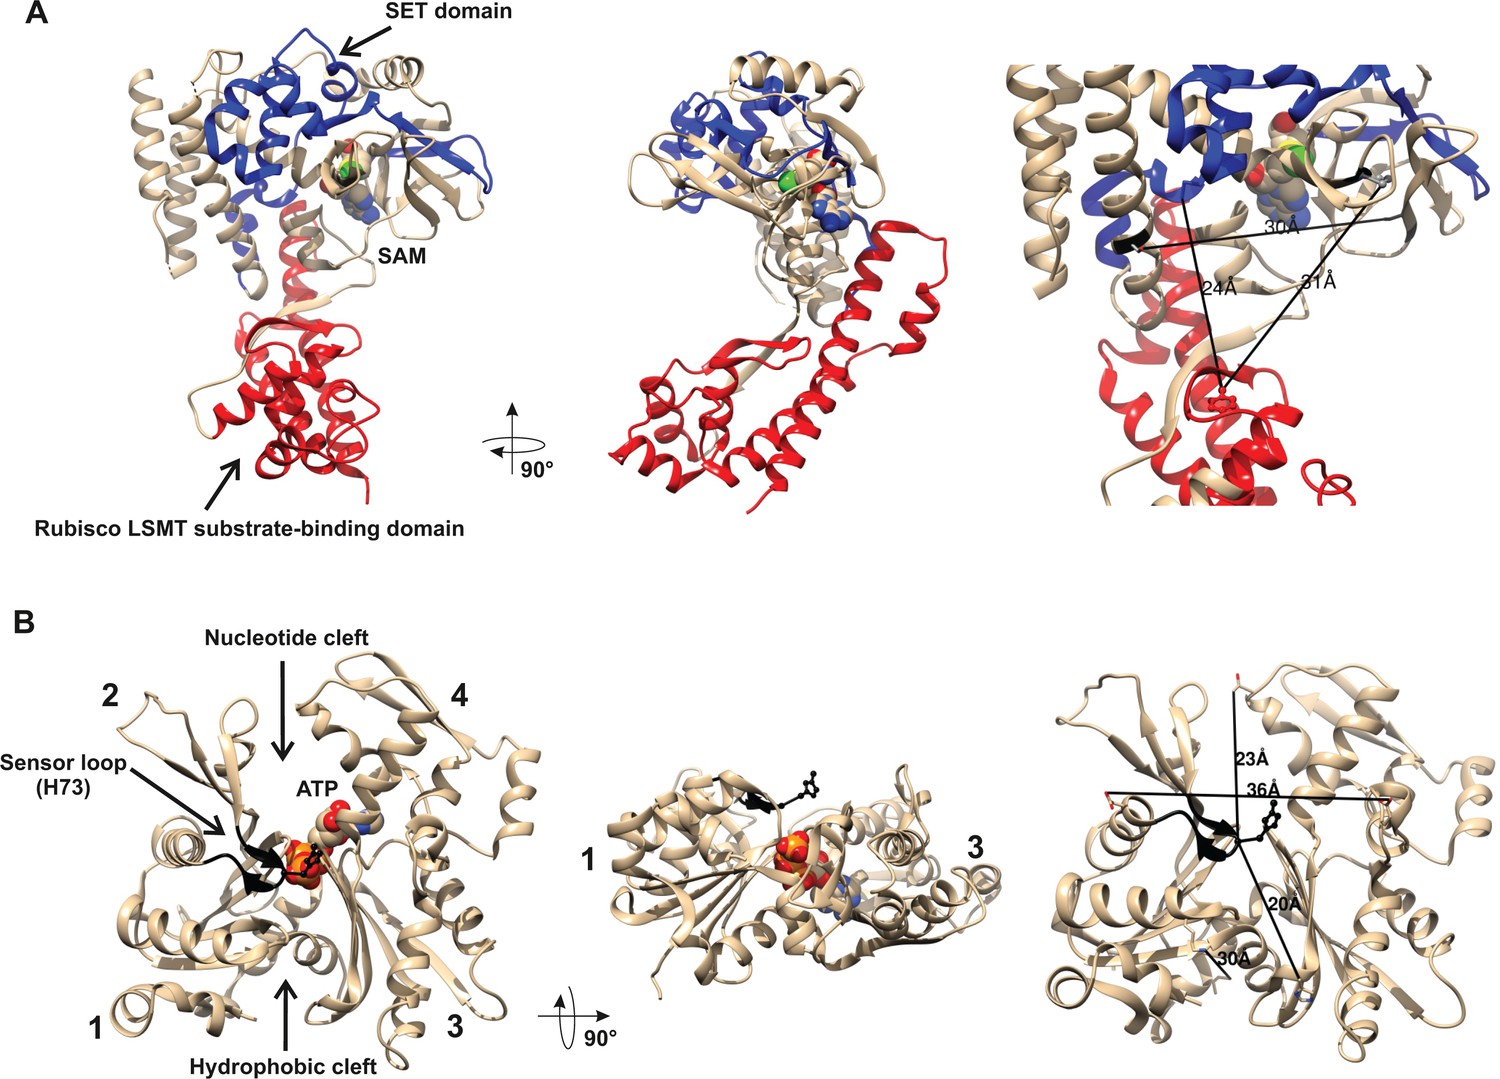
Structures of human β-actin and SETD3 enzyme.
Ribbon representations of the structures of both (A) the SETD3 protein and (B) the actin monomer are shown in different projections. (A) The ‘SET’ and ‘Rubisco LSMT’ substrate-binding domains of SETD3 are highlighted in blue and red, respectively. The spatial organization of these domains gives the enzyme a cradle-like shape. The S-adenosyl-L-methionine (SAM) molecule is bound at the bottom of this cradle, exposing its labile methyl group (green) to a protein substrate. (B) The four subdomains of actin are marked with numbers. Subdomains 1 and 2 form the small (outer) domain, whereas subdomains 3 and 4 constitute the large (inner) domain. Two large clefts are present between these domains: the nucleotide binding cleft and the hydrophobic one, while ATP is bound at the center of the molecule. The nucleotide sensor loop, which contains the methyl-accepting H73 residue, spans from Pro70 to Asn78 and is shown in black. Several residue–residue distances are shown to give information concerning the molecular dimension of these proteins. All models were prepared using UCSF Chimera (Pettersen et al., 2004) from the Protein Data Bank (PDB) structures of β-actin (2BTF) and SETD3 (3SMT).
Figure 5
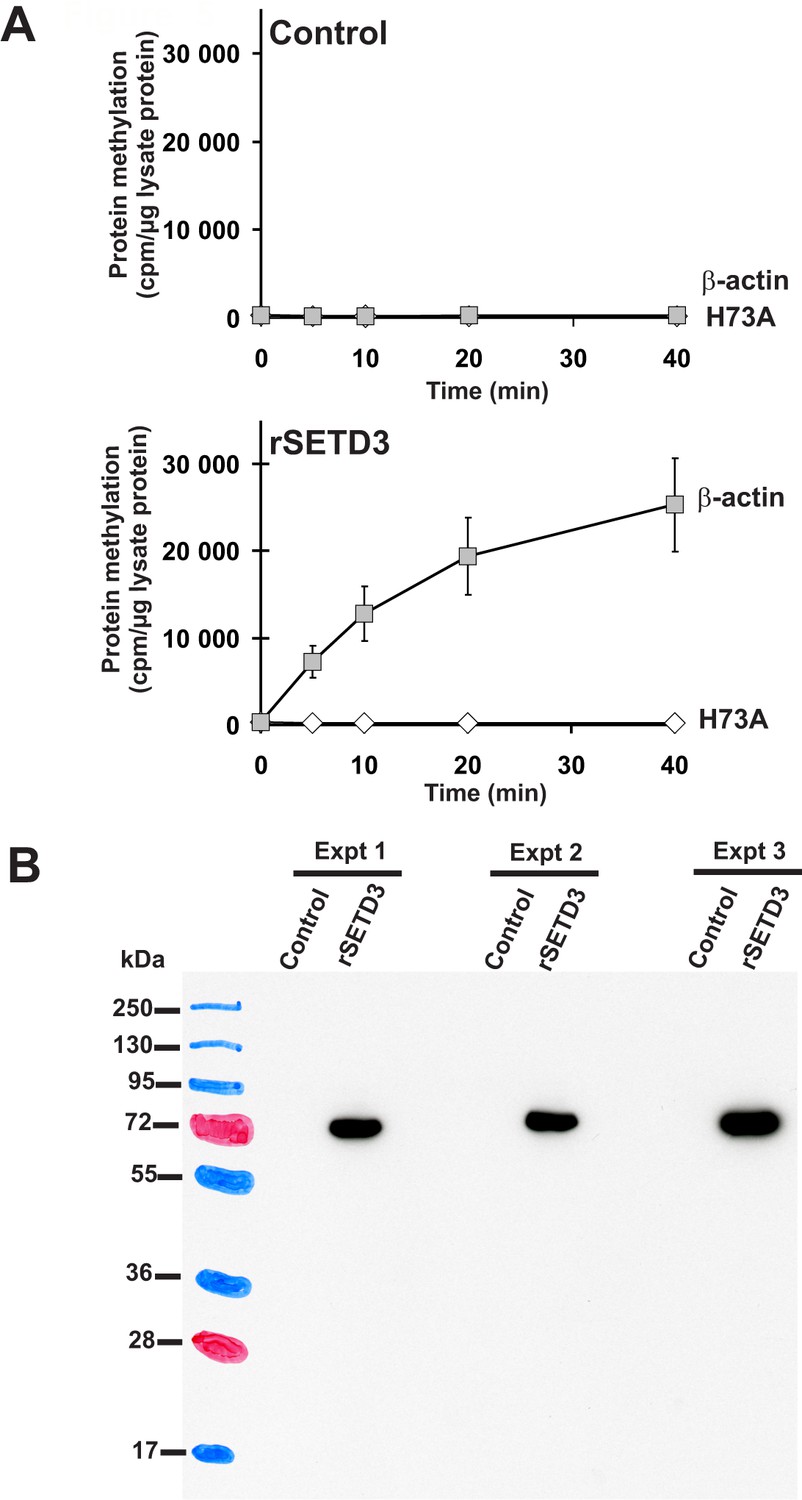
Time course of β-actin methylation present in lysates from COS-7 cells that overexpress recombinant rat SETD3.
COS-7 cells were transfected for 48 hr with an empty vector (Control) or a vector encoding the rat SETD3 protein (rSETD3). Cells were next harvested and lysed, as described in the 'Materials and methods'. (A) The cell-free lysates obtained (≈3 µg of protein) were incubated at 37°C for the indicated times in the presence of 1 µM (100 pmol, ≈370–460 × 103 cpm) [1H+3H]SAM and 2 µM (200 pmol, 8.9 µg) purified recombinant human β-actin (β-actin) or its mutated form (H73A). The reaction was stopped and the proteins present in the assay mixture were precipitated by adding 10% trichloroacetic acid. This allowed for the separation and specific measurement of the radioactivity incorporated in the protein pellet (extent of actin methylation) from the total radioactivity present in the assay mixture. Values are the means ± S.E. (error bars) of three independent transfections. When no error bar is shown, the error is smaller than the width of the line. (B) The presence of recombinant SETD3 protein in the cell lysates was verified by Western blot analysis using 20 µg of total protein and an antibody against the His6 tag. The secondary antibody was detected by employing enhanced chemiluminescence and signals acquisition with ECL film, whereas the pattern of the prestained protein ladder was copied from the blotting membrane onto the film using a set of felt-tip pens.
-
Figure 5—source data 1
Radiochemical measurements of actin-specific histidine N-methyltransferase activity in lysates from COS-7 cells that overexpress recombinant rat SETD3.
- https://doi.org/10.7554/eLife.37921.013
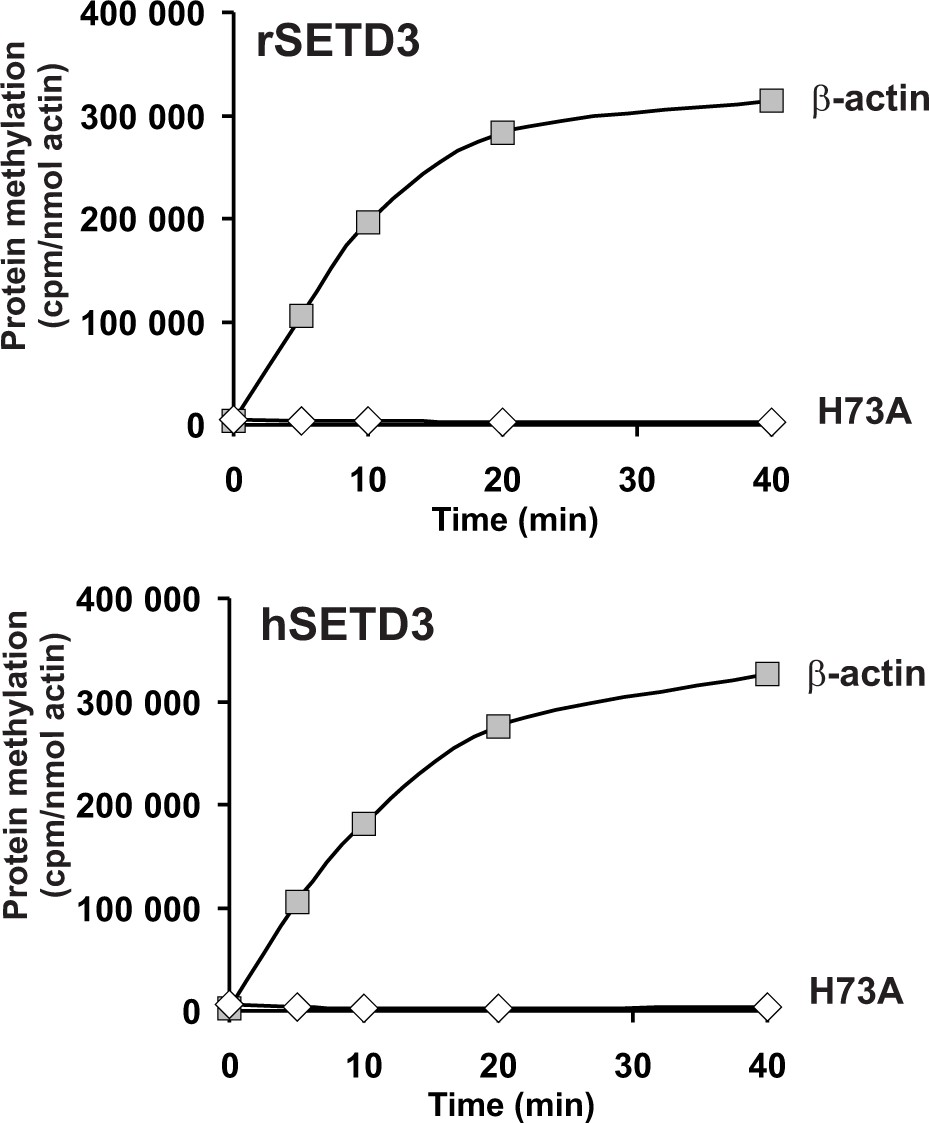
Figure 6 with 1 supplement

In vitro β-actin methylation in the presence of purified recombinant rat or human SETD3 overexpressed in COS-7 cells.
Homogeneous recombinant rat SETD3 (rSETD3, 0.4 µg protein) or its human orthologue (hSETD3, 0.3 µg protein) were incubated at 37°C for the indicated times in the presence of 1 µM (100 pmol, ≈300–400 × 103 cpm) [1H+3H]SAM and 2 µM (200 pmol, 8.9 µg) homogenous recombinant human β-actin or its mutated form (H73A). Proteins were precipitated with 10% trichloroacetic acid to determine the incorporation of radioactivity. The figure shows results of representative experiments from two independent experiments performed.
-
Figure 6—source data 1
Radiochemical measurements of β-actin methylation by purified recombinant SETD3 overexpressed in COS-7 cells.
- https://doi.org/10.7554/eLife.37921.016
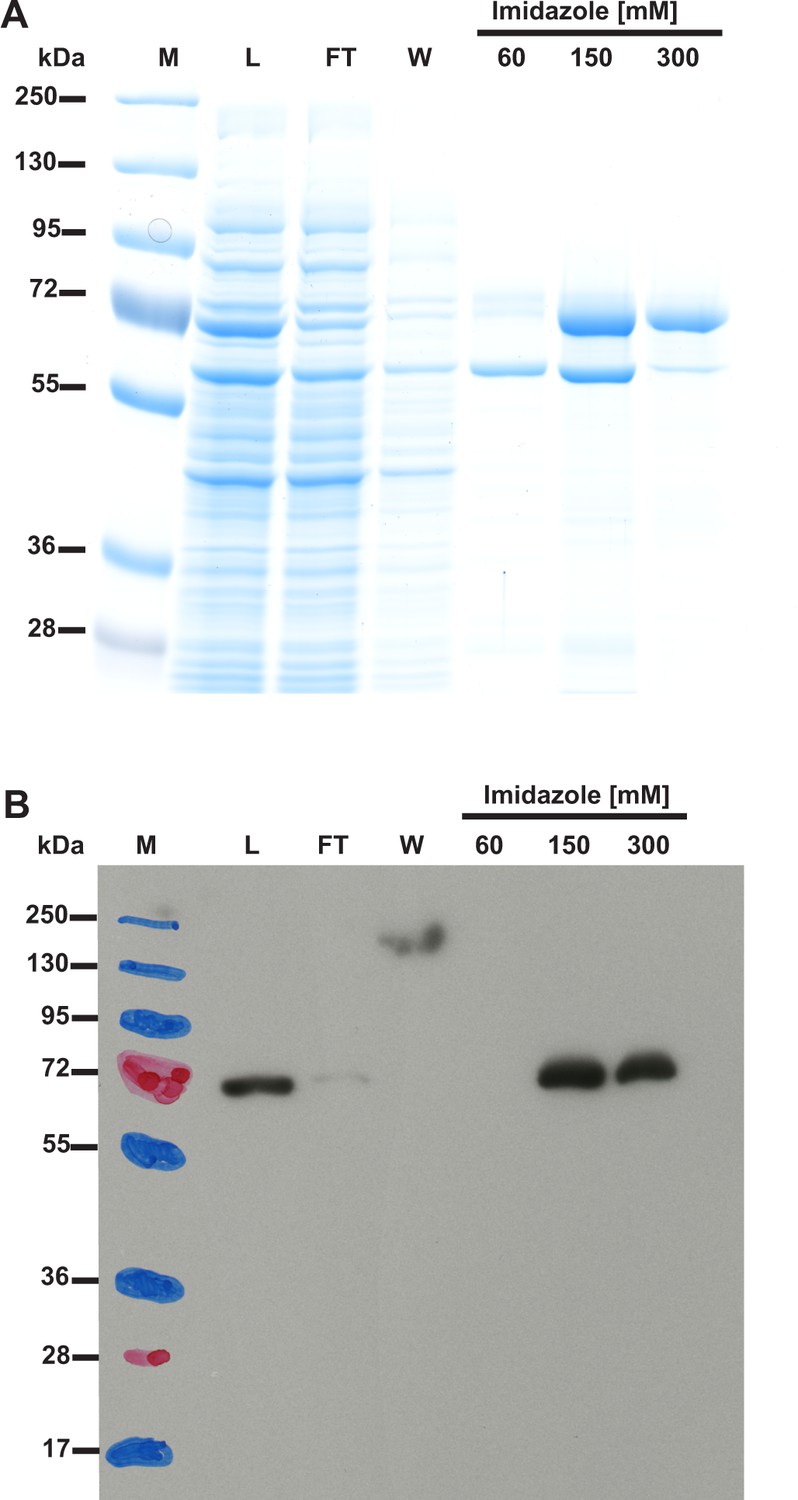
Figure 6—figure supplement 1
(A) SDS-PAGE and (B) Western-blot analysis of fractions obtained during the purification of the recombinant rat SETD3 protein produced in COS-7 cells.
Rat SETD3 protein was purified to homogeneity by affinity chromatography on nickel-Sepharose (HisTrap HP) as described in the 'Materials and methods' section. For the SDS-PAGE analysis, 15 µl of sample from each fraction was loaded onto a 10% gel and electrophoresed, and the resulting gel was then stained with silver (Shevchenko et al., 1996). For the Western-blot analysis, 7.5 µl of each fraction was loaded onto a 10% gel, electrophoresed and blotted to nitrocellulose membrane, which was then sequentially probed with a mouse primary antibody against His6 tag (27-4710-01, GE) and a horseradish peroxidase-conjugated goat anti-mouse antibody (A2554, Sigma-Aldrich). The secondary antibody was detected by employing enhanced chemiluminescence. M, prestained protein marker; L, cell-free lysate of COS-7 cells applied on the column; FT, flow through; W, wash. Fractions 60 to 300 were eluted with the indicated concentrations of imidazole.
Figure 7 with 1 supplement
In vitro β-actin methylation in the presence of purified recombinant rat or human SETD3 overexpressed in E. coli.
Mammalian SETD3 proteins were produced in E. coli and purified by affinity chromatography on nickel-Sepharose (HisTrap HP), as described in the 'Materials and methods' section. Recombinant rat SETD3 (rSETD3, 0.4 µg protein) or its human orthologue (hSETD3, 0.4 µg protein) were incubated at 37°C for the indicated times in the presence of 1 µM (100 pmol, ≈230 × 103 cpm) [1H+3H]SAM and 2 µM (200 pmol, 8.9 µg) homogenous recombinant human β-actin or its mutated form (H73A). Proteins were precipitated with 10% trichloroacetic acid to determine the incorporation of radioactivity. The figure shows the results of single experiments.
-
Figure 7—source data 1
Radiochemical measurements of β-actin methylation by purified recombinant SETD3 overexpressed in E. coli.
- https://doi.org/10.7554/eLife.37921.019
Figure 7—figure supplement 1
(A) SDS-PAGE and (B) Western-blot analysis of fractions obtained during the purification of recombinant human SETD3 produced in E. coli.
Human SETD3 was purified by affinity chromatography on nickel-Sepharose (HisTrap HP) as described in the 'Materials and methods' section. For the SDS-PAGE analysis, 15 µl of sample from each fraction was loaded onto a 10% gel, electrophoresed and the resulting gel was then stained with colloidal Coomassie blue. For the Western-blot analysis, 3 µl of each fraction was loaded onto a 10% gel, electrophoresed and blotted to nitrocellulose membrane, which was then sequentially probed with a mouse primary antibody against His6 tag and a horseradish peroxidase-conjugated goat anti-mouse antibody. The secondary antibody was detected by employing enhanced chemiluminescence. M, prestained protein marker; L, cell-free lysate of E. coli applied on the column; FT, flow through; W, wash. Fractions 60 to 300 were eluted with the indicated concentrations of imidazole.
Figure 8 with 1 supplement
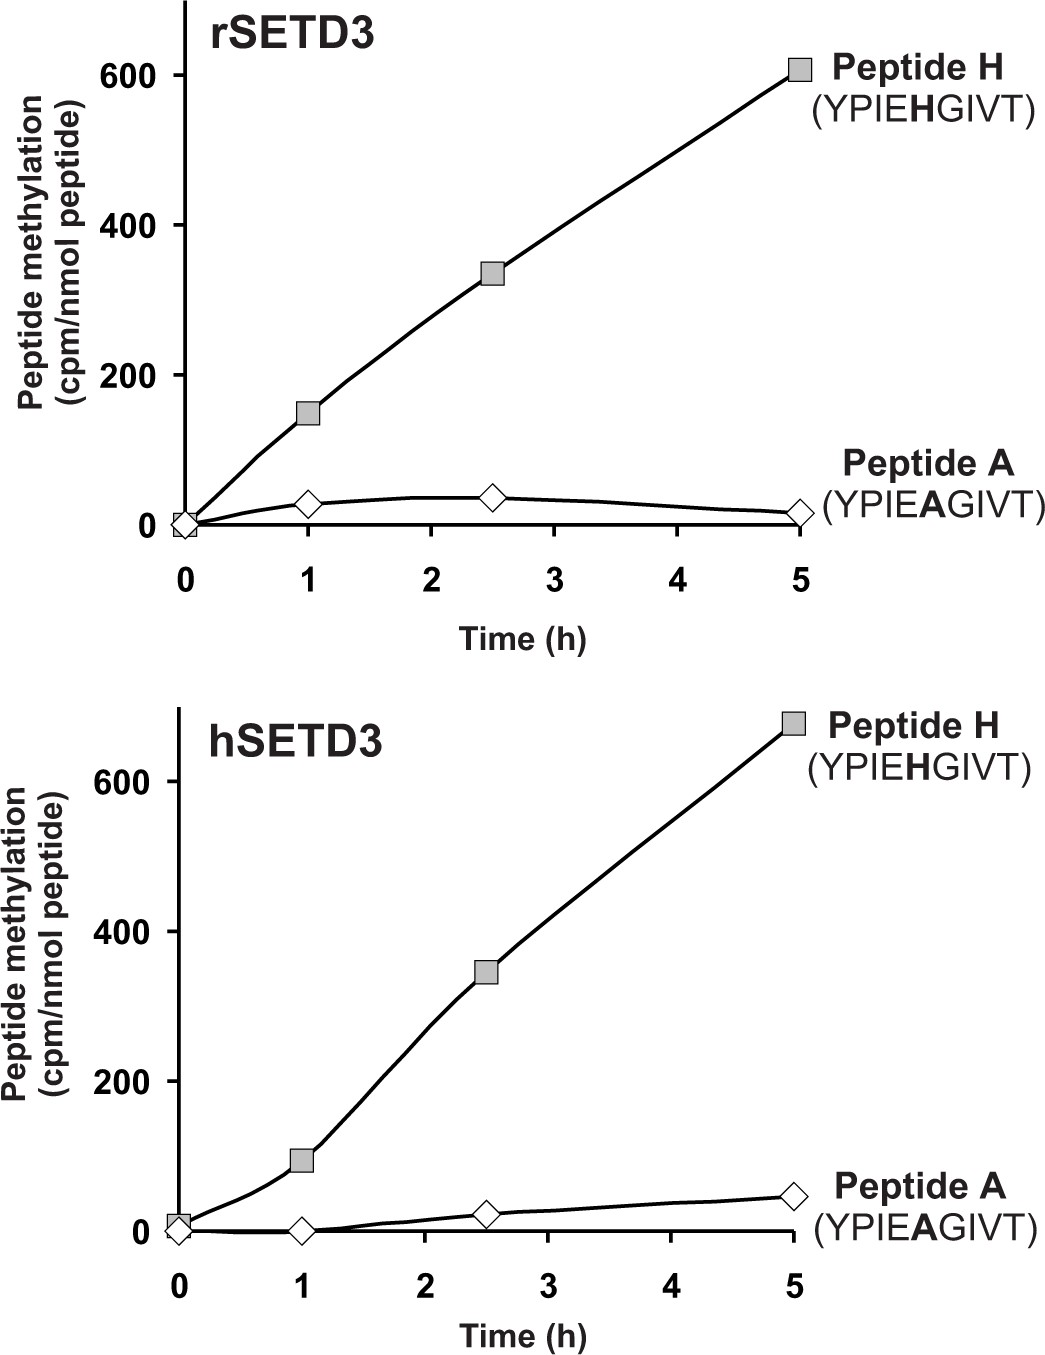
SETD3-dependent methylation of synthetic peptides that incorporate the methylation site in β-actin.
Homogeneous recombinant rat SETD3 (rSETD3, 5.8 µg protein) or its human orthologue (hSETD3, 4.6 µg protein) was incubated at 37°C for the indicated times in the presence of 1 µM (100 pmol, ≈350–400 × 103 cpm) [1H+3H]SAM and 2 mM (200 nmol) synthetic peptides corresponding to residues 69–77 of either β-actin (Peptide H: YPIEHGIVT) or its mutated form (Peptide A: YPIEAGIVT). Methylated peptides were separated from [1H+3H]SAM by fractionation on ion exchange Dowex 50W columns. The figure shows the results of single experiments.
-
Figure 8—source data 1
Radiochemical measurements of the SETD3-dependent methylation of synthetic peptides that incorporate the methylation site in β-actin.
- https://doi.org/10.7554/eLife.37921.023
Figure 8—figure supplement 1
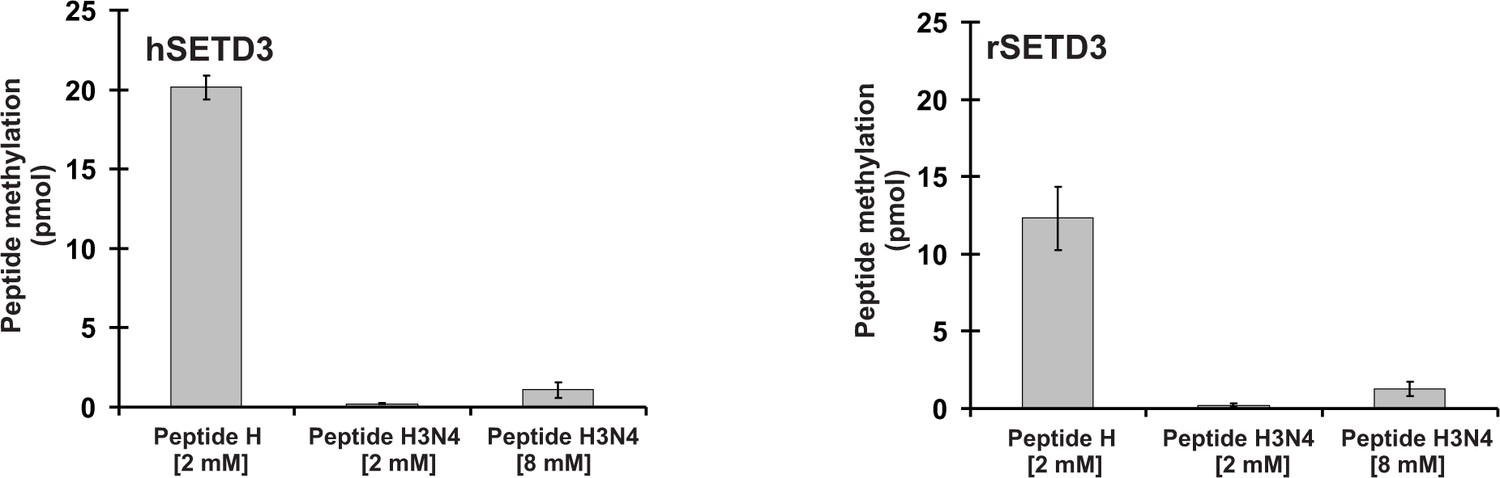
SETD3-dependent methylation of synthetic peptide H and peptide H3N4, analogues of the methylation site in β-actin and histone H3, respectively.
Homogeneous recombinant rat SETD3 (rSETD3, 5.8 µg protein) or its human orthologue (hSETD3, 4.6 µg protein) was incubated for 4 hr at 37°C in the presence of 1 µM (100 pmol, ≈300–340 × 103 cpm) [1H+3H]SAM and the indicated concentrations of the synthetic peptides corresponding to either residues 69–77 of mammalian β-actin (Peptide H: YPIEHGIVT) or residues 32–37 of mouse histone H3.3 (Peptide H3N4: STGGVK). Methylated peptides were separated from [1H+3H]SAM by sample fractionation on Dowex 50W columns. Values are the means ± range (error bars) of two independent measurements.
-
Figure 8—figure supplement 1—source data 1
Radiochemical measurements of SETD3-dependent methylation of synthetic peptides H (b-actin) and H3N4 (histone H3).
- https://doi.org/10.7554/eLife.37921.022
Figure 9
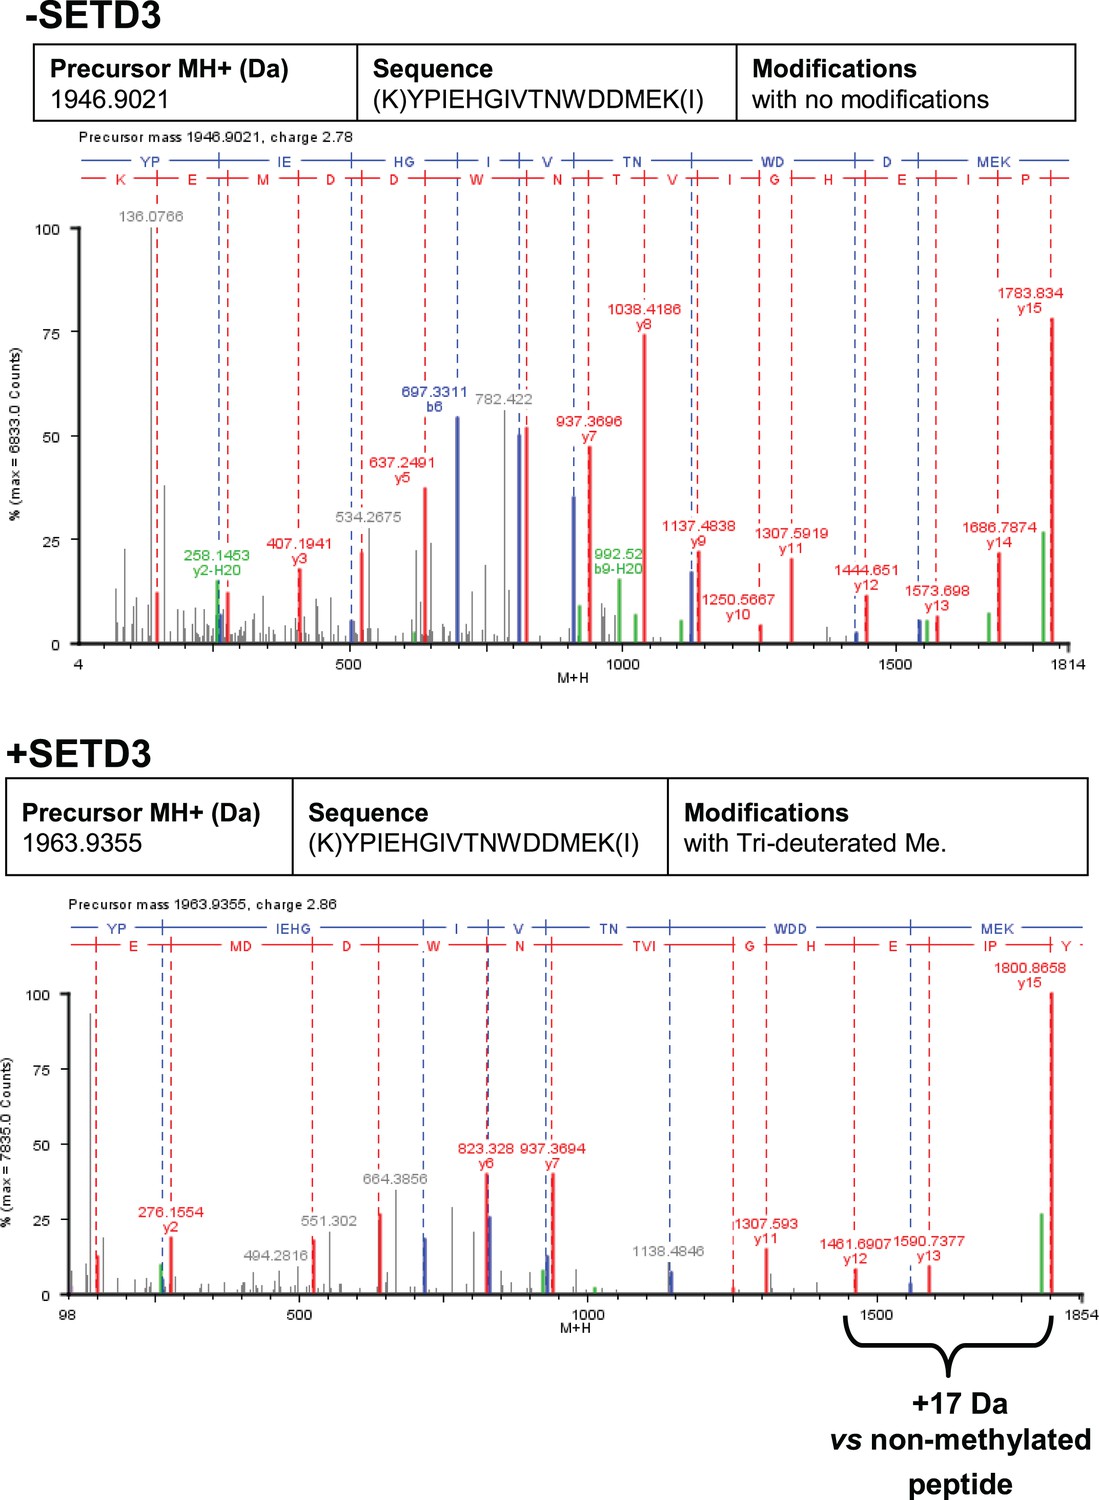
Deconvoluted Q-TOF spectra of both non-modified and deuterium(D3)-methylated β-actin peptides produced by the human SETD3 protein.
Homogenous recombinant human β-actin (6.4 µg) was incubated for 90 min at 37°C in a reaction mixture containing 20–30 µM ([2H]SAM), 4.5–9.0 µg SAH nucleosidase and 1.75–3.5 µg adenine deaminase in either the absence (–SETD3) or presence of 1.1–3.5 µg the homogenous recombinant human SETD3 protein (+SETD3). Following the reaction, β-actin was separated from other proteins by SDS-PAGE and analyzed by tandem mass spectrometry, as described in the 'Materials and methods' section. Detection of the trideuterium-methylated peptides was performed by ProteinLynx Global Server 2.4 software (Waters, USA) in a fully automatic mode, and the trideuterium methylation (+1,703,448 Da) of Cys, Asp, Asn, His, Lys, Arg, Glu, Gln residues of tryptic peptides was examined. At least 75% of the actin sequence coverage was achieved in each MS analysis. None of the (trideuterium-)methylated peptides was detected in the control reaction (–SETD3), whereas the H73-containing peptide: YPIEHGIVTNWDDMEK (M + H = 1946.9021 Da, y16 ion) was the only trideuterium-methylated peptide (M + H = 1963.9355 Da, y16 ion) in the presence of SETD3. The mass shift (+17.03448 Da) was detected only in His-containing peptide fragments (y12, y13, y15, y16), indicating that the H73 residue is the site of methylation. The figure shows results of a representative experiment. Two independent methyl(D3)-labeling reactions were performed.
-
Figure 9—source data 1
Mass spectrometry (Q-TOF) identification of both non-modified and deuterium(D3)-methylated β-actin peptides produced in the absence or presence of the human SETD3 protein.
- https://doi.org/10.7554/eLife.37921.025
Figure 10
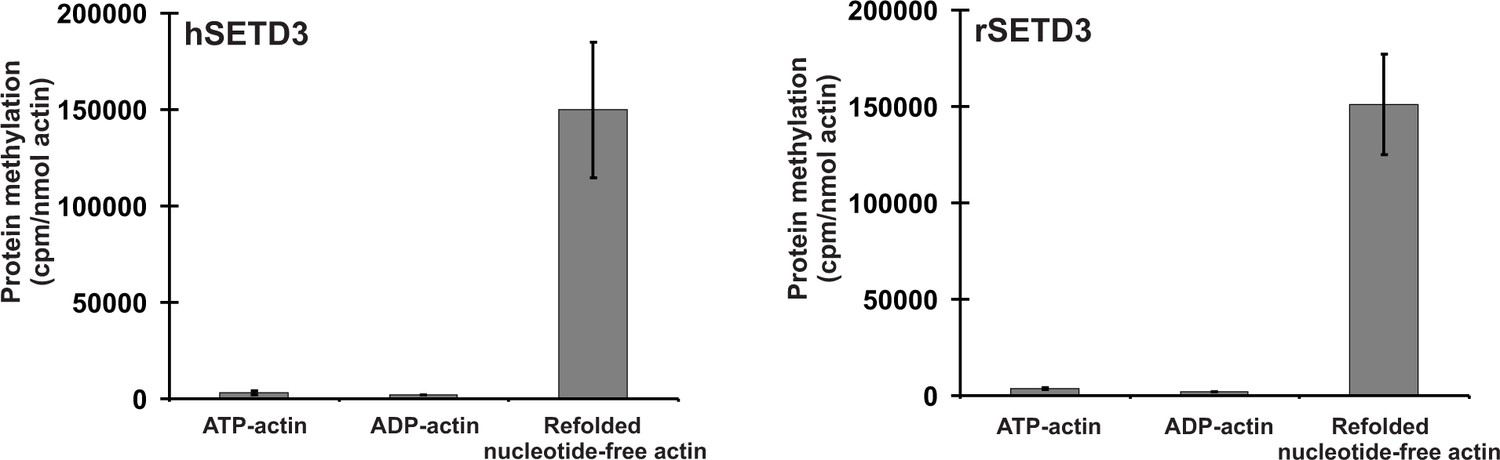
SETD3-dependent methylation of human β-actin that is overexpressed in S. cerevisiae.
Homogeneous recombinant rat SETD3 (rSETD3, 0.6 µg protein) or its human orthologue (hSETD3, 0.45 µg protein) were incubated at 37°C for 40 min in the presence of 1 µM (100 pmol, ≈220 × 103 cpm) [1H+3H]SAM and 2 µM (200 pmol, 8.9 µg) homogenous recombinant human β-actin produced in S. cerevisiae, and either purified in non-denaturing conditions as complexes with ATP (ATP-actin) or ADP (ADP-actin) or denatured and refolded to obtain soluble nucleotide-free protein (refolded nucleotide-free actin). Proteins were precipitated with 10% trichloroacetic acid to determine the incorporation of radioactivity. Values are the means ± range (error bars) of two independent measurements performed with two different β-actin preparations.
-
Figure 10—source data 1
Radiochemical measurements of SETD3-dependent methylation of human β-actin overexpressed in S. cerevisiae.
- https://doi.org/10.7554/eLife.37921.031
Figure 11
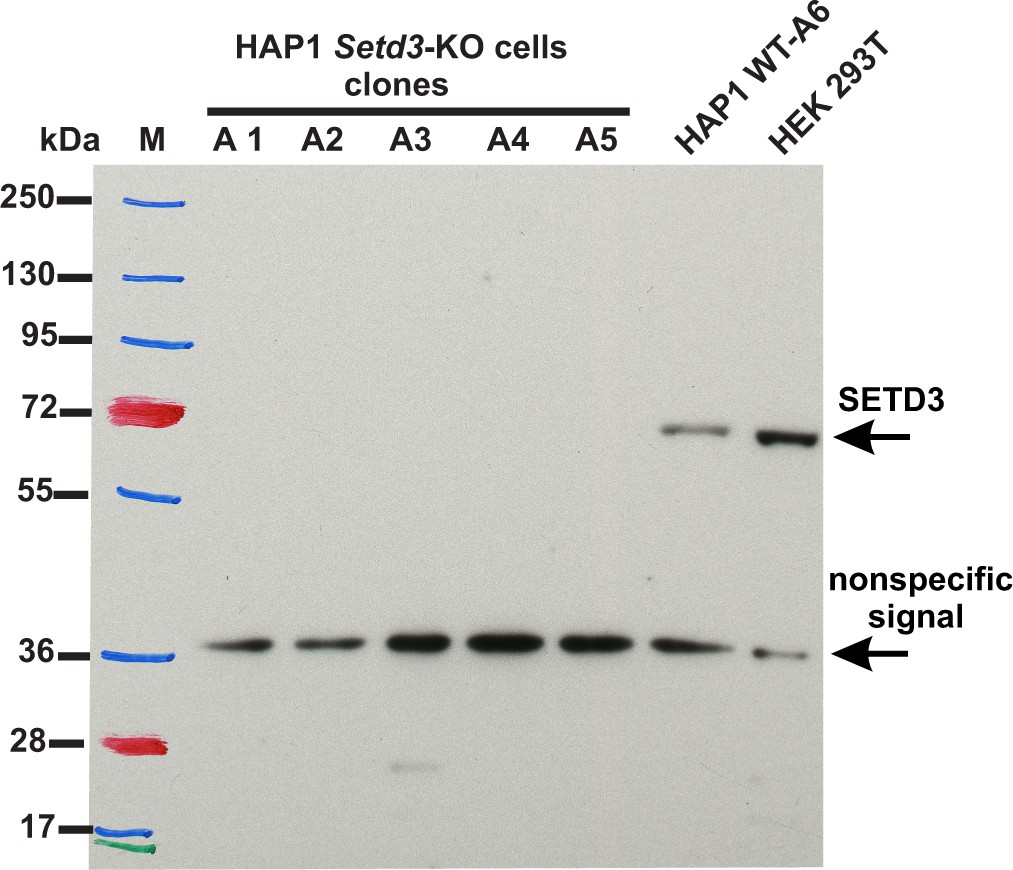
Absence of SETD3 expression in Setd3-deficient HAP1 cell lines compared to endogenous expression detected in control HAP1 and HEK293T cells.
Western blot analysis of SETD3 expression in five Setd3-deficient HAP1 clonal cell lines and two different control cell lines: HEK293T and the HAP1 cell line (WT-A6). The HAP1 cell line was also submitted to the CRISPR/Cas9 gene-inactivation procedure, but the Setd3 gene was not modified; this was done to exclude off-target effects of the procedure on the HAP1 phenotype. The analysis was performed using 50 µg of the cell lysate protein with a rabbit primary antibody against the human SETD3 (ab174662, Abcam) along with a horseradish-peroxidase-conjugated goat anti-rabbit secondary antibody. The secondary antibody was detected by measuring enhanced chemiluminescence. The presence of a nonspecific signal (≈ 36 kDa) is in agreement with the specification of the primary antibody.
Figure 12
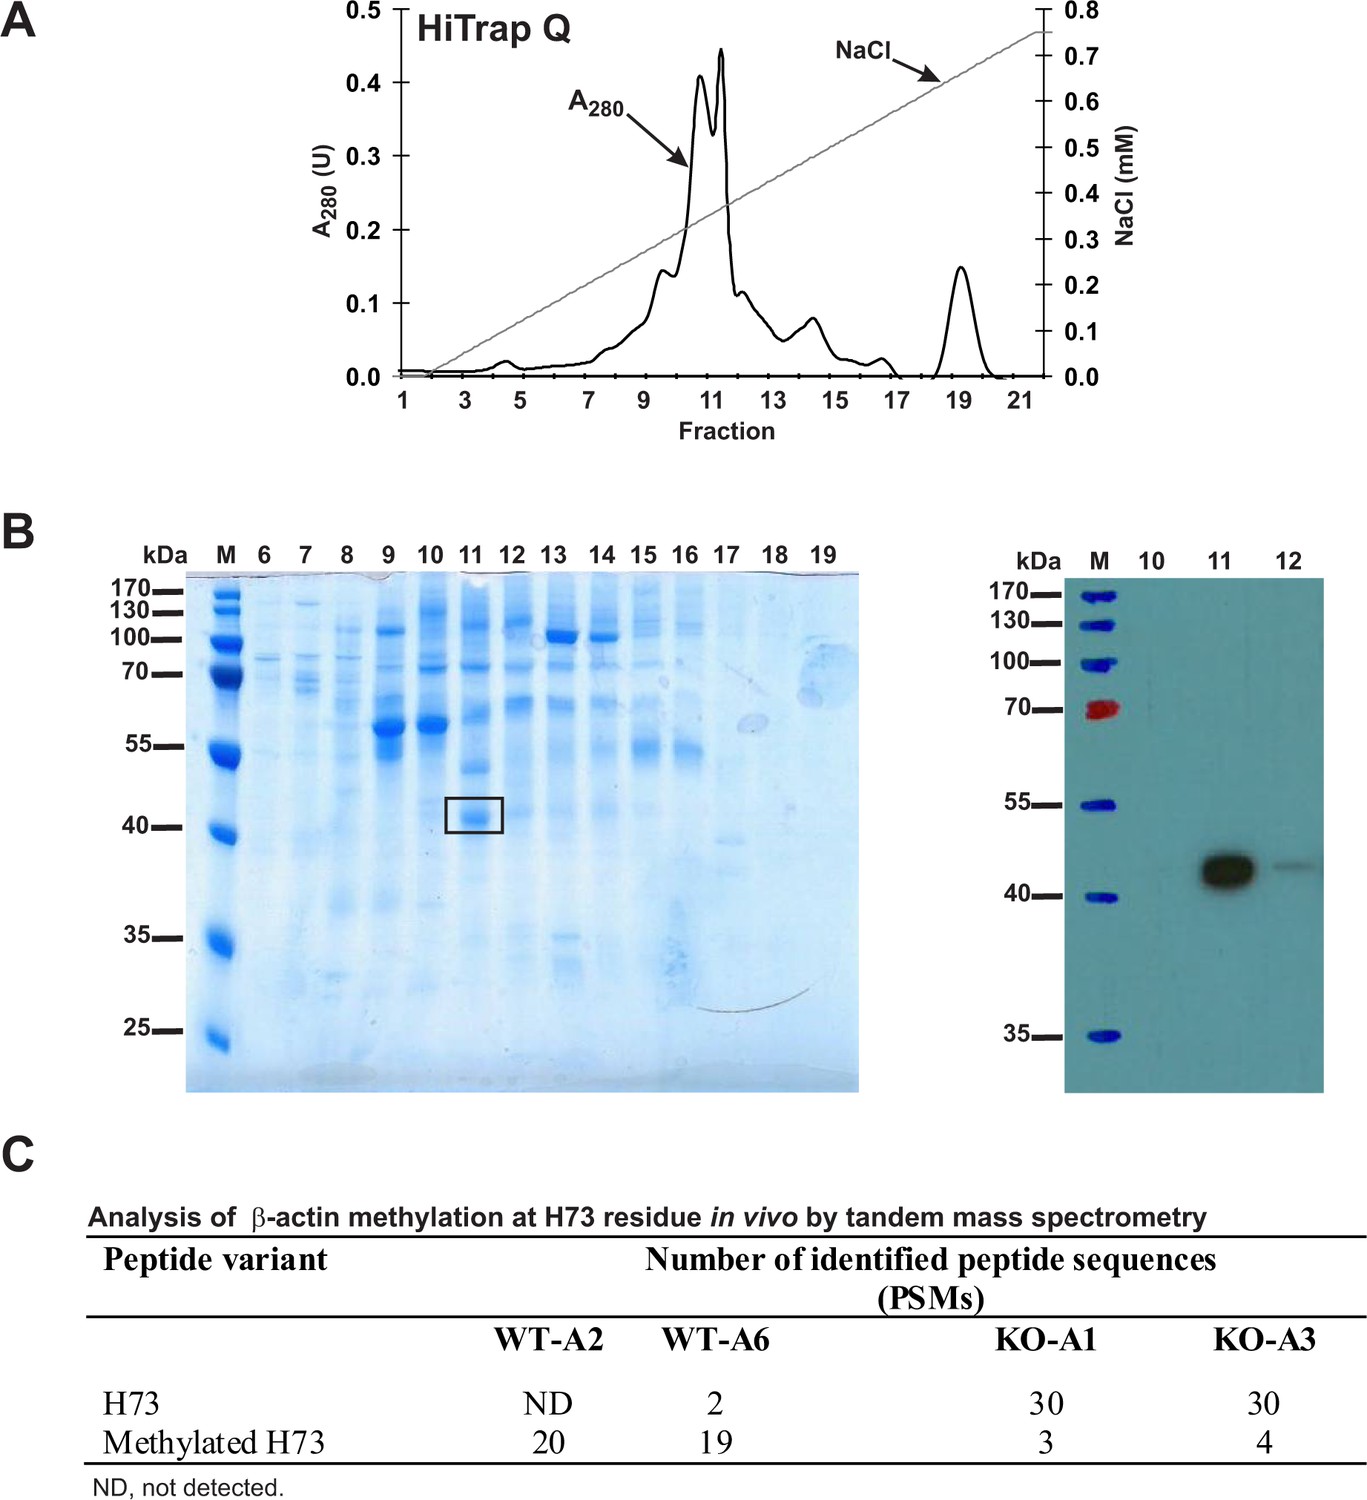
Purification of endogenous actin from HAP1 cells and analysis of H73 methylation by tandem mass spectrometry.
(A) Endogenous actin was purified from Setd3-deficient HAP1 cells (clone KO-A1) by chromatography on HiTrap Q HP, as described in the 'Materials and methods' section. (B) The indicated fractions that were eluted from the anion-exchange column were analyzed by SDS-PAGE and by western-blotting with the use of an anti-actin primary antibody (A2066, Sigma-Aldrich) to identify protein bands corresponding to the actin protein. M, prestained protein marker. Similar purification and identification procedures were performed with cell lysates from wildtype HAP1 cells (clone WT-A2, WT-A6) and another Setd3-deficient HAP1 clone (KO-A3). The indicated band was cut out of the gel, submitted to trypsin digestion, and analyzed by tandem mass spectrometry. (C) The table shows the total number of identified peptide sequences (peptide spectrum matches, PSMs) for β-actin that contain either methylated or non-methylated H73 depending on whether the β-actin was isolated from wildtype (WT-A2, WT-A6) or Setd3-deficient clonal HAP1 cells (KO-A1, KO-A3). The total number of PSMs recorded for β-actin (Uniprot, P60709) in these MS/MS experiments is as follows: 301 (WT-A2), 387 (WT-A6), 485 (KO-A1) and 529 (KO-A3).
-
Figure 12—source data 1
Mass spectrometry (LTQ XL ion trap) identification of both non-modified and methylated β-actin peptides from HAP1 human cells.
- https://doi.org/10.7554/eLife.37921.034
Figure 13 with 1 supplement
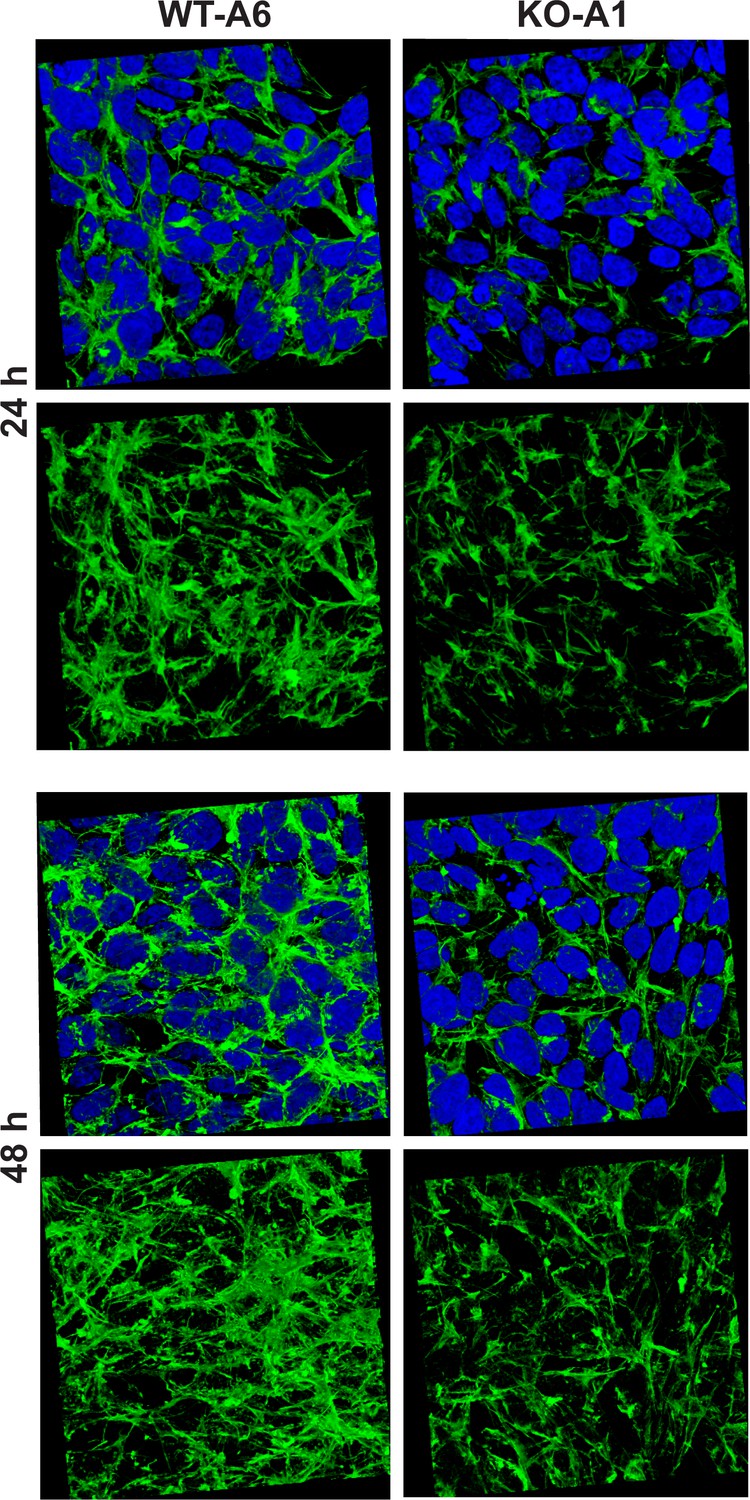
Organization of the actin cytoskeleton in Setd3-deficient HAP1 cells visualized by confocal microscopy.
Control HAP1 cells (WT-A6) and Setd3-deficient clonal HAP1 cells (KO-A1) were cultured for either 24 or 48 hr. The localization of filamentous actin was determined by staining with TRITC-phalloidin (green), while nuclei were visualized by staining with Hoechst 33342 (blue). Three-dimensional confocal microscope images of actin cytoskeleton are shown with or without stained nuclei (blue). For 3D analysis, confocal Z-stacks comprising 10–13 optical slices were reconstructed into each 3D image with the aid of Zeiss Zen software. Representative images are shown here, but similar results were obtained with two other HAP1 Setd3-deficient clonal cell lines (KO-A3 and KO-A5, see Figure 13—figure supplement 1).
Figure 13—figure supplement 1
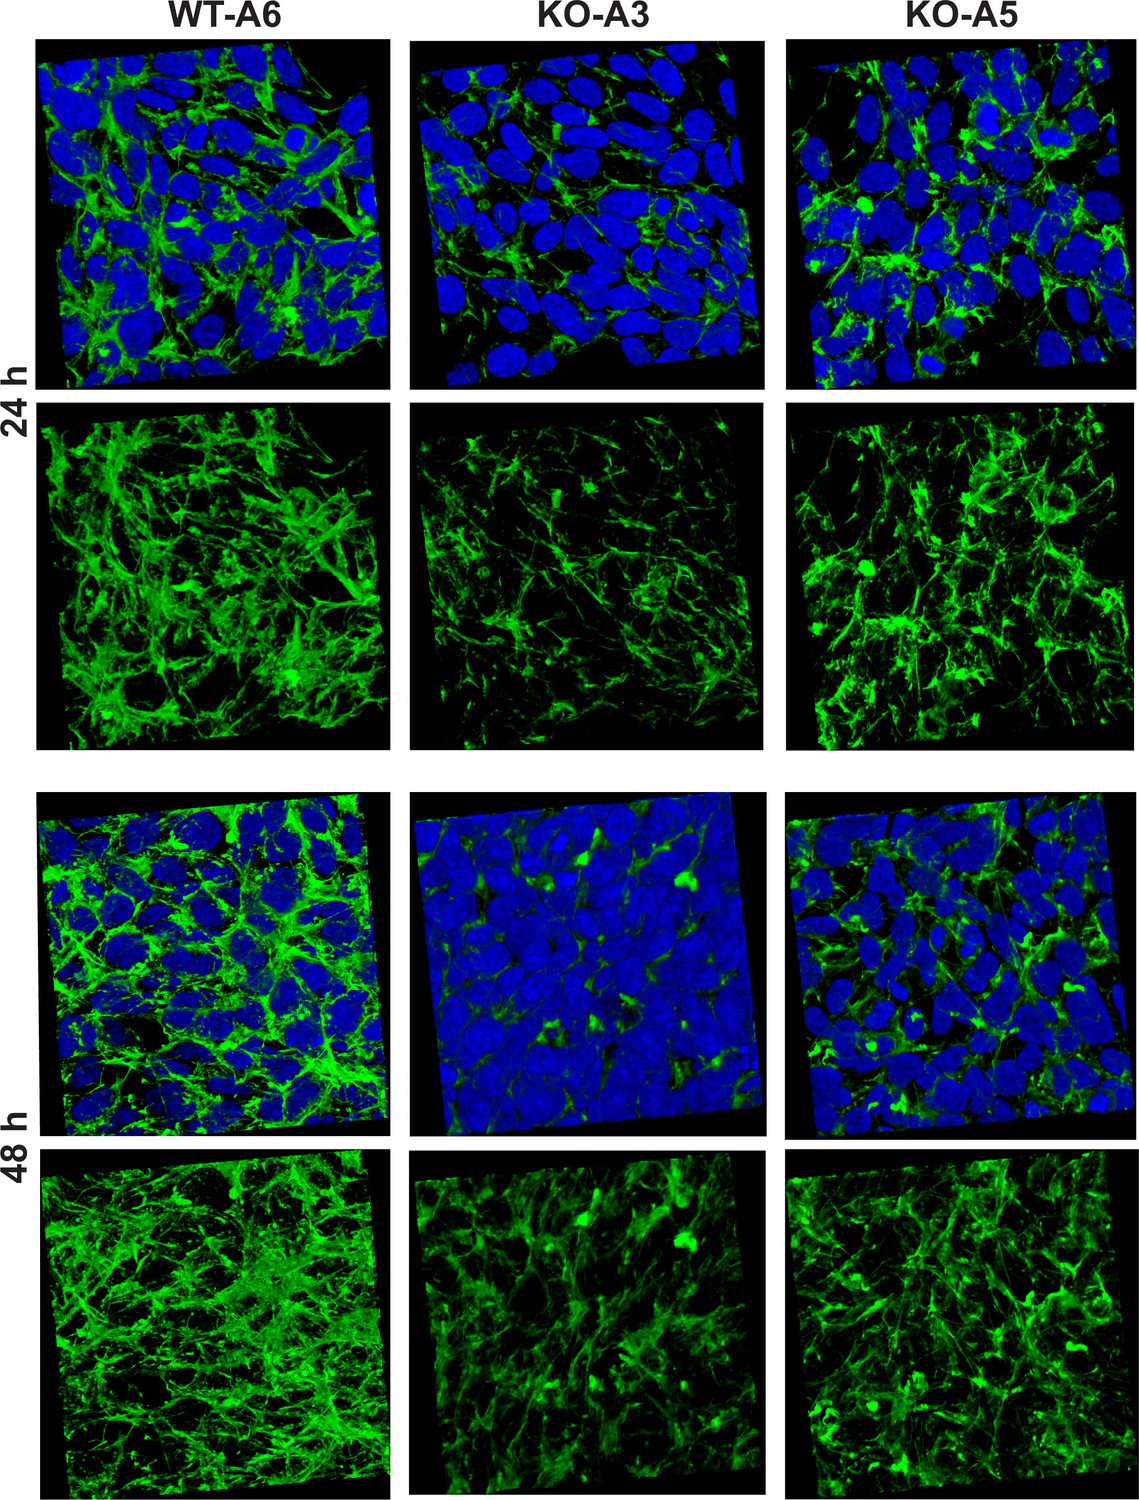
Organization of the actin cytoskeleton in Setd3-deficient HAP1 cells visualized by confocal microscopy.
Control HAP1 cells (WT-A6) and Setd3-deficinet clonal HAP1 cells (KO-A3 and KO-A5) were cultured for either 24 or 48 hr. The localization of filamentous actin was determined by staining with TRITC-phalloidin (green), while nuclei were visualized by staining with Hoechst 33342 (blue). Three-dimensional confocal microscope images of the actin cytoskeleton are shown with or without stained nuclei (blue). For 3D analysis, confocal Z-stacks comprising 10–13 optical slices were reconstructed into each 3D image with the aid of Zeiss Zen software.
Figure 14
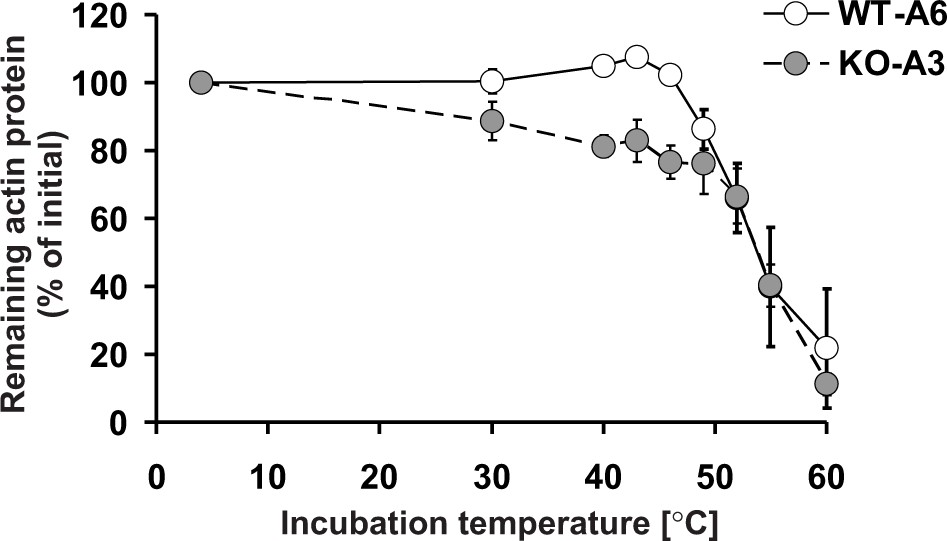
Thermal stability of actin in Setd3-deficient HAP1 cells.
Cell free lysates of control HAP1 cells (WT-A6) and Setd3-deficient clonal HAP1 cells (KO-A3) were incubated for 5 min at 4, 30, 40, 43, 46, 49, 52, 55 and 60°C. Precipitated proteins were then pelleted, and the resulting supernatants (24 or 48 µg protein) were analyzed by SDS-PAGE and by western-blotting, with the use of anti-actin primary antibody (A2066, Sigma-Aldrich) to visualize protein bands corresponding to the actin protein. The levels of actin were quantified by densitometry using Quantity One software (BioRad) and normalized to the intensity of the actin band of the sample incubated at 4°C. Values are the means ± S.E. (error bars) of three independent experiments. When no error bar is shown, the error is smaller than the width of the line.
-
Figure 14—source data 1
Quantification of western blots with Quantity One software.
- https://doi.org/10.7554/eLife.37921.040
Figure 15
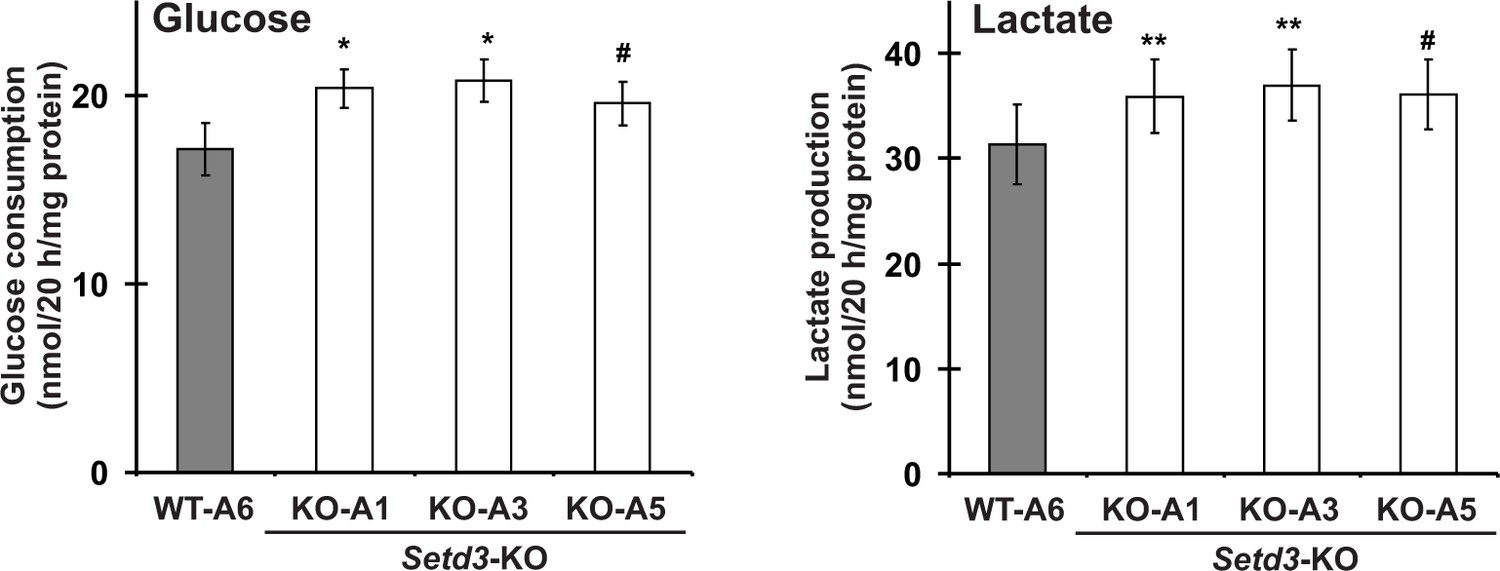
Impact of SETD3 inactivation on glucose consumption and lactate production in HAP1 cells.
Experiments were performed on three HAP1 cell lines that were deficient in Setd3 (KO-A1, KO-A3 and KO-A5) and a control HAP1 cell line (WT-A6) that has been submitted to the CRISPR/Cas9 gene inactivation procedure, but yielding no modification of the Setd3 gene. HAP1 cells (≈90% culture confluency) were supplemented with fresh medium and incubated for 20 hr as described in the 'Materials and methods'. The glucose and lactate concentrations in samples of deproteinized culture medium were determined spectrophotometrically as described in the 'Materials and methods'. Values are the means ± S.E. (error bars) of three independent experiments performed with cells from three different culture passages (n = 3). The data were assumed to be distributed normally, and the homogeneity of variances was verified with F tests. Statistical significance was analyzed using a one-tailed paired Student’s t-test (GraphPad Prism 4.0). #p<0.09, *p<0.05, **p<0.01.
-
Figure 15—source data 1
Quantification of glucose consumption in HAP1 human cells.
- https://doi.org/10.7554/eLife.37921.042
-
Figure 15—source data 2
Quantification of lactate production in HAP1 human cells.
- https://doi.org/10.7554/eLife.37921.043
Tables
Table 1
Purification of actin-specific histidine N-methyltransferase from rat skeletal muscles
https://doi.org/10.7554/eLife.37921.006| Fraction | Volume | Total protein | Total activity | Specific activity | Purification | Yield |
|---|---|---|---|---|---|---|
| ml | mg | pmol min−1 | pmol min−1 mg−1 | -fold | % | |
| Myofibrillar extract (20,000 × g supernatant) | 2400 | 35,273 | 8768 | 0.248 | 1 | 100 |
| 20% PEG fraction | 1000 | 16,333 | 4853 | 0.297 | 1.2 | 55.4 |
| DEAE Sepharose | 84.5 | 2757 | 5753 | 2.09 | 8.4 | 65.7 |
| Q Sepharose | 63.7 | 800 | 4507 | 5.637 | 22.7 | 51.5 |
| Phenyl Sepharose | 93.4 | 66 | 964 | 14.602 | 58.8 | 11.0 |
| HiScreen Blue | 27 | 14.3 | 682 | 47.6 | 191.7 | 7.8 |
| Superdex 200# | 3 | 1.20 | 185.5 | 154.8 | 623.4 | 2.12 |
| Reactive Red 120# | 3 | 0.18 | 52.04 | 291.2 | 1172.5 | 0.59 |
-
# The data represent mean values for the most purified fraction of the step applied. PEG, polyethylene glycol.
Table 2
Proteins identified in the gel bands submitted to trypsin digestion and MS/MS analysis. Identified proteins are listed for each band according to their score as calculated using ProteinLynx Global Server software (PLGS).
For each protein, the molecular weight (mW) and sequence coverage are also indicated. Occasional peptide hits corresponding to keratins have not been included.
| Gel band | Protein name | NCBI Protein accession number | PLGS score* | mW (Da) | Coverage (%) |
|---|---|---|---|---|---|
| A | Elongation factor 2 | NP_058941.1 | 16,249 | 95,222 | 73.5 |
| B | Calpain one catalytic subunit | NP_062025.1 | 3024 | 82,067 | 47.7 |
| Elongation factor 2 | NP_058941.1 | 789 | 95,222 | 15.2 | |
| Nuclear protein localization protein four homolog | NP_542144.1 | 778 | 68,013 | 31.7 | |
| C | Elongation factor 2 | NP_058941.1 | 2024 | 95,222 | 42.1 |
| Nuclear protein localization protein four homolog | NP_542144.1 | 1263 | 68,013 | 37.3 | |
| Histone lysine N-methyltransferase SETD3 | XP_002726820.2 | 1136 | 67,378 | 39.1 | |
| Eukaryotic peptide chain release factor GTP binding subunit ERF3A | NP_001003978.1 | 505 | 68,708 | 41.2 | |
| Guanylate binding protein 1 | NP_598308.1 | 404 | 67,312 | 21.8 | |
| Filamin-B-like isoform X2 | XP_003751493.2 | 272 | 121,901 | 1.4 |
-
*PLGS Score is calculated by the ProteinLynx Global Server (v2.4) software using a Monte Carlo algorithm to analyze all acquired mass spectral data and it is a statistical measure of accuracy of assignation. A higher score implies a greater confidence of protein identity.
-
Table 2—source data 1
Mass spectrometry (Q-TOF) identification of proteins present in the gel bands submitted to trypsin digestion.
- https://doi.org/10.7554/eLife.37921.009
Table 3
Kinetic properties of rat and human SETD3 proteins
Kinetic properties were determined with the use of purified recombinant C-terminal His6-tagged SETD3 protein.
| Substrate | Rat SETD3 | Human SETD3 | ||||||
|---|---|---|---|---|---|---|---|---|
| Vmax | KM | kcat | kcat/KM | Vmax | KM | kcat | kcat/KM | |
| nmol min−1 mg−1 | µM | min−1 | min−1 µM−1 | nmol min−1 mg−1 | µM | min−1 | min−1 µM−1 | |
| β-actin | 11.280 ± 1.018 | 2.996 ± 0.507 | 0.80 | 0.27 | 9.091 ± 0.308 | 0.752 ± 0.070 | 0.65 | 0.86 |
| S-adenosyl-L- methionine | 8.053 ± 0.136 | 0.109 ± 0.008 | 0.57 | 5.23 | 8.649 ± 0.119 | 0.116 ± 0.007 | 0.61 | 5.25 |
| Peptide H | 0.064 ± 0.004 | 10590 ± 1373 | 0.005 | 4.7 × 10⁻⁷ | 0.029 ± 0.003 | 8729 ± 1949 | 0.002 | 2.3 × 10⁻⁷ |
-
Determinations for S-adenosyl-L-methionine (SAM) were performed with the SETD3 preparations (0.04–0.05 µg protein, 5–7 nM), which were incubated for 8 min at 37°C in the reaction mixture containing 5 µM recombinant β-actin and variable concentrations of [1H+3H] SAM (≈320 × 103 cpm). The measurements for β-actin were obtained following a 5 min incubation of SETD3 in the presence of 1 μM concentration of [1H+3H] SAM (100 pmol, ≈300 × 103 cpm). The kinetic parameters of the enzymatic reaction for actin peptide H (YPIEHGIVT) were determined with SETD3 preparations (8.5–9.2 µg protein, 1.2–1.3 µM) incubated for 30 min in the presence of [1H+3H] SAM (100 pmol, ≈290 × 103 cpm). In all experiments, the reaction mixture contained the homogenous recombinant S-adenosyl-L-homocysteine (SAH) nucleosidase (1.6 µg protein, 600 nM, E. coli) and adenine deaminase (3.9 µg protein, 600 nM, B. subtilis) to prevent SAH accumulation. Values are the means of three or four independent experiments. The values for standard error of the mean (S.E.) are also given.
-
Table 3—source data 1
Determination of the kinetic parameters of SETD3-catalyzed methylation of actin (for actin as the substrate)
- https://doi.org/10.7554/eLife.37921.027
-
Table 3—source data 2
Determination of the kinetic parameters of SETD3-catalyzed methylation of actin (for SAM as the substrate)
- https://doi.org/10.7554/eLife.37921.028
-
Table 3—source data 3
Determination of the kinetic parameters of SETD3-catalyzed methylation of peptide H
- https://doi.org/10.7554/eLife.37921.029
Table 4
Analysis of actin methylation at the H74 residue in the tissues of Drosophila larvae by tandem mass spectrometry.
The total number of identified peptide sequences with H74 (peptide spectrum matches, PSMs) for three different forms of actin present in either wildtype Drosophila larvae (WT) or Setd3 KO animals (SETD3 KO) are indicated. The total numbers of PSMs recorded for actin proteins in these MS/MS experiments are as follows: 90 (Actin-42A, WT), 118 (Actin-57B, WT), 111 (Actin-87E, WT), 86 (Actin-42A, SETD3 KO), 111 (Actin-57B, SETD3 KO), 78 (Actin-87E, SETD3 KO).
| Actin | Peptide variant | Number of identified peptide sequences (PSMs) | |
|---|---|---|---|
| WT | SETD3 KO | ||
| Actin-42A (P02572) | H74 | 0 | 14 |
| Methylated H74 | 12 | 0 | |
| Actin-57B (P53501) | H74 | 0 | 19 |
| Methylated H74 | 9 | 0 | |
| Actin-87E (P10981) | H74 | 0 | 19 |
| Methylated H74 | 9 | 0 | |
-
Table 4—source data 1
Mass spectrometry (Orbitrap Fusion Lumos tribrid) identification of both non-modified and methylated actin peptides from the tissues of Drosophila melanogaster larvae.
- https://doi.org/10.7554/eLife.37921.036
Key resources table
| Reagent type (species) or resource | Designation | Source or reference | Identifiers | Additional information |
|---|---|---|---|---|
| Antibody | Rabbit anti-SETD3 antibody | Abcam | ab174662; RRID:AB_2750852 | (1:10,000) |
| Antibody | Rabbit anti-Actin antibody | Sigma-Aldrich | A2066; RRID:AB_476693 | (1:1000) |
| Antibody | Horseradish peroxidase- conjugated goat anti-rabbit IgG antibody | Agrisera | AS09602; RRID:AB_1966902 | (1:20,000; 1:25,000) |
| Antibody | Mouse anti-His6 tag antibody | GE Healthcare; PMID: 23705015 | 27-4710-01; RRID:AB_771435 | (1:2000) |
| Antibody | Horseradish peroxidase -conjugated goat anti-mouse antibody | Sigma-Aldrich; PMID: 23705015 | A2554; RRID:AB_258008 | (1:10,000) |
| Cell line (Homo sapiens) | HAP1 | Horizon Discovery | C859; RRID:CVCL_Y019 | The HAP1 cell line was bought directly from Horizon Discovery (Waterbeach, UK) and has been control quality checked by the vendor |
| Cell line (Cercopithecus aethiops) | COS-7 | Cell Lines Service | 605470; RRID:CVCL_0224 | The COS-7 cell line was bought directly from CLS (Eppelheim, Germany) and has been control quality checked by the vendor |
| Gene (Escherichia coli) | SAH nucleosidase | NA | NCBI: NC_000913.3 | |
| Gene (Bacillus subtilis) | Adenine deaminase | NA | NCBI: NC_000964.3 | |
| Gene (H. sapiens) | β-actin | NA | GenBank: NM_001101.4 | |
| Gene (H. sapiens) | SETD3 | NA | NCBI: NM_032233.2 | |
| Gene (Rattus norvegicus) | SETD3 | NA | NCBI: XM_002726774.2 | |
| Gene (H. sapiens) | Cofilin-1 | NA | NCBI: NM_005507.2 | |
| Gene (H. sapiens) | Profilin-1 | NA | NCBI: NM_005022.3 | |
| Recombinant DNA reagent | pCOLD I (plasmid) | Takara Bio | 3361 | |
| Recombinant DNA reagent | pESC-URA (plasmid) | Agilent Technologies | 217454 | |
| Recombinant DNA reagent | pEF6/Myc-His A (plasmid) | Invitrogen | V96220 | |
| Recombinant DNA reagent | pSpCas0n(BB)−2A-Puro (plasmid) | Other | Kind gift of F. Zhang, Massachusetts Institute of Technology | |
| Genetic reagent (C. aethiops) | pEF6/SETD3 | This paper | Transient overexpression of the recombinant human and rat SETD3 proteins in the COS-7 cell line | |
| Genetic reagent (E. coli) | pCOLD I/SETD3 | This paper | Overexpression of the recombinant human and rat SETD3 proteins in the E. coli BL21 (DE3) | |
| Genetic reagent (E. coli) | pCOLD I/β-actin | PMID: 20851184 | Kind gift of M. Tamura, Ehime University | |
| Genetic reagent (E. coli) | pCOLD I/SAH nucleosidase | This paper | Overexpression of the recombinant E. coli SAH nucleosidase in the E.coli BL21 (DE3) | |
| Genetic reagent (E. coli) | pCOLD I/adenine deaminase | This paper | Overexpression of the recombinantB.subtilis adenine deaminase in the E. coli BL21 (DE3) | |
| Genetic reagent (E. coli) | pCOLD I/Cofilin-1 | This paper | Overexpression of the recombinant human cofilin-1 in the E. coli BL21 (DE3) | |
| Genetic reagent (E. coli) | pCOLD I/Profilin-1 | This paper | Overexpression of the recombinant human profilin-1 in the E. coli BL21 (DE3) | |
| Genetic reagent (Saccharomyces cerevisiae) | pESC-URA/β-actin | This paper | Overexpression of the recombinant human β-actin in the S. cerevisiae BY4742 strain | |
| Strain, strain background (B. subtilis) | Bacillus subtilis | Sigma-Aldrich | ATCC:6633 | |
| Strain, strain background (E. coli) | E. coli BL21 (DE3) | Agilent Technologies | 200131 | |
| Strain, strain background (S. cerevisiae) | BY4742 | EUROSCARF | Y10000 | |
| Strain, strain background (S. cerevisiae) | BY4742/β-actin | This paper | BY4742 strain overexpressing recombinant human β-actin | |
| Peptide, recombinant protein | Peptide H | Caslo Laboratory | ||
| Peptide, recombinant protein | Peptide A | Caslo Laboratory | ||
| Peptide, recombinant protein | Peptide H3N4 | Caslo Laboratory | ||
| Chemical compound, drug | S-[methyl-3H]adenosyl-L-methionine; [3H]SAM | PerkinElmer | NET155V250UC; NET155V001MC | |
| Chemical compound, drug | S-[methyl-2H]adenosyl-L-methionine; [2H]SAM | C/D/N Isotopes Inc. | D-4093 | |
| Software, algorithm | ProteinLynx Global Server 2.4; PLGS 2.4 | Waters | RRID:SCR_016664 | |
| Software, algorithm | Quantity One | BioRad | RRID:SCR_016622 | |
| Software, algorithm | GraphPad Prism 4.0 | GraphPad Software | RRID:SCR_002798 | |
| Software, algorithm | Proteome Discoverer | Thermo Fisher Scientific | RRID:SCR_014477 | |
| Software, algorithm | Zeiss Zen | Zeiss | RRID:SCR_013672 |
Table 5
Sequences of primers used in PCR experiments The nucleotides corresponding to the coding sequences are in capital letters, the Kozak consensus sequence is shown in bold, and the added restriction sites are underlined.
https://doi.org/10.7554/eLife.37921.044| Primer | Sequence | Restriction site | Plasmid | Protein expressed |
|---|---|---|---|---|
| Preparation of SEDT3 protein expression vectors | ||||
| #1 | taaggtaccgccaccATGGGTAAGAAGAGTCGAGTG | KpnI | pEF6/Myc-His A | C-terminal His6-tagged rat SEDT3 protein |
| #2* | taagcggccgCCAGAGTCGCTCCTTCACCGC | NotI | ||
| #3 | taaggtaccgccaccATGGGTAAGAAGAGTCGAGTAA | KpnI | pEF6/Myc-His A | C-terminal His6-tagged rat SEDT3 protein |
| #4* | taagcggccgCCACTCCTTAACTCCAGCAGTG | NotI | ||
| Preparation of cofilin-1 and profilin-1 expression vectors | ||||
| #5 | tatacatATGGCCTCCGGTGTGGCTG | NdeI | pCOLD I | N-terminal His6-tagged human cofilin-1 |
| #6 | tataaagcTTATCACAAAGGCTTGCCCTCCAG | HindIII | ||
| #7 | tatacatATGGCCGGGTGGAACGCC | NdeI | pCOLD I | N-terminal His6-tagged human profilin-1 |
| #8 | tataaagcTTATCAGTACTGGGAACGCCGAAG | HindIII | ||
| Preparation of S-adenosyl-L-homocysteine nucleosidase and andenine deaminase expression vectors | ||||
| #9 | tatacatATGAAAATCGGCATCATTGGTG | NdeI | pCOLD I | N-terminal His6-tagged E. coli SAH nucleosidase |
| #10 | tataaagcTTAGCCATGTGCAAGTTTCTGC | HindIII | ||
| #11 | tataggtaccTTGAATAAAGAAGCGCTAGTCAAT | KpnI | pCOLD I | N-terminal His6-tagged B. subtilis andenine deaminase |
| #12 | tataggatccTTATTGCAGTGATATGTGTTGAAAT | BamHI |
-
*Original STOP codons were replaced by CCA (shown in italic and underlined) to allow C-terminal HisTag translation.
Additional files
-
Transparent reporting form
- https://doi.org/10.7554/eLife.37921.045
Download links
A two-part list of links to download the article, or parts of the article, in various formats.
Downloads (link to download the article as PDF)
Open citations (links to open the citations from this article in various online reference manager services)
Cite this article (links to download the citations from this article in formats compatible with various reference manager tools)
SETD3 protein is the actin-specific histidine N-methyltransferase
eLife 7:e37921.
https://doi.org/10.7554/eLife.37921


