Phase transitioned nuclear Oskar promotes cell division of Drosophila primordial germ cells
- Howard Hughes Medical Institute, NYU School of Medicine, United States
- University of Washington, United States
- University of Toronto, Canada
- NYU School of Medicine, United States
- NYU Langone Health, United States
- University of Texas Southwestern Medical Center, United States
Figures
Figure 1 with 7 supplements
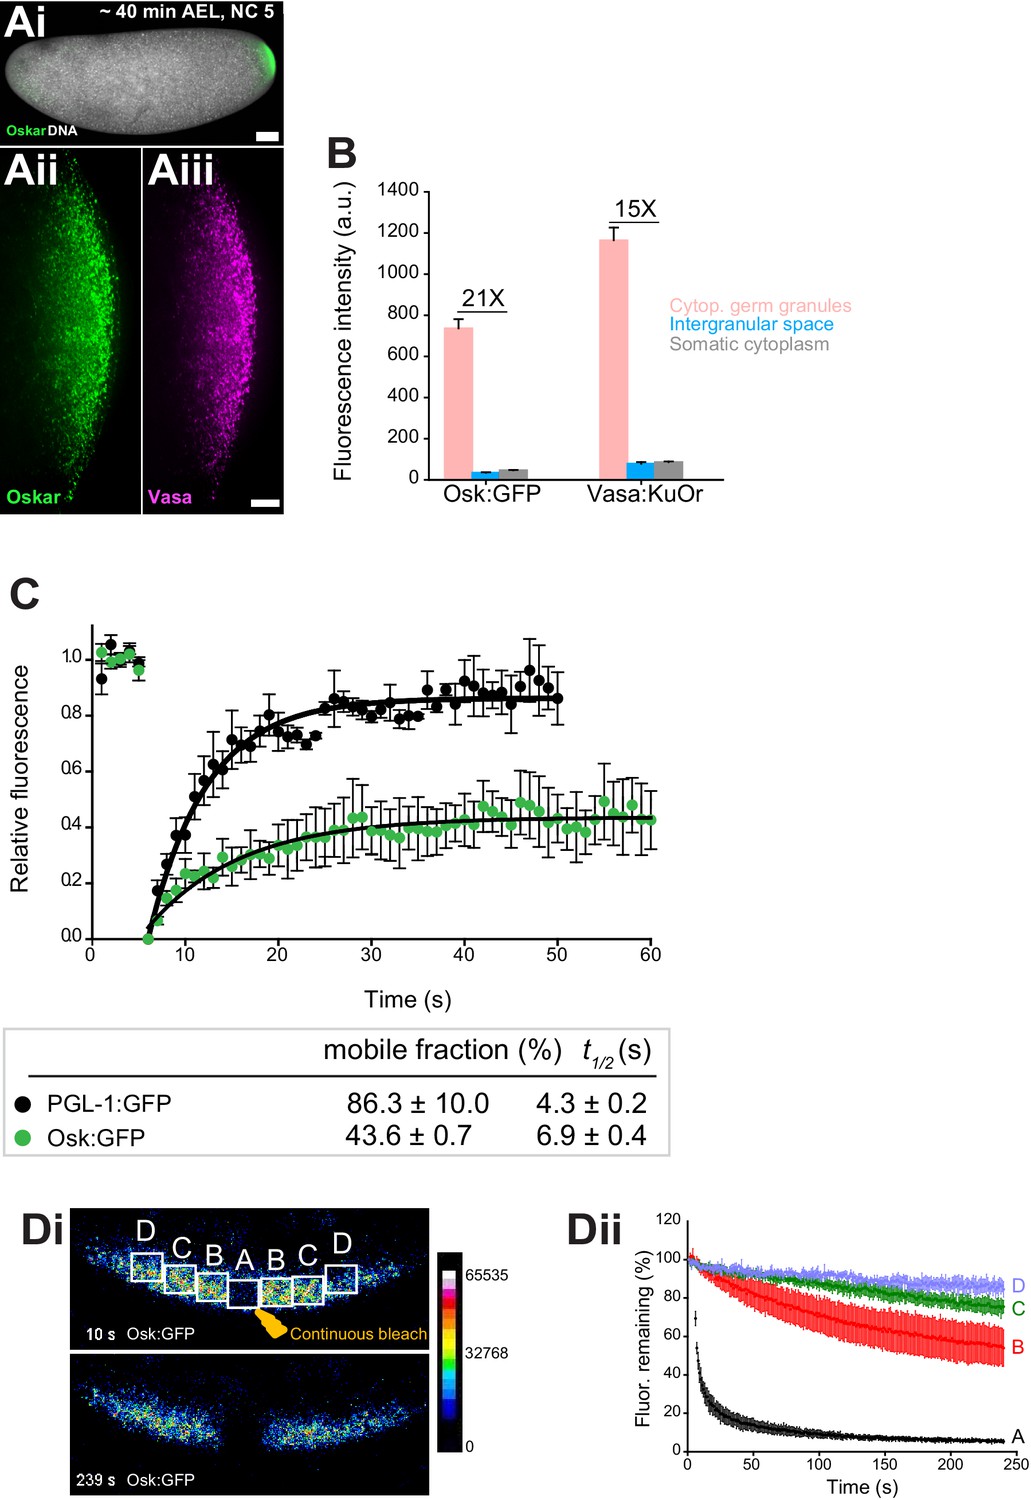
Cytoplasmic germ granules display properties of phase transitioned condensates.
(Ai-iii) Drosophila embryos stained with an antibody against Oskar (Ai) (green) and counter-stained for DNA with DAPI (white) or expressing Osk:GFP (green) and Vasa:KuOr (magenta) (ii, iii) at NC five. (B) Levels of Osk:GFP and Vasa:KuOr fluorescence in cytoplasmic germ granules (pink bar), the intergranular space (blue bar) and the somatic cytoplasm (grey bar). 21X and 15X fold enrichment of Osk:GFP and Vasa:KuOr fluorescence relative to the intergranular space is marked, respectively. For each bar, mean fluorescent levels per area unit ±SEM of 23 granules, 20 ROIs in the intergranular space and 20 ROIs in somatic cytoplasm are shown (Figure 1—figure supplement 1B). (C) FRAP of PGL-1:GFP (one cell zygote in C. elegans, black circles) and Osk:GFP located in the cytoplasmic germ granules (green circles). Mean ±SEM of three Osk:GFP ROIs (green) and five P granules (black) is shown. Black lines show fit to the experimental data. Below the graph, the percent mobile fraction and half time to full recovery (t1/2) derived from C are shown. (Di,ii). FLIP of Osk:GFP in the early embryo. Region A was continuously bleached for four minutes and an image of the embryo acquired every second. Images in i are pseudo-colored to demonstrate fluorescence intensity levels. ii Fluctuation of Osk:GFP fluorescence in regions A,B,C,D (shown in i) and plotted as percent relative to time 0. Normalized mean fluorescence levels ± STDEV of 2 (region A) and 4 (region B-D) ROIs of equal size are shown. Scale bar in Aiii is 10 μm, Ai is 50 μm.
Figure 1—figure supplement 1
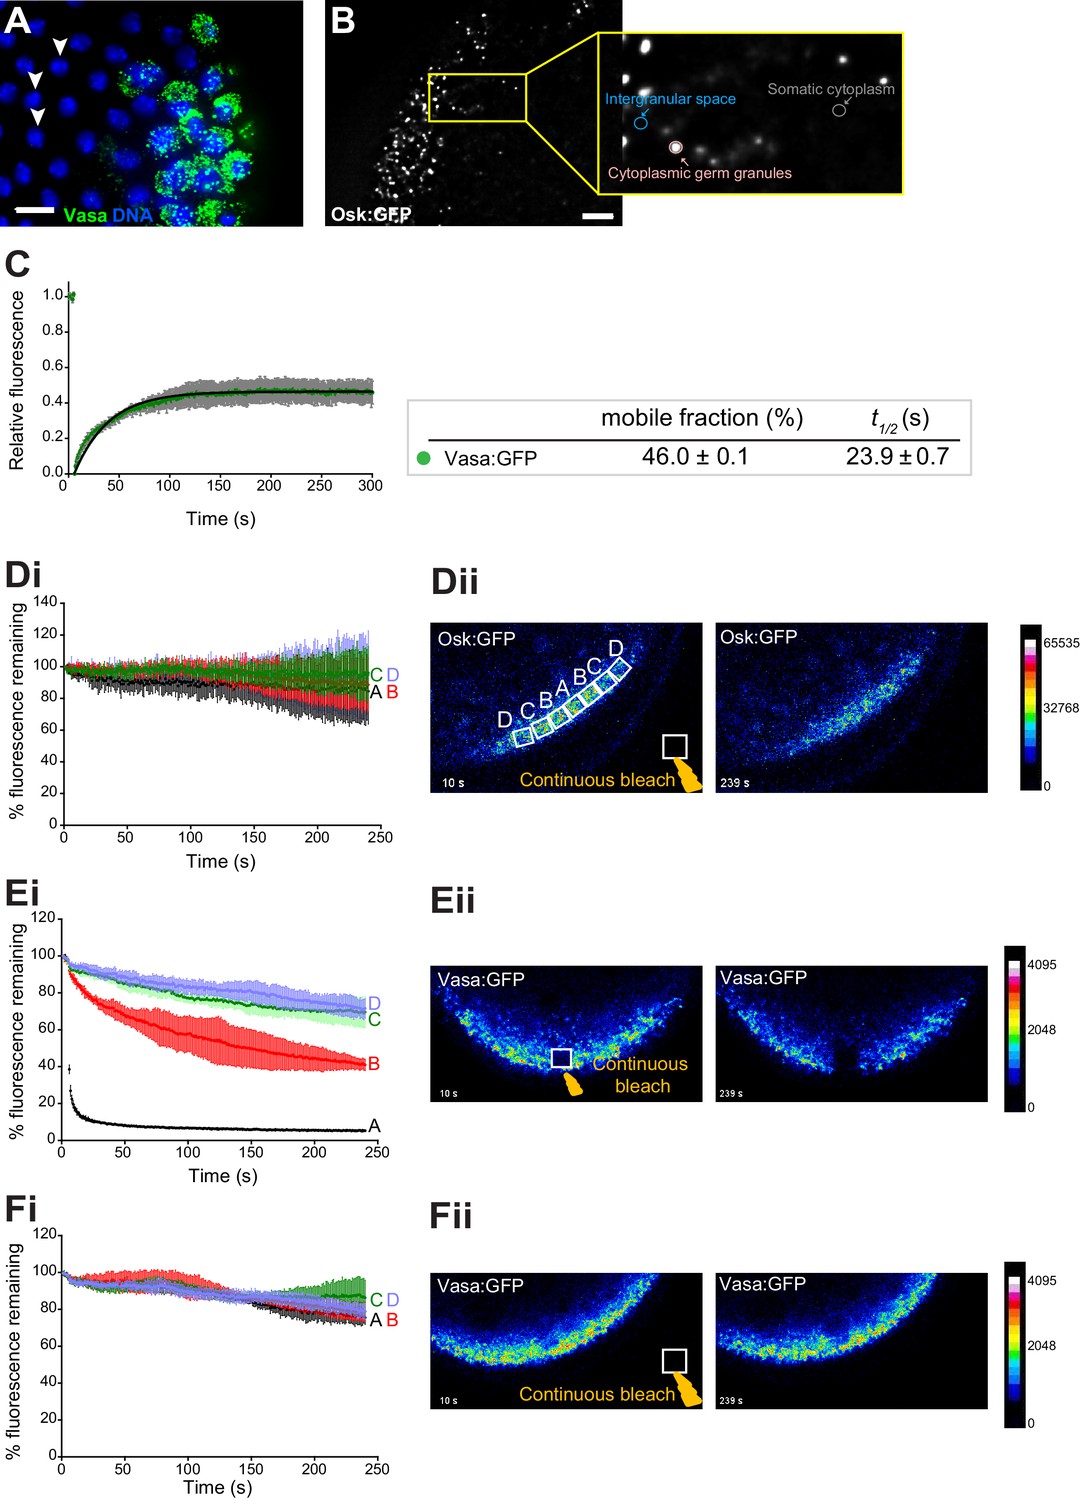
Cytoplasmic germ granules display properties of phase transitioned condensates.
(A) Vasa:GFP (green) and DAPI (blue) stained embryos. White arrowheads point at somatic nuclei. (B) Quantification of the fold enrichment of Osk:GFP and Vasa:KuOr fluorescence in cytoplasmic germ granules relative to the intergranular space and somatic cytoplasm. (C) FRAP of Vasa:GFP in cytoplasmic germ granules. Mean ±STDEV of five Vasa:GFP ROIs is shown. Black line shows fit to the experimental data. % mobile fraction and t1/2 derived from C are shown below the graph. (D-F) In the early embryos expressing Osk:GFP or Vasa:KuOr, region A was continuously bleached for four minutes in the germ plasm (E) or outside of the embryo (D,F) and an image of the embryo acquired every second. Images in all panels are pseudo-colored to demonstrate fluorescence intensity levels. Fluctuation of Osk:GFP or Vasa:KuOr fluorescence was monitored over time in regions A,B,C,D (as shown in Dii) and plotted as a percent relative to time 0 (i). Normalized mean fluorescence levels ± STDEV of 2 (region A) and 4 (region B-D) ROIs of equal size for each condition are shown. Scale bar in A,B is 10 μm.
Figure 1—video 1
FRAP of Osk:GFP in cytoplasmic germ granules in embryos.
https://doi.org/10.7554/eLife.37949.004
Figure 1—video 2
Continuous photobleaching of Osk:GFP in germ plasm.
https://doi.org/10.7554/eLife.37949.005
Figure 1—video 3
Continuous photobleaching of an ROI outside of embryo.
https://doi.org/10.7554/eLife.37949.006
Figure 1—video 4
Continuous photobleaching of Vasa:GFP in germ plasm.
https://doi.org/10.7554/eLife.37949.007
Figure 1—video 5
Continuous photobleaching of an ROI outside of embryo.
https://doi.org/10.7554/eLife.37949.008
Figure 1—video 6
FRAP of PGL-1:GFP in C. elegans P granules.
https://doi.org/10.7554/eLife.37949.009
Figure 2 with 2 supplements
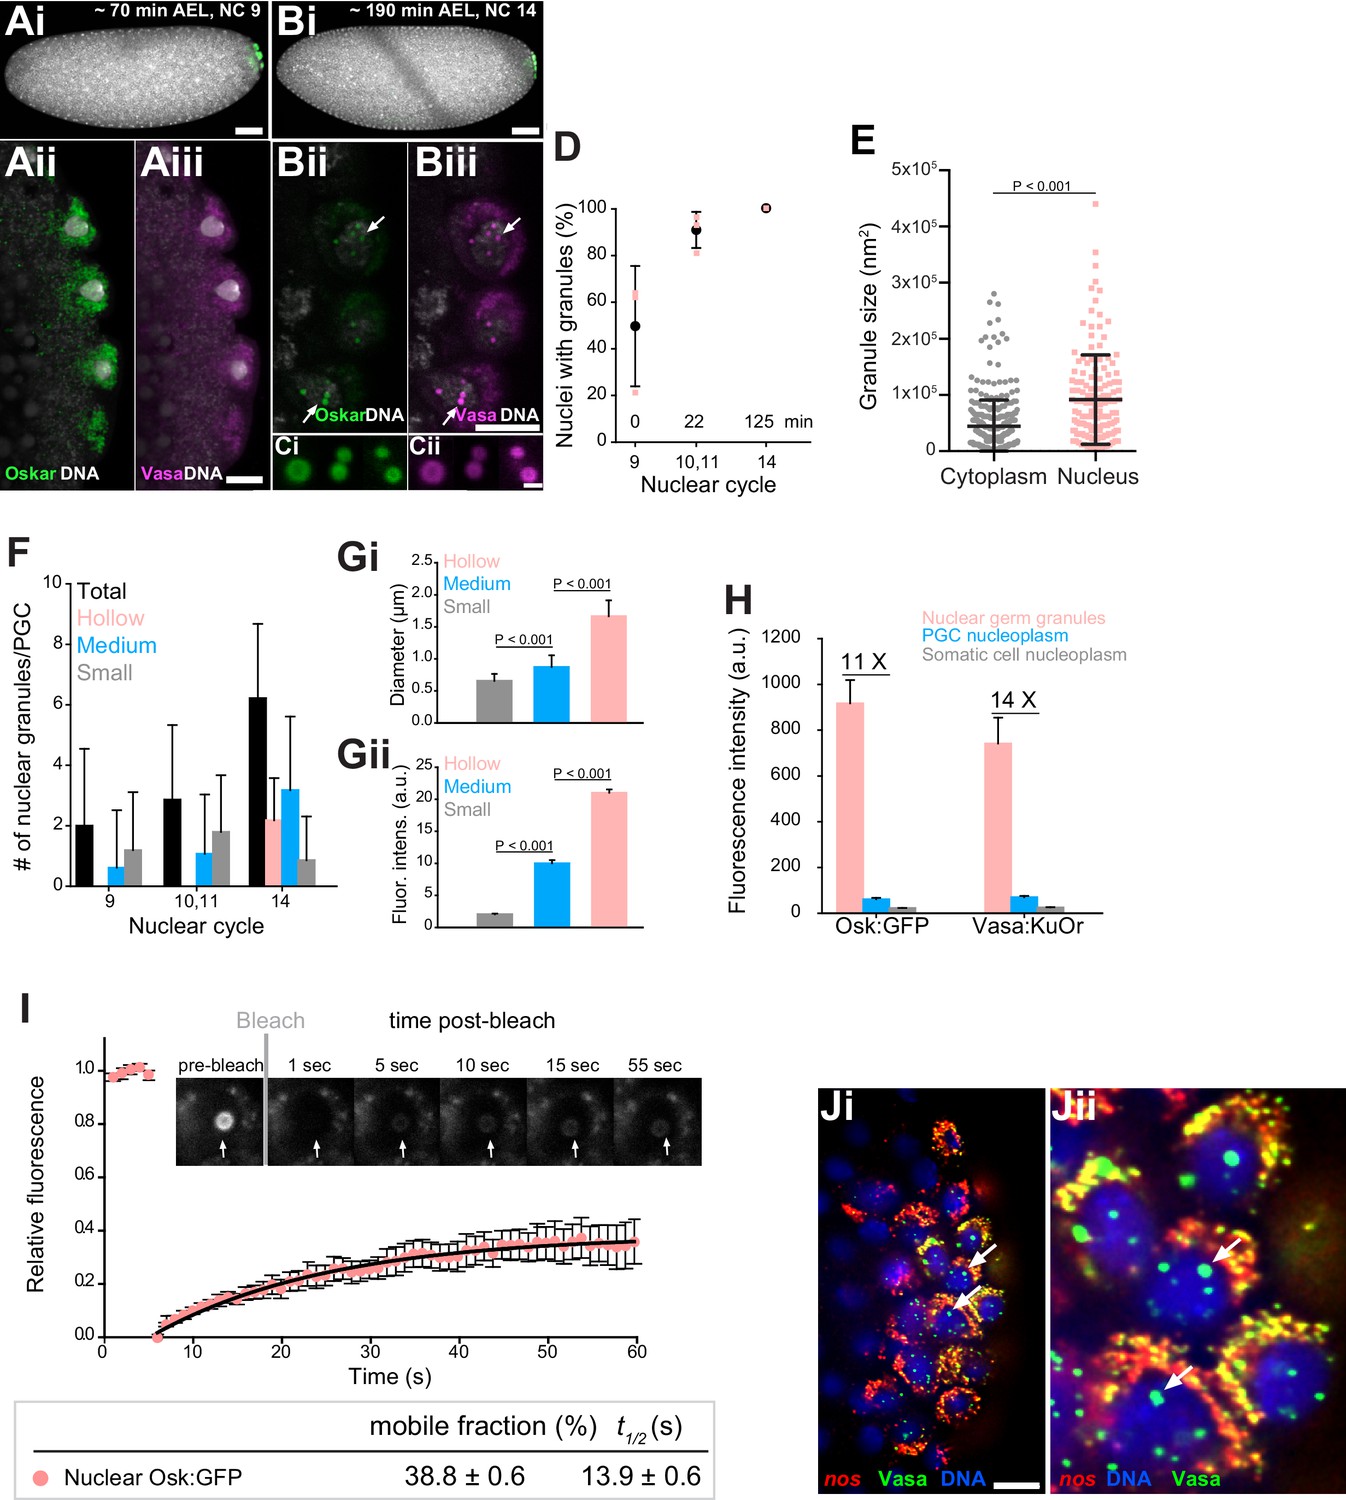
Core germ granule proteins Oskar and Vasa form phase transitioned nuclear germ granules in primordial germ cells.
(A-B) Drosophila embryos stained with an antibody against Oskar (Ai,Bi) (green) and counter-stained for DNA with DAPI (white) or expressing Osk:GFP (green) and Vasa:KuOr (magenta) (Aii,Aiii, Bii,Biii) and counter stained with DAPI (white) at NC nine and 14. White arrows point at hollow nuclear germ granules. (C) Close-up of nuclear germ granules marked by Osk:GFP (i, green) and Vasa:KuOr (ii, magenta) at NC 14. (D) Appearance of nuclear granules in PGCs at NC nine (0 min), NC 10,11 (22 min) and NC 14 (125 min). The number of PGCs with nuclear germ granules was counted at each NC. Three embryos per NC were analyzed and an average percent of granule-containing nuclei per embryo per NC calculated (pink circles). Mean ±STDEV is shown. (E) Nuclear germ granules are larger than cytoplasmic germ granules (91797 nm2 = 606.0 nm diameter vs. 44533 nm2 = 422.1 nm diameter, respectively; unpaired t-test, p<0.0001). Mean ±STDEV is shown. (F) Number of nuclear granules per PGC through early embryogenesis. PGCs of two Vasa:GFP expressing embryos per NC were analyzed and mean ±STDEV of total (black bars), small (grey), medium (blue) and hollow (pink) number of nuclear germ granules per PGC per NC determined. Gi,ii Small, medium and hollow nuclear granules differ in their size (i) and amount of protein (ii) (statistical significance: two-tailed t-test). Mean ±STDEV of 20 to 31 granules is shown. (H) Levels of Osk:GFP and Vasa:KuOr fluorescence in nuclear germ granules (pink bar), in the PGC nucleoplasm (blue bar) and in the somatic cell nucleoplasm (grey bar). 11X and 14X fold enrichment of Osk:GFP and Vasa:KuOr fluorescence relative to the PGC nucleoplasm, respectively, is shown. For each bar, mean fluorescent levels ± SEM of nine granules, 12 ROIs in the PGC nucleoplasm and 15 ROIs in somatic cell nucleoplasm are shown (see Figure 1—figure supplement 1B). (I) FRAP of nuclear Osk:GFP germ granules in PGCs. Mean ±SEM of eight hollow nuclear germ granules is shown. Black line shows the fit to the experimental data. Below the graph, the % mobile fraction and t1/2 derived from I is shown. Images in the graph show fluorescence recovery before and after photobleaching. White arrow points at the bleached granule. (J) i,ii smFISH reveals that germ plasm mRNA nos (red) is enriched in cytoplasmic, but not in nuclear germ granules (green). DNA stained with DAPI is shown in blue. ii close-up of Ji. Arrows point at nuclear germ granules lacking nos smFISH signal. Scale bar in Cii is 1 μm and in Aiii, Biii, Ji is 10 μm and in Ai, Bi is 50 μm.
Figure 2—figure supplement 1
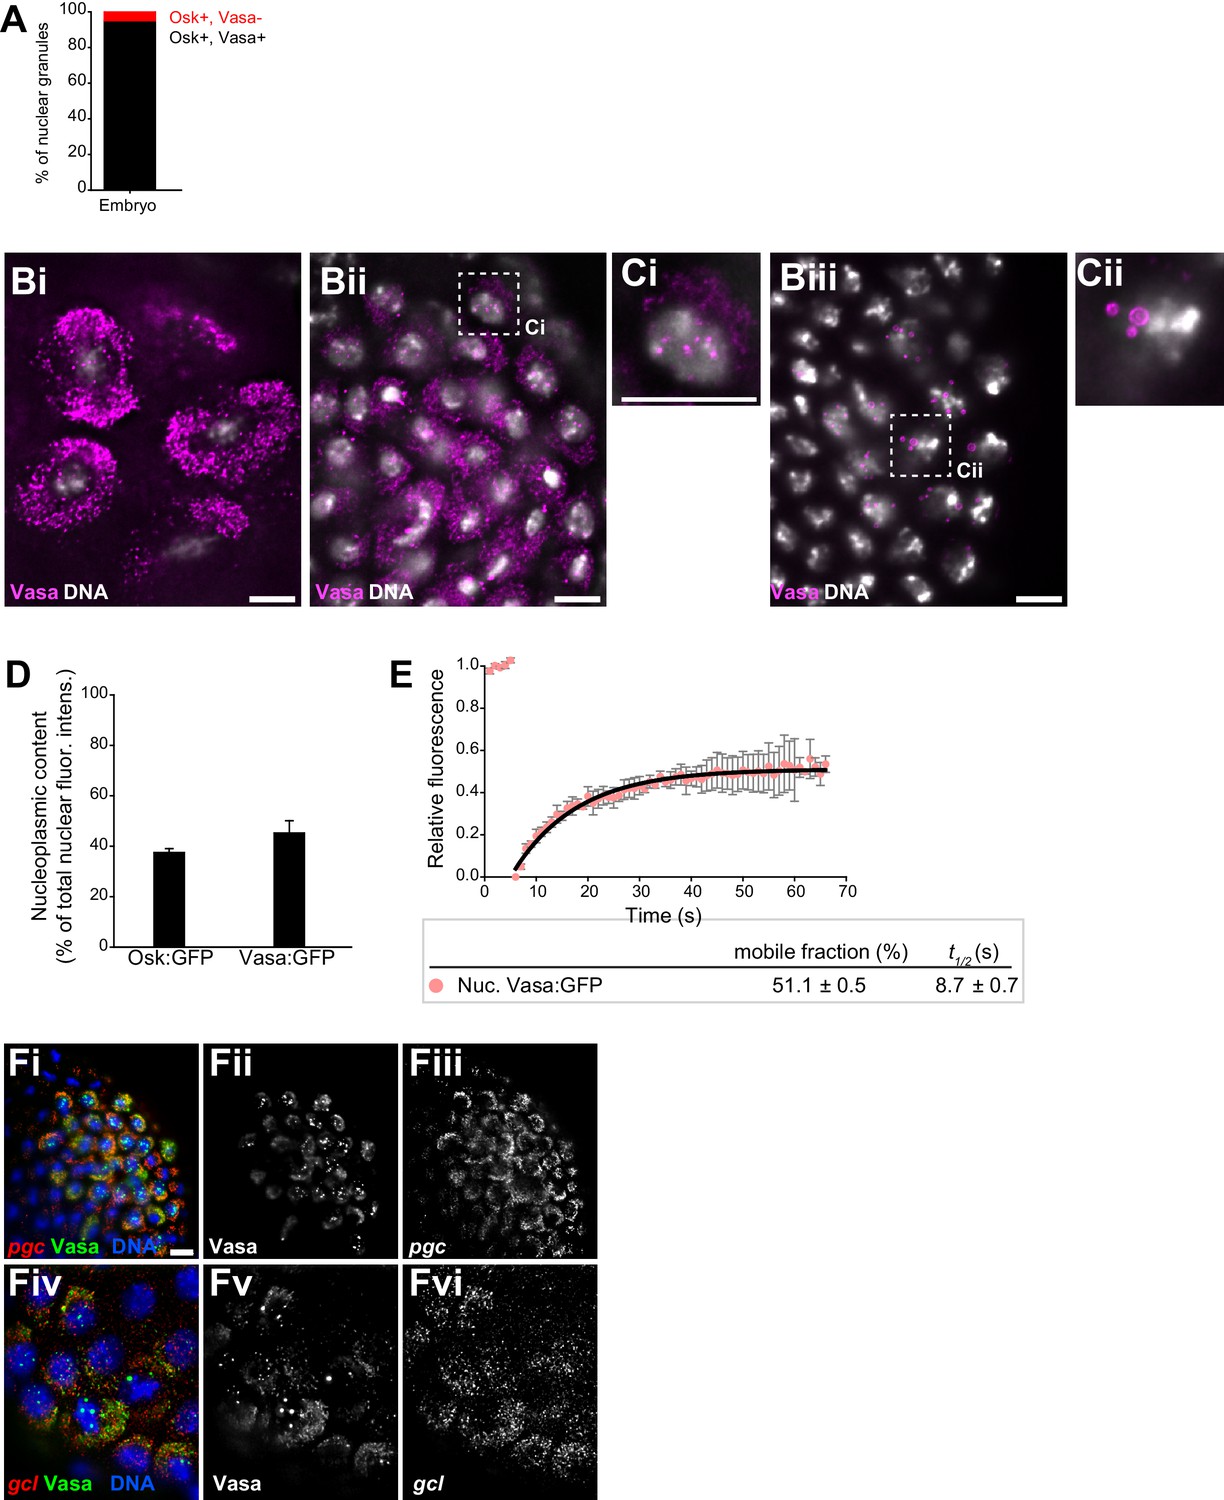
Core germ granule proteins Oskar and Vasa form phase transitioned nuclear germ granules in primordial germ cells.
(A) Majority of nuclear germ granules are populated by Oskar and Vasa proteins. 143 granules were analyzed. (B,C) Cytoplasmic and nuclear germ granules at NC 9 (Bi), NC 11 (Bii) and NC 14 (Biii) marked with Vasa:GFP (magenta). DNA was stained with DAPI (white). Ci and ii are close-ups of nuclei shown in Bii and Biii. (D) Quantification of total non-granular Osk:GFP and Vasa:GFP dispersed in the nucleoplasm (nucleoplasmic content) in PGCs. Eight PGC nuclei were quantified for each protein and mean ±SEM plotted. (E) FRAP of Vasa:GFP in nuclear germ granules. Mean ± STDEV of four Vasa:GFP granules is shown. Black line shows fit to the experimental data. % mobile fraction and t1/2 are shown below the graph. (F) smFISH of pgc (Fi-iii) and gcl (Fiv-vi) mRNAs (red). Granules (green) are labeled with Vasa:GFP and nuclei (blue) are labeled with DAPI. Scale bar in Ci,Cii is 5 μm and in Bi-iii, Fi is 10 μm.
Figure 2—video 1
FRAP of Osk:GFP in nuclear germ granules of PGCs.
https://doi.org/10.7554/eLife.37949.012
Figure 3 with 1 supplement
Expression of Short Oskar in cell lines reconstitutes nuclear germ granules .
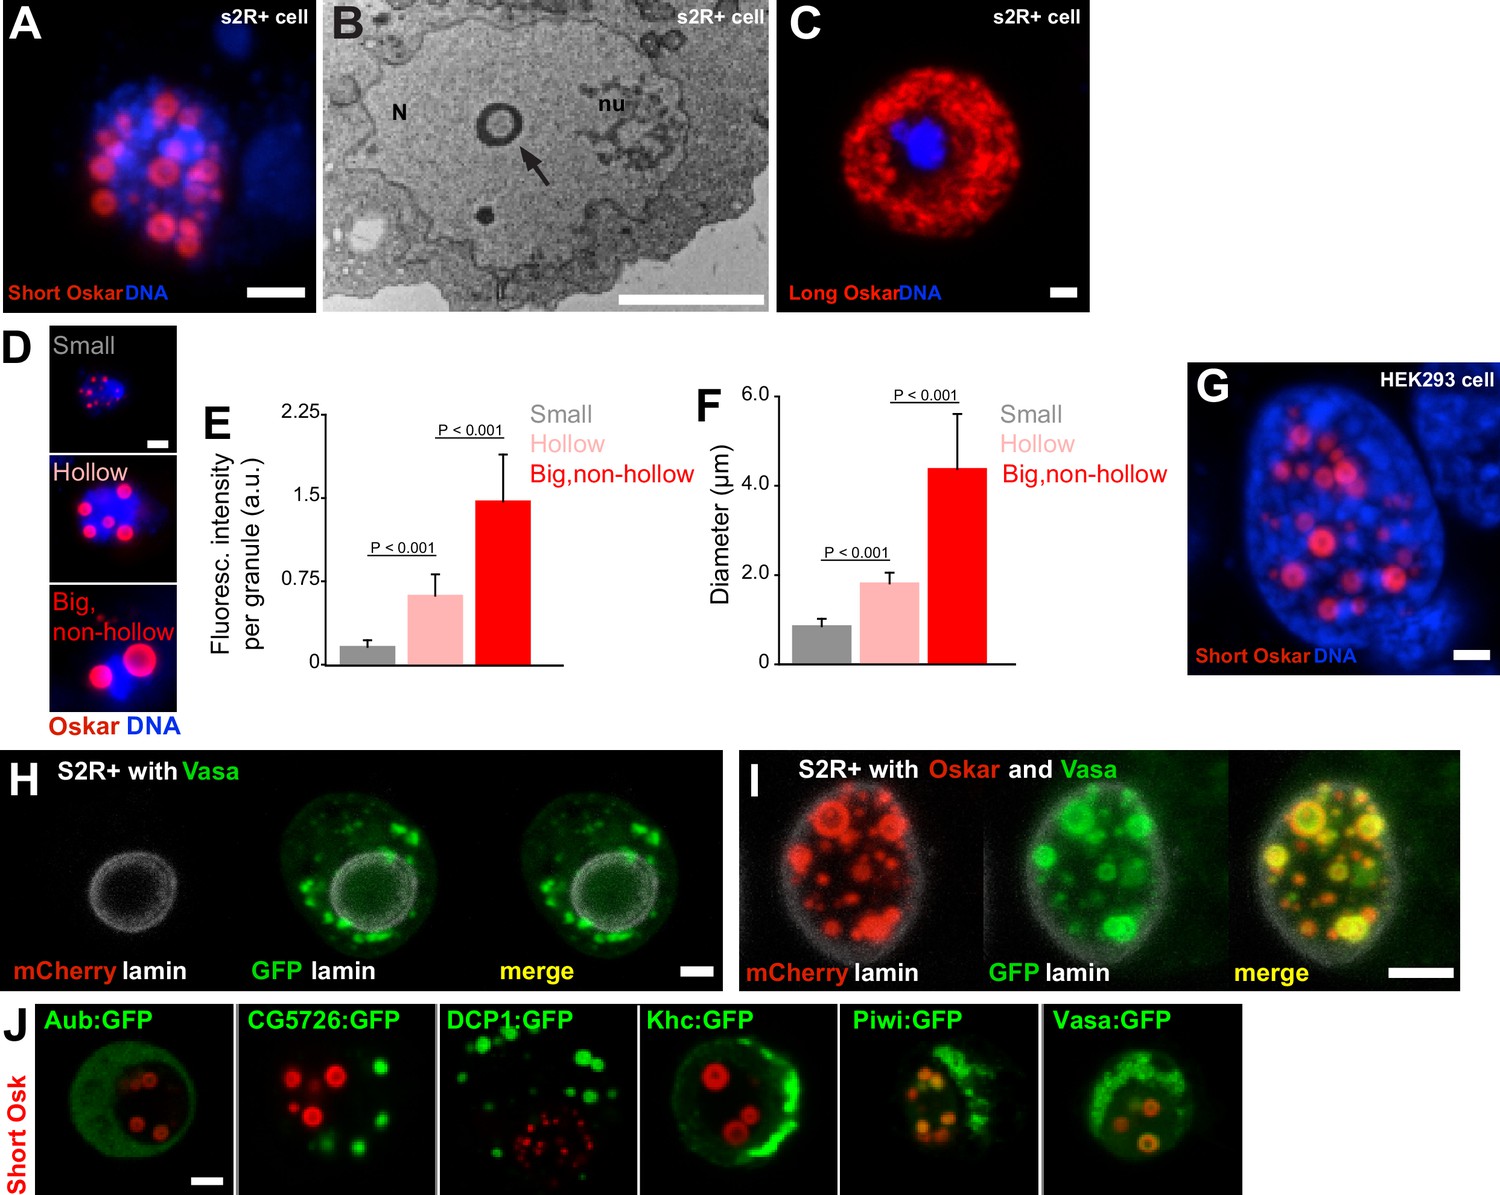
(A) Short mCherry:Osk forms hollow nuclear granules when transfected into cultured Drosophila S2R+ cells. (B) Transmission electron micrograph of a Drosophila cell transfected with Oskar shows the cross-section of a granule (arrow) with an electron-lucid core located within the nucleus (N) and separate from the nucleolus (nu). (C) Long Oskar does not form granules in S2R+ cells. (D-F) Three types of Short mCherry:Osk nuclear germ granules can be observed in S2R+ cells (small, hollow and big and non-hollow) that differ in the amount of protein (E) and in their size (F). In E and F, mean ± STDEV of 10 (small, hollow) and five (big, non-hollow) granules is shown (statistical significance: two-tailed t-test). (G) Short Osk:mCherry forms nuclear granules when transfected into human HEK293 cells. (H) S2R+ cell transiently transfected with a plasmid expressing Vasa:GFP (green) or, (I), co-transfected with Short mCherry:Osk (red) and Vasa:GFP (green) and counter-stained with an antibody for nuclear lamin (white). (J) S2R+ cells co-transfected with Short mCherry:Osk (red) and Aub:GFP, CG5726:GFP, DCP1:GFP, Khc:GFP, Piwi:GFP or Vasa:GFP (green). Scale bar in all is 2 μm.
-
Figure 3—source data 1
We previously identified proteins associated with Short Osk from early embryos using IP/mass spec (Hurd et al., 2016).
Since our data show that the somatic cytoplasm and the intergranular space are largely devoid of Oskar protein (Figure 1B) (Vanzo and Ephrussi, 2002), we assume that the proteins that precipitated with Short Osk most likely interacted with it in germ granules. As a control, we used the results of a parallel experiment where we had identified proteins that co-IPed with the 138 aa N-terminal part of Long Osk, which does not share any protein sequence with Short Osk and localizes to the posterior egg cortex but not to germ granules or nuclear granules (Hurd et al., 2016). Proteins that co-IPed with this control and Short Osk were considered non-specific contaminants. This control also eliminated non-physiological protein interactions that may have resulted from over-expression of tagged Osk proteins (Hurd et al., 2016). Finally, top germ granule interactors were selected by normalizing the enrichment of proteins in the mass spec by the amount of Short Osk (Hurd et al., 2016). This approach identified 119 proteins as highly enriched in the Short Osk IP including all core granule components Vasa, Tud and Aub (Arkov et al., 2006; Voronina et al., 2011) as well as other known granule interactors, Piwi, DCP1 and Cup (Voronina et al., 2011) (Figure 3—source data 1) and 113 novel germ granule constituents (Arkov et al., 2006; Gao and Arkov, 2013; Thomson et al., 2008; Voronina et al., 2011).
- https://doi.org/10.7554/eLife.37949.015
Figure 3—figure supplement 1
Expression of Short Oskar in cell lines reconstitutes nuclear germ granules.
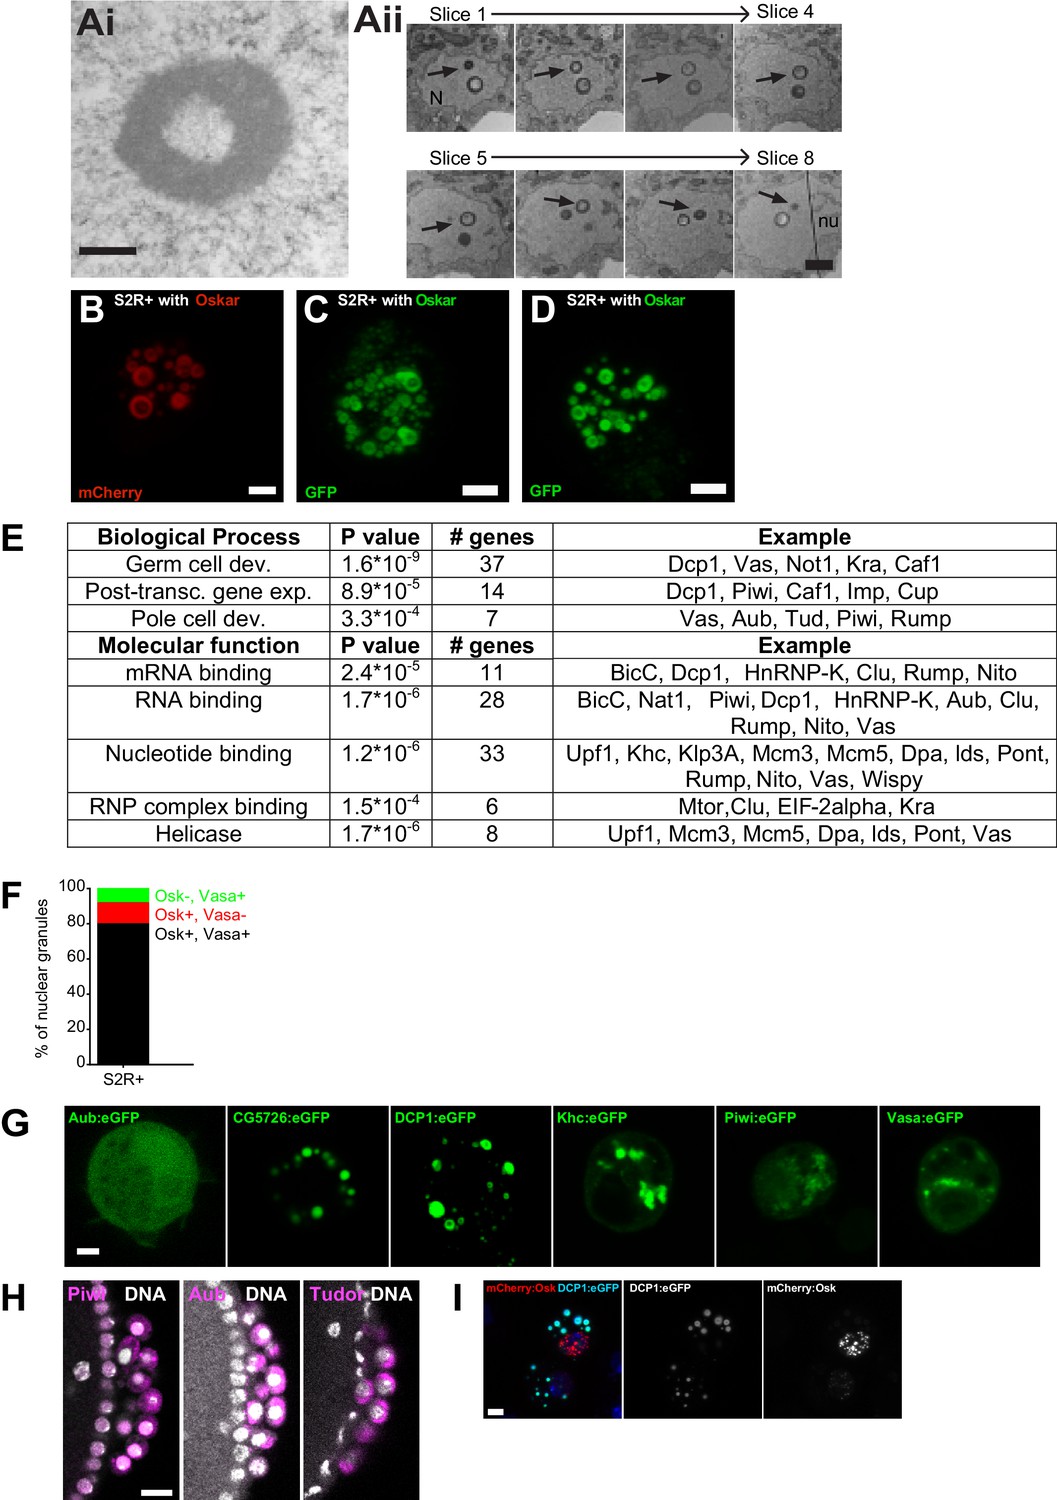
(A) Transmission electron micrograph of a cultured S2R + cell expressing Short mCherry:Osk nuclear germ granules(i). (ii) Serial sections of a single nuclear germ granule (arrows) taken 70 nm apart indicate that an electron dense sphere encapsulates a less electron-dense core. (N) and (nu) label the nucleus and nucleolus, respectively. (B-D) Maximally projected images of S2R+ cells transfected with short-Osk N-terminally tagged with mCherry (B), eGFP (D) or C-terminally-tagged with eGFP (D). (E) GO term analysis of the Short Oskar interactors evaluated against the Drosophila proteome using DAVID. (F) Majority of nuclear germ granules in S2R+ cells are populated by both Oskar and Vasa. 166 granules were analyzed. (G) The nuclear localization signal (NLS) mapper (see Materials and methods) failed to identify an NLS in DCP1 and Khc proteins, while in Aub, CG5726, Piwi and Vasa it identified a weak NLS predicted to distribute Aub, CG5726, Piwi and Vasa equally between the nucleus and the cytoplasm. Consistent with this finding, transfected Aub:GFP, CG5726:GFP, Khc:GFP, Piwi:GFP, or Vasa:GFP alone into S2R+ cells failed to accumulate in the nuclei and induce nuclear granule formation. (H) Piwi:GFP (magenta) is found in the nucleus (left panel) in PGCs while Aub:GFP and Tud:GFP (magenta) are cytoplasmic as previously described. DNA is stained with DAPI (white). (I) GFP-tagged DCP1 (turquoise) forms spherical granules in S2R+ cells reminiscent of those formed by nuclear Oskar (red) in the embryo and in cell lines. DNA is stained with DAPI (blue). Scale bar in Aii is 200 nm, in Ai is 1 μm, in B-D,G,I is 2 μm and in H is 10 μm.
Figure 4 with 5 supplements
Nuclear germ granules in S2R+ cells are phase transitioned condensates.
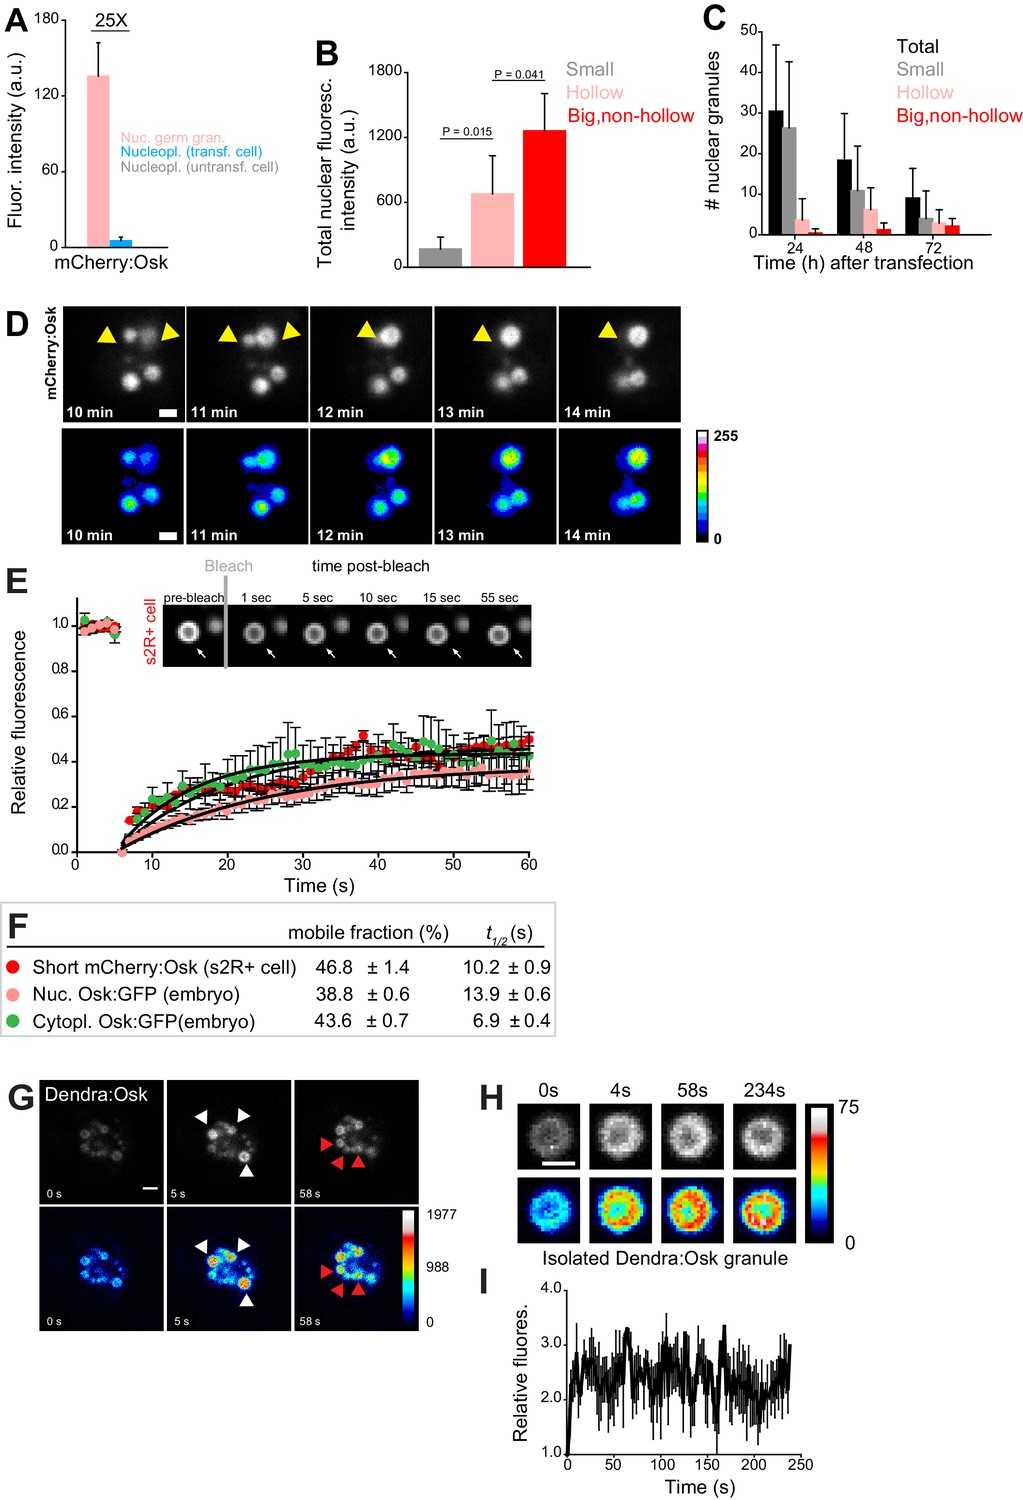
(A) Levels of Short mCherry:Osk fluorescence in nuclear germ granules (pink bar), in the nucleoplasm of transfected (blue bar) and of untransfected (grey bar) cells. 25 fold enrichment of granular vs. nucleoplasmic Short mCherry:Osk fluorescence is shown. For each bar, mean fluorescence levels ± STDEV are shown where 18 granules and 20 ROIs located in the nucleoplasm of transfected and untransfected cells each are shown (statistical significance: two-tailed t-test). (B) Total fluorescence intensity of nuclear Short mCherry:Osk in cells that accumulate small, hollow and big, non-hollow nuclear germ granules (statistical significance: two-tailed t-test). Mean ± STDEV of five (small, hollow) and four (big, non-hollow) nuclei per granule type is shown. (C) Number of nuclear germ granules in S2R+ cells over time. Mean ±STDEV number of the total (black), small (grey), hollow (pink) and big,non-hollow (red) granules per nucleus per time point is shown. Per time point, 20 cells were analyzed. (D) Fusion of Short mCherry:Osk nuclear granules (arrow heads) in S2R+ cells. Pseudo-colored images demonstrate fluctuations of fluorescence intensity. (E,F) FRAP of nuclear Short mCherry:Osk in S2R+ cells (red circles). Mean ±SEM of eight hollow nuclear germ granules is shown. Black line shows the fit to the experimental data. Images in the graph show FRAP recovery of a nuclear granule in S2R+ cell before and after photobleaching. Also shown are FRAP of Osk:GFP located in cytoplasmic germ granules (green circles, Figure 1C) and in nuclear germ granules (pink circles, Figure 2I) with accompanying % mobile fraction and t1/2. (G) Photoconversion of three Short Dendra2:Osk granules (white arrowheads) at t = 5 s demonstrates that Short Osk dynamically exchanges among neighboring nuclear germ granules (red arrowheads) in S2R+ cells. (H) Photoconversion of isolated Short Dendra2:Osk granules one hour after their purification. Raw and pseudo-colored images of a hollow granule are shown before (0 s) and after (4 s-234s) photoconversion. I Fluorescence intensity (mean ± SEM) of three isolated Short Dendra2:Osk granules before (0 s) and after (4 s-234s) photoconversion. Scale bar in all is 2 μm.
Figure 4—figure supplement 1
Nuclear germ granules in S2R+ cells are phase transitioned condensates.
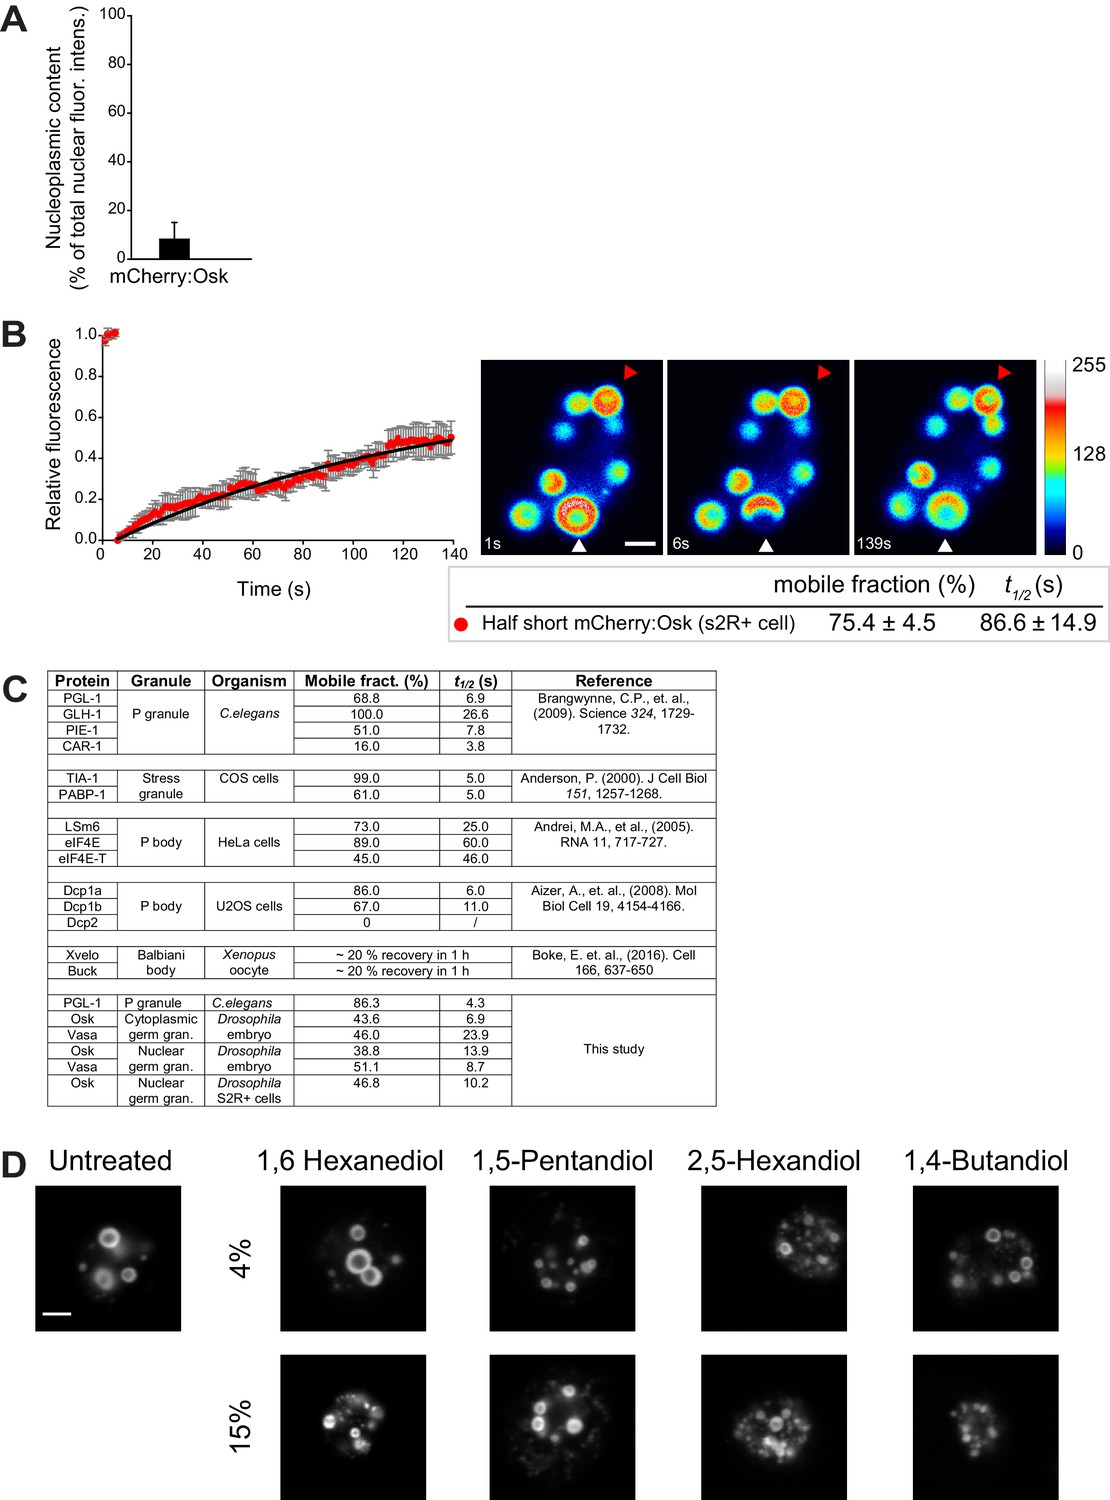
(A) Quantification of total non-granular mCherry:Osk dispersed in the nucleoplasm (nucleoplasmic content) in S2R+ cells. Eight nuclei were quantified and mean ± SEM plotted. (B) Fluorescence recovery of a partially bleached nuclear germ granule formed by mCherry:Osk in S2R+ cells. Pseudo-colored images show fluorescence intensity levels. White arrowhead points at a partially bleached granule. The graph shows recovery of six partially bleached granules (mean ± STDEV). Black line shows fit to the experimental data. Below the images, the % mobile fraction and t1/2 derived from B are shown. Note, the percent mobile fraction is 28.6% higher than recorded when the entire granule is bleached indicating that the granule protein rearranges within the granule as well as with the granule environment. The kinetics of recovery (t1/2), which reports the average rate of protein exchange, is also much slower (86.6 s vs. 10.2 s) suggesting that this recovery is likely comprised of two rates, the rate of internal rearrangement which is likely a very slow process and the rate of exchange of the protein with the granule environment which is a fast process (Figure 4E,F). (C) FRAP kinetics of Oskar and Vasa and proteins condensed in P granules of the one cell zygote in C. elegans (Brangwynne et al., 2009), perinuclear P granules in adult C. elegans (Sheth et al., 2010), mammalian P bodies (Aizer et al., 2008; Andrei et al., 2005), mammalian stress granules(Kedersha et al., 2000) and Balbiani body of Xenopus oocyte (Boke et al., 2016). (D) Cells expressing Short Osk tagged with Dendra2 were exposed to 4% or 15% of an aliphatic alcohol and imaged 20 min later. For comparison, liquid droplets were dissolved at low (4%) concentrations of 1,6 Hexanediol or 1,5-Pentandiol, while high (15%) concentrations of 1,6 Hexanediol or 1,5-Pentandiol were shown to melt hydrogel-like FUS granules (Lin et al., 2016; Xiang et al., 2015). 2,5-Hexandiol and 1,4-Butandiol do not dissolve either of the granules (Kroschwald et al., 2015; Lin et al., 2016; Patel et al., 2007). Scale bar in B and D is 2 μm.
Figure 4—video 1
Fusion of Short mCherry:Osk nuclear germ granules in S2R+ cells.
https://doi.org/10.7554/eLife.37949.018
Figure 4—video 2
Not all Short mCherry:Osk nuclear germ granules fuse in S2R+ cells.
https://doi.org/10.7554/eLife.37949.019
Figure 4—video 3
FRAP of Short mCherry:Osk in nuclear germ granules in S2R+ cells.
https://doi.org/10.7554/eLife.37949.020
Figure 4—video 4
Short Dendra2:Osk nuclear germ granules continuously condense and dissolve in S2R+ cells.
https://doi.org/10.7554/eLife.37949.021
Figure 5 with 1 supplement
Multiple independent Oskar domains synergize to promote granule formation.
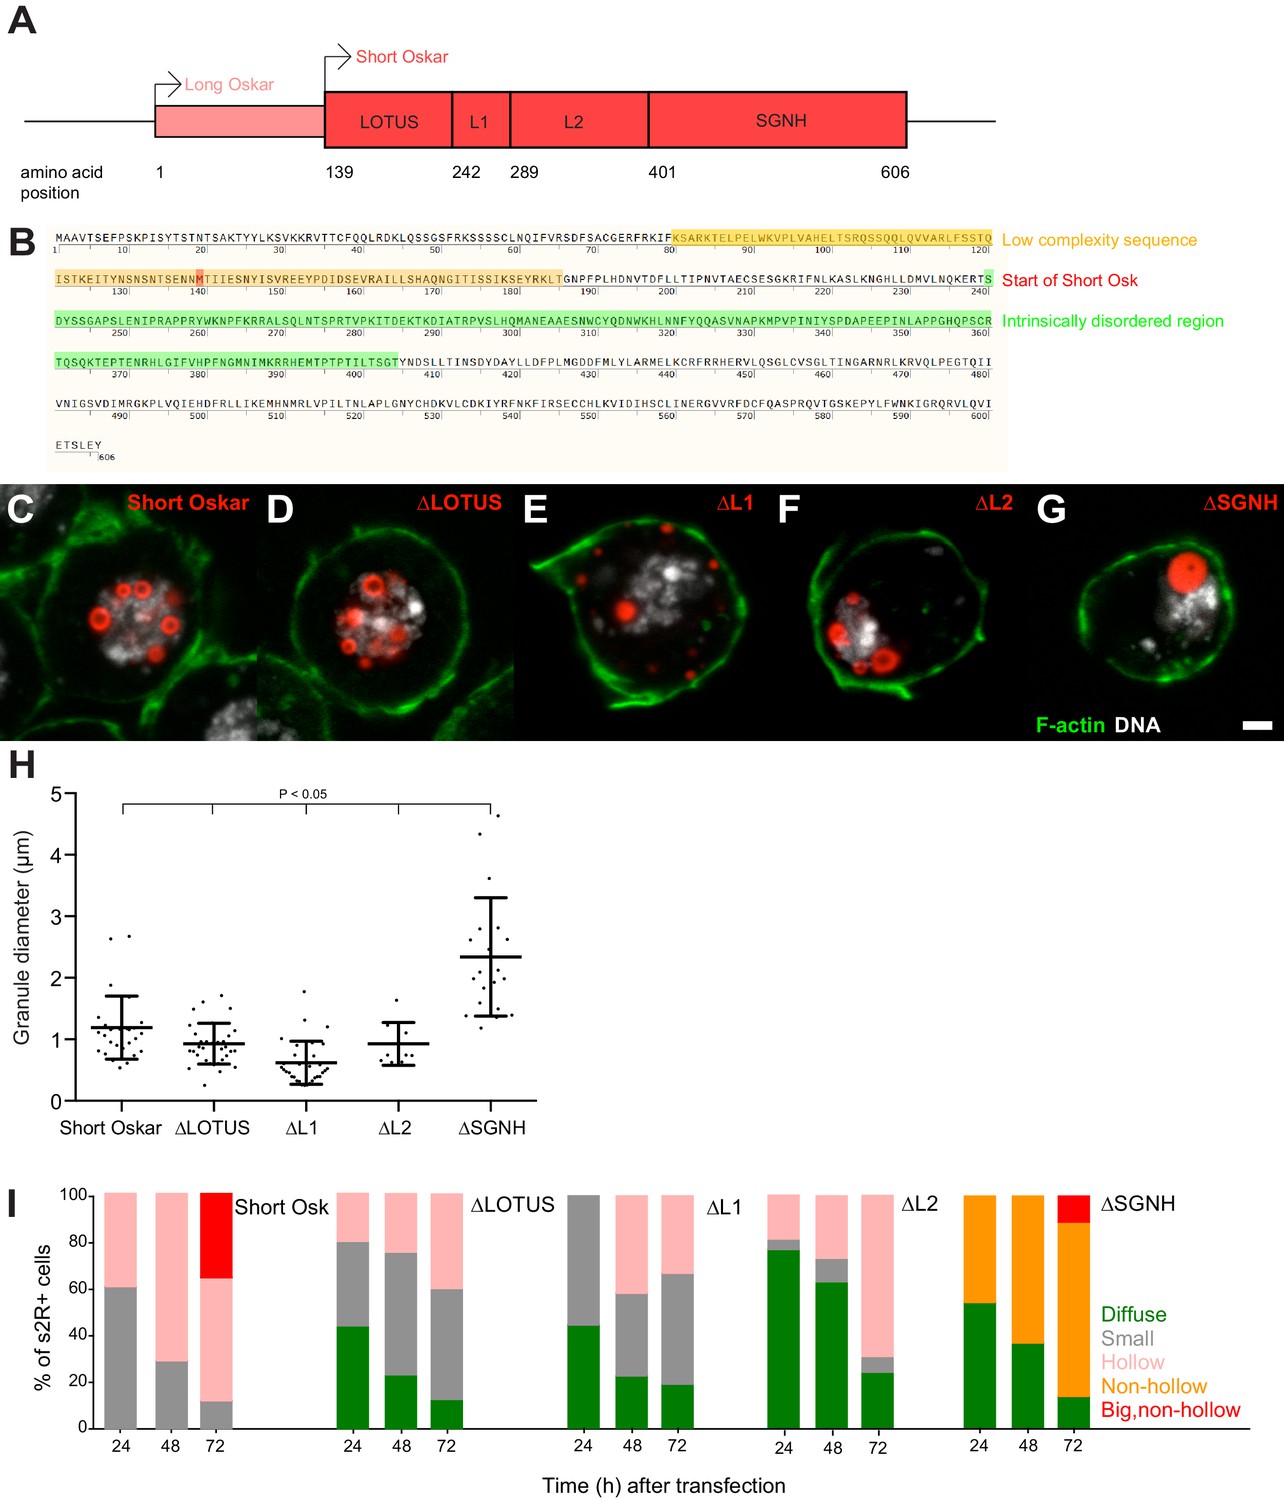
(A) Schematic of Long and Short Osk. (B) Position of a predicted LC (orange) and IDR (green) in Oskar protein. The start aa of Short Osk is demarcated in red. (C-G) Expression of Short Osk:mCherry truncations (red) in S2R+ cells stained with DAPI for DNA (white) and phalloidin for F-actin (green). (H) Quantification of granule size in S2R+ cells transfected with Oskar or its truncations. Mean ± STDEV is plotted for each genotype. The mean diameter of ∆SGNH granules (2.33 μm) is larger (One-way ANOVA, p<0.05) than the diameter of granules formed by full length short Osk (1.19 μm), ∆LOTUS (0.93 μm), ∆L1 (0.62 μm) or ∆L2 (0.93 μm). (I) Condensation of full length Short mCherry:Osk and its truncations over time. Per time point, between 21 and 48 transfected cells per genotype were imaged and afterwards scored for the following phenotype: protein mostly present in a diffused form (green bar) or condensed into small (grey), hollow (pink), non-hollow (orange) and big, non-hollow (red) granules. Scale bar in C is 2 μm.
Figure 5—figure supplement 1
Multiple Short Osk domains synergize to promote granule formation.
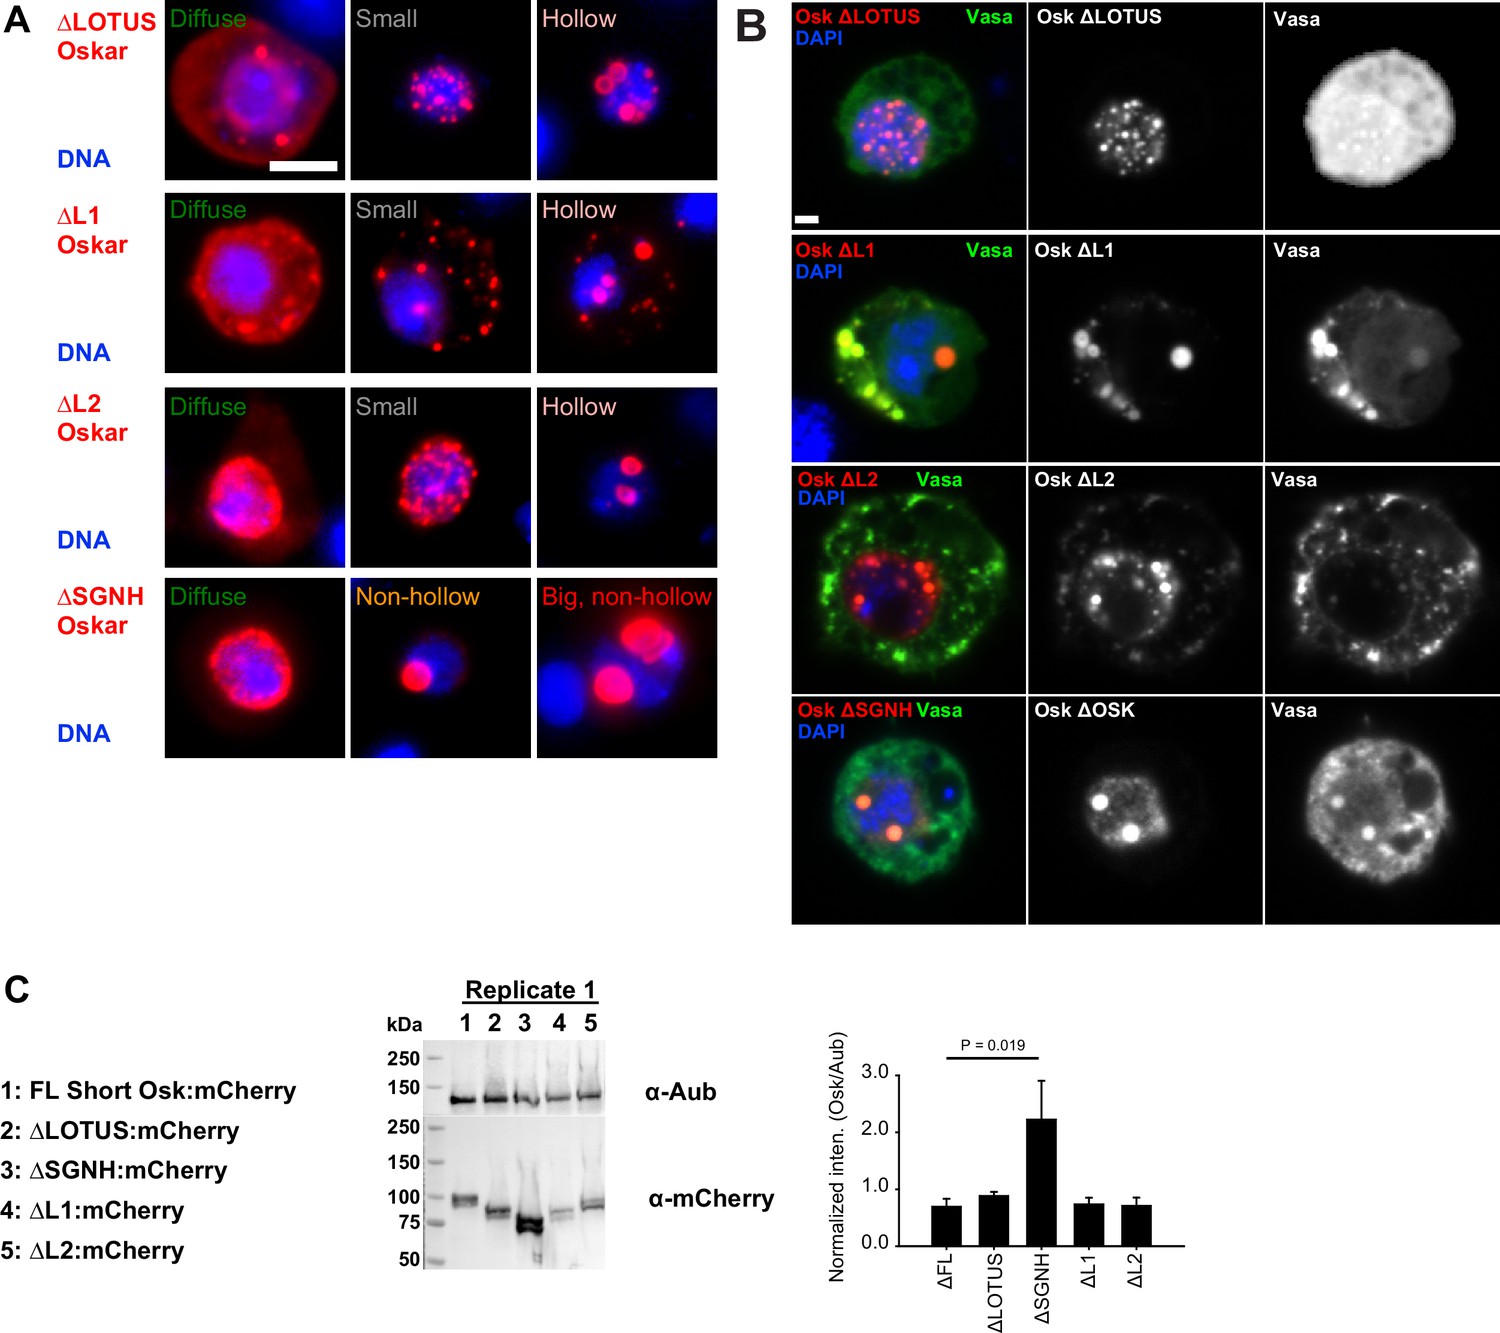
(A) Types of granules observed when S2R+ cells were transfected with different Short mCherry:Osk truncations (red). DNA is stained with DAPI (blue). (B) Co-localization of Vasa:GFP (green) with Oskar truncations (red) in S2R+ cells. DAPI stained DNA is shown in blue. (C) Western blot demonstrating protein expression of mCherry-tagged FL Short Osk (full length) and its truncations in S2R+ cells. Cells were co-transfected with GFP-tagged Aub to normalize Osk protein levels, as demonstrated in the graph. Mean ± STDEV of three biological replicates is shown for all but for ΔL2:mCherry, where mean ± STDEV of two biological replicates is shown. Bar above the graph shows statistical significance (two-tailed t-test). Differences in expression levels of all other Short Osk truncations relative to the FL Short Osk are not statistically significant. Scale bar in A,B is 2 μm.
Figure 6 with 1 supplement
An NLS in Short Oskar controls its import into S2R + cell nuclei (see also Figure 6—figure supplement 1).
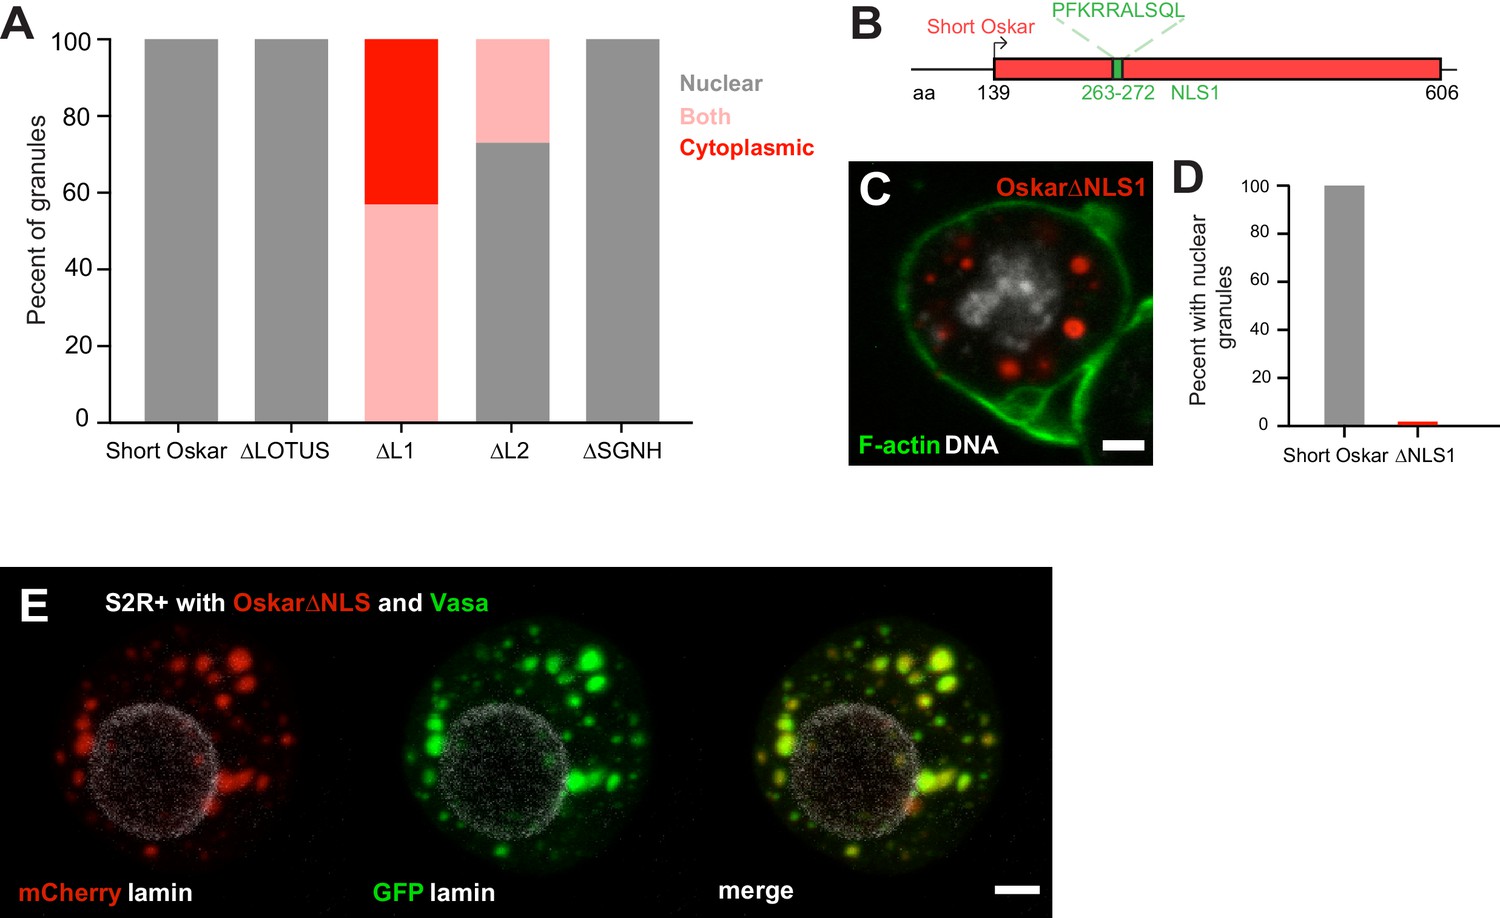
(A) Cellular location of granules formed by transfection of full length short Osk or its truncations (n = 30 cells per genotype). (B) Schematic of NLS1 within L1. (C) Transfection of Oskar∆NLS:mCherry in S2R+ cells (red) co-stained with DAPI (DNA, white) and phalloidin (green). (D) Percent of S2R+ cells with nuclear granules expressing full length mCherry:Osk or Oskar∆NLS:mCherry (n = 30 cells per genotype). (E) Co-transfection of Oskar∆NLS:mCherry (red) with Vasa:GFP (green) and co-stained with nuclear lamin (white). Scale bar in all images is 2 μm.
Figure 6—figure supplement 1
An NLS in Short Oskar controls its import into S2R + cell nuclei.
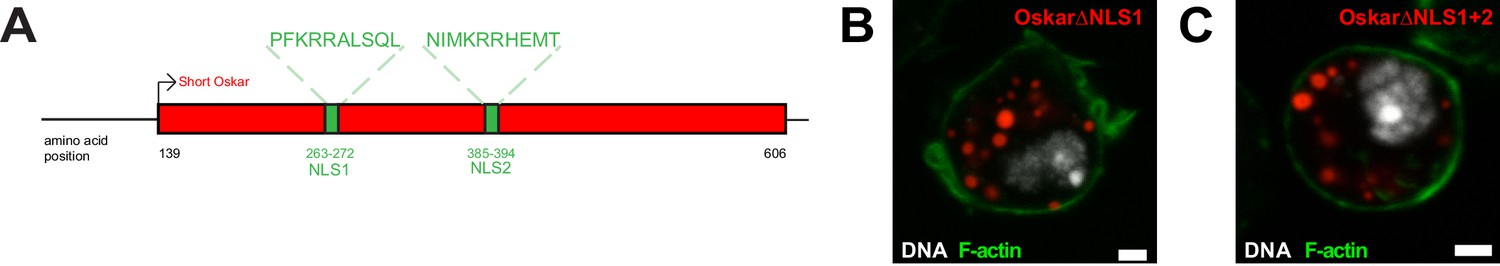
(A) Schematic showing the positions of the two putative NLSs within Oskar’s L1 and L2 regions. (B,C) Accumulation of nuclear germ granules (red) by Short Osk lacking NLS within L1 (NLS1) (B) or NLS1 and NLS within L2 (NLS2) (C). F-actin is stained by phalloidin (green) and DNA (white) with DAPI. Scale bar in B,C is 2 μm.
Figure 7 with 3 supplements
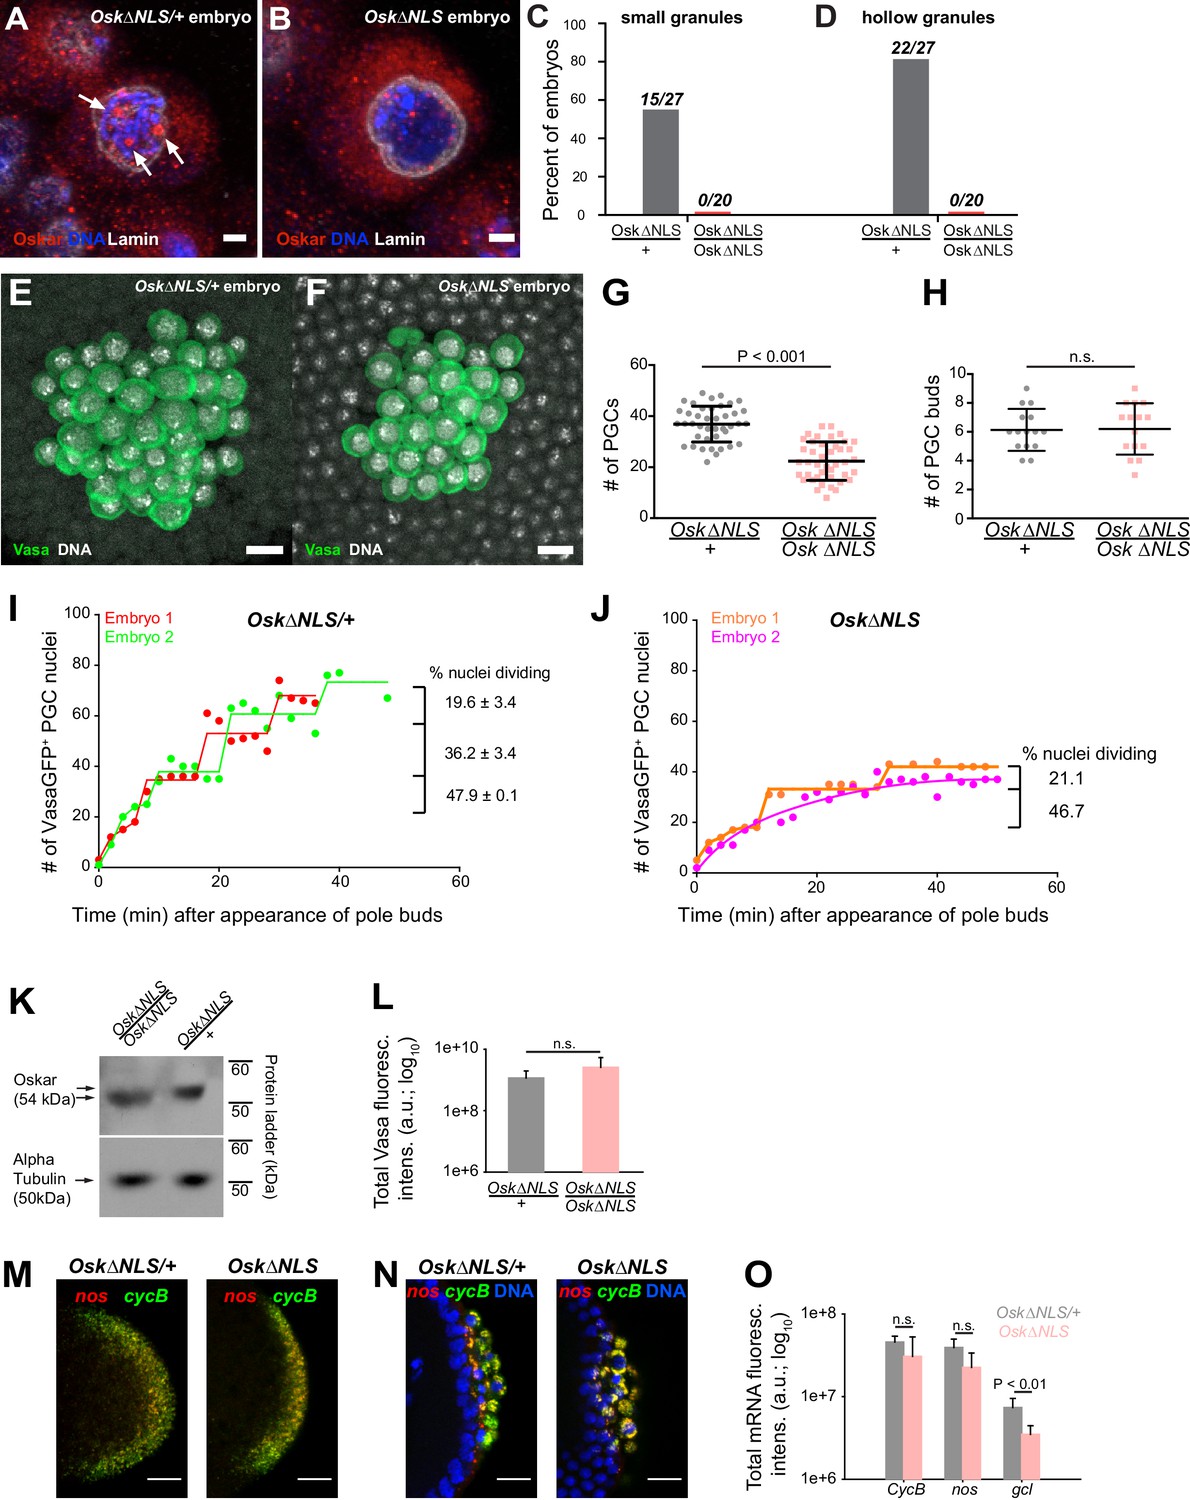
Ablation of nuclear germ granules reduces cell divisions in PGCs.
(A,B) Oskar∆NLS/+ PGCs (A) form nuclear germ granules (white arrows) while Oskar∆NLS PGCs do not (B). Granules were immunostained against Osk (red). DAPI-stained DNA is shown in blue and nuclear lamin is shown in white. (C,D) Number of embryos with small (C) and hollow (D) nuclear germ granules stained with α-Osk in Oskar∆NLS and Oskar∆NLS/+ PGCs. In both the total number of embryos counted is written above the graph bars. (E,F) Cross-section of the posterior pole of an embryo with Oskar∆NLS/+ (A) and Oskar∆NLS (B) maternal genotype immunostained against Vasa (green) and DAPI (white). G Number of PGCs in 41 Oskar∆NLS/+ and 42 Oskar∆NLS embryos. Mean ± STDEV is plotted (statistical significance: unpaired t-test, p<0.001). (H) PGC buds in 15 Oskar∆NLS/+ and 14 Oskar∆NLS embryos. Mean ± STDEV is plotted (statistical significance: unpaired t-test). (I,J) Quantification of PGC divisions in live Oskar∆NLS/+ (I) and Oskar∆NLS (J) embryos. The emergence of the first PGC bud represented time 0 and the cellularization of somatic nuclei at NC 14 represented the end of the experiment. The number of Vasa:GFP associated HiS2Av:mRFP-stained nuclei was counted in three dimensions at every time point (red, green, orange and violet circles). Lines represent an estimated progression among successive cell divisions. Percent of dividing Vasa:GFP +nuclei is marked on each graph (Figure 7—video 1 and 2). Note, that in live observation, the total number of PGCs was higher than in fixed embryos (compare G with I and J). We attribute this to the fact that we counted all nuclei with even a small amount of Vasa:GFP associated, which may not have cellularized and become PGCs and thus would not have been counted as PGCs in fixed tissue. (K) Western blot of Oskar protein in Oskar∆NLS and Oskar∆NLS/+ embryos. α-tubulin was used for normalization control. L Total amount of Vasa germ plasm fluorescence in Oskar∆NLS and Oskar∆NLS/+ embryos marked with an antibody against Vasa. Mean total fluorescent levels ± STDEV of eight (Oskar∆NLS/+) and 13 (Oskar∆NLS) embryos per genotype are shown (statistical significance: two-tailed t-test). (M,N) Early embryos (M) and late embryos (N) hybridized with nos (red) and CycB (green) smFISH probes. DAPI-stained nuclei are shown in blue. O Quantification of localized mRNA levels hybridized with CycB, nos and gcl smFISH probes. Mean total fluorescent levels ± STDEV of four CycB and nos-stained embryos per genotype are shown and mean total fluorescent levels ± STDEV of four (Oskar∆NLS/+) and five (Oskar∆NLS) gcl-stained embryos are shown (statistical significance: two-tailed t-test). Scale bar in A,B is 2 μm and in E,F,M,N is 10 μm.
Figure 7—figure supplement 1
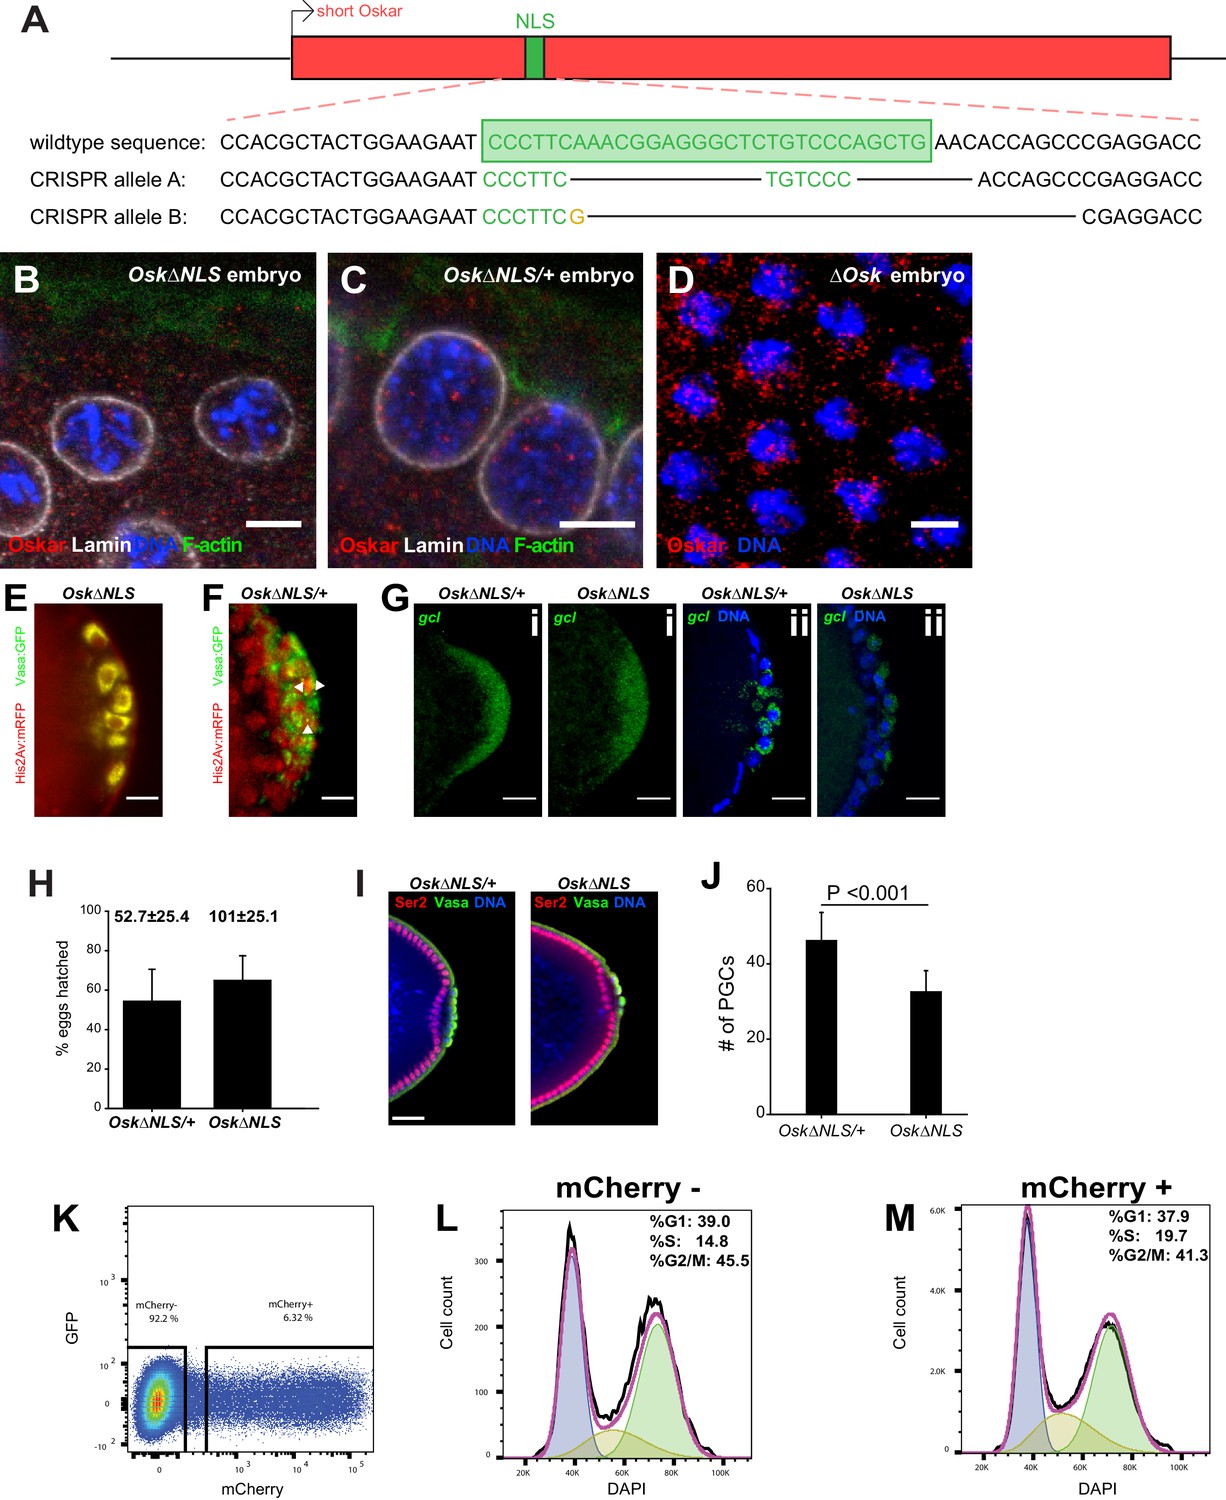
Ablation of nuclear germ granules reduces cell divisions in PGCs.
(A) Alleles containing deletions of the Osk NLS1 created by separate CRISPR/Cas9. (B-D) Antibody against Oskar (red) non-specifically stains background in Drosophila embryos. Somatic nuclei of embryos laid by homozygous Osk∆NLS mothers (B), their heterozygous siblings (C) or laid by mothers that do not express Oskar (∆Osk: osk54/Df(3R)Pxt103), D) all contain small red speckles when stained with anti-Oskar antibody, which most likely respond to unspecific binding of the polyclonal Osk antibody used. Nuclear lamin is shown in white, F-actin in green and DAPI in blue. (E, F) Oskar∆NLS PGCs do not form Vasa:GFP-labeled nuclear germ granules (E) while Oskar∆NLS/+PGCs do (white arrows) (F). (G) Early (i) and late (ii) Oskar∆NLS/+ and Oskar∆NLS embryos hybridized with gcl (red) smFISH probes and stained with DAPI (blue) to label the nuclei. (H) Embryo hatch rate. Numbers above the bars represent an average number of eggs counted per plate ± STDEV (n = 3). I Nuclei of the Oskar∆NLS and Oskar∆NLS/+ PGCs are transcriptionally silent, while their surrounding somatic nuclei are not. Transcriptionally active RNA polymerase II is detected with an antibody that detects phosphorylated Ser2 residue in the C-terminal Repeat Domain (CTD) of PolII (red), Vasa antibody (green) marked PGCs and DAPI (blue) stained the nuclei. J Oskar∆NLS embryos over-expressing gcl mRNA (P(EP)/mat-α gal4; Oskar∆NLS) do not accumulate WT (P(EP)/mat-α gal4; Oskar∆NLS/+) levels of PGCs. Mean ± STDEV of the number of PGCs per embryo are shown where eight embryos per genotype were quantified (statistical significance: two-tailed t-test). Note that over-expression of gcl increases the number of PGCs in both genotypes relative to WT embryos (Figure 7G), as anticipated(Jongens et al., 1994), yet Oskar∆NLS mutant embryos still produce 29% fewer PGCs compared to Oskar∆NLS/+ siblings. (K-M) S2R+ cells transfected with Short mCherry:Osk divide like untransfected S2R+ cells. Transfected and DAPI-stained cells were sorted as mCherry+ (6.32% of total cells) and mCherry- cells (92.2% of total cells) (K). Binning of cells into G1, S and G2/M cell cycle phases revealed that mCherry- (L) and mCherry+ (M) cells cycled with similar rates. Scale bar in B-D is 5 μm and in E-G,I is 10 μm.
Figure 7—video 1
PGC division in live Oskar∆NLS/+ embryos.
https://doi.org/10.7554/eLife.37949.028
Figure 7—video 2
PGC division in live Oskar∆NLS/Oskar∆NLS embryos.
https://doi.org/10.7554/eLife.37949.029Tables
Key resources table
| Reagent type (species) or resource | Designation | Source or reference | Identifiers | Additional information |
|---|---|---|---|---|
| Antibody | Rabbit Poly(mono)clonal α-Oskar | A. Ephrussi | N/A | 1:1000 or 1:2500 (see Materials and methods) |
| Antibody | Rabbit polyclonal α-Vasa | R. Lehmann | N/A | 1:1000 |
| Antibody | Mouse monoclonal α-Lamin | Developmental Studies Hybridoma Bank | ADL84.12 | 1:1000 |
| Antibody | Alexa Fluor 488 Phalloidin | Molecular Probes | A12379 | 1:500 |
| Antibody | Rabbit polyclonal α-mCherry | Abcam | Ab167453 | 1:1000 |
| Antibody | Goat α-rabbit HRP | Abcam | Ab6721 | 1:2000 |
| Antibody | Goat α-rabbit horse HRP | Jackson ImmunoResearch | 111-035-003 | 1:5000 |
| Antibody | Mouse α -mouse HRP | Rockland | 18-8817-31 | 1:5000 |
| Antibody | Mouse monoclonal α-alpha tubulin | Sigma-Aldrich | T9026-2ML | 1:10000 |
| Antibody | Rabbit α-Aubergine | R. Lehmann | N/A | 1:1000 |
| Antibody | Rabbit α-Ser2 | Abcam | Ab5095 | 1:750 |
| Chemical | Vectashield Antifade Mounting medium | Vector Labs | Cat# H-1200 | |
| Chemical | Prolong Diamond Mounting medium | Molecular Probes | Cat# P36961 | |
| Chemical | Deionized formamide | Life Technologies | Cat# 4311320 | |
| Chemical | 10% Fetal Bovine Serum | Invitrogen | Cat#10082-139 | |
| Chemical | Penicillin-streptomycin | Fisher | Cat# 15140122 | |
| Chemical | Poly-L-lysine solution | Sigma | Cat# P4707-50ml | |
| Chemical | 20% Paraformaldehyde | Electron Microscopy Sciences | Cat#15713 | |
| Chemical | BSA | Sigma | Cat#A4503-100G | |
| Chemical | Restore Western Blot Stripping Buffer | Fisher Scientific | Cat# PI21059 | |
| Chemical | Triton X-100 | Sigma-Aldrich | Cat# T8787-250ML | |
| Chemical | 1,6 Hexanediol | Sigma-Aldrich | Cat#240117-50G | |
| Commercial assay | NuPAGE Novex 4-12% Bis-Tris Gel 1.0mm, 10 well | Invitrogen | Cat# NP0321BOX | |
| Commercial assay | Immun-Blot PVDF Membrane | Bio-Rad | Cat# 162-0174 | |
| Commercial assay | Imaging membranes | YSI | Standard | |
| Commercial assay | Effectine Transfection reagent | Qiagen | Cat# 301427 | |
| Commercial assay | Gibson Assembly Master Mix | New England BioLabs | Cat#E2611L | |
| Commercial assay | Nunc Lab-Tek II Chambered Coverglass | Thermo Fisher Scientific | Cat# 155409PK | |
| Cell line | D. melanogaster S2R+ | Drosophila Genomics Resource Center | FlyBase: FBtc0000150 | |
| Cell line | Human:HEK293T | ATCC | 293T (ATCCCRL3216TM) | |
| Organisms/Strains | Wild-type:w-1118 | Bloomington (BDSC) | Stock #3605 | |
| Organisms/Strains | y,w; P[E GFP-vas w+]cyIII | (Trcek et al., 2015) | N/A | |
| Organisms/Strains | UAS–vasa–ko | (Cinalli and Lehmann, 2013; Trcek et al., 2015 ) | N/A | |
| Organisms/Strains | pFlyFos-Osk/CyO | (Jambor et al., 2015; Trcek et al., 2015) | N/A | |
| Organisms/Strains | UASp-GFP-Aub | (Webster et al., 2015) | N/A | |
| Organisms/Strains | GFP-Piwi | (Le Thomas et al., 2013) | N/A | |
| Organisms/Strains | GFP-Tud | R. Lehmann | N/A | |
| Organisms/Strains | ;;P{GAL4::VP16-nos.UTR}/Tm3Ser | R. Lehmann | N/A | |
| Organisms/Strains | w[*]; P{w[+mC]=His2Av-mRFP1}II.2 | Bloomington (BDSC) | Stock #23651 | |
| Organisms/Strains | w;;OskΔNLS-alleleA/TM3 | This study | N/A | See Materials and methods |
| Organisms/Strains | w;;OskΔNLS-alleleB/TM3 | This study | N/A | See Materials and methods |
| Organisms/Strains | w;His2AAv-mRFP/cyo;OskΔNLS-alleleA,Vasa:GFP/TM3 | This study | N/A | See Materials and methods |
| Organisms/Strains | w; matα-gal4;PrDr/TM3 | (Pae et al., 2017) | N/A | |
| Organisms/Strains | Df(3R)Pxt103/TM3 Ser Sb | (Lehmann and Nüsslein-Volhard, 1991) | N/A | |
| Organisms/Strains | osk54 st ry ss/TM3Ser | (Lehmann and Nüsslein-Volhard, 1991) | N/A | |
| Organisms/Strains | w; P(EPgy2)gclEY09611/Cyo; nosGal4VP16 (w+)/TM3 | (Cinalli and Lehmann, 2013) | N/A | |
| Organisms/Strains | FT553: zuIs247 [nmy-2::PGL-1-GFP line O05-2]; unc-119(ed3) III; ltIs44 V [pie-1p-mCherry::PH(PLC1delta1)] | J. Nance | N/A | |
| Oligonucleotides | Osk nls gRNA-A | This study | N/A | See Materials and methods |
| Oligonucleotides | Osk nls gRNA-B | This study | N/A | See Materials and methods |
| Oligonucleotides | ssODN for gcl-NLS-A | This study | N/A | See Materials and methods |
| Oligonucleotides | ssODN for gcl-NLS-B | This study | N/A | See Materials and methods |
| Oligonucleotides | Calca Fluor 590-conjugated nanos smFISH probes | (Trcek et al., 2015) | N/A | |
| Oligonucleotides | Quasar 670-conjugated gcl smFISH probes | (Trcek et al., 2017) | N/A | |
| Oligonucleotides | Quasar 670-conjugated cycB smFISH probes (5′→3′): cgttttgttgttgcctccat, tatgccgcgattctgcaaat,tctttctgtgccgcatcctt, tctgtgagcttgagatcctt, tccacccgagctttggcatt, agtggctgtttcttccagtg, ttgccattgccattggtgct,aattcgaacgcaaaaacgcc, tacagtggtcttggtcggaa,tgactgtaactttagtgggt, ttcacgttctcggaagaact,ttgctgtcctcgcgctttaa, agtttggtcagcgacttctt,attcctgaaactcccatcac, aaacagctactggttcccgt,ttcttggtctctgcctcttt, cttcttggtttctggcagtt,cctttttcacttccagtgag, tgcactgttgcccctaataa, atcgtagatgtggtcgtagt,ttgctggaaagggacatggt, atcaatgtcctcgattccag,accaggttctccttgtcatt, cgtttacatattcggagacc, cctgatacaagtagtcgtag, atccttgtgaatgggctgct,atcttgtgggacacctcctt, ttgatccaatcgatcagcac,atggaactgcaggtggactt, tagcgatcaatgatagccac, tttggtgtccttgaccacct, actcccaccaattgcaagta,acttggtggctatgaagagt, aagacgaaatctccgattgc,agtgtaggtgtcgtccgtga, agatttgcagctccatctgt,agattacagtcgatggcctt, tagcgtcgaaggaagtgaat,ttggacatcgtatggtgctc, ggaagctaactcgatgaagt,taagtggccatttcgtagtc, aacagtgaggcagctgcaat,tttccattgagcaagtgcag, acggtcgttgaatcctgtac,atcgcgagtagaaggtcaga, ttcgcgatcagccgggtaat,ttgtagatggccttcagctt, atcttctggaacttgctgcc | This study | N/A | See Materials and methods |
| Recombinant DNA | pActin5C | Drosophila Genomics Resource Center | Cat#1112 | |
| Recombinant DNA | pVERMILION22 | (Ni et al., 2011) | N/A | |
| Recombinant DNA | pEF1/V5-His A | ThermoFisher Scientific | V92020 | |
| Recombinant DNA | pDendra2 | Addgene | Cat#75283 | |
| Software and Algorithms | ImageJ | NIH | https://imagej.nih.gov/ij/ | |
| Software and Algorithms | NLS finder | cNLS Mapper | http://nls-mapper.iab.keio.ac.jp/cgi-bin/NLS_Mapper_form.cgi | |
| Software and Algorithms | IDR and LC prediction | SEG IUPRED JPRED | http://mendel.imp.ac.at/METHODS/seg.server.html http://iupred.enzim.hu/ http://www.compbio.dundee.ac.uk/jpred/ | |
| Software and Algorithms | EasyFRAP | (Rapsomaniki et al., 2012) | N/A | |
| Software and Algorithms | Huygens deconvolution software | Scientific Volume Imaging | N/A | |
| Software and Algorithms | Prism 7 | Graphpad | N/A | |
| Software and Algorithms | SigmaPlot | SigmaPlot (Systat Software, Inc) | N/A | |
| Software and Algorithms | CRISPR design for guide RNAs | MIT | http://crispr.mit.edu/ | |
| Software and Algorithms | CRISPR design for guide RNAs | ZiFit | http://zifit.partners.org/ZiFiT/ | |
| Software and Algorithms | DAVID GO term analysis | The Database for Annotation, Visualization andIntegrated Discovery (DAVID) version 6.7. | https://david.ncifcrf.gov/ |
Additional files
-
Transparent reporting form
- https://doi.org/10.7554/eLife.37949.030
Download links
A two-part list of links to download the article, or parts of the article, in various formats.
Downloads (link to download the article as PDF)
Open citations (links to open the citations from this article in various online reference manager services)
Cite this article (links to download the citations from this article in formats compatible with various reference manager tools)
Phase transitioned nuclear Oskar promotes cell division of Drosophila primordial germ cells
eLife 7:e37949.
https://doi.org/10.7554/eLife.37949


