Effects of microcompartmentation on flux distribution and metabolic pools in Chlamydomonas reinhardtii chloroplasts
- Max Planck Institute of Molecular Plant Physiology, Germany
- University of Potsdam, Germany
- Carnegie Institution for Science, United States
- University of Bayreuth, Germany
- Heinrich-Heine University, Germany
Figures
Figure 1
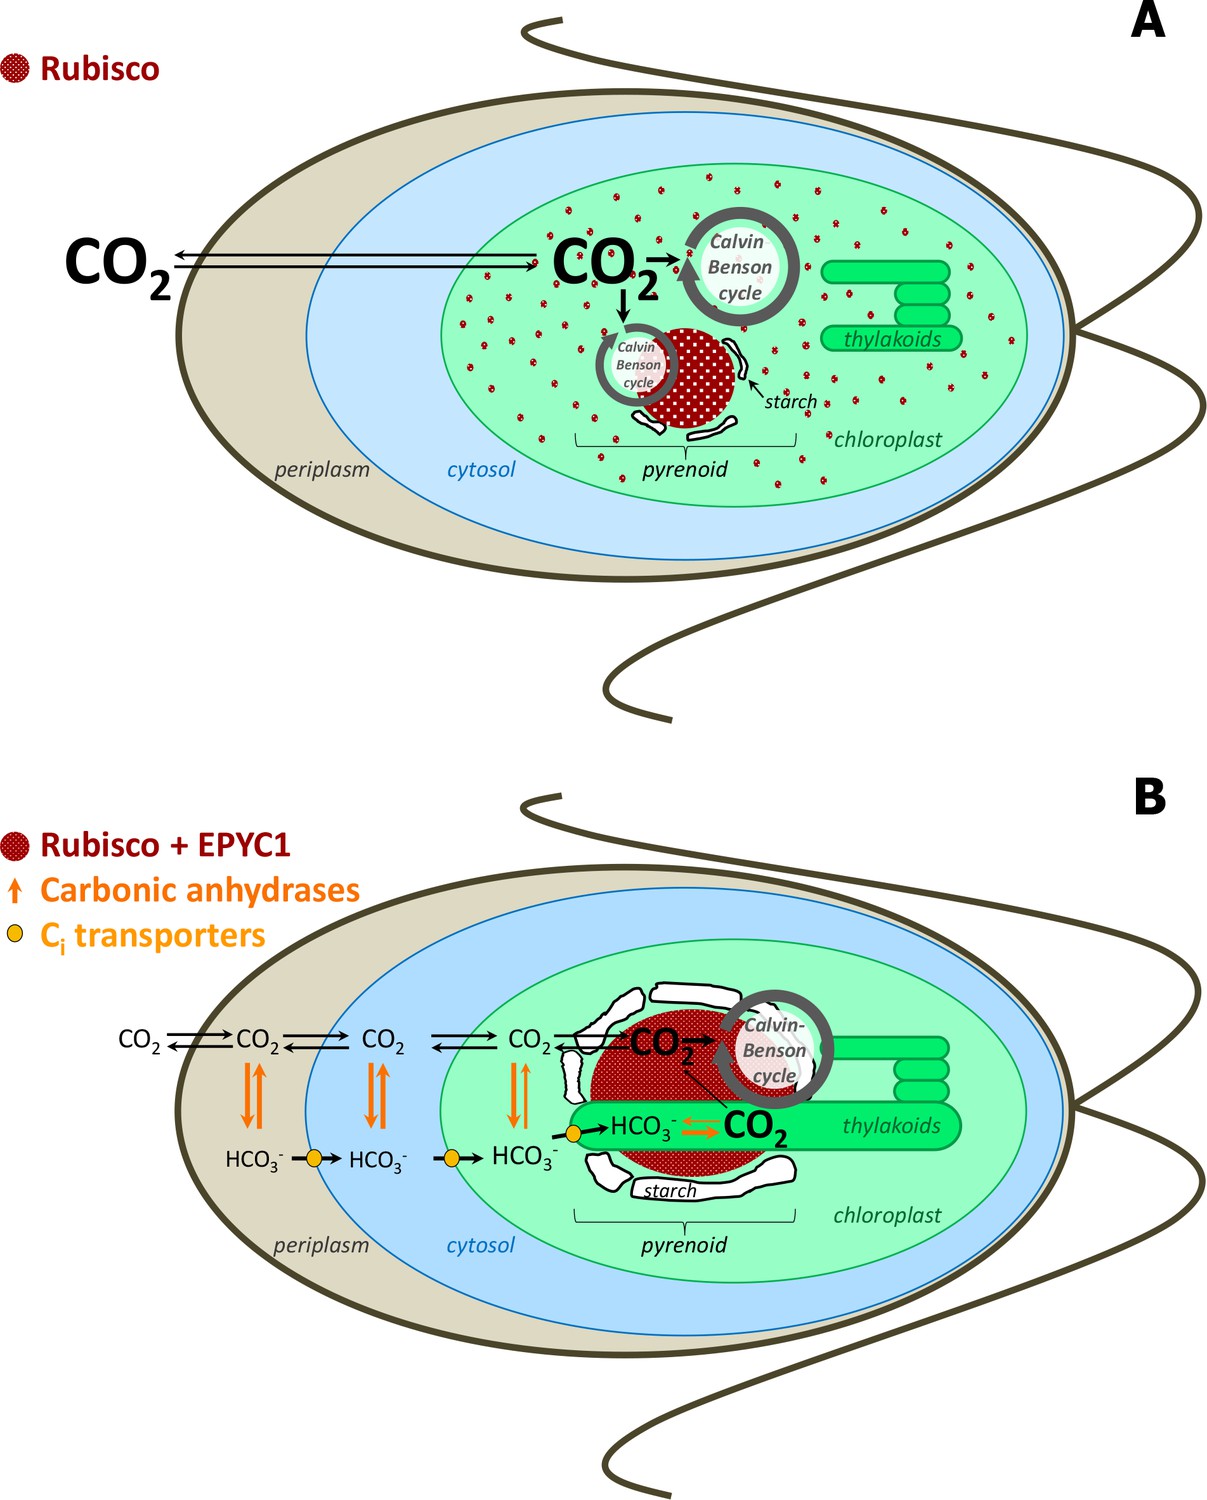
Simplified scheme of CBC cycle with and without carbon-concentrating mechanism (CCM) in Chlamydomonas reinhardtii.
Under high CO2 conditions, no CCM is established (A). After exposure to ambient CO2, CCM is induced (B). As most of Rubisco and the other CBC enzymes are in the stroma under high CO2, most CBC flux is in the stroma (big grey circle in the stroma) and only partly involves the pyrenoid (smaller grey circle) (A). As most of Rubisco is inside the pyrenoid under ambient CO2, the CBC requires movement of selected metabolites between the stroma and pyrenoid (big grey circle) (B). To find out the exact differences of flux distribution between stroma and pyrenoid under these two conditions and how metabolites are exchanged between the two microcompartments were the aims of this study. Scheme adapted and simplified from Borkhsenious et al. (1998), Moroney et al. (2011), Wang et al. (2011), Engel et al. (2015) and Mackinder et al. (2016).
Figure 2 with 1 supplement
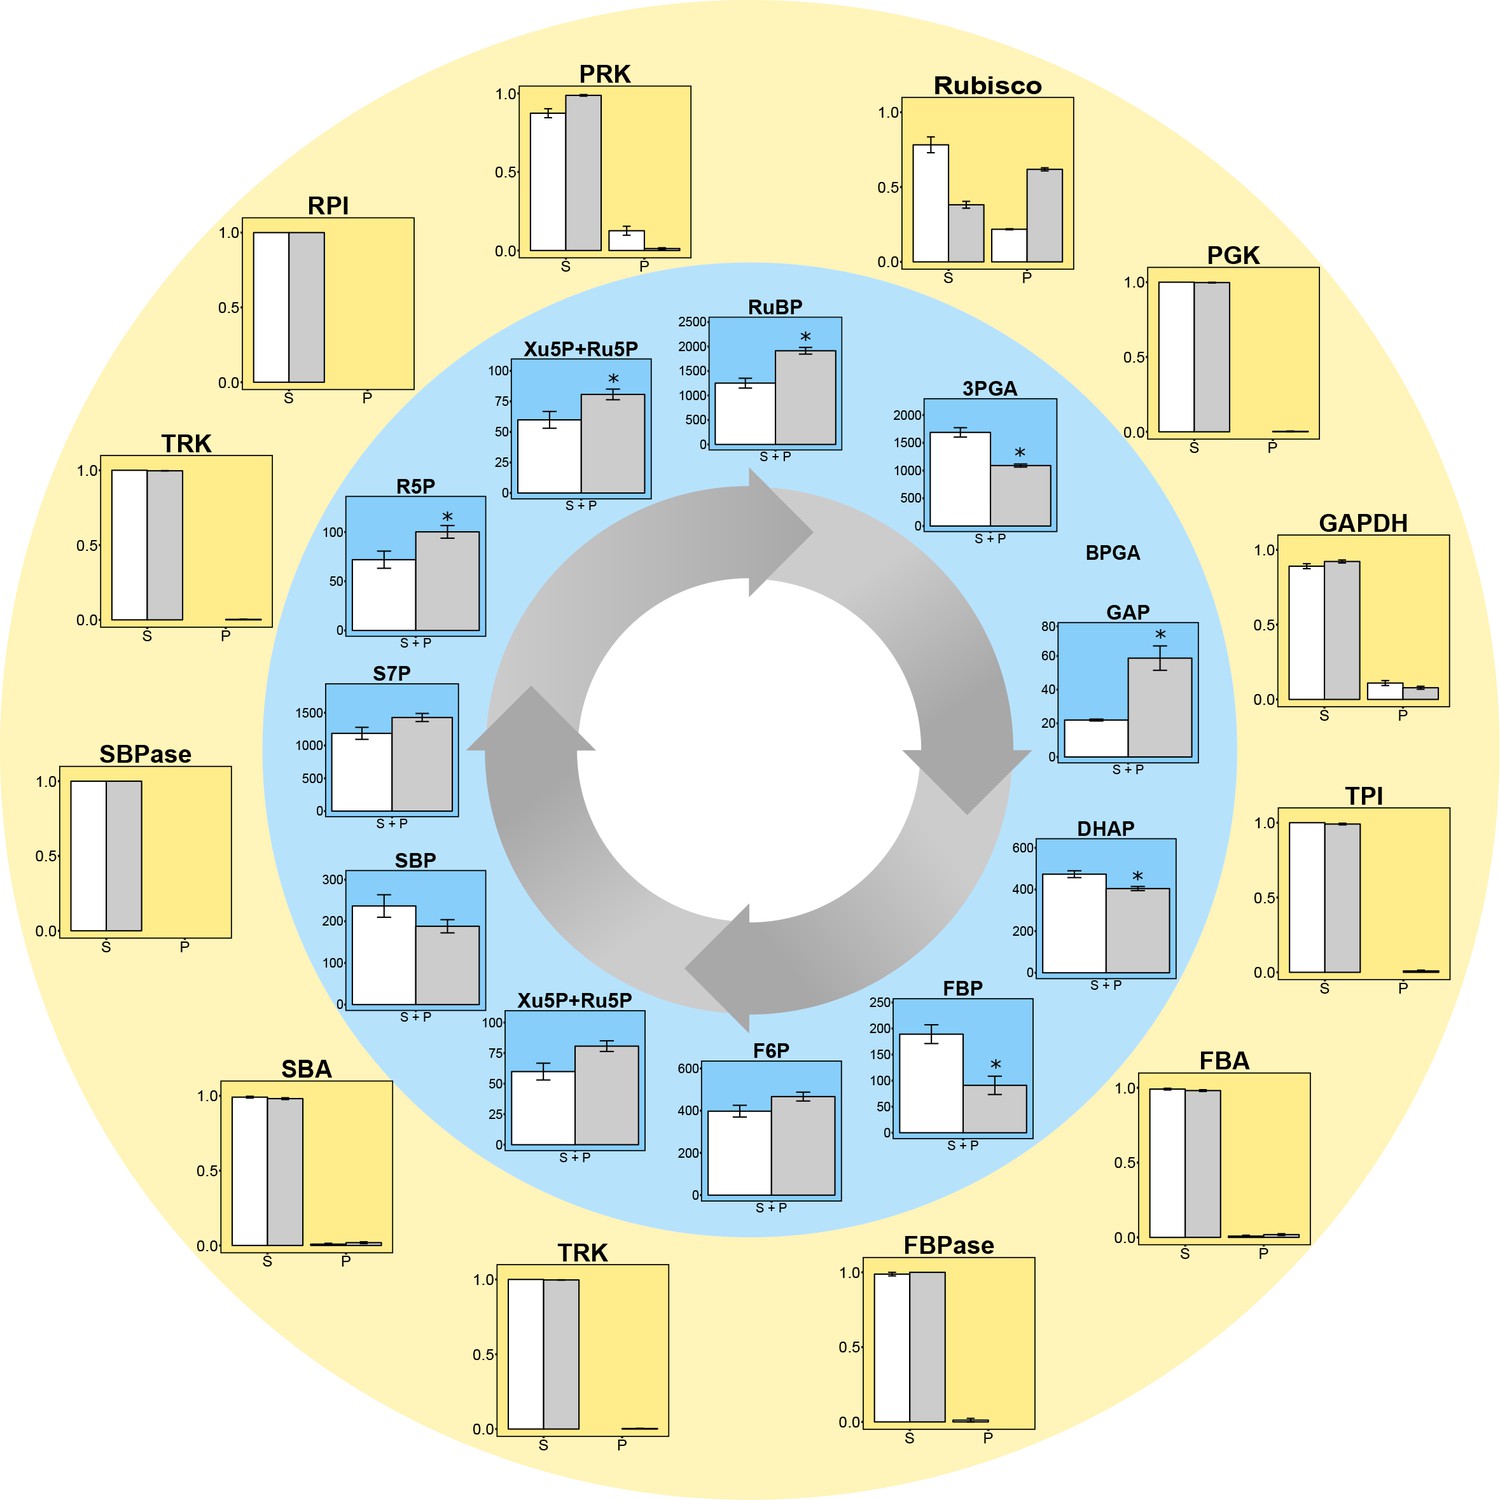
Experimental data for protein distributions (outer yellow circle) and metabolite concentrations (inner blue circle) in CCM-supressed (white bars, HC) and CCM-induced (grey bars, LC for proteins and LC* for metabolites) conditions.
Chlamydomonas reinhardtii CC1690 cells were grown under high CO2 (HC for proteins and metabolites; white bars), ambient CO2 (LC for proteins; grey bars) and ambient CO2 bubbled for 15 min with high CO2 (LC* for metabolites; grey bars). Enzyme distribution between a pyrenoid-enriched fraction (P) and a stroma-enriched fraction (S) was determined by enzyme activity measurements (Rubisco; n = 4 ± SE) and shotgun proteomics (all other proteins; n = 4 ± SE). Metabolites of the Calvin-Benson cycle (CBC) in total cells were measured by HPLC-MS/MS. The metabolite concentrations were normalized to the chloroplast volume as described in the text and Supplementary file 1D, and given as absolute concentrations (µM) in the chloroplast, which includes both microcompartments, the stroma and the pyrenoid (S + P) (n = 4 ± SE). Student´s t-test (alpha = 0.05), significantly changed metabolites are marked with one asterisk.
Figure 2—figure supplement 1
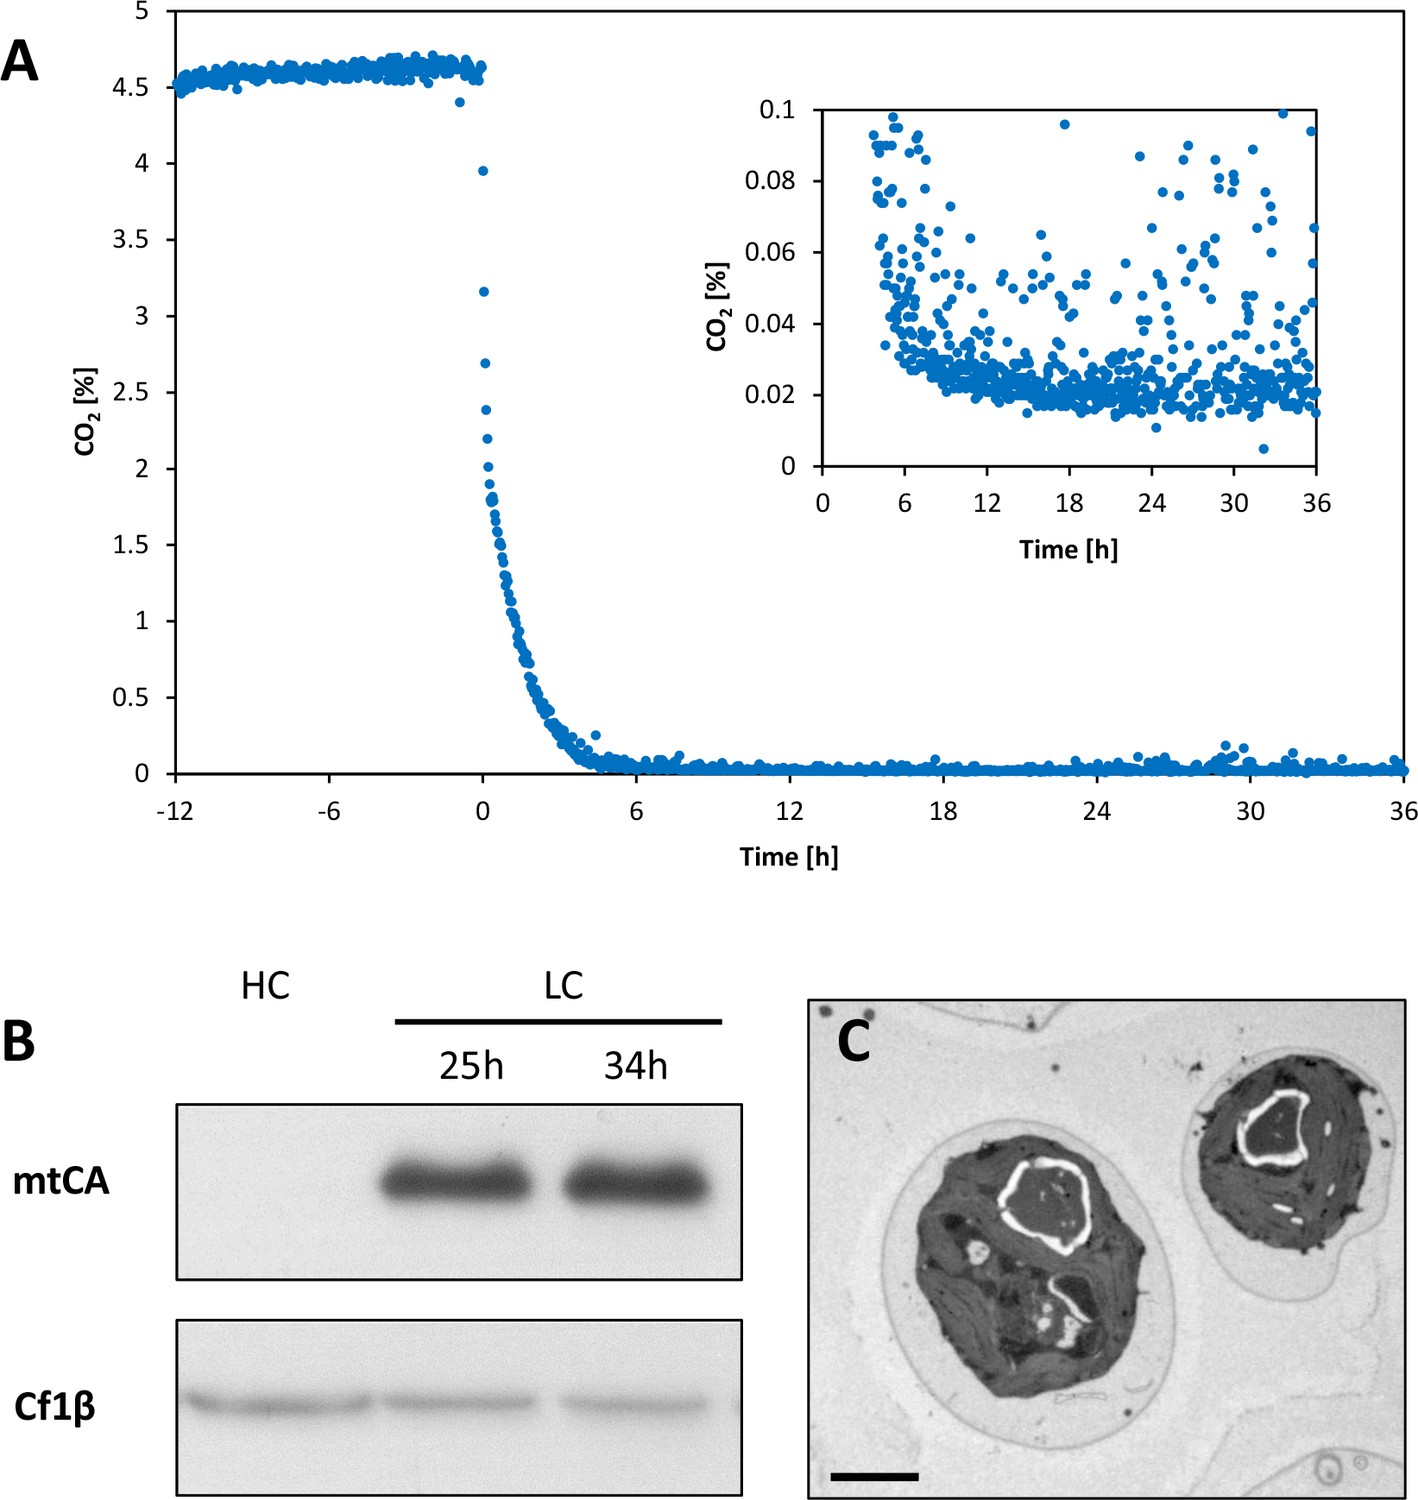
Induction of carbon concentrating mechanism (CCM).
Chlamydomonas reinhardtii CC1690 were grown at 46 μmol photons*m−2*s−1, 24°C and bubbled with 5% CO2 (HC) for two days at constant turbidity in a bioreactor. CO2 in the outlet air of the bioreactor was measured continuously during a 48 hr run (A). From time point zero onwards the culture was aerated with ambient air (0.039% CO2). The inserted graph shows the same CO2 data at lower CO2 concentrations. Cultures were harvested before (HC) and 25 and 34 hr (LC) after low-CO2 exposure for Western blot analysis (B). Protein amounts equivalent to 1 μg chlorophyll were loaded per lane and separated by 12% SDS-PAGE before transferred to a nitrocellulose membrane for detection via chemilumminescence by an antiserum recognizing mtCA (AgriSera Cat# AS11 1737, RRID:AB_10752086). Loading control: CF1β, β-subunit of the CF1-component of CF1FO-ATP synthase AgriSera Cat# AS10 1590, RRID:AB_10754669). Transmission electron microscopy (TEM) of cells exposed for 30 hr to low CO2 and 15 min to high CO2 (LC*; C). Cells were then quenched in the light for metabolite analysis by LC-MS/MS. Measure bar = 2 μm.
Figure 3
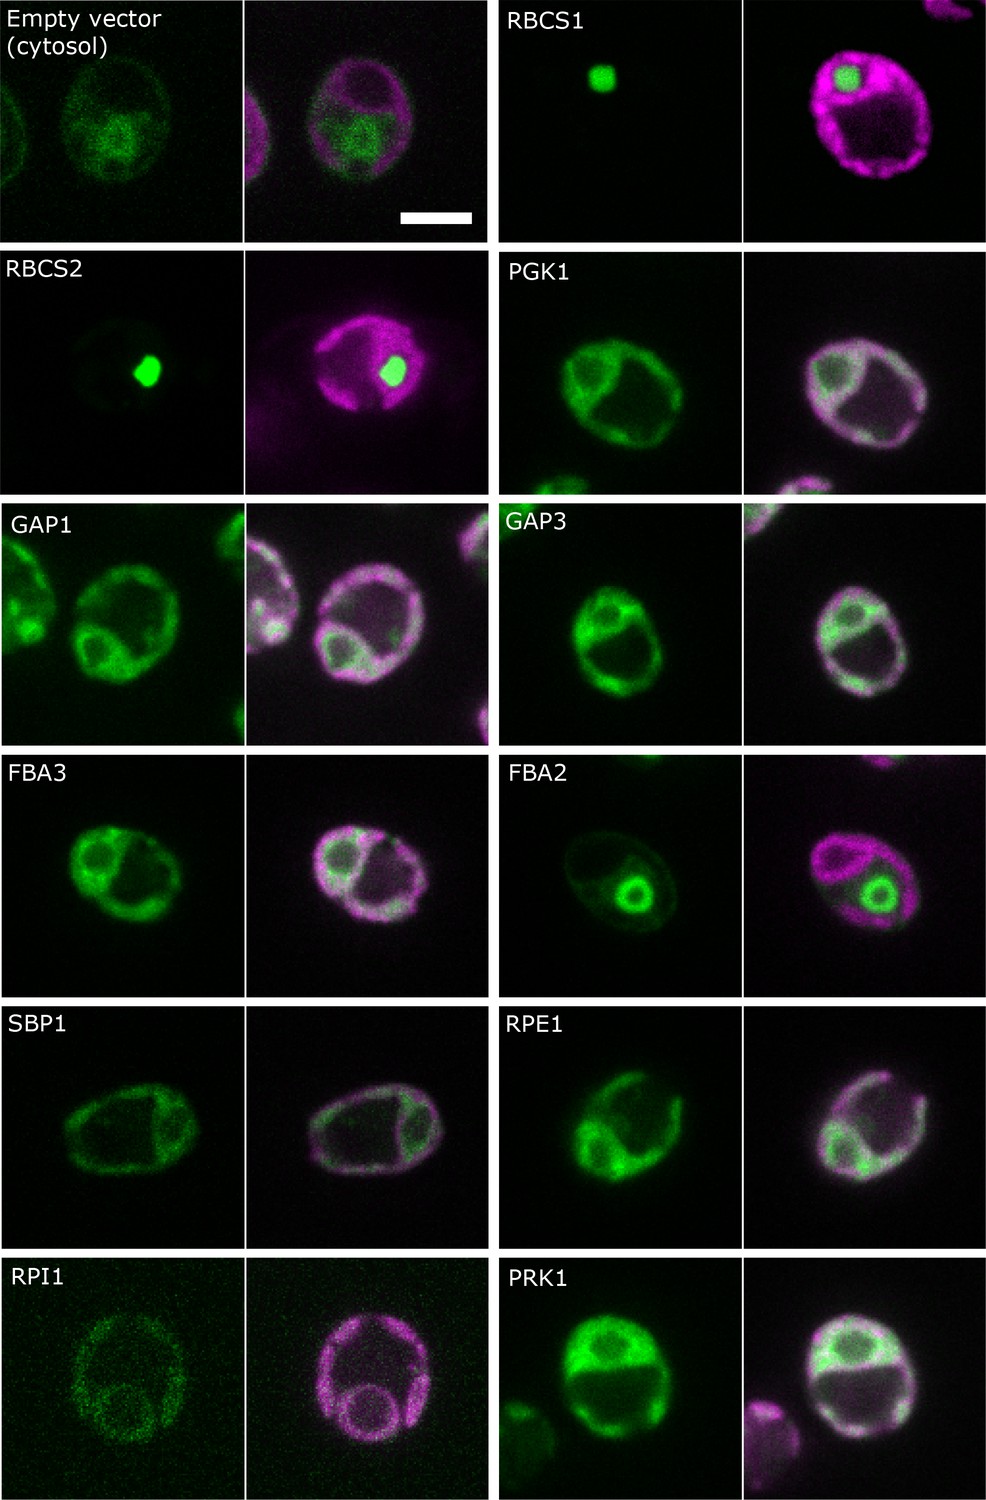
Localisation of CBC enzymes.
Chlamydomonas reinhardtii CC-4533 cells expressing Venus-fusion constructs (green) were grown under ambient CO2, imaged by fluorescence microscopy and two pictures per constructs are shown. On the left side, solely the signal of the Venus-fusion construct (green) and on the right side, the overlay picture of the signal of the Venus-fusion construct (green) and the chlorophyll fluorescence (magenta) is shown. The white bar represents 5 µm. Details on the protein names are given in the text and Supplementary file 2.
Figure 4 with 1 supplement
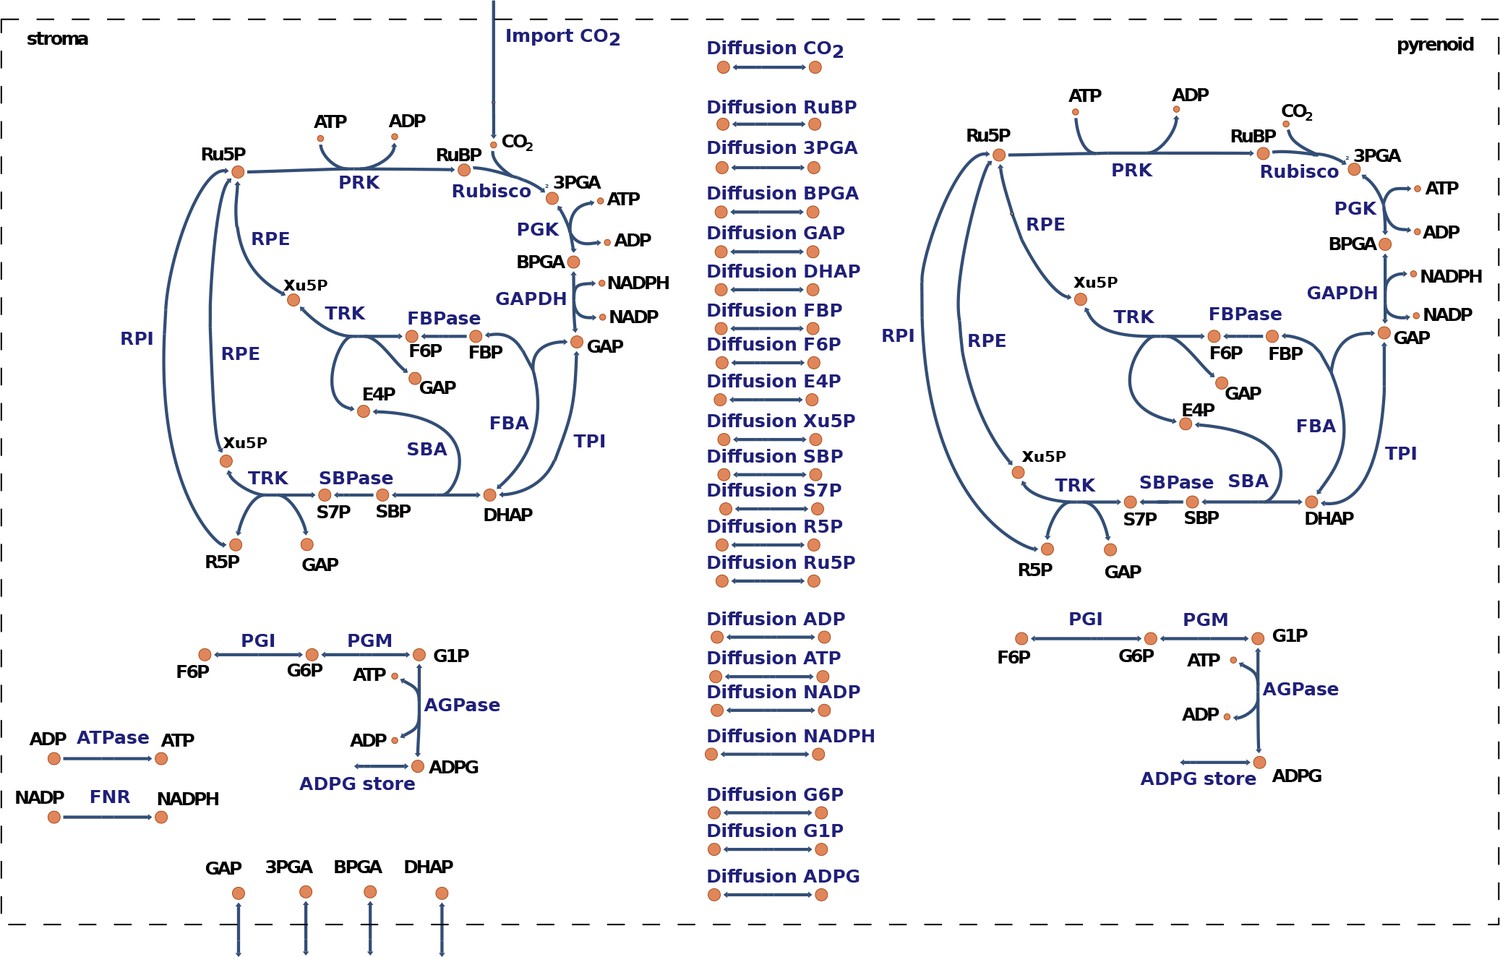
Graphical representation of the model for carbon fixation in Chlamydomonas reinhardtii.
The model includes a copy of the Calvin-Benson cycle (CBC) in the chloroplast stroma and in the pyrenoid. In addition, the model considers reversible transport between the stroma and the pyrenoid for all CBC intermediates. A complete list of enzyme and metabolite names corresponding to the given abbreviations is presented in Supplementary file 3.
Figure 4—figure supplement 1
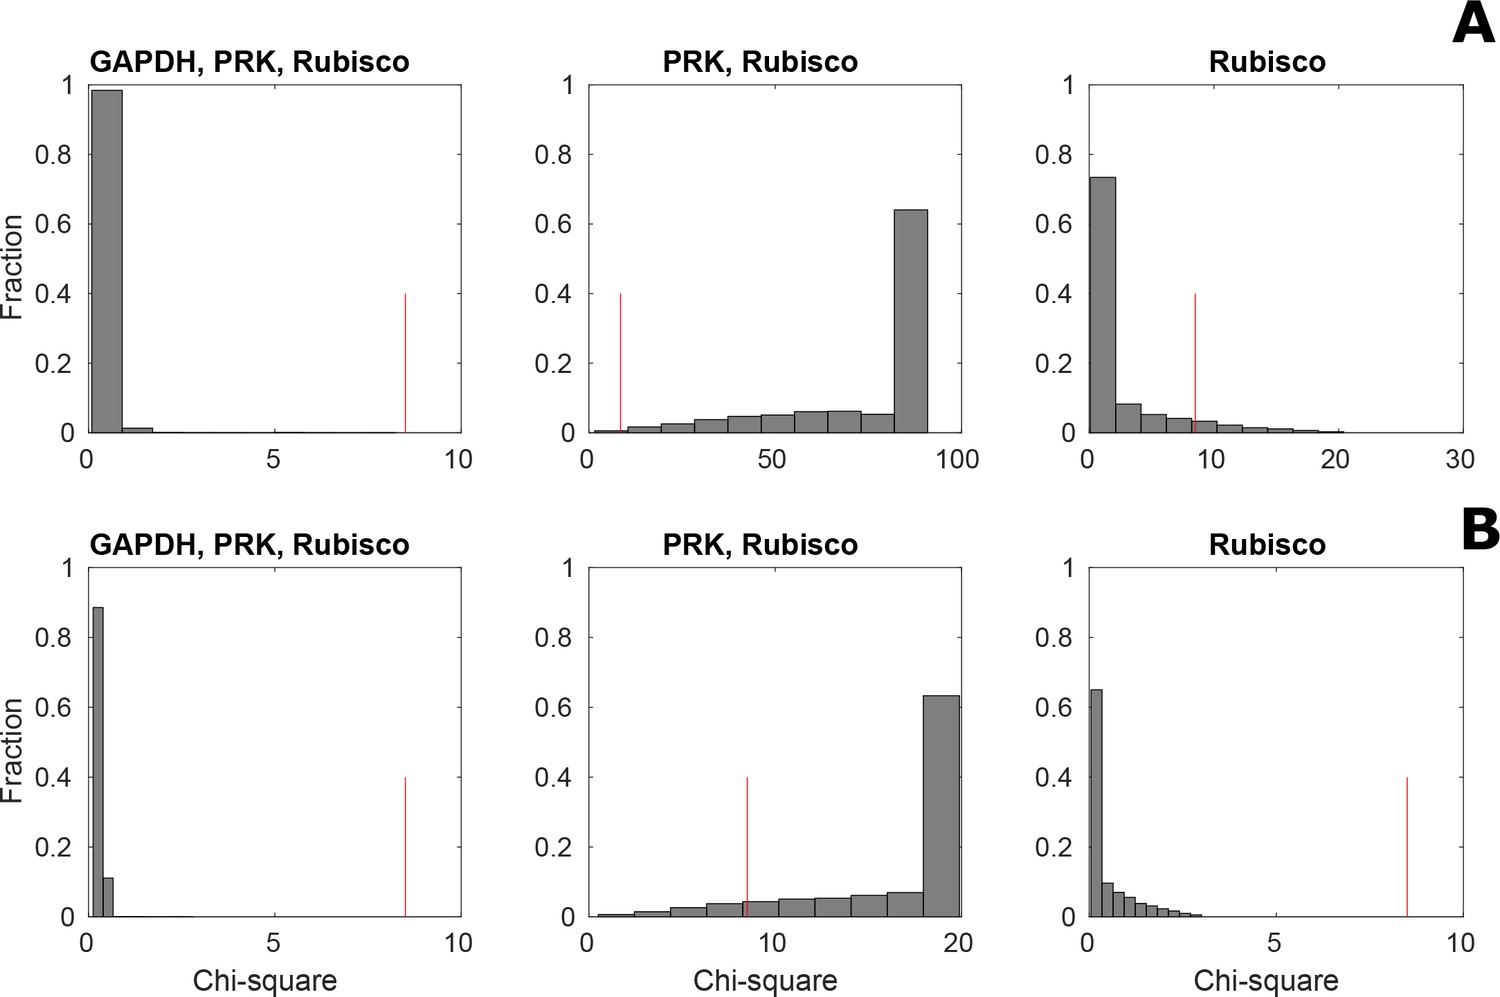
Distribution of Chi-square statistic for 5000 sampled steady-state flux distributions under three different assumptions.
Model predictions under non-CCM (HC, (A) and CCM-induced (LC*; B) conditions were validated using the Chi-square statistic between predicted and measured total concentration for 11 metabolites over 5000 sampled steady-state flux distributions. The validation was done under three different assumptions: (i) activity of PRK, Rubisco and GAPDH, (ii) activity of PRK and Rubisco, and (iii) only activity of Rubisco in the pyrenoid. The red line shows the Chi-square statistic corresponding to a significance level of 0.05.
Figure 5 with 1 supplement
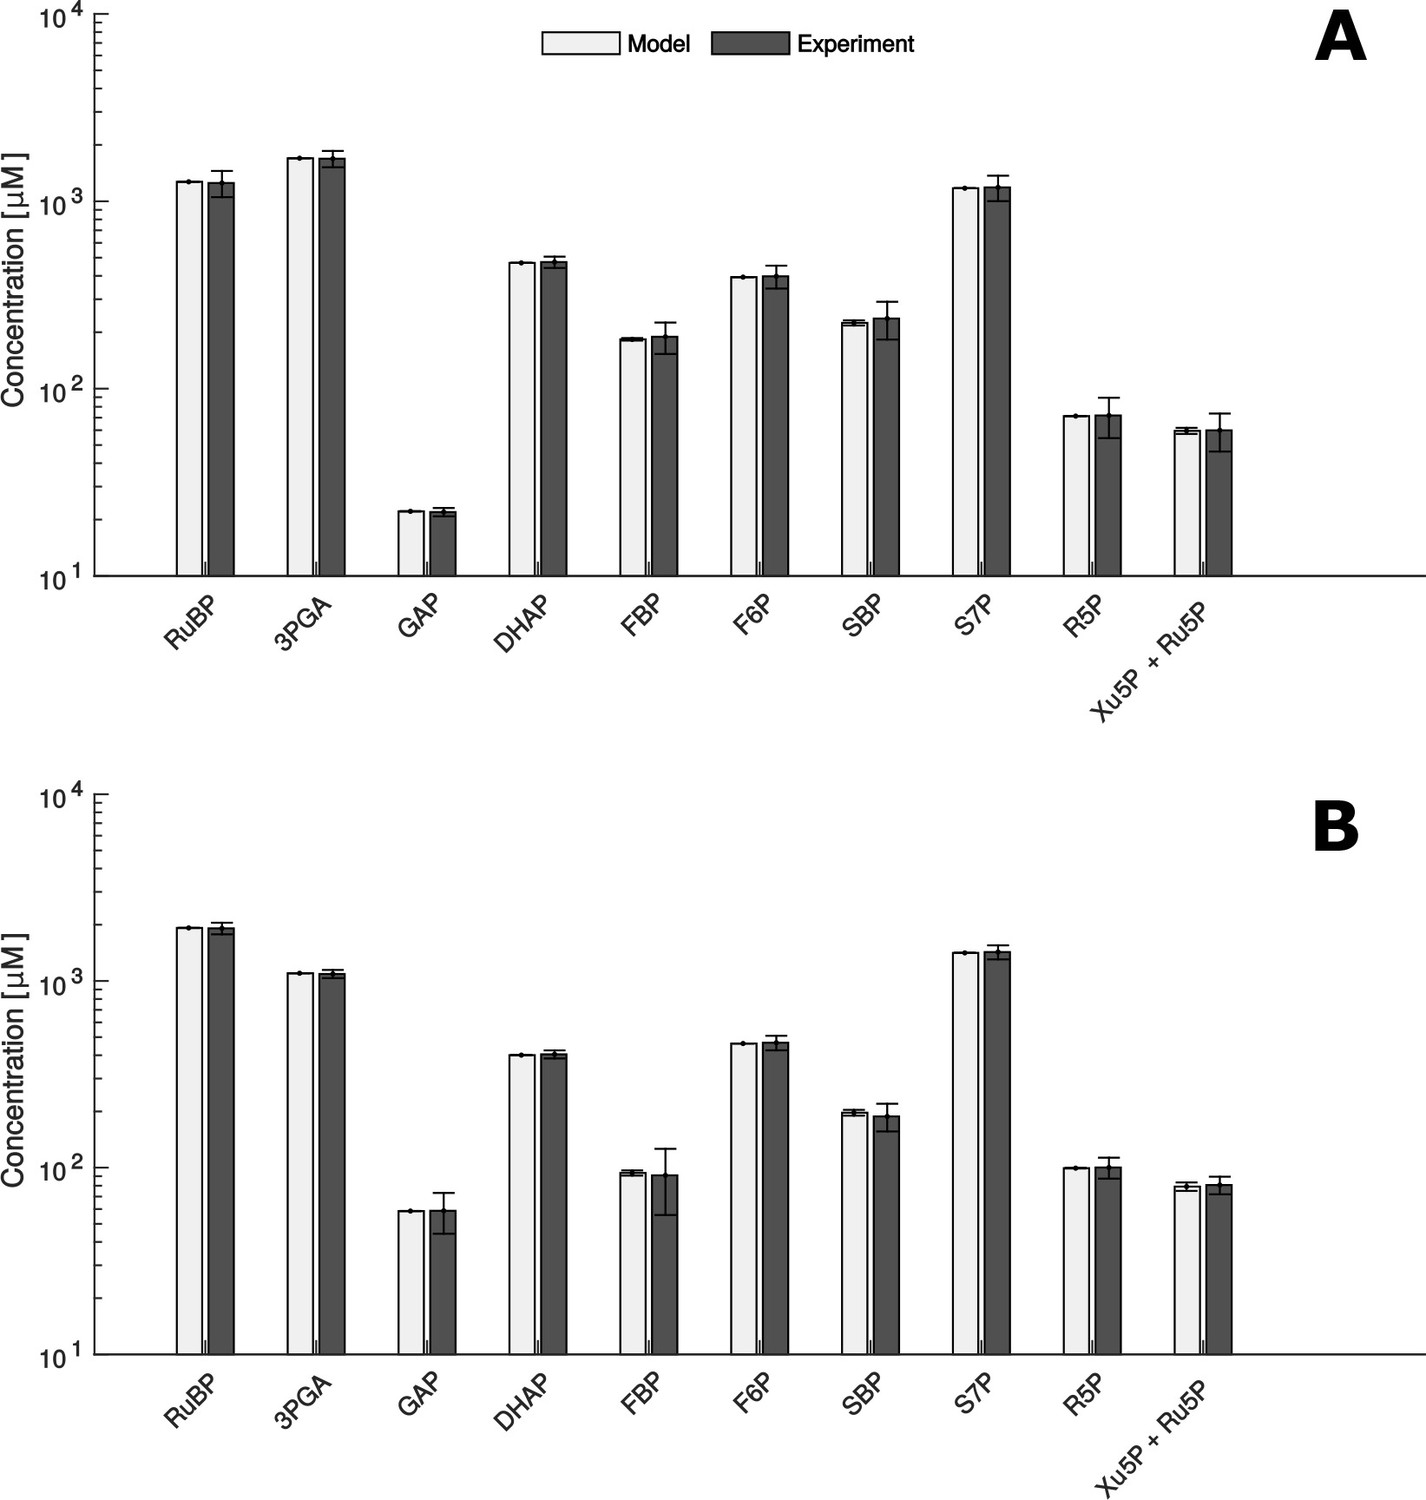
Comparison of metabolite data determined experimentally (Experiment) and by mathematical modelling (Model) under HC (A) and LC* (B) conditions.
(A + B) Modelled data is shown as white bars (n = 1,000 ± SD) and the SD-values are too small to be seen. Experimentally, metabolites were measured by HPLC-MS/MS as already shown in Figure 2 (n = 4 ± SD) (grey bars).
Figure 5—figure supplement 1
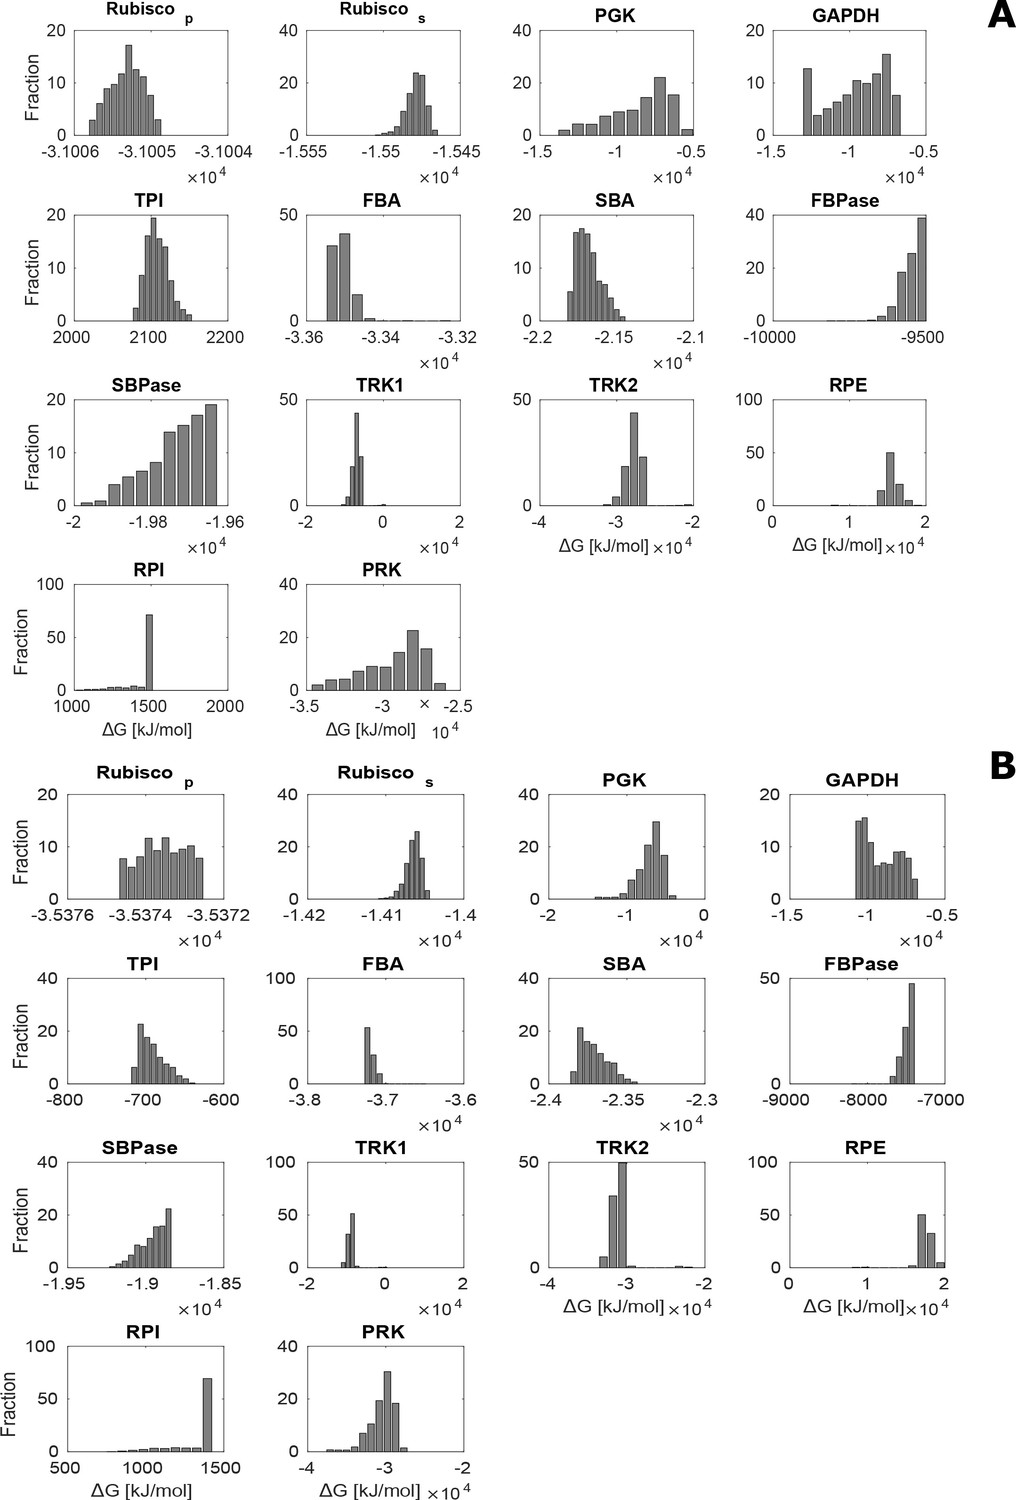
Distribution of estimated values for CBC metabolites over 1000 sampled steady-state flux distributions under no-CCM (HC; A) and CCM-induced (LC*; B) conditions.
The estimated was negative for all enzymes except RPE and RPI for which . In addition, TRK was found to be the only enzyme operating in both directions.
Figure 6 with 1 supplement

Changes in estimated reaction fluxes and metabolite concentrations for HC and LC* Chlamydomonas reinhardtii cells.
(A) Fold changes of model predicted average net flux (represented by arrows) and total metabolite concentrations (represented by circles) between LC* and HC cells indicated by a colour code (see legend) and size of the arrows. The actual values are provided in Supplementary file 5 and 6 and summarized in Figure 6—source data 1. The main difference observed between HC and LC* conditions was an increased flux through Rubisco in the pyrenoid and an increased flux of RuBP and 3PGA to the pyrenoid and from the pyrenoid, respectively. The flux through the Calvin-Benson cycle located in the stroma, however, is similar under both conditions (fold change of 1). (B) Net flux for transport of CO2, RuBP and 3PGA between stroma and pyrenoid under HC (orange) and LC* (blue) conditions. A positive value indicates transport from stroma to pyrenoid, while a negative value indicates transport from pyrenoid into stroma. (C) Concentrations of bound and free RuBP and 3PGA under HC (orange) and LC* (blue) conditions.
-
Figure 6—source data 1
Summary of the most important concentrations and fluxes.
- https://doi.org/10.7554/eLife.37960.012
Figure 6—figure supplement 1
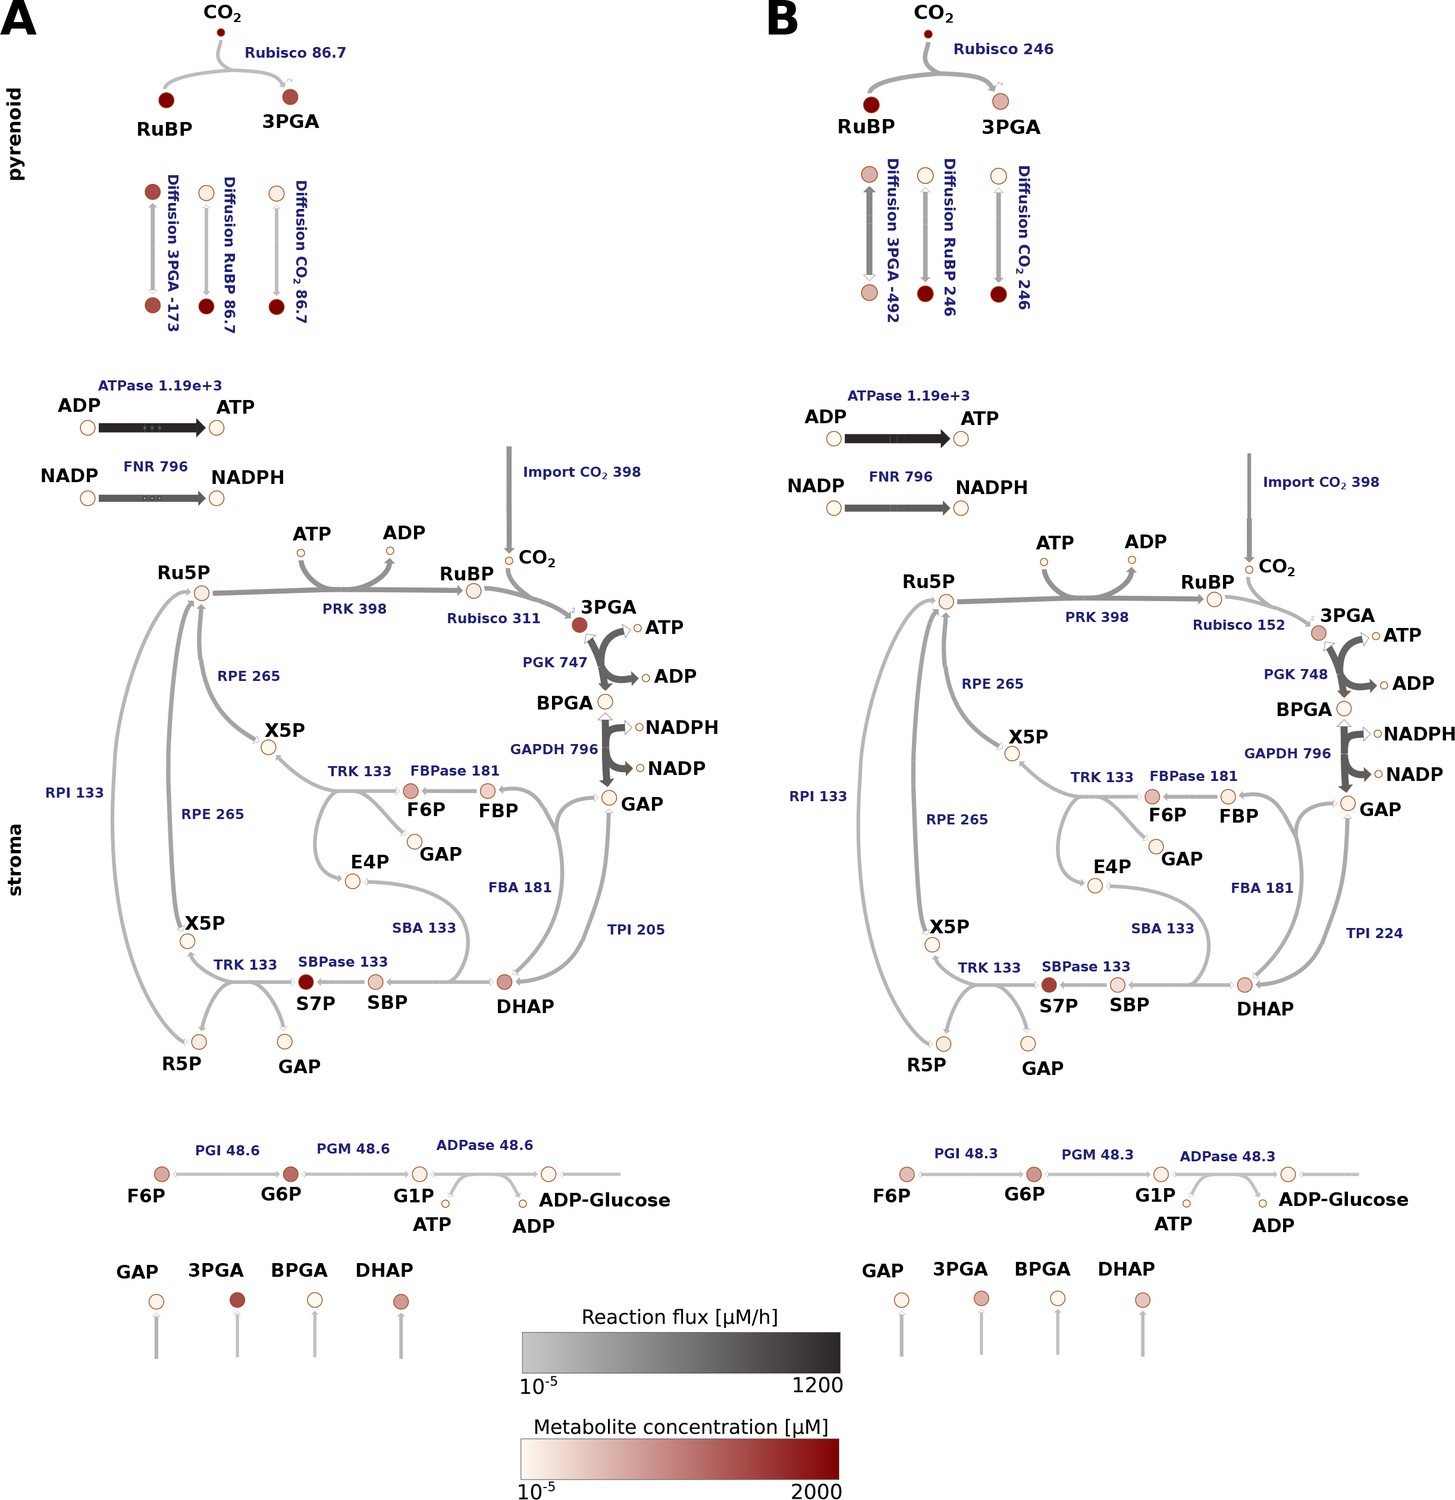
Reaction flux estimated for Chlamydomonas reinhardtii cells grown under non-CCM (HC; A) and CCM-induced (LC*; B) conditions.
The average values of the flux and total metabolite concentration are indicated by a colour code (see legend) and size of the arrows (denoting the reactions). The actual values are provided in Supplementary file 5 and 6. The main difference observed between HC and LC* conditions was an increased flux through Rubisco in the pyrenoid under LC* and an increase in the flux of RuBP and 3PGA into the pyrenoid and from the pyrenoid, respectively, under LC*. The flux through the Calvin-Benson cycle located in the stroma, however, was similar under both conditions.
Tables
Key resources table
| Reagent type (species) or resource | Designation | Source or reference | Identifiers | Additional information |
|---|---|---|---|---|
| Strain, strain background (Chlamydomonas reinhardtii) | CC1690 wild-type strain | Chlamydomonas Resource Center | RRID:SCR_014960 | |
| Strain, strain background (Chlamydomonas reinhardtii) | CC-4533 wild-type strain | Chlamydomonas Resource Center | RRID:SCR_014960 | - |
| Antibody | rabbit Anti- Beta-CA1 | AgriSera | Cat# AS11 1737; RRID:AB_10752086 | (1:7500) |
| Antibody | rabbit Anti-AtpD | AgriSera | Cat# AS10 1590; RRID:AB_10754669 | (1:30000) |
| Software, algorithm | MaxQuant | MaxQuant (http://www.biochem.mpgde/5111795/maxquant) | RRID:SCR_014485 | version 1.5.2.8 |
| Software, algorithm | Codes used for modelling | The mathematical models can be accessed via https://github.com/ankueken/Chlamy_model (copy archived at https://github.com/elifesciences-publications/Chlamy_model). |
Additional files
-
Supplementary file 1
Experimental data.
- https://doi.org/10.7554/eLife.37960.013
-
Supplementary file 2
Protein information for Venus localization.
- https://doi.org/10.7554/eLife.37960.014
-
Supplementary file 3
Model structure.
- https://doi.org/10.7554/eLife.37960.015
-
Supplementary file 4
Predications of kcat-values compared to literature values.
- https://doi.org/10.7554/eLife.37960.016
-
Supplementary file 5
Raw data of the model for HC conditions.
- https://doi.org/10.7554/eLife.37960.017
-
Supplementary file 6
Raw data of the model for LC* conditions.
- https://doi.org/10.7554/eLife.37960.018
-
Transparent reporting form
- https://doi.org/10.7554/eLife.37960.019
Download links
A two-part list of links to download the article, or parts of the article, in various formats.
Downloads (link to download the article as PDF)
Open citations (links to open the citations from this article in various online reference manager services)
Cite this article (links to download the citations from this article in formats compatible with various reference manager tools)
Effects of microcompartmentation on flux distribution and metabolic pools in Chlamydomonas reinhardtii chloroplasts
eLife 7:e37960.
https://doi.org/10.7554/eLife.37960


