UBE3A-mediated p18/LAMTOR1 ubiquitination and degradation regulate mTORC1 activity and synaptic plasticity
- Western University of Health Sciences, United States
- University of California, United States
Figures
Figure 1 with 1 supplement
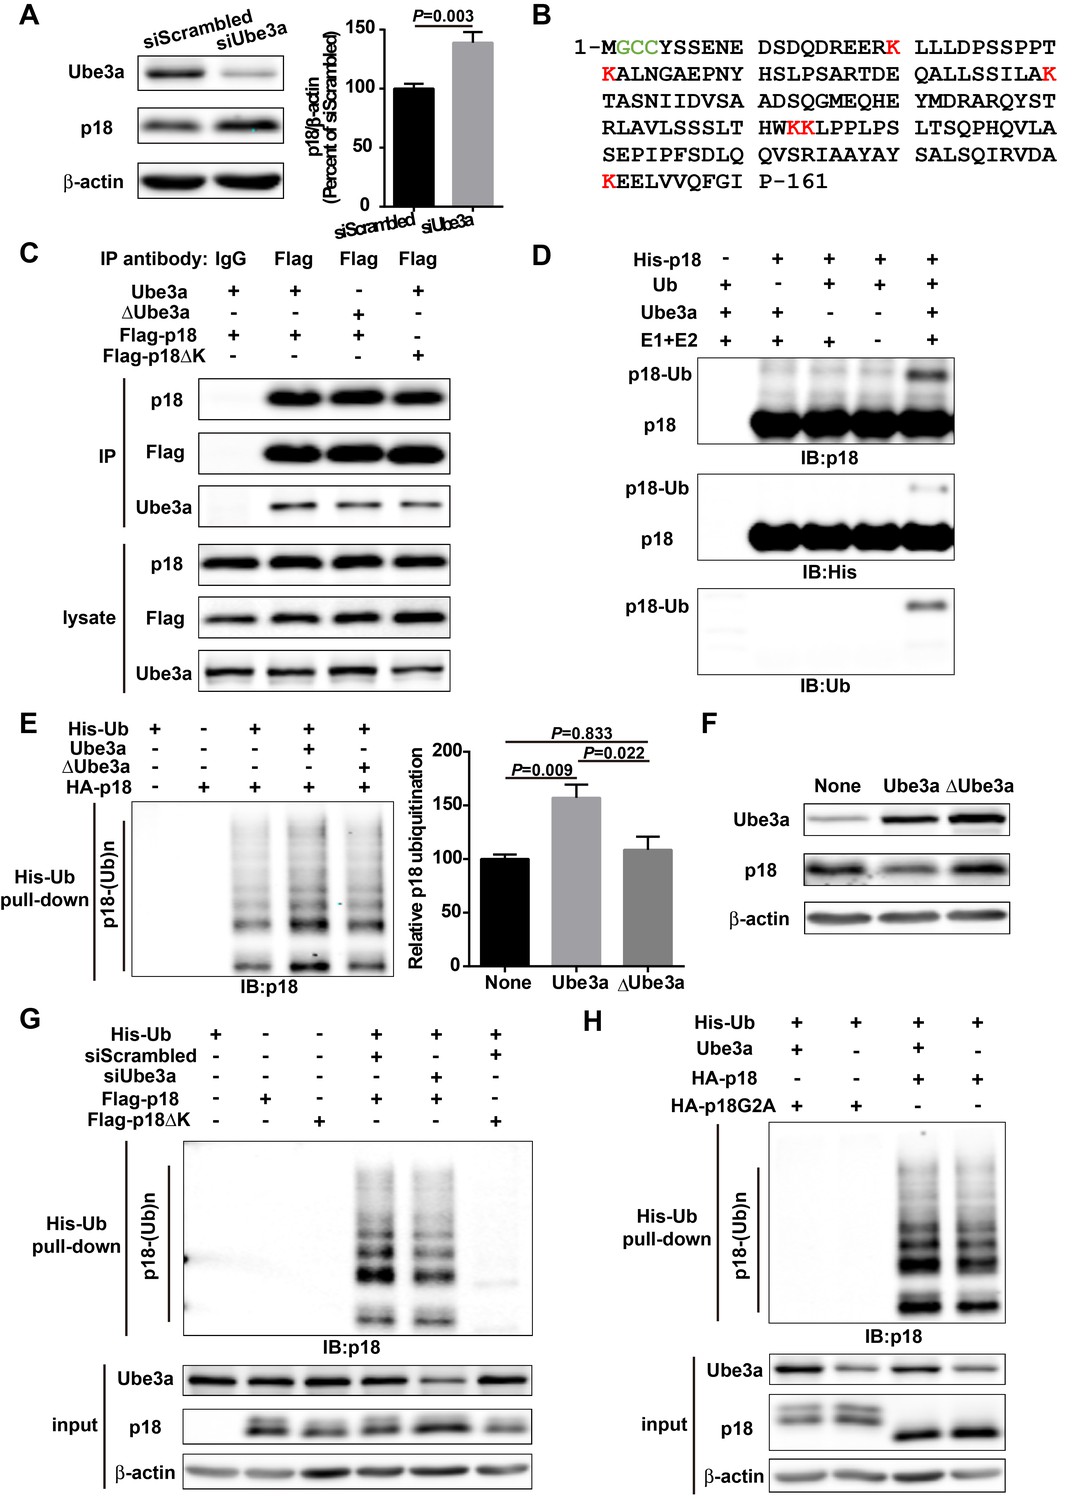
p18 is a Ube3a substrate.
(A) Western blot analysis using anti-Ube3a, p18, or β-actin antibodies of lysates from COS-1 cells transfected with scrambled siRNA or Ube3a siRNA. Right, quantitative analysis of blots. N = 6 independent experiments, p=0.003 (unpaired, two-tailed Student's t-test). (B) Amino acid sequence of human p18. G2 is a myristoylation site. C3 and C4 are palmitoylation sites. K20, K31, K60, K103, K104, and K151 are potential ubiquitination sites. (C) Interaction between p18 and Ube3a. Lysates from COS-1 cells transfected with the indicated cDNAs in expression vectors were immunoprecipitated with an anti-Flag antibody or control IgG and probed with the indicated antibodies. The presence of Flag-p18 in precipitates was confirmed with anti-p18 and anti-Flag antibodies. (D) In vitro ubiquitination of p18 by recombinant Ube3a. Reaction products were analyzed by Western blots with p18, His, and ubiquitin antibodies. Note that the p18-Ub band is present only when all reaction elements are added. (E) Over-expression of Ube3a, but not ΔUbe3a, enhances p18 ubiquitination in COS-1 cells. His-tagged ubiquitinated proteins in cells co-transfected with HA-p18 plus empty vectors (None, but with endogenous Ube3a), wild-type Ube3a (Ube3a), or its inactive form Ube3a-C833A (ΔUbe3a) were precipitated using Talon resin and probed with anti-p18 antibodies. Ubiquitinated p18 proteins are labeled with ‘p18-(Ub)n’. Right, quantification of the relative abundance of ubiquitinated p18 (means ± SEM, p=0.009 None vs. Ube3a, p=0.022 Ube3a vs. ΔUbe3a, p=0.833 None vs. ΔUbe3a, n = 3 independent experiments, one-way ANOVA with Tukey’s post hoc analysis). (F) Western blot analysis using anti-Ube3a, p18, or β-actin antibodies on lysates from COS-1 cells transfected with empty vector, Ube3a, or ΔUbe3a vectors. (G) siRNA knockdown of Ube3a in COS-1 cells reduces p18 ubiquitination. COS-1 cells were incubated with Ube3a siRNA or scrambled control siRNA 48 hr before transfection with Flag-p18 or Flag-p18∆K and His-ubiquitin. Twenty-four hours later, ubiquitinated proteins were isolated by Co2+-affinity chromatography. Levels of ubiquitinated p18 protein (p18-(Ub)n, upper panel) were determined by Western blots. Levels of input proteins were also evaluated by Western blots probed with Ube3a, p18, and β-actin antibodies (lower panel). (H) His-ubiquitin pull-down assay performed using HA-p18 or HA-p18G2A. Upon purification, levels of ubiquitinated p18 (upper panel) were determined by Western blot analysis. Lower panel, input of Ube3a, p18, and β-actin. See also Figure 1—figure supplement 1 and Figure 1—source data 1.
-
Figure 1—source data 1
Quantitative analyses of Western blots used for Figure 1 and Figure 1—figure supplement 1.
- https://doi.org/10.7554/eLife.37993.004
Figure 1—figure supplement 1
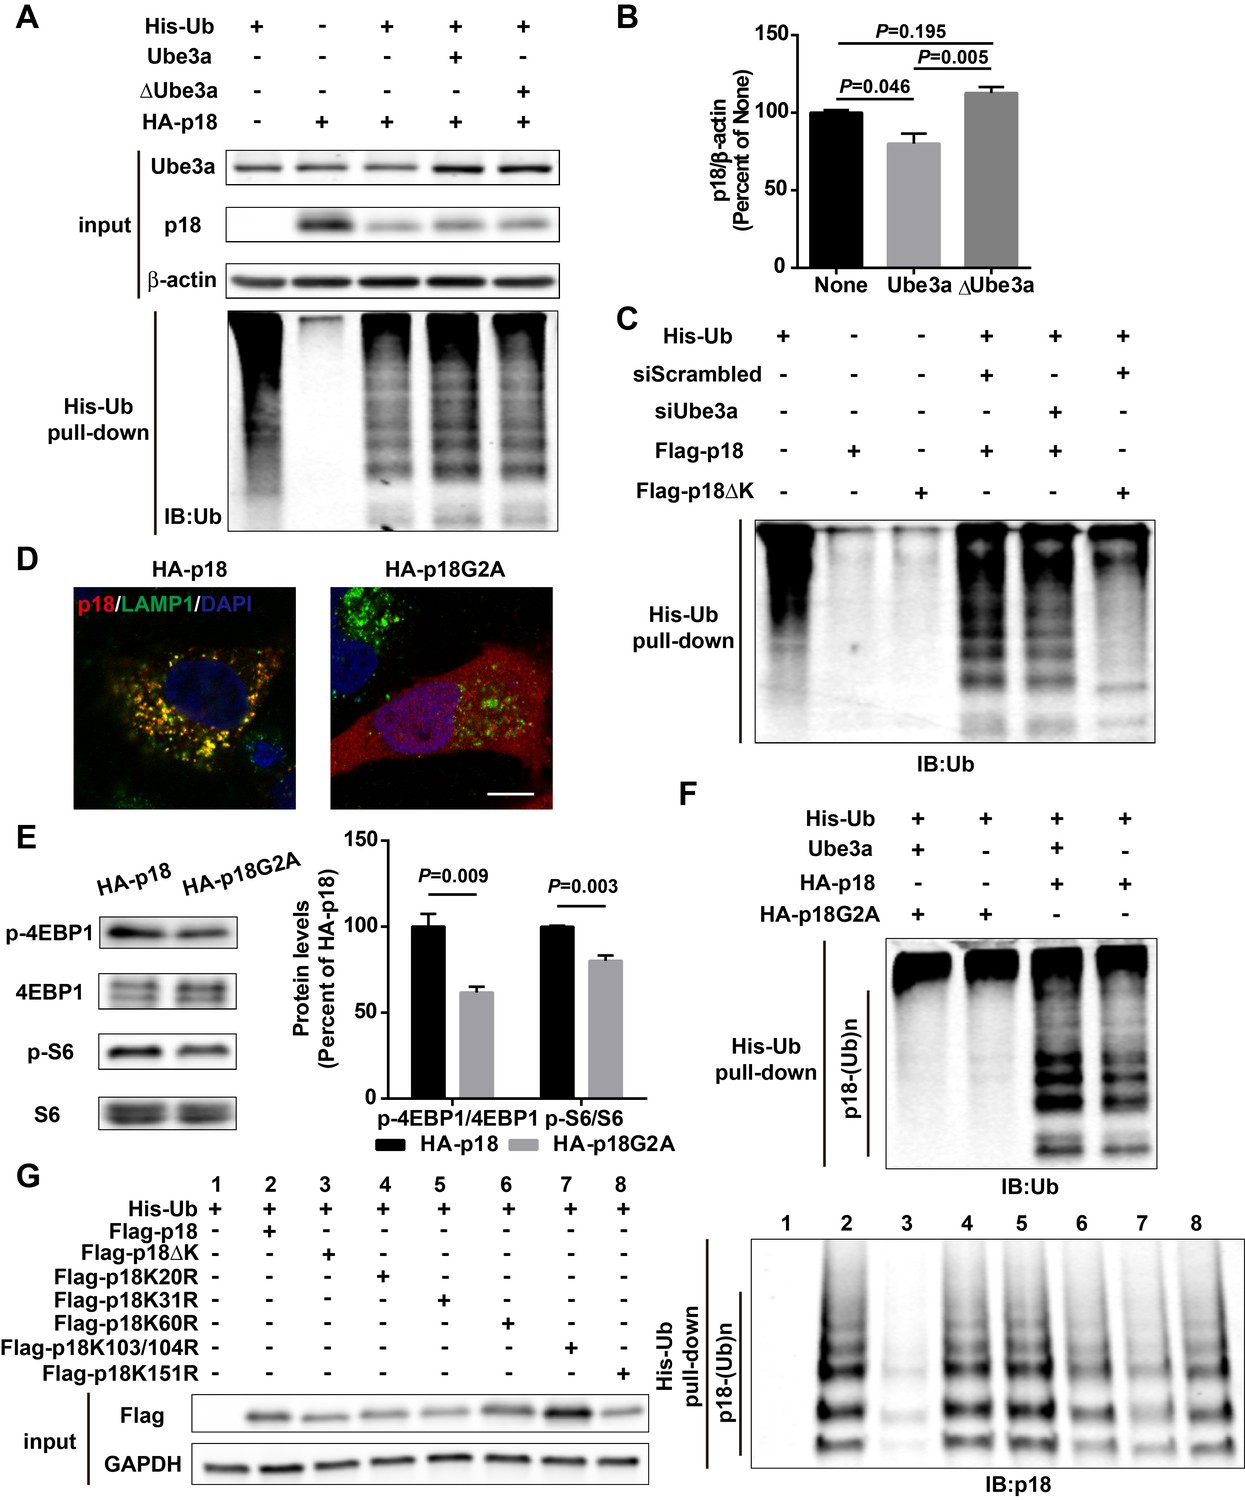
His-ubiquitin pull-down analyses of p18 ubiquitination.
(A) His-ubiquitin pull-down assay performed following over-expression of Ube3a or ∆Ube3a. Upper panel: Levels of input proteins were evaluated by Western blot probed with Ube3a, p18, and β-actin antibodies. Lower panel: Levels of ubiquitin were determined by Western blot analysis. This image is paired with Figure 1E. (B) Quantitative analysis of blots in Figure 1F (means ± SEM, p=0.046 None vs. Ube3a, p=0.005 Ube3a vs. ∆Ube3a, p=0.195 None vs. ∆Ube3a, n = 3 independent experiments, one-way ANOVA with Tukey’s post hoc analysis). (C) His-ubiquitin pull-down assay performed following Ube3a siRNA treatment. Levels of ubiquitin were determined by Western blot analysis. This image is paired with Figure 1G. (D) Localization of wild-type p18 and p18G2A proteins. COS-1 cells expressing p18 or p18G2A were stained with anti-p18 antibody (red) and anti-LAMP1 antibody (green). Scale bar = 10 µm. (E) Western blot analysis using anti-p-4EBP1, 4EBP1, p-S6, or S6 antibodies of lysates from COS-1 cells transfected with HA-p18 or HA-p18G2A. Right, quantitative analysis of blots. N = 3 independent experiments, p=0.009 for p-4EBP1, and p=0.003 for p-S6 (unpaired, two-tailed Student's t-test). (F) His-ubiquitin pull-down assay performed using HA-p18 or HA-p18G2A. Levels of ubiquitin were determined by Western blot analysis. This image is paired with Figure 1H. (G) His-ubiquitin pull-down assay performed using Flag-p18 or Flag-p18 lysine mutants. Upon purification, levels of ubiquitinated p18 (p18-(Ub)n, right panel) were determined by Western blot analysis. Left panel, input of Flag and GAPDH.
Figure 2 with 1 supplement
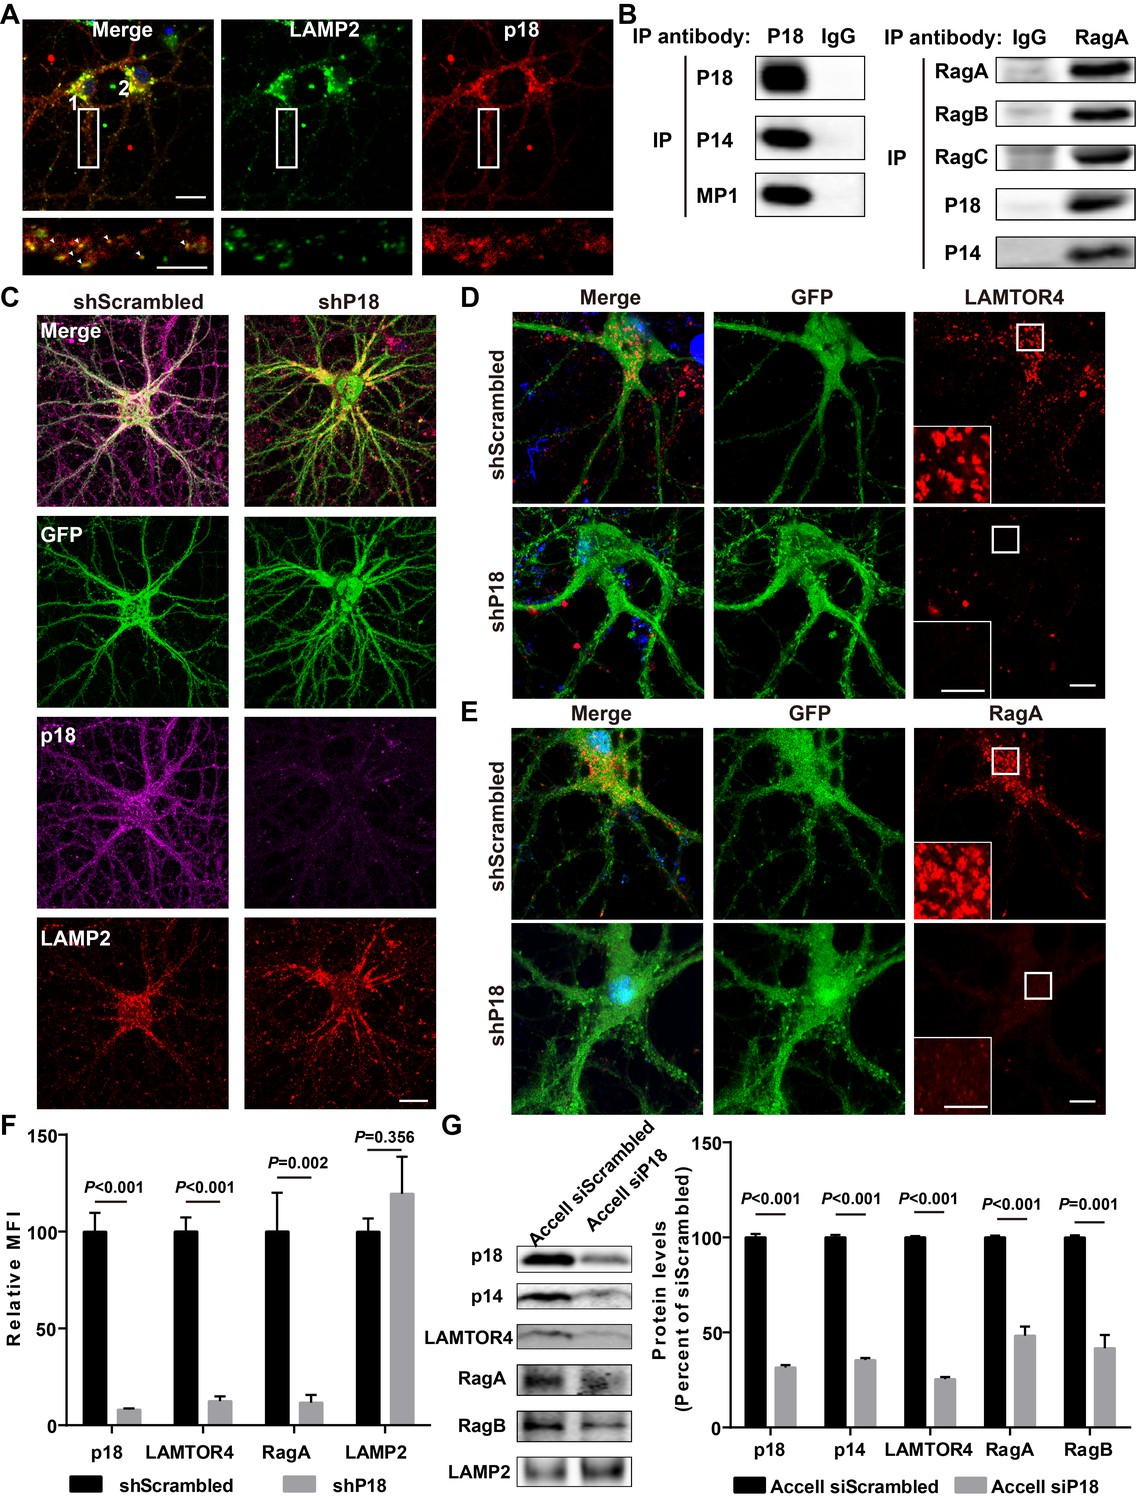
Characterization of p18 in hippocampal neurons.
(A) Images of cultured hippocampal neurons co-immunostained for lysosomal protein LAMP2 (green) and p18 (red). Insets are enlarged images of LAMP2- and p18-immunoreactive puncta along the dendrites. Arrowheads indicate co-localized puncta. Scale bar: top, 20 μm; inset, 10 μm. (B) Left, p18 forms a complex with p14 and MP1 in hippocampal neurons. Lysates from cultured hippocampal neurons were immunoprecipitated with an anti-p18 antibody or control IgG and probed with the indicated antibodies. Right, RagA co-immunoprecipitates RagB, RagC, p18, and p14. Lysates from mouse hippocampi were immunoprecipitated with an anti-RagA antibody or control IgG and probed with the indicated antibodies. (C) Images of cultured hippocampal neurons co-immunostained for p18 (magenta) and LAMP2 (red). Neurons were infected with shRNA AAV directed against p18 with GFP co-expression or scrambled shRNA control before processing for immunofluorescence assay and imaging. Scale bar, 20 μm. (D) Images of hippocampal neurons stained for LAMTOR4 (red). Cells were infected and processed as in (C). Scale bar, 10 μm; inset, 5 μm. (E) Images of hippocampal neurons stained for RagA (red). Cells were infected and processed as in (C). Scale bar, 10 μm; inset, 5 μm. (F) Quantification of fluorescent signals for p18 (n = 13, p<0.001), LAMTOR4 (n = 11, p<0.001), RagA (n = 6, p=0.002), and LAMP2 (n = 6, p=0.356) in control shRNA and p18 shRNA-infected neurons shown in C– E. Student’s t-test. Note that n refers to the number of culture dishes analyzed. (G) Left, Western blot analysis of p18, p14, LAMTOR4, RagA, RagB, and LAMP2 in enriched lysosomal fractions prepared from WT neurons transfected with Accell control or p18 siRNA. Right, quantitative analysis of blots. Results are expressed as % of values in control siRNA-transfected WT neurons and shown as means ± SEM N = 3 independent experiments, p<0.001 for p18, p14, LAMTOR4, and RagA, p=0.001 for RagB (unpaired, two-tailed Student's t-test). See also Figure 2—figure supplement 1 and Figure 2—source data 1.
-
Figure 2—source data 1
Quantitative analyses of images and Western blots used for Figure 2 and Figure 2—figure supplement 1.
- https://doi.org/10.7554/eLife.37993.007
Figure 2—figure supplement 1

Localization of LAMTOR4 and RagA in hippocampal neurons, and representation of organelle marker proteins in individual OptiPrepTM fractions.
(A) Images of cultured hippocampal neurons co-immunostained for lysosomal protein LAMP2 (green) and LAMTOR4 (red). Scale bar = 10 μm. (B) Images of hippocampal neurons co-immunostained for lysosomal protein LAMP2 (green) and RagA (red). Scale bar = 10 μm. (C) Three individual fractions collected after density gradient centrifugation of cultured neurons were assessed using antibodies against cathepsin B (lysosomes) and COXIV (mitochondria).
Figure 3 with 1 supplement
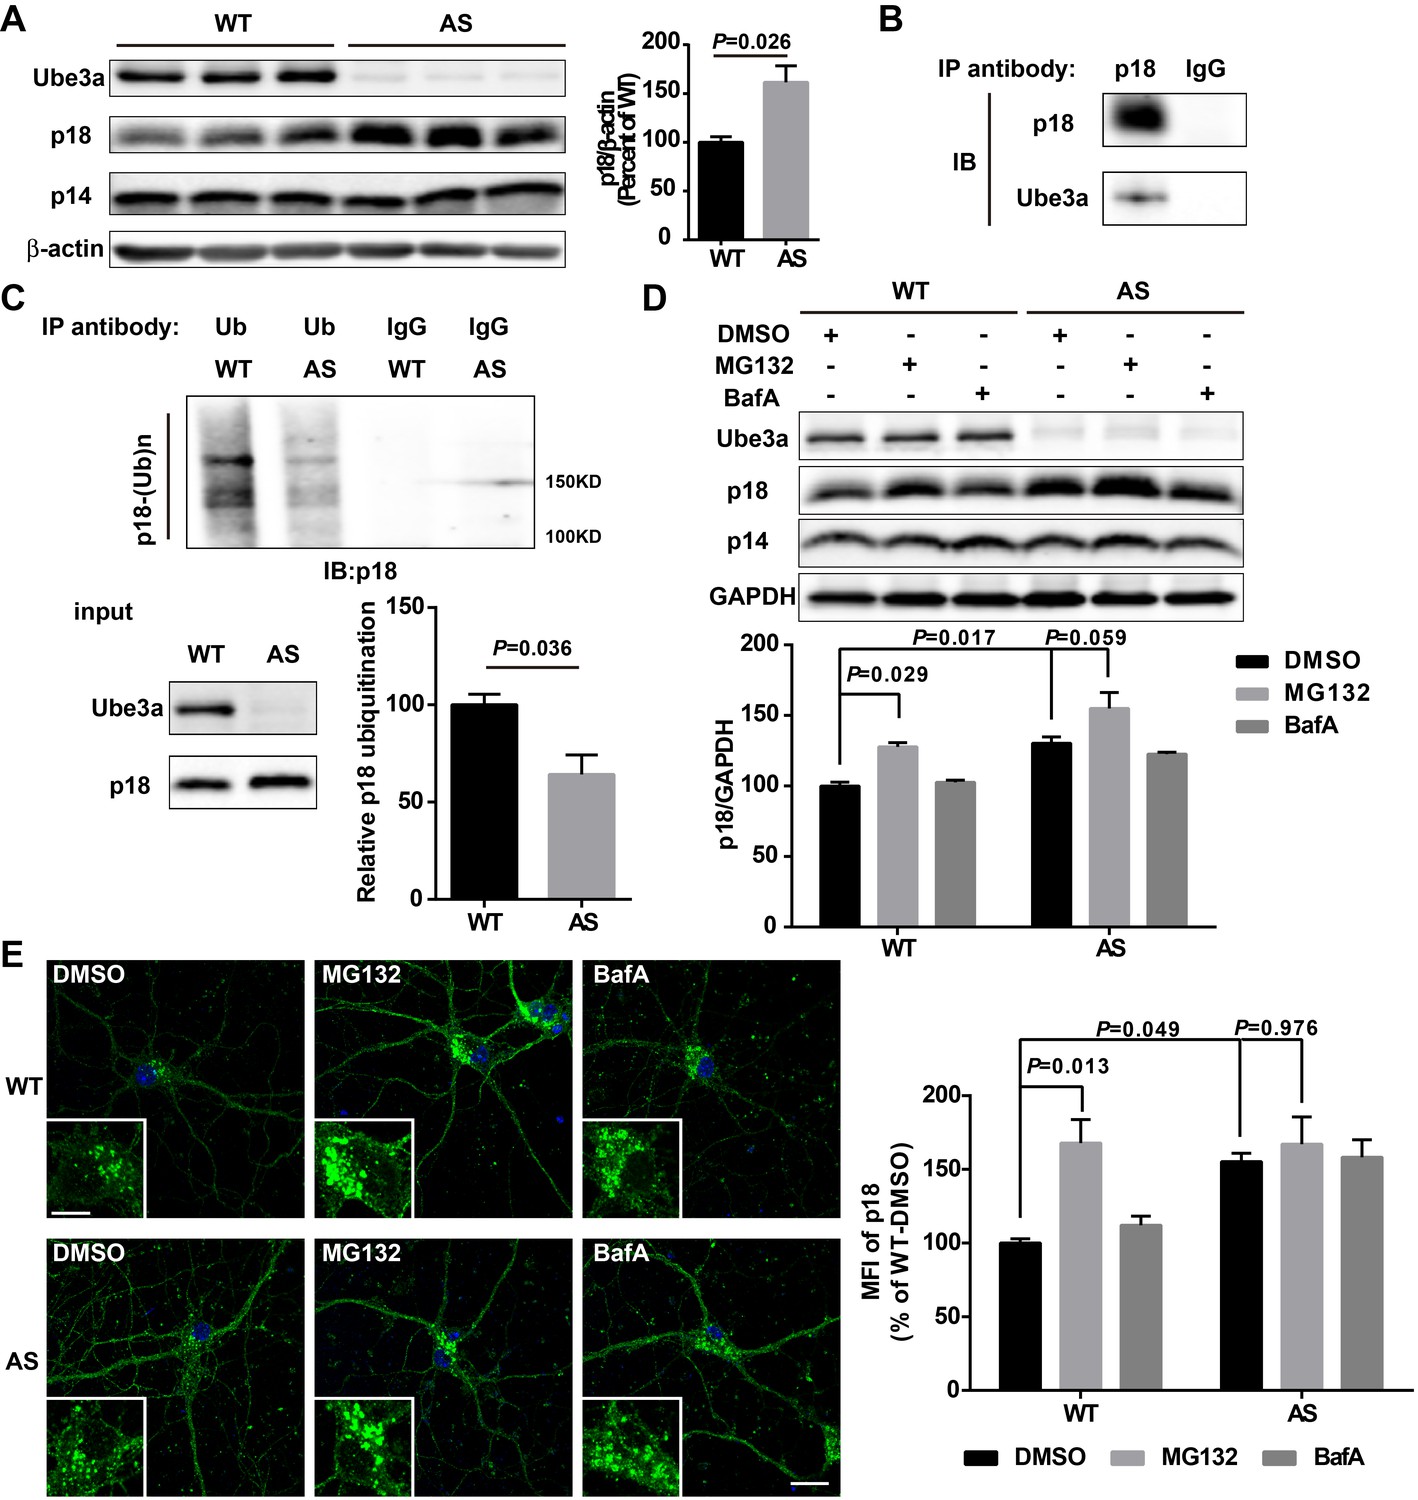
Ube3a regulates p18 levels in a proteasome-dependent manner in hippocampal neurons.
(A) Left, Western blot analysis of p18 and p14 levels in crude membrane fractions (P2) of hippocampi from WT and AS mice. Right, quantitative analysis of blots. Results are expressed as % of values in WT mice and shown as means ± SEM N = 3 mice, p=0.026 (unpaired, two-tailed Student's t-test). (B) Interactions between Ube3a and p18 in hippocampal neuron cultures. Western blot analysis with anti-p18 and -Ube3a antibodies of immunoprecipitation performed with anti-p18 antibodies or control IgG. (C) Immunoprecipitation of hippocampal P2 fractions from WT and AS mice under denaturing conditions was performed with anti-ubiquitin antibodies or control IgG, and Western blots were labelled with anti-p18 antibodies. Ubiquitinated p18 proteins are indicated as ‘p18-(Ub)n’. Lower left panel: levels of input proteins were evaluated by Western blots probed with Ube3a and p18 antibodies. Lower right panel: quantification of the relative abundance of ubiquitinated p18 in hippocampus of WT and AS mice (mean ± SEM, p=0.036 compared with WT mice, n = 3 mice, Student’s t-test). (D) Effects of acute MG132 or bafilomycin A1 (BafA) treatment on p18 and p14 levels in hippocampus slices of WT and AS mice. Upper panel: representative Western blot images; lower panel: quantitative analysis of blots in upper panel. N = 3 independent experiments, p=0.029 WT/DMSO vs. WT/MG132, p=0.017 WT/DMSO vs. AS/DMSO, p=0.059 AS/DMSO vs. AS/MG132, two-way ANOVA with Tukey’s post-test. (E) Representative images of p18 in WT and AS hippocampal neurons treated with DMSO, MG132, and BafA; insets: enlarged cell bodies. Right: Quantitative analysis of images. Data are expressed as mean ± SEM. N = 3 independent experiments, p=0.013 WT/DMSO vs. WT/MG132, p=0.049 WT/DMSO vs. AS/DMSO, p=0.976 AS/DMSO vs. AS/MG132; two-way ANOVA with Tukey’s post hoc analysis. Scale bar = 20 and 10 µm in insets. See also Figure 3—figure supplement 1 and Figure 3—source data 1.
-
Figure 3—source data 1
Quantitative analyses of images and Western blots used for Figure 3 and Figure 3—figure supplement 1.
- https://doi.org/10.7554/eLife.37993.010
Figure 3—figure supplement 1
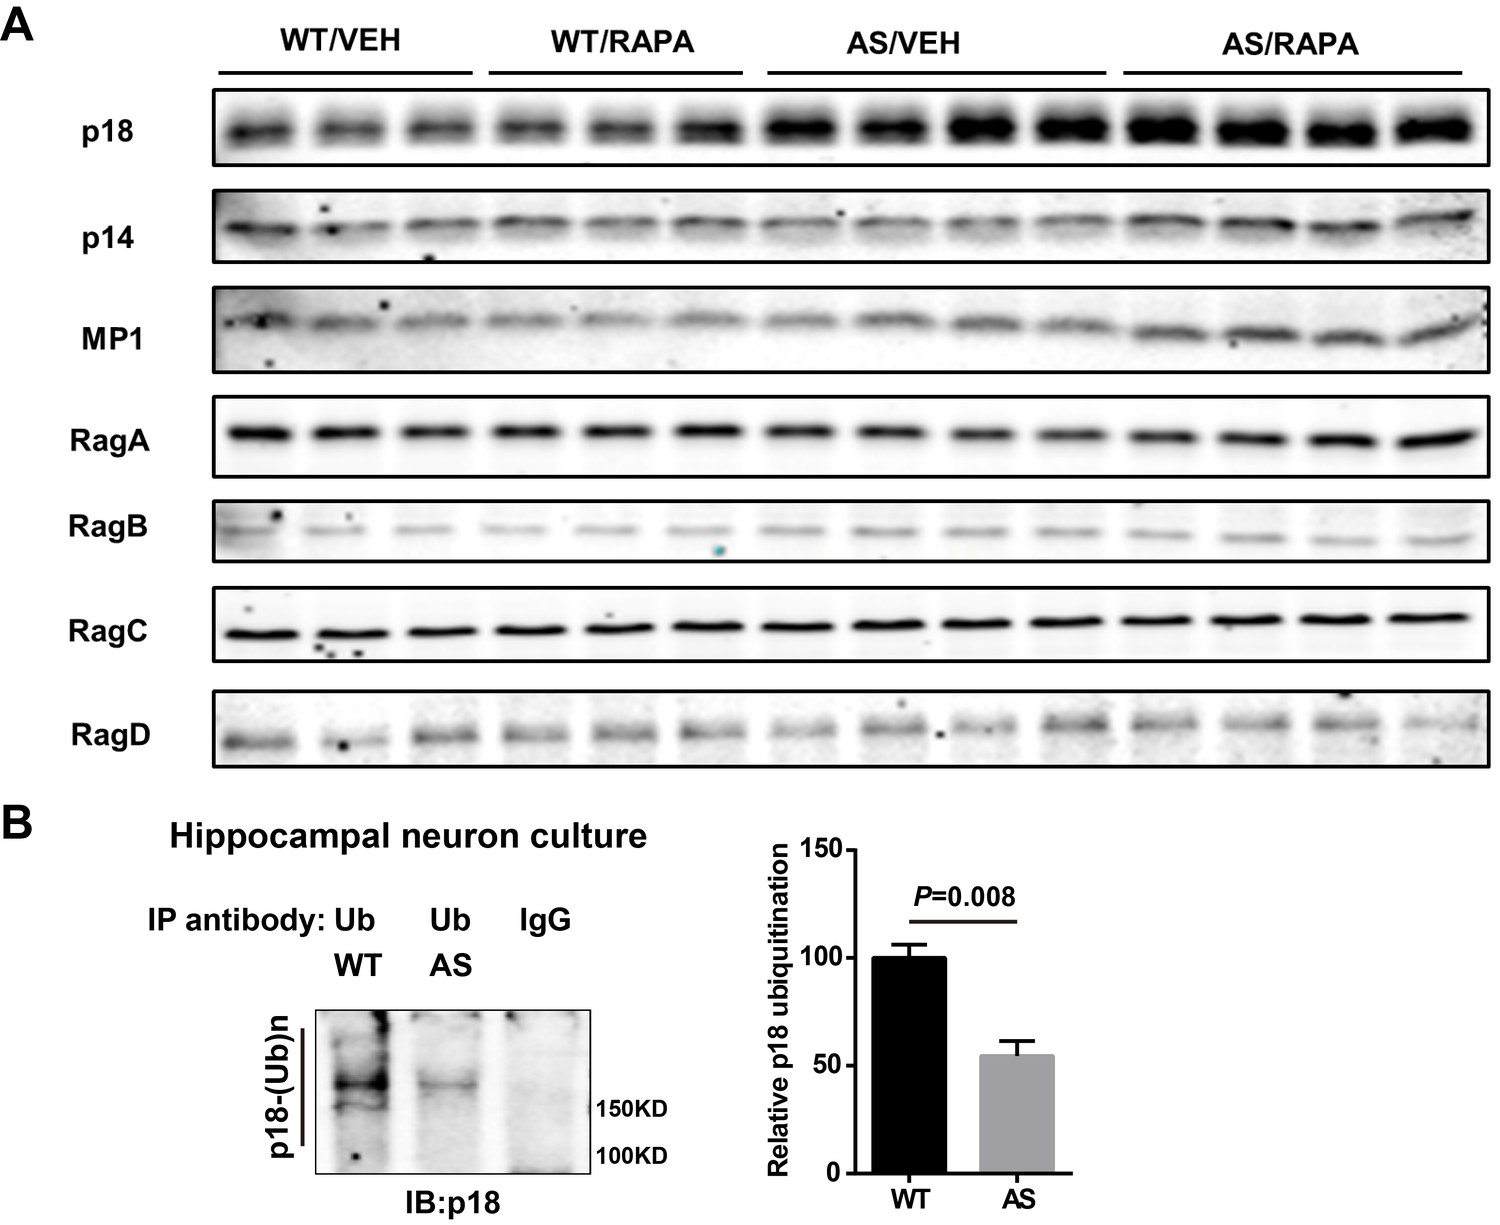
Levels of members of the Ragulator-Rag complex in WT and AS mice and in vivo denaturing immunoprecipitation assay of p18 ubiquitination.
(A) Representative images of Western blots labeled with p18, p14, MP1, RagA, RagB, RagC, and RagD in P2 fractions of hippocampus from vehicle (VEH)- and rapamycin (RAPA)-treated WT and AS mice. (B) Immunoprecipitation of lysates from WT and AS hippocampal neuron cultures under denaturing conditions was performed with anti-ubiquitin antibodies or control IgG and Western blots were labelled with anti-p18 antibodies. Ubiquitinated p18 proteins are indicated as ‘p18-(Ub)n’. Right panel: quantification of the relative abundance of ubiquitinated p18 (mean ± SEM, p=0.008, n = 3 independent experiments, Student’s t-test).
Figure 4 with 2 supplements
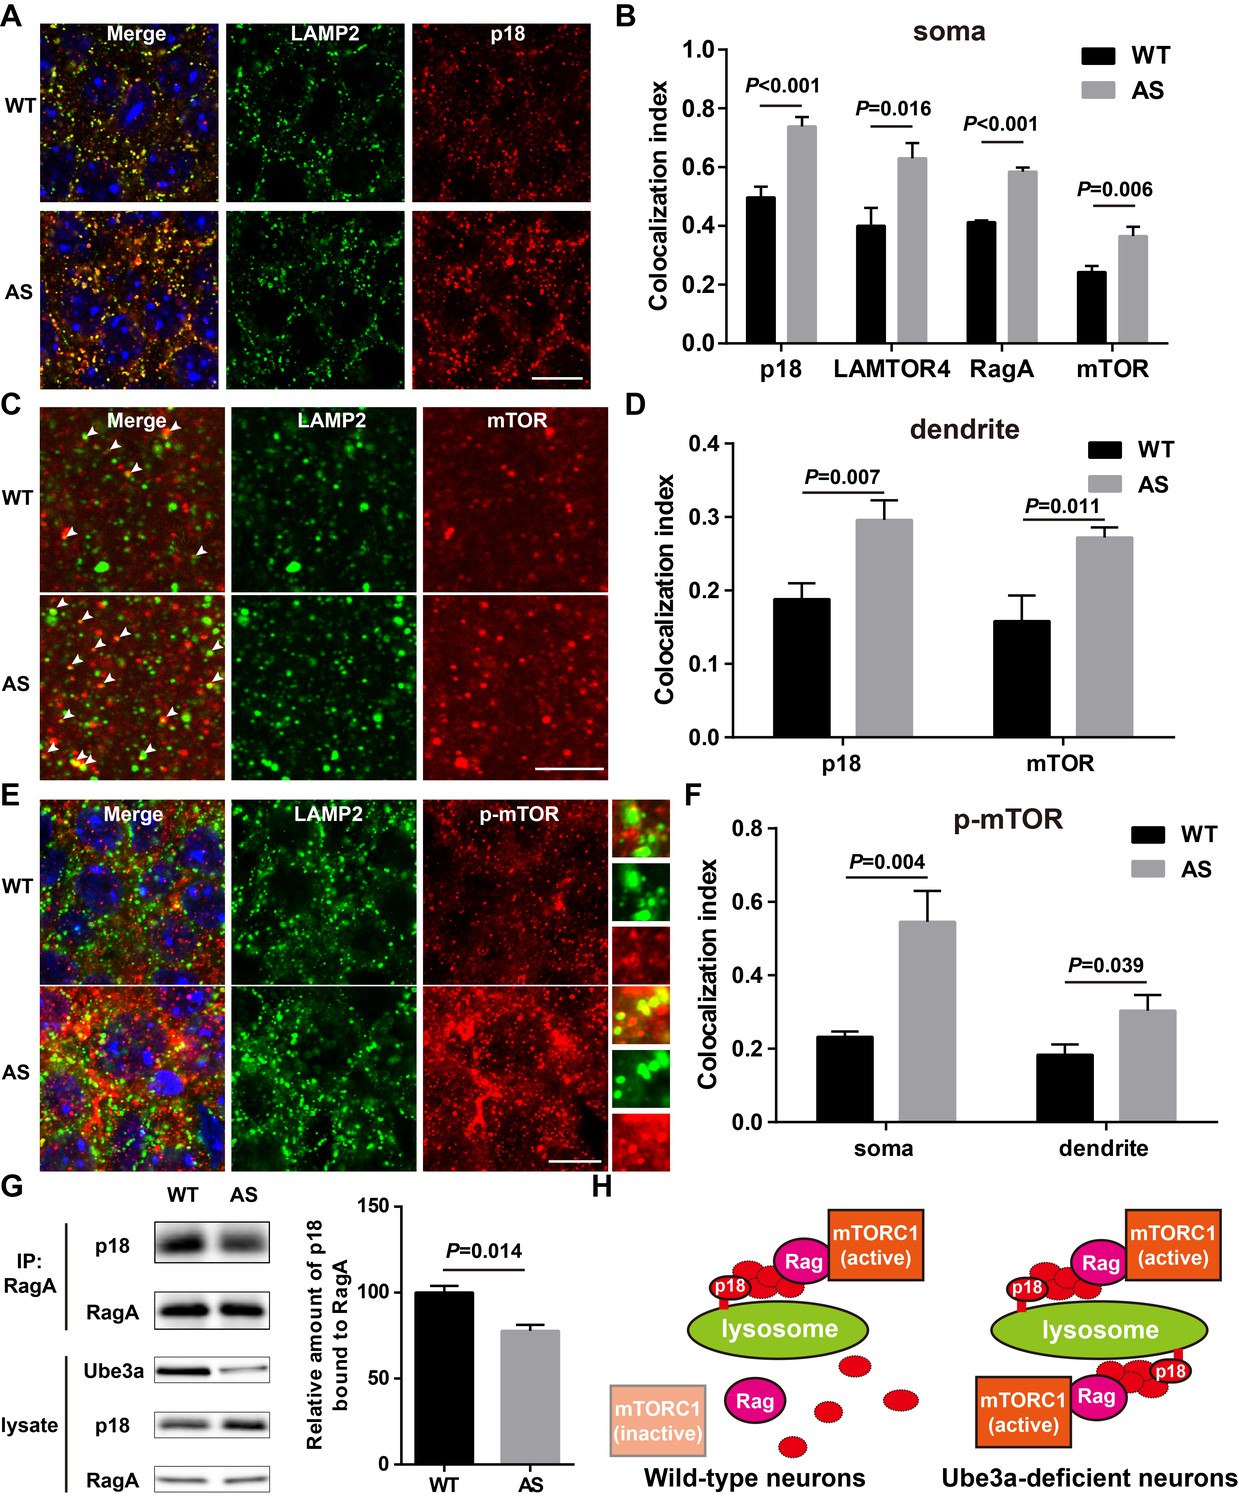
Lysosomal localization of the Ragulator-Rag complex and mTOR/p-mTOR in WT and AS mice.
(A) Co-localization of p18 (red) with LAMP2 (green) in cell bodies of CA1 pyramidal neurons from WT and AS mice. Scale bar = 10 µm. (B) Quantification of p18-LAMP2 (n = 8 mice, p<0.001), LAMTOR4-LAMP2 (n = 6 mice, p=0.016), RagA-LAMP2 (n = 6 mice, p<0.001), and mTOR-LAMP2 (n = 8 mice, p=0.006) colocalization in cell bodies of CA1 pyramidal neurons from WT and AS mice shown in A and Figure 4—figure supplement 1A—C. Unpaired t-test. (C) Representative images of apical dendrites of CA1 pyramidal neurons stained with anti-mTOR (red) and -LAMP2 (green) antibodies. Arrowheads indicate puncta with dual staining. Scale bar = 5 µm. (D) Quantification of p18-LAMP2 (n = 8 mice, p=0.007) and mTOR-LAMP2 (n = 7 mice, p=0.011) co-localization in apical dendrites of CA1 pyramidal neurons from WT and AS mice. Unpaired t-test. (E) Co-localization of p-mTOR (red) with LAMP2 (green) in cell bodies of CA1 pyramidal neurons from WT and AS mice. Scale bar = 10 µm. Insets show selected fields that were magnified 10 times. (F) Quantification of p-mTOR-LAMP2 co-localization in cell bodies (p=0.004) and dendrites (p=0.039) of CA1 pyramidal neurons from WT and AS mice. N = 6 mice, unpaired t-test. (G) Homogenates from WT and AS mouse hippocampus were immunoprecipitated with an anti-RagA antibody and probed with the indicated antibodies. Right, quantification of the relative abundance of p18 bound to RagA (mean ± SEM, p=0.014, n = 3 mice, Student’s t-test). (H) Model proposing that the Ragulator interacts with Rag, which in turn recruits mTORC1 to be activated on lysosomes in neurons. In Ube3a-deficient neurons, increased Ragulator-Rag complex on lysosomes results in mTORC1 over-activation. See also Figure 4—figure supplements 1 and 2 and Figure 4—source data 1.
-
Figure 4—source data 1
Quantitative analyses of images and Western blots used for Figure 4 and Figure 4—figure supplements 1 and 2.
- https://doi.org/10.7554/eLife.37993.014
Figure 4—figure supplement 1

Lysosomal localization of members of the Ragulator-Rag complex and mTOR/p-mTOR in the hippocampus of WT and AS mice.
(A) Co-localization of LAMTOR4 (red) with LAMP2 (green) in cell bodies of CA1 pyramidal neurons from WT and AS mice. Scale bar = 10 µm. (B) Co-localization of RagA (red) with LAMP2 (green) in cell bodies of CA1 pyramidal neurons from WT and AS mice. Scale bar = 10 µm. (C) Co-localization of mTOR (red) with LAMP2 (green) in cell bodies of CA1 pyramidal neurons from WT and AS mice. Arrowheads indicate co-localized puncta. Scale bar = 10 µm. In (B) and (C), insets show selected fields that were magnified 10 times. (D) Quantification of p14-LAMP2 (n = 5 mice, p=0.025), MP1-LAMP2 (n = 6 mice, p=0.039), and RagB-LAMP2 (n = 11 WT mice, and 9 AS mice, p=0.003) colocalization in cell bodies of CA1 pyramidal neurons from WT and AS mice. Unpaired t-test. (E) Representative images of apical dendrites of CA1 pyramidal neurons stained with anti-p18 (red) and -LAMP2 (green) antibodies. Scale bar = 10 µm. (F) Representative images of apical dendrites of CA1 pyramidal neurons stained with anti-p-mTOR (red) and -LAMP2 (green) antibodies. Scale bar = 5 µm.
Figure 4—figure supplement 2

Lysosomal localization of Raptor and Rictor in the hippocampus of WT and AS mice, and Western blot analysis of Ragulator-Rag complex as well as mTOR and Raptor in WT and AS hippocampal lysosome fractions.
(A) Double staining of NeuN (red) and LAMP2 (green) in cell bodies of CA1 pyramidal neurons from WT and AS mice. Scale bar = 10 µm. (B) Co-localization of Raptor (red) with LAMP2 (green) in cell bodies of CA1 pyramidal neurons from WT and AS mice. Scale bar = 10 µm. (C) Co-localization of Rictor (red) with LAMP2 (green) in cell bodies of CA1 pyramidal neurons from WT and AS mice. Scale bar = 10 µm. In (B) and (C), insets show selected fields that were magnified 10 times. (D) Quantification of Raptor-LAMP2 (n = 6 mice, p=0.002), and Rictor-LAMP2 (n = 6 mice, p=0.247) colocalization in cell bodies of CA1 pyramidal neurons from WT and AS mice. Unpaired t-test. (E) Left, Western blot analysis of p18, p14, LAMTOR4, RagA, RagC, mTOR, Raptor, and LAMP2 in enriched lysosomal fractions prepared from WT and AS hippocampus. Right, quantitative analysis of blots. Results are expressed as % of values in WT mice and shown as means ± SEM N = 3 independent experiments, p<0.001 (p18), p=0.003 (p14), p<0.001 (LAMTOR4), p=0.002 (RagA), p=0.011 (RagC), p<0.001 (mTOR), p<0.001 (Raptor), and p=0.006 (LAMP2) (unpaired, two-tailed Student's t-test).
Figure 5 with 1 supplement
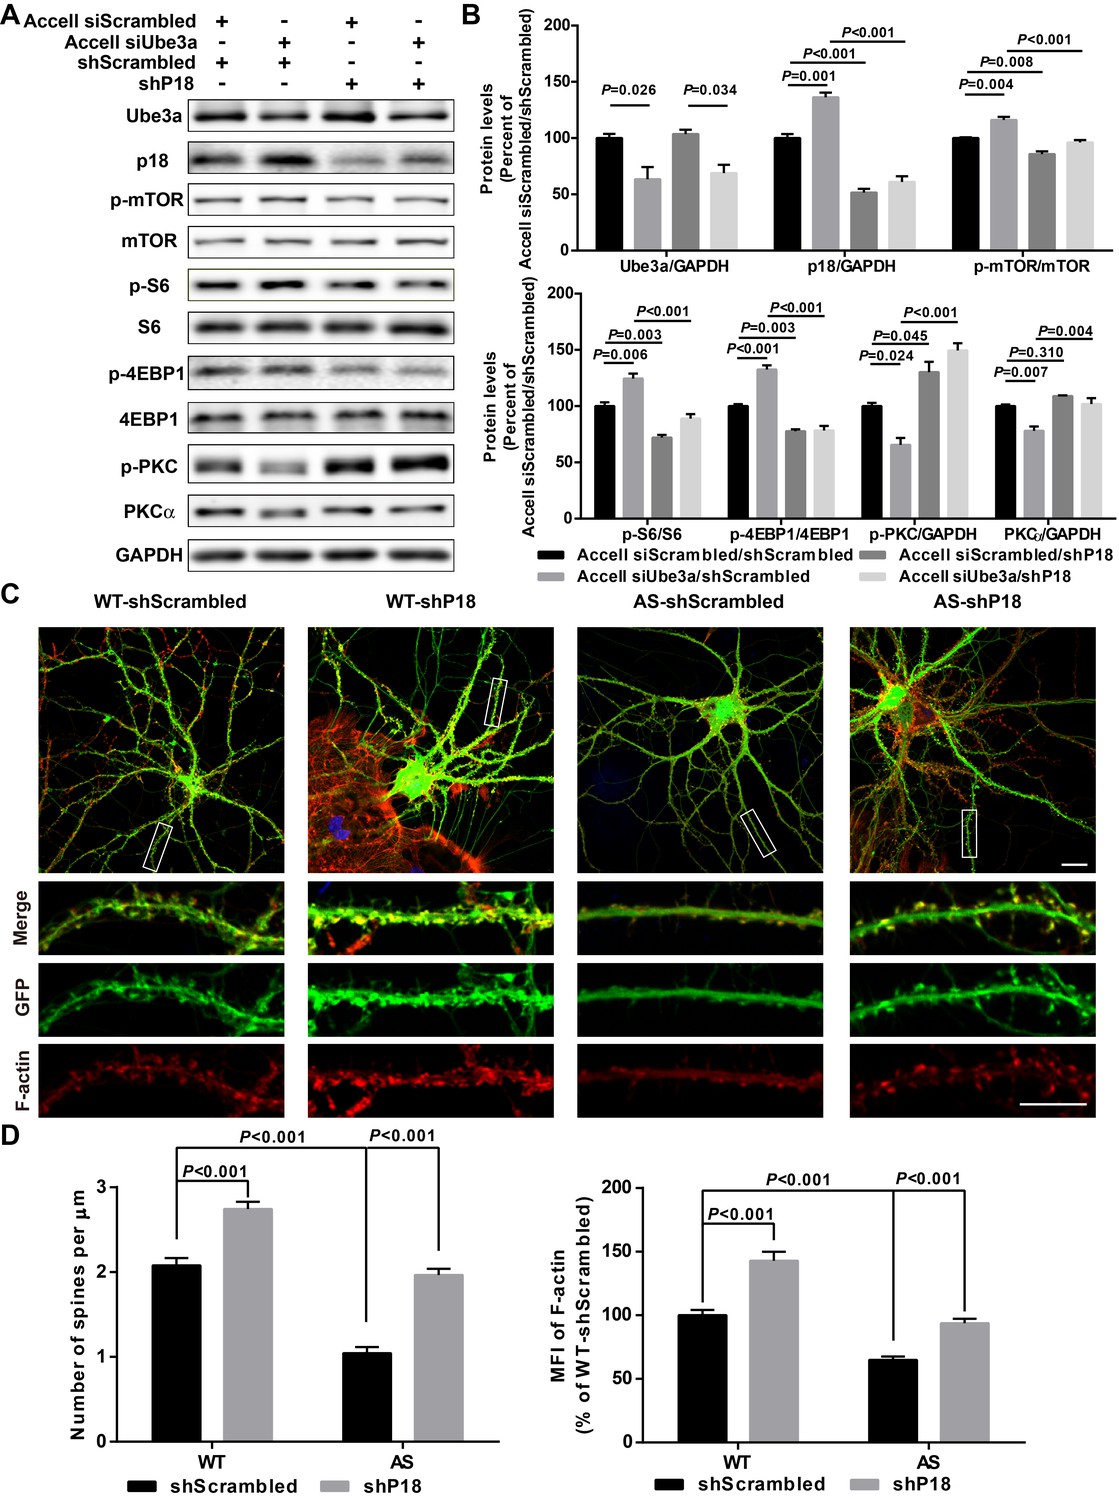
p18 mediates the effects of Ube3a on mTOR signaling, dendritic spine morphology, and actin polymerization.
(A) Representative images of Western blots labeled with Ube3a, p18, p-mTOR, mTOR, p-S6, S6, p-4EBP1, 4EBP1, p-PKC, and PKCα (GAPDH as a loading control). Protein lysates from cultured hippocampal neurons transfected with the indicated constructs were prepared for Western blot analysis. (B) Quantitative analysis of blots shown in (A). N = 3 independent experiments, Accell siScrambled/shScrambled vs. Accell siUbe3a/shScrambled, p=0.026 (Ube3a), p=0.001 (p18), p=0.004 (p-mTOR), p=0.006 (p–S6), p<0.001 (p-4EBP1), p=0.024 (p-PKC), p=0.007 (PKCα); Accell siScrambled/shScrambled vs. Accell siScrambled/shP18, p<0.001 (p18), p=0.008 (p-mTOR), p=0.003 (p–S6), p=0.003 (p-4EBP1), p=0.045 (p-PKC), p=0.310 (PKCα); Accell siUbe3a/shScrambled vs. Accell siUbe3a/shP18, p<0.001 (p18), p<0.001 (p-mTOR), p<0.001 (p–S6), p<0.001 (p-4EBP1), p<0.001 (p-PKC), p=0.004 (PKCα); Accell siScrambled/shP18 vs. Accell siUbe3a/shP18, p=0.034 (Ube3a); two-way ANOVA with Tukey’s post-test. (C) Representative images of F-actin (red) and GFP in cultured WT and AS hippocampal neurons (22 DIV) co-infected with GFP lentivirus and p18 shRNA or scrambled shRNA lentivirus. Scale bar, 20 µm (upper) or 10 µm (lower). (D) Quantitative analysis of images shown in (C). N = 9 neurons from at least three independent experiments, p<0.001, two-way ANOVA with Tukey’s post-test. See also Figure 5—figure supplement 1 and Figure 5—source data 1.
-
Figure 5—source data 1
Quantitative analyses of images and Western blots used for Figure 5 and Figure 5—figure supplement 1.
- https://doi.org/10.7554/eLife.37993.017
Figure 5—figure supplement 1
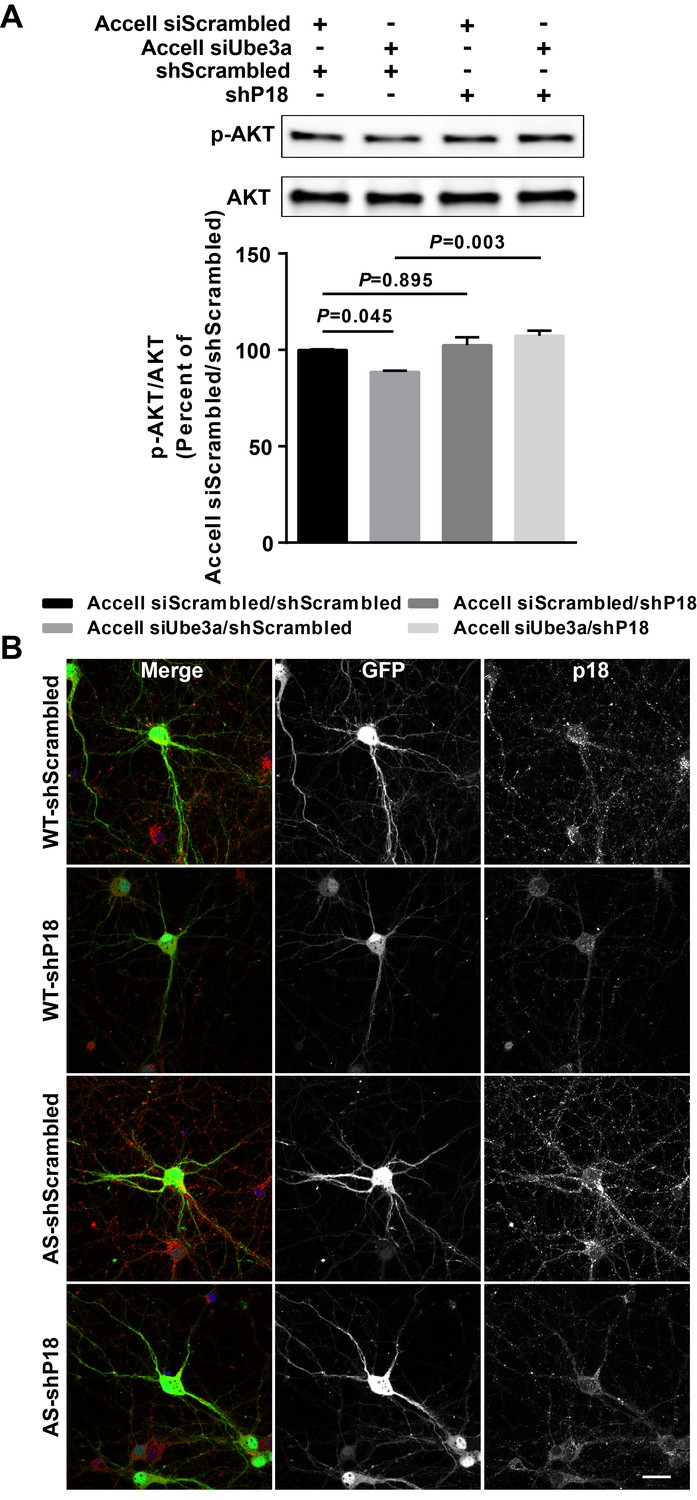
Effects of p18 knockdown in WT and AS hippocampal neurons.
(A) Upper panel: Representative images of Western blots labeled with p-AKT and AKT. Protein lysates from cultured hippocampal neurons transfected with the indicated constructs were prepared for Western blot analysis. Lower panel: quantitative analysis of blots. N = 3 independent experiments. This figure is paired with Figure 5A,B. (B) Representative images of p18 (red) and GFP in WT and AS hippocampal neurons co-infected with copGFP lentivirus and p18 shRNA or scrambled shRNA lentivirus. Scale bar, 30 µm.
Figure 6 with 2 supplements
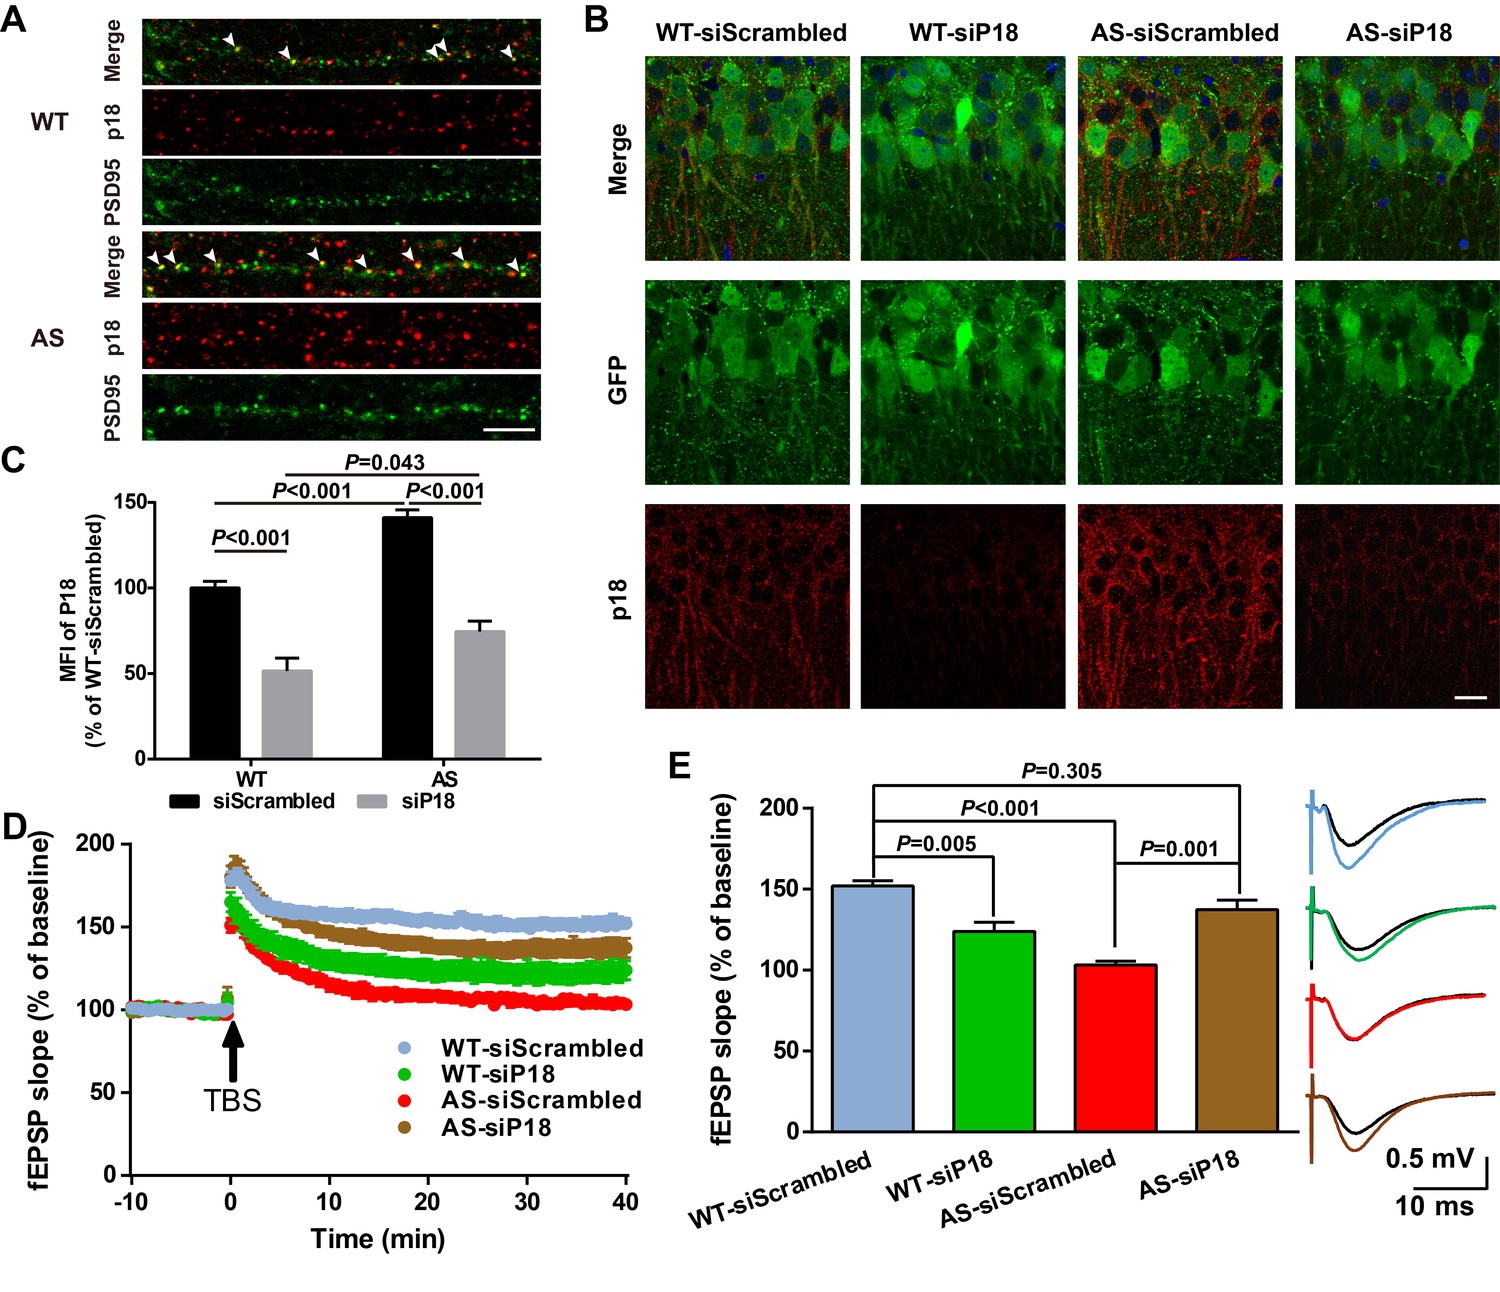
Effects of p18 KD in hippocampal CA1 region on LTP in WT and AS mice.
(A) Representative images of dendrites of CA1 pyramidal neurons stained with anti-p18 (red) and -PSD95 (green) antibodies. Arrowheads indicate co-localized puncta. Scale bar = 10 µm. (B) Representative images of CA1 pyramidal neurons stained with anti-p18 (red) and -GFP (green) antibodies. Scale bar = 20 µm. (C) Quantitative analysis of the mean fluorescence intensity (MFI) of p18-immunoreactive puncta in GFP-positive CA1 pyramidal neurons. N = 6 mice, p<0.001, WT-siScrambled vs. WT-siP18; p<0.001, WT-siScrambled vs. AS-siScrambled; p<0.001, AS-siScrambled vs. AS-siP18; p=0.043, WT-siP18 vs. AS-siP18, two-way ANOVA with Tukey’s post-test. (D, E) Effects of AAV siRNA-mediated p18 KD on LTP in WT and AS mice. (D) Slopes of fEPSPs were normalized to the average values recorded during the 10 min baseline. (E) Means ± SEM of fEPSPs measured 40 min after TBS in different groups. N = 7–14 slices from four to eight mice, p=0.005, WT-siScrambled vs. WT-siP18, p<0.001, WT-siScrambled vs. AS-siScrambled, p=0.001, AS-siScrambled vs. AS-siP18, p=0.305, WT- siScrambled vs. AS-siP18, two-way ANOVA with Tukey’s post-test. Inset shows representative traces of evoked fEPSPs before and 40 min after TBS. Scale bar 0.5 mV/10 ms. See also Figure 6—figure supplements 1 and 2 and Figure 6—source data 1.
-
Figure 6—source data 1
Source data for Figure 6 and Figure 6—figure supplement 1.
- https://doi.org/10.7554/eLife.37993.021
Figure 6—figure supplement 1

Effects of p18 knockdown in hippocampal CA1 region on mTOR signaling in WT and AS mice.
(A) Quantitative analysis of the number of p18- (left, p=0.001) and PSD95-immunoreactive puncta (right, p=0.929), as well as percentage of p18 and PSD95 dually stained puncta/synapses (middle, p=0.004) in hippocampal CA1 region. N = 6 mice, unpaired t-test. These data are paired with Figure 6A. (B) The coordinates of the injection sites were (mm): AP −1.94, ML ±1.4, DV −1.35 from Bregma; AP −2.2, ML ±1.8, DV −1.5 from Bregma, in the CA1 region of hippocampus and are indicated by red circles. (C) Representative tile scan confocal image of GFP expression in hippocampal CA1 region 4 weeks following injection of AAV with GFP reporter gene. Scale bar = 200 μm. (D) Representative images of Western blots labeled with Ube3a, p18, p-mTOR, mTOR, p-S6K1, p-S6, S6, and PKCα (GAPDH as a loading control). Protein lysates from hippocampal CA1 region infected with the indicated AAV were prepared for Western blot analysis. (E) Effects of p18 knockdown in hippocampal CA1 region on mTOR signaling in WT and AS mice. For p-mTOR, p=0.010, WT-siScrambled vs. WT-siP18, p=0.002, WT-siScrambled vs. AS-siScrambled, p<0.001, AS-siScrambled vs. AS-siP18; For p-S6, p<0.001, WT-siScrambled vs. WT-siP18, p=0.002, WT-siScrambled vs. AS-siScrambled, p<0.001, AS-siScrambled vs. AS-siP18; For PKC, p=0.012, WT-siScrambled vs. WT-siP18, p=0.001, WT-siScrambled vs. AS-siScrambled, p<0.001, AS-siScrambled vs. AS-siP18; n = 4 mice for WT-siScrambled, WT-siP18, and AS-siScrambled, n = 3 mice for AS-siP18, two-way ANOVA with Tukey’s post-test.
Figure 6—figure supplement 2
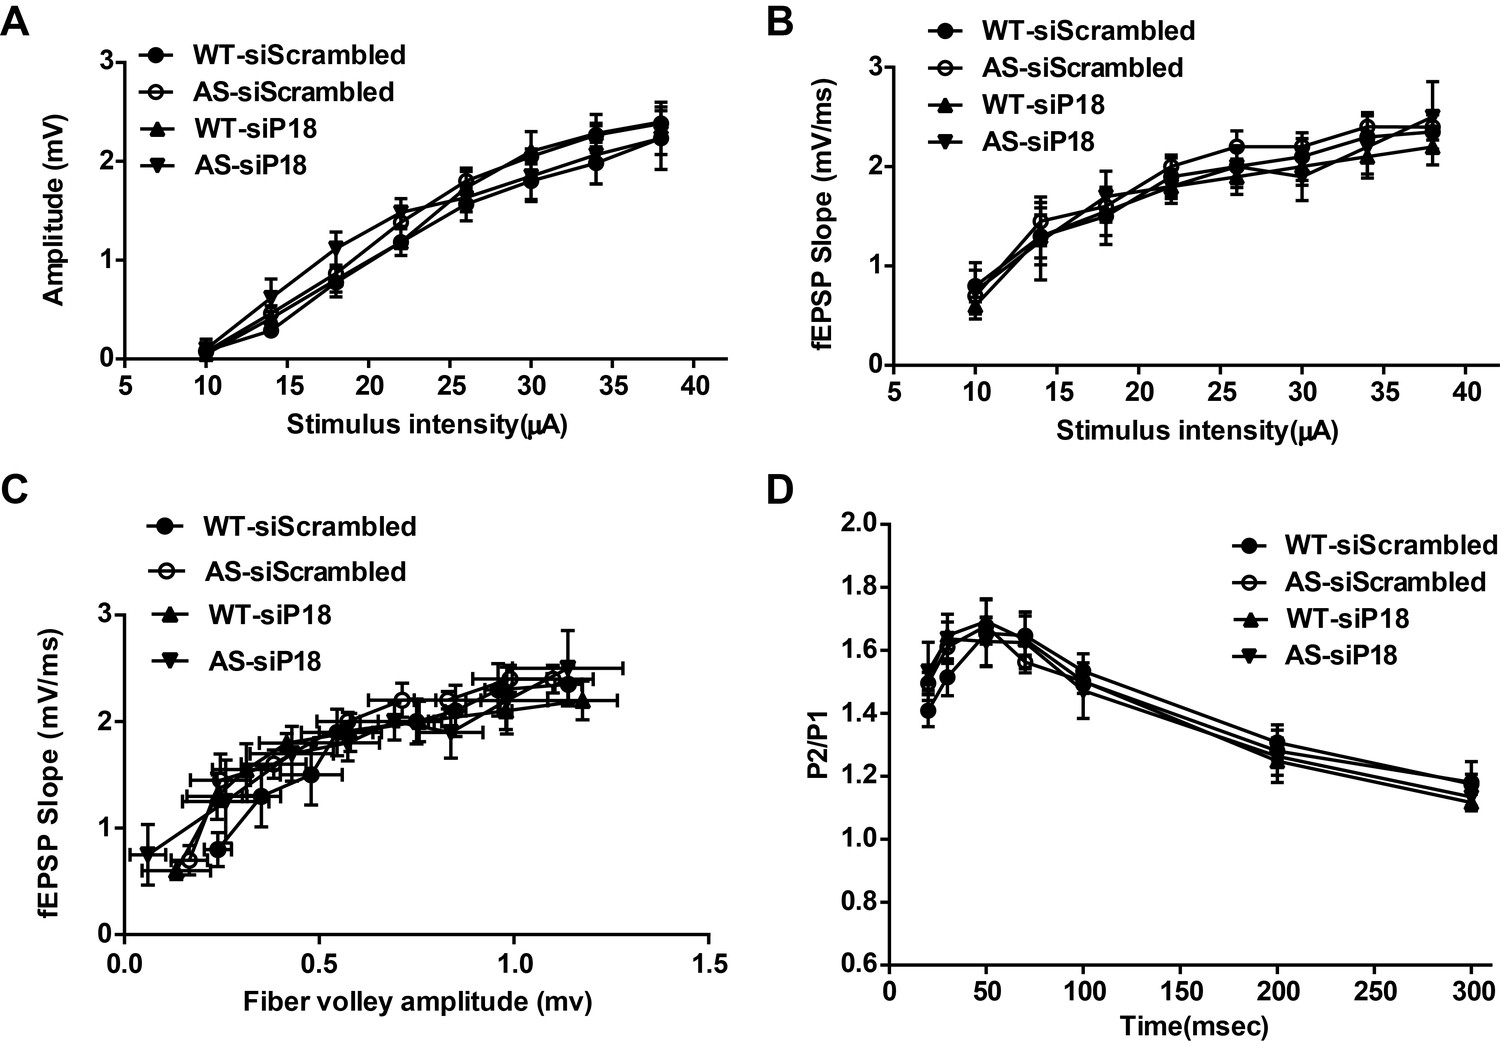
Effects of p18 knockdown in hippocampal CA1 region on input/output curves and paired-pulse facilitation in WT and AS mice.
Related to Figure 6. (A–C) Input/output curves. Amplitudes of field EPSPs (A) and the slope of the field EPSP (B) were determined for various intensities of stimulation. (C) Relationship between the slope of the evoked fEPSPs and the corresponding fiber volley amplitude. The results are means ± SEM; n = 3 mice; there were no significant differences among the four groups of mice. (D) Paired-pulse facilitation. The amplitude of the second response of a paired-pulse was calculated as a percentage of the amplitude of the first response for various inter-pulse intervals. The results are means ± SEM; n = 5 mice; there were no significant differences among the four groups of mice.
Figure 7
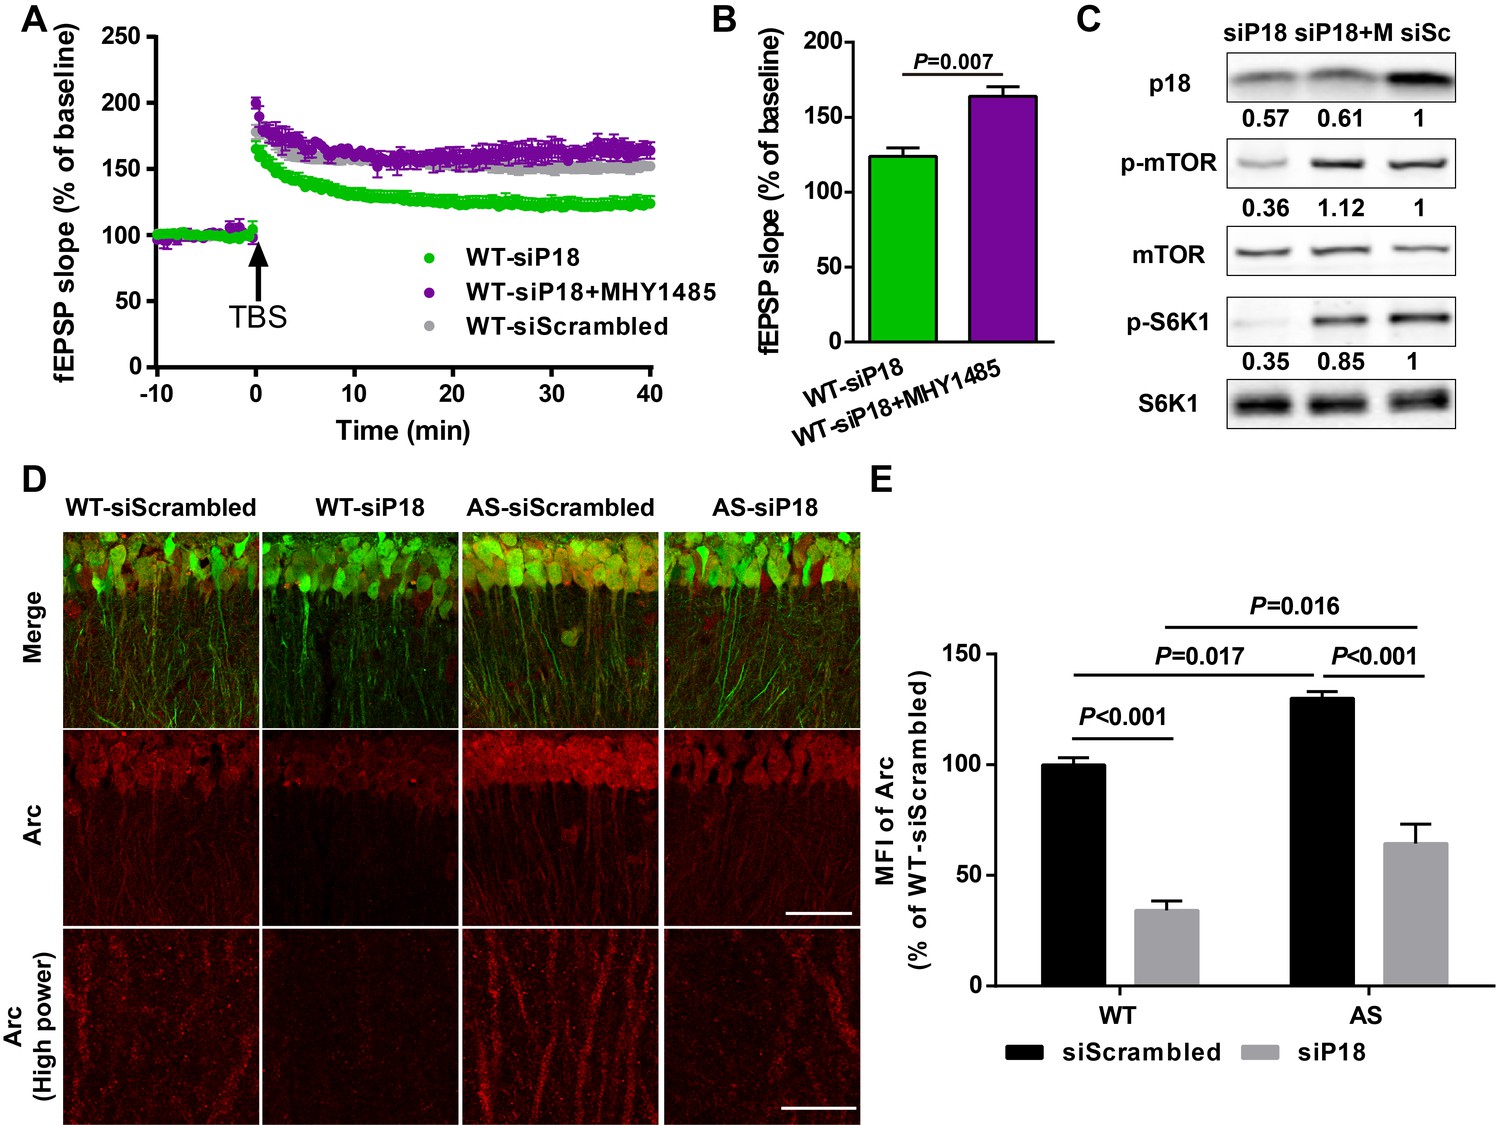
p18 KD impairs LTP in WT neurons as a result of over-inhibition of mTORC1 activity and Arc levels.
(A–C) Effects of MHY1485 treatment on LTP in p18 siRNA-injected WT mice. (A) Slopes of fEPSPs were normalized to the average values recorded during the 10 min baseline. (B) Means ± SEMof fEPSPs measured 40 min after TBS in different groups. N = 3–14 slices from three to eight mice, p=0.007, unpaired t-test. (C) Representative Western blots showing the relative abundance of p18, p-mTOR/mTOR, and p-S6K/S6K in lysates from control siRNA (siSc) or p18 siRNA (siP18)-infected WT hippocampal slices. Slices were treated with or without MHY1485 (M). (D,E) Effects of Ube3a deficiency and p18 KD in the hippocampal CA1 region on Arc expression. (D) Representative images of CA1 pyramidal neurons stained with anti-Arc (red) and -GFP (green) antibodies. Scale bar = 50 µm (low power images) and 10 µm (high power images). (E) Quantitative analysis of the MFI of Arc-immunoreactivty of CA1 pyramidal neurons (means ± SEM of 3 slices from three different animals; p<0.001, WT-siScrambled vs. WT-siP18; p=0.017, WT-siScrambled vs. AS-siScrambled; p<0.001, AS-siScrambled vs. AS-siP18; p=0.016, WT-siP18 vs. AS-siP18, two-way ANOVA with Tukey’s post-hoc analysis). See also Figure 7—source data 1.
-
Figure 7—source data 1
Source data for Figure 7.
- https://doi.org/10.7554/eLife.37993.023
Figure 8 with 1 supplement
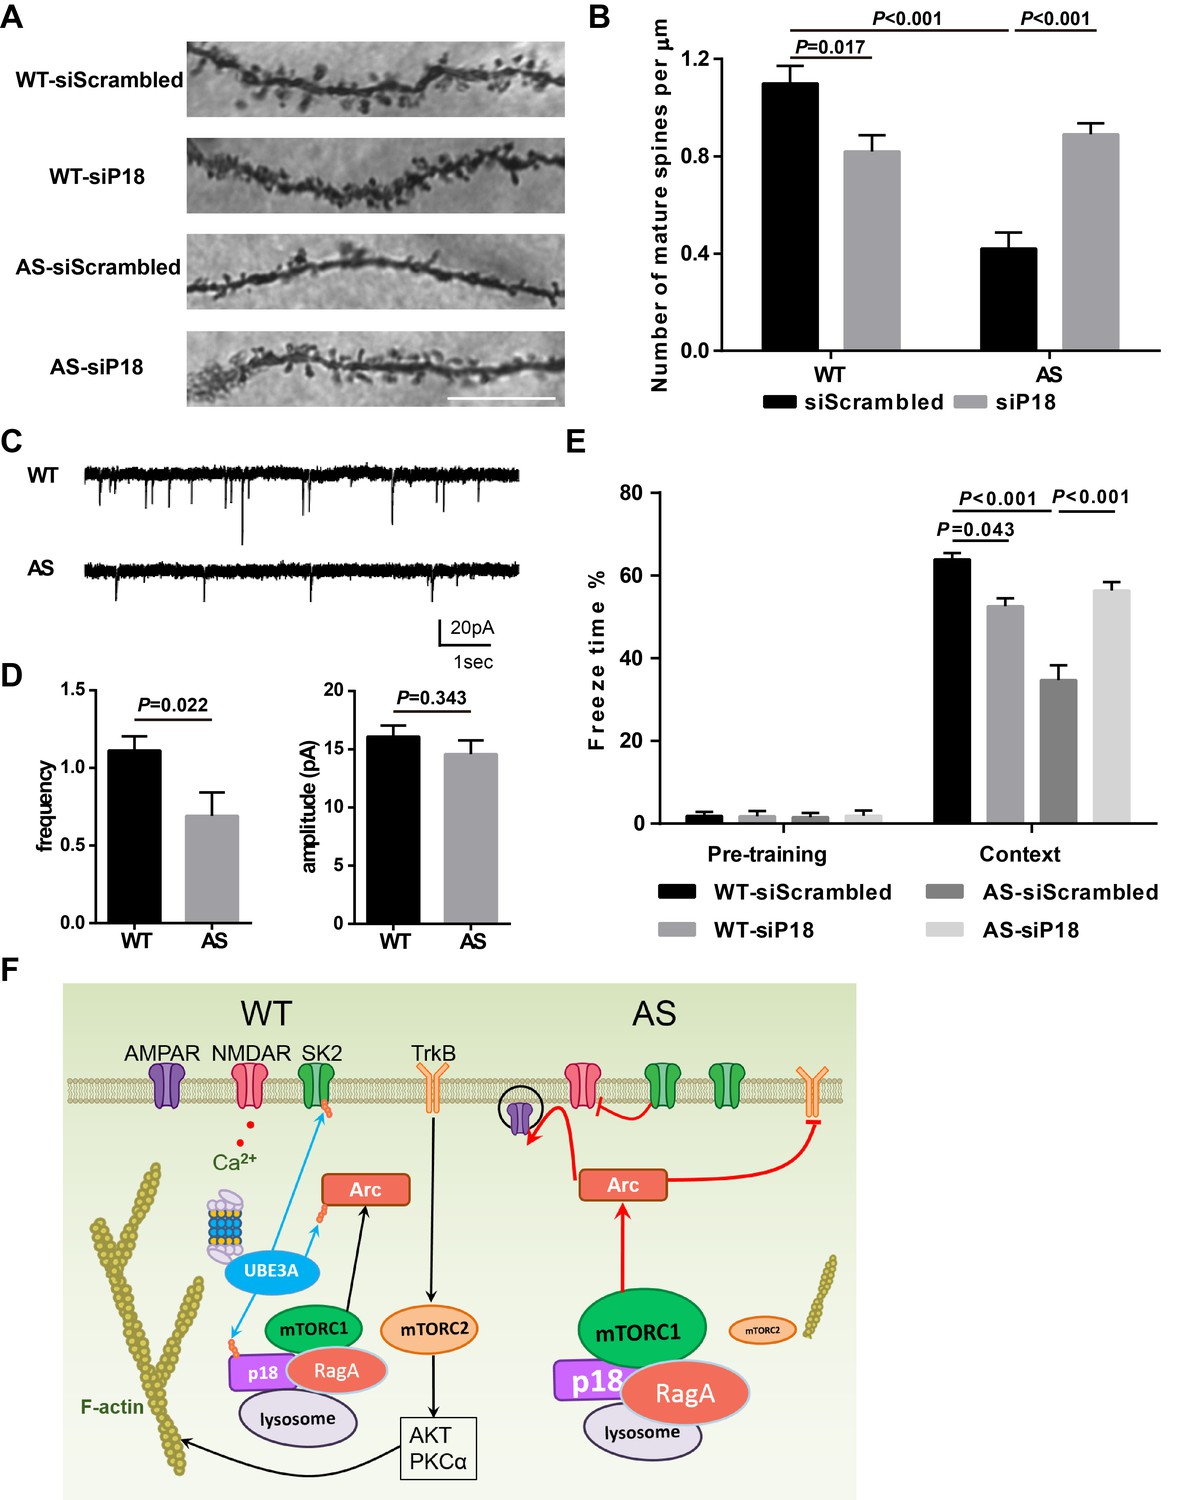
Effects of Ube3a deficiency and p18 KD in hippocampal CA1 region on dendritic spine morphology, mEPSCs, and fear-conditioning memory.
(A) Representative light micrograph images from Golgi-impregnated CA1 pyramidal neurons. Scale bar = 10 µm. (B) Quantitative analysis of mature dendritic spine (multi-head, mushroom, and stubby spines) density shown in (A) (means ±SEM from 10 slices). p=0.017, WT-siScrambled vs. WT-siP18; p<0.001, WT-siScrambled vs. AS-siScrambled; p<0.001, AS-siScrambled vs. AS-siP18, two-way ANOVA with Tukey’s post-test. (C) Representative mEPSC traces recorded in hippocampal neurons from WT and AS slices. Scale bar, 20 pA/1 s. (D) Quantification of mEPSC frequency (p=0.022) and amplitude (p=0.343) from WT (n = 12) and AS (n = 7) mice. Student’s t-test. (E) % freezing for different experimental groups in context memory (means ± SEM of 6–10 mice; p=0.043, WT-siScrambled vs. WT-siP18; p<0.001, WT-siScrambled vs. AS-siScrambled; p<0.001, AS-siScrambled vs. AS-siP18, two-way ANOVA with Tukey’s post-hoc analysis). (F) Model for Ube3a-mediated regulation of synaptic plasticity (see text for details). See also Figure 8—figure supplement 1 and Figure 8—source data 1.
-
Figure 8—source data 1
Source data for Figure 8 and Figure 8—figure supplement 1.
- https://doi.org/10.7554/eLife.37993.026
Figure 8—figure supplement 1
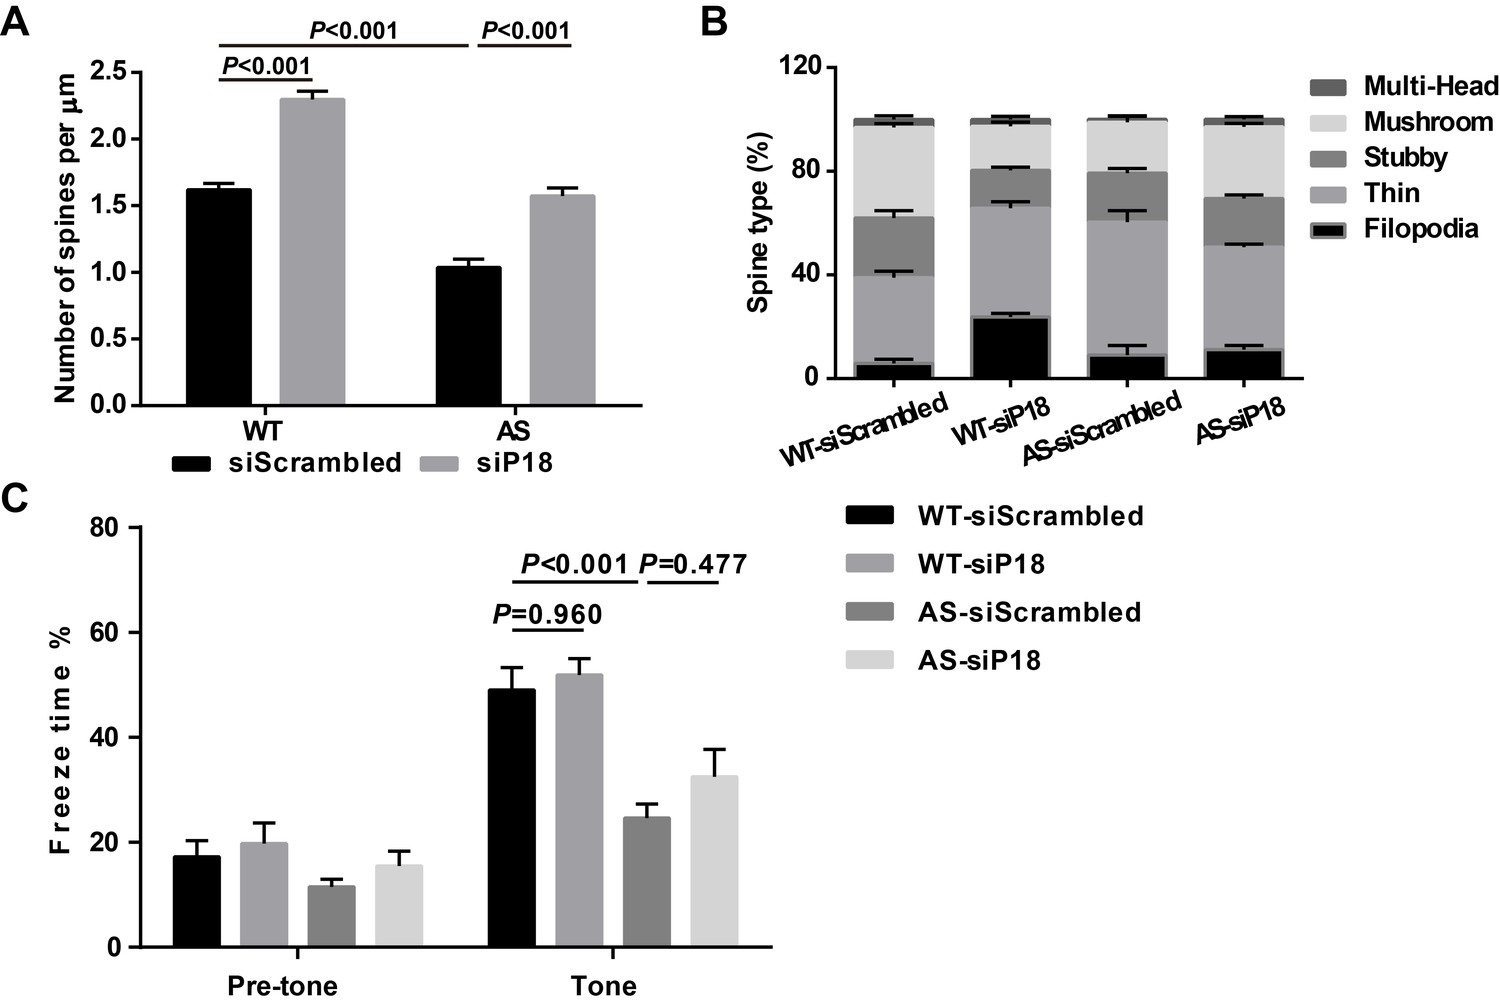
Effects of p18 knockdown in hippocampal CA1 region on dendritic spine number and the proportion of various spine types as well as tone memory in WT and AS mice.
(A) Quantitative analysis of dendritic spine density shown in Figure 7A (means ± SEM from 10 slices). p<0.001, two-way ANOVA with Tukey’s post-test. (B) Effects of p18 downregulation in hippocampal CA1 region on the proportion of various spine types in WT and AS mice. (C) % freezing for different experimental groups in tone memory (means ± SEM of 6–10 mice; p=0.960, WT-siScrambled vs. WT-siP18; p<0.001, WT-siScrambled vs. AS-siScrambled; p=0.477, AS-siScrambled vs. AS-siP18, two-way ANOVA with Tukey’s post-hoc analysis).
Tables
Key resources table
| Reagent type (species) or resource | Designation | Source or reference | Identifiers | Additional information |
|---|---|---|---|---|
| Strain, strain background (Mus musculus) | B6.129S7-Ube3atm1Alb/J | The Jackson Laboratory PMID: 9808466 | MGI: J:50811 | |
| Strain, strain background | Control shRNA Lentiviral Particles | Santa Cruz Biotechnology | sc-108080 | |
| Strain, strain background (Mus musculus) | P18 shRNA Lentiviral Particles | Santa Cruz Biotechnology | sc-108727-V | |
| Strain, strain background | copGFP Control Lentiviral Particles | Santa Cruz Biotechnology | sc-108084 | |
| Strain, strain background | Scrambled AAV9 siRNA Control Virus | Applied Biological Materials | iAAV01509 | |
| Strain, strain background (Mus musculus) | P18 AAV9 siRNA Pooled Virus | Applied Biological Materials | iAAV04811709 | |
| Strain, strain background | Scrambled AAV9 shRNA Control Virus | VectorBuilder | SP1001276 | Custom |
| Strain, strain background (Mus musculus) | P18 AAV9 shRNA Virus | VectorBuilder | SP1001275 | Custom; target sequence: 5'-CGTATGCCTATAGTGCA CTTT-3' |
| Genetic reagent (Homo sapiens) | SMARTpool ON-TARGETplus Human UBE3A siRNA | Dharmacon | L-005137–00 | |
| Genetic reagent | ON-TARGETplus Non-targeting Control Pool | Dharmacon | D-001810–10 | |
| Genetic reagent (Mus musculus) | SMARTpool Accell Mouse Ube3a siRNA | Dharmacon | E-047237–00 | |
| Genetic reagent | Accell Non-targeting Control Pool | Dharmacon | D-001910–10 | |
| Cell line (Cercopithecus aethiops) | COS-1 | ATCC | CRL-1650; RRID:CVCL_0223 | |
| Antibody | anti-UBE3A (mouse monoclonal) | Sigma-Aldrich | E8655; RRID:AB_261956 | (1:2000) |
| Antibody | anti-p18 (rabbit monoclonal) | Cell Signaling Technology | 8975; RRID:AB_10860252 | (1:1000) |
| Antibody | anti-p18 (rabbit polyclonal) | Sigma-Aldrich | HPA002997; RRID:AB_1845531 | (1:200) |
| Antibody | anti-p14 (rabbit monoclonal) | Cell Signaling Technology | 8145; RRID:AB_10971636 | (1:1000) |
| Antibody | anti-MP1 (rabbit monoclonal) | Cell Signaling Technology | 8168; RRID:AB_10949501 | (1:1000) |
| Antibody | anti-LAMTOR4 (rabbit monoclonal) | Cell Signaling Technology | 12284 | (1:500) |
| Antibody | anti-RagA (rabbit monoclonal) | Cell Signaling Technology | 4357; RRID:AB_10545136 | (1:1000) |
| Antibody | anti-RagB (rabbit monoclonal) | Cell Signaling Technology | 8150; RRID:AB_11178806 | (1:1000) |
| Antibody | anti-RagC (rabbit monoclonal) | Cell Signaling Technology | 5466; RRID:AB_10692651 | (1:1000) |
| Antibody | anti-ubiquitin (mouse monoclonal) | Enzo Life Sciences | BML-PW8810; RRID:AB_10541840 | (1:800) |
| Antibody | anti-Flag (mouse monoclonal) | Sigma-Aldrich | F1804; RRID:AB_262044 | (1:1000) |
| Antibody | anti-LAMP2 (rat monoclonal) | Abcam | ab13524; RRID:AB_2134736 | (1:200) |
| Antibody | anti-LAMP1 (mouse monoclonal) | Abcam | ab25630; RRID:AB_470708 | (1:20) |
| Antibody | anti-p-mTOR Ser2448 (rabbit polyclonal) | Cell Signaling Technology | 2971; RRID:AB_330970 | (1:1000) |
| Antibody | anti-mTOR (rabbit polyclonal) | Cell Signaling Technology | 2972; RRID:AB_330978 | (1:1000) |
| Antibody | anti-p-S6K1 Thr389 (rabbit polyclonal) | Cell Signaling Technology | 9205; RRID:AB_330944 | (1:1000) |
| Antibody | anti-S6K1 (rabbit polyclonal) | Cell Signaling Technology | 9202; RRID:AB_331676 | (1:1000) |
| Antibody | anti-p-S6 Ser240/244 (rabbit polyclonal) | Cell Signaling Technology | 2215; RRID:AB_331682 | (1:1000) |
| Antibody | anti-S6 (rabbit monoclonal) | Cell Signaling Technology | 2217; RRID:AB_331355 | (1:1000) |
| Antibody | anti-p-PKC (rabbit polyclonal) | Cell Signaling Technology | 9371; RRID:AB_2168219 | (1:1000) |
| Antibody | anti-PKCα (rabbit polyclonal) | Cell Signaling Technology | 2056; RRID:AB_2284227 | (1:1000) |
| Antibody | anti-p-4EBP1 Ser65 (rabbit polyclonal) | Cell Signaling Technology | 9451; RRID:AB_330947 | (1:1000) |
| Antibody | anti-4EBP1 (rabbit monoclonal) | Cell Signaling Technology | 9644; RRID:AB_2097841 | (1:1000) |
| Antibody | anti-p-AKT Ser473 (rabbit monoclonal) | Cell Signaling Technology | 4060; RRID:AB_2315049 | (1:1000) |
| Antibody | anti-AKT (rabbit polyclonal) | Cell Signaling Technology | 9272; RRID:AB_329827 | (1:1000) |
| Antibody | anti-Raptor (mouse monoclonal) | EMD Millipore | 05–1470; RRID:AB_10615925 | (1:500) |
| Antibody | anti-Rictor (rabbit polyclonal) | Bethyl Laboratories | A300-459A; RRID:AB_2179967 | (1:200) |
| Antibody | anti-NeuN (mouse monoclonal) | EMD Millipore | MAB377; RRID:AB_2298772 | (1:100) |
| Antibody | anti-PSD95 (mouse monoclonal) | Thermo Fisher Scientific | MA1-045; RRID:AB_325399 | (1:200) |
| Antibody | anti-Cathepsin B (mouse monoclonal) | EMD Millipore | IM27L; RRID:AB_2274848 | (1:400) |
| Antibody | anti-COXIV (rabbit monoclonal) | Cell Signaling Technology | 4850; RRID:AB_2085424 | (1:1000) |
| Antibody | anti-GFP (chicken polyclonal) | Thermo Fisher Scientific | A10262; RRID:AB_2534023 | (1:500) |
| Antibody | anti-GAPDH (mouse monoclonal) | EMD Millipore | MAB374; RRID:AB_2107445 | (1:1000) |
| Antibody | anti-β-actin (mouse monoclonal) | Sigma-Aldrich | A5441; RRID:AB_476744 | (1:10,000) |
| Antibody | Goat anti-rabbit IgG IRDye 680RD | LI-COR Biosciences | 926–68071 | (1:10,000) |
| Antibody | Goat anti-mouse IgG IRDye 800CW | LI-COR Biosciences | 926–32210 | (1:10,000) |
| Antibody | Alexa 488- secondaries | Molecular Probes | (1:400) | |
| Antibody | Alexa 594- or 633- secondaries | Molecular Probes | (1:200) | |
| Recombinant DNA reagent | HA-tagged wild-type Ube3a | Addgene PMID: 9497376 | 8648 | |
| Recombinant DNA reagent | HA-tagged Ube3a- C833A | Addgene PMID: 9497376 | 8649 | |
| Recombinant DNA reagent | HA-p18 | Addgene PMID: 22980980 | 42338 | |
| Recombinant DNA reagent | HA-p18G2A | Addgene PMID: 22980980 | 42327 | |
| Recombinant DNA reagent | Flag-p18 | Addgene PMID: 22980980 | 42331 | |
| Recombinant DNA reagent | Flag-p18∆K | This paper | N/A | Custom Gene Synthesis from Integrated DNA Technologies (all lysine residues in p18 mutated into arginine) |
| Recombinant DNA reagent | Flag-p18K20R | This paper | N/A | Site-directed mutagenesis using a QuikChange II site-directed mutagenesis kit (Agilent). The mutation was confirmed by sequencing. |
| Recombinant DNA reagent | Flag-p18K31R | This paper | N/A | Same as above |
| Recombinant DNA reagent | Flag-p18K60R | This paper | N/A | Same as above |
| Recombinant DNA reagent | Flag-p18K103/104R | This paper | N/A | Same as above |
| Recombinant DNA reagent | Flag-p18K151R | This paper | N/A | Same as above |
| Recombinant DNA reagent | His-ubiquitin | Addgene PMID: 21183682 | 31815 | |
| Peptide, recombinant protein | Recombinant human p18 | CUSABIO | CSB-EP757561XBF | |
| Commercial assay or kit | E6AP (UBE3A) Ubiquitin Ligase Kit | Boston Biochem | K-240 | |
| Commercial assay or kit | FD Rapid GolgiStain Kit | FD Neurotechnologies | PK401 | |
| Chemical compound, drug | MG132 | EMD Millipore | 474790 | 10 µM |
| Chemical compound, drug | Bafilomycin A1 | Sigma-Aldrich | B1793 | 100 nM |
| Chemical compound, drug | MHY1485 | EMD Millipore | 500554 | 2 µM |
| Chemical compound, drug | Rhodamine Phalloidin | Molecular Probes | R415 | |
| Software, algorithm | ImageJ | https://imagej.nih.gov/ij/ | RRID:SCR_003070 | |
| Software, algorithm | Prism 6 | GraphPad Software | RRID:SCR_002798 |
Table 1
Antibodies, chemicals, and plasmids used in this study
https://doi.org/10.7554/eLife.37993.027| Reagent or resource | Source | Identifier |
|---|---|---|
| Antibodies | ||
| Mouse monoclonal anti-UBE3A (clone E6AP-330) | Sigma-Aldrich | Cat#E8655 |
| Rabbit monoclonal anti-p18 | Cell Signaling Technology | Cat#8975 |
| Rabbit polyclonal anti-p18 | Sigma-Aldrich | Cat#HPA002997 |
| Rabbit monoclonal anti-p14 | Cell Signaling Technology | Cat#8145 |
| Rabbit monoclonal anti-MP1 | Cell Signaling Technology | Cat#8168 |
| Rabbit monoclonal anti-LAMTOR4 | Cell Signaling Technology | Cat#12284 |
| Rabbit monoclonal anti-RagA | Cell Signaling Technology | Cat#4357 |
| Rabbit monoclonal anti-RagB | Cell Signaling Technology | Cat#8150 |
| Rabbit monoclonal anti-RagC | Cell Signaling Technology | Cat#5466 |
| Mouse monoclonal anti-ubiquitin | Enzo Life Sciences | Cat#BML-PW8810 |
| Mouse monoclonal anti-Flag | Sigma-Aldrich | Cat#F1804 |
| Rat monoclonal anti-LAMP2 | Abcam | Cat#ab13524 |
| Mouse monoclonal anti-LAMP1 | Abcam | Cat#ab25630 |
| Rabbit polyclonal anti-p-mTOR Ser2448 | Cell Signaling Technology | Cat#2971 |
| Rabbit polyclonal anti-mTOR | Cell Signaling Technology | Cat#2972 |
| Rabbit polyclonal anti-p-S6K1 Thr389 | Cell Signaling Technology | Cat#9205 |
| Rabbit polyclonal anti-S6K1 | Cell Signaling Technology | Cat#9202 |
| Rabbit polyclonal anti-p-S6 Ser240/244 | Cell Signaling Technology | Cat#2215 |
| Rabbit monoclonal anti-S6 | Cell Signaling Technology | Cat#2217 |
| Rabbit polyclonal anti-p-PKC | Cell Signaling Technology | Cat#9371 |
| Rabbit polyclonal anti-PKCα | Cell Signaling Technology | Cat#2056 |
| Rabbit polyclonal anti-p-4EBP1 Ser65 | Cell Signaling Technology | Cat#9451 |
| Rabbit monoclonal anti-4EBP1 | Cell Signaling Technology | Cat#9644 |
| Rabbit monoclonal anti-p-AKT Ser473 | Cell Signaling Technology | Cat#4060 |
| Rabbit polyclonal anti-AKT | Cell Signaling Technology | Cat#9272 |
| Mouse monoclonal anti-Raptor (clone 1H6.2) | EMD Millipore | Cat#05–1470 |
| Rabbit polyclonal anti-Rictor | Bethyl Laboratories | Cat#A300-459A |
| Mouse monoclonal anti-NeuN (clone A60) | EMD Millipore | Cat#MAB377 |
| Mouse monoclonal anti-PSD95 (clone 6G6-1C9) | Thermo Fisher Scientific | Cat#MA1-045 |
| Mouse monoclonal anti-Cathepsin B (clone CA10) | EMD Millipore | Cat#IM27L |
| Rabbit monoclonal anti-COXIV | Cell Signaling Technology | Cat#4850 |
| Chicken polyclonal anti-GFP | Thermo Fisher Scientific | Cat#A10262 |
| Mouse monoclonal anti-GAPDH (clone 6C5) | EMD Millipore | Cat#MAB374 |
| Mouse monoclonal anti-β-actin (clone AC-15) | Sigma-Aldrich | Cat#A5441 |
| Goat anti-rabbit IgG IRDye 680RD | LI-COR Biosciences | Cat#926–68071 |
| Goat anti-mouse IgG IRDye 800CW | LI-COR Biosciences | Cat#926–32210 |
| Goat anti-mouse IgG AlexaFluor 488 | Invitrogen | Cat#A-11029 |
| Goat anti-rabbit IgG AlexaFluor 594 | Invitrogen | Cat#A-11037 |
| Goat anti-rat IgG AlexaFluor 488 | Invitrogen | Cat#A-11006 |
| Goat anti-rat IgG AlexaFluor 594 | Invitrogen | Cat#A-21209 |
| Goat anti-rabbit IgG AlexaFluor 488 | Invitrogen | Cat#A-11008 |
| Goat anti-chicken IgY AlexaFluor 488 | Invitrogen | Cat#A-11039 |
| Goat anti-mouse IgG AlexaFluor 633 | Invitrogen | Cat#A-21052 |
| Goat anti-rabbit IgG AlexaFluor 633 | Invitrogen | Cat#A-21070 |
| Chemicals | ||
| MG132 | EMD Millipore | Cat#474790 |
| Bafilomycin A1 | Sigma-Aldrich | Cat#B1793 |
| MHY1485 | EMD Millipore | Cat#500554 |
| Recombinant DNA | ||
| HA-tagged wild-type Ube3a | (Talis et al., 1998) | Addgene #8648 |
| HA-tagged Ube3a-C833A | (Talis et al., 1998) | Addgene #8649 |
| HA-p18 | (Bar-Peled et al., 2012) | Addgene #42338 |
| HA-p18G2A | (Bar-Peled et al., 2012) | Addgene #42327 |
| Flag-p18 | (Bar-Peled et al., 2012) | Addgene #42331 |
| Flag-p18∆K | This paper | N/A |
| Flag-p18K20R | This paper | N/A |
| Flag-p18K31R | This paper | N/A |
| Flag-p18K60R | This paper | N/A |
| Flag-p18K103/104R | This paper | N/A |
| Flag-p18K151R | This paper | N/A |
| His-ubiquitin | (Young et al., 2011) | Addgene #31815 |
Additional files
-
Transparent reporting form
- https://doi.org/10.7554/eLife.37993.028
Download links
A two-part list of links to download the article, or parts of the article, in various formats.
Downloads (link to download the article as PDF)
Open citations (links to open the citations from this article in various online reference manager services)
Cite this article (links to download the citations from this article in formats compatible with various reference manager tools)
UBE3A-mediated p18/LAMTOR1 ubiquitination and degradation regulate mTORC1 activity and synaptic plasticity
eLife 7:e37993.
https://doi.org/10.7554/eLife.37993


