Mammal communities are larger and more diverse in moderately developed areas
- North Carolina Museum of Natural Sciences, United States
- North Carolina State University, United States
- Oregon Department of Fish and Wildlife, United States
- Smithsonian Conservation Biology Institute, United State
- The Nature Conservancy, Virginia
- West Virginia University, United States
- University of Montana, United States
Figures
Figure 1
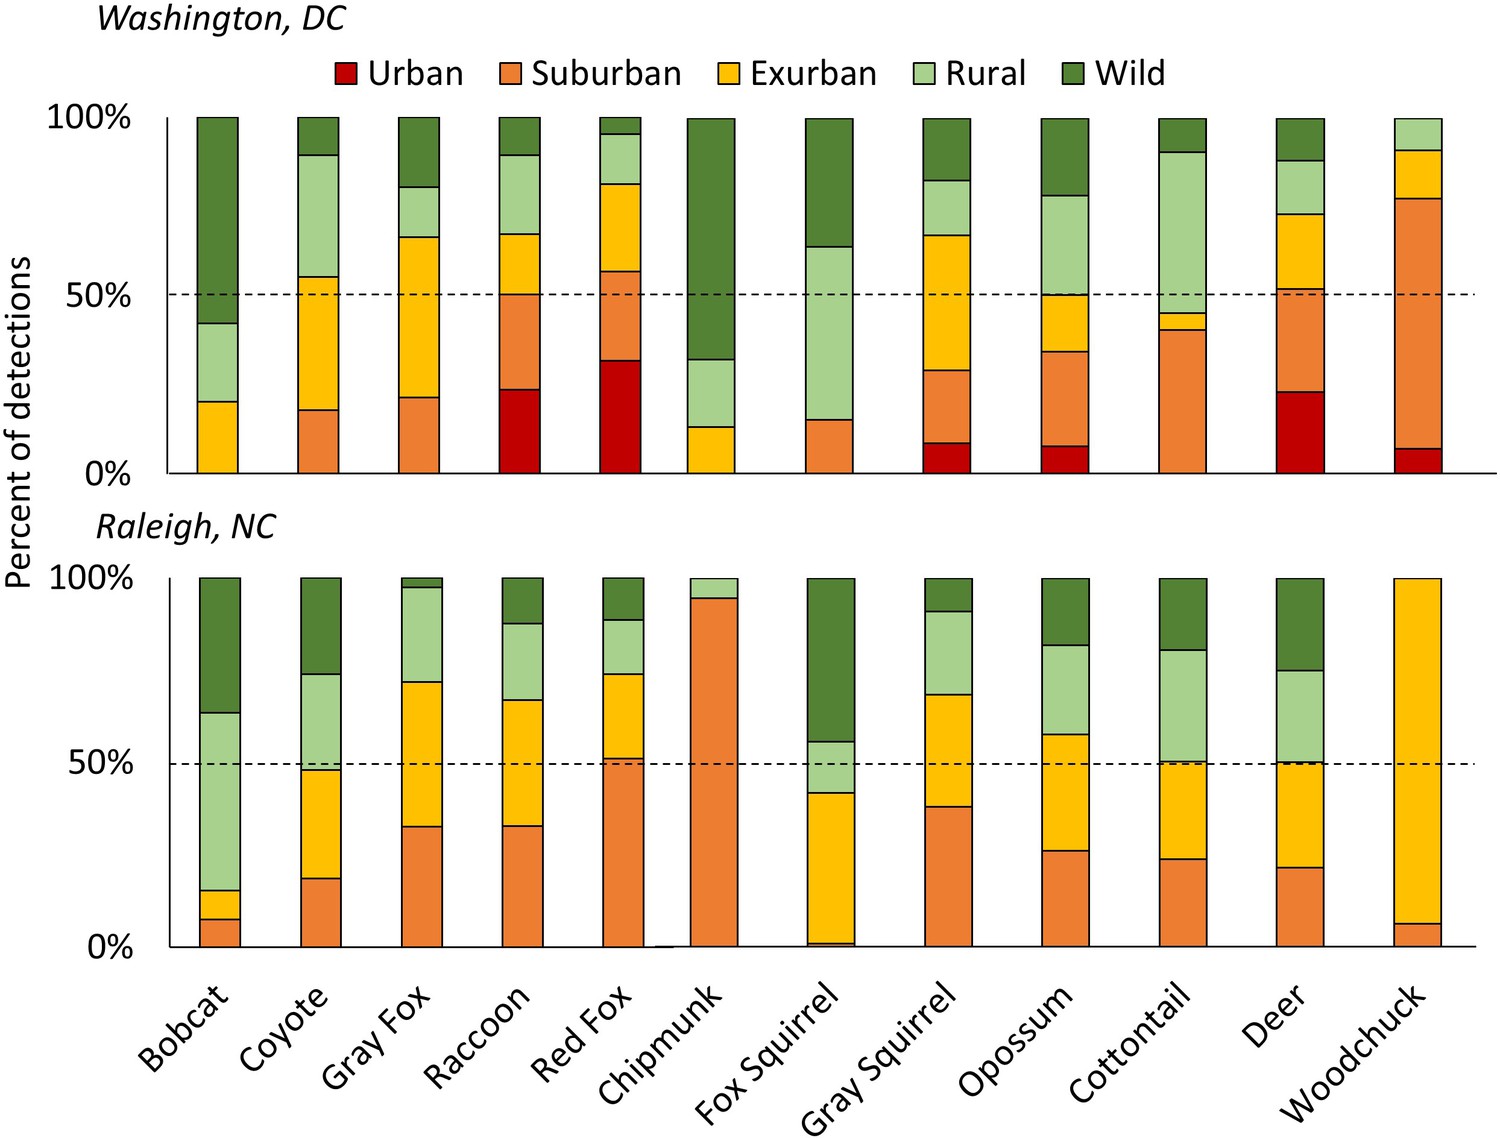
The percent of detections for each species of carnivores (left) and herbivores (right) in each development level along the urban-wild gradient in Washington, DC and Raleigh, NC, USA accounting for the effort (i.e. camera nights) within each level, sorted from lowest to highest proportion urban/suburban in DC.
The dashed line shows 50% of total detections. Some species were predominantly rural/wild (i.e. bobcats and fox squirrels) while others were mainly detected in urban/suburban habitats (i.e. red fox, raccoon). Patchy distributions at different gradient levels were seen for species at the edge of their ranges (i.e. chipmunks and woodchucks in Raleigh). Urban habitats were not sampled in Raleigh.
Figure 2 with 3 supplements

Mean Shannon diversity and total detection rate along a gradient of housing density in two cities, Washington, DC and Raleigh, NC USA taken from camera traps.
Bars show 95% confidence intervals, lines are fit using a generalized additive model with a polynomial term. Diversity peaked at intermediate levels of urbanization (exurban in DC and suburban in Raleigh). Total detection rate peaked at the urban level in DC and exurban level in Raleigh.
Figure 2—figure supplement 1
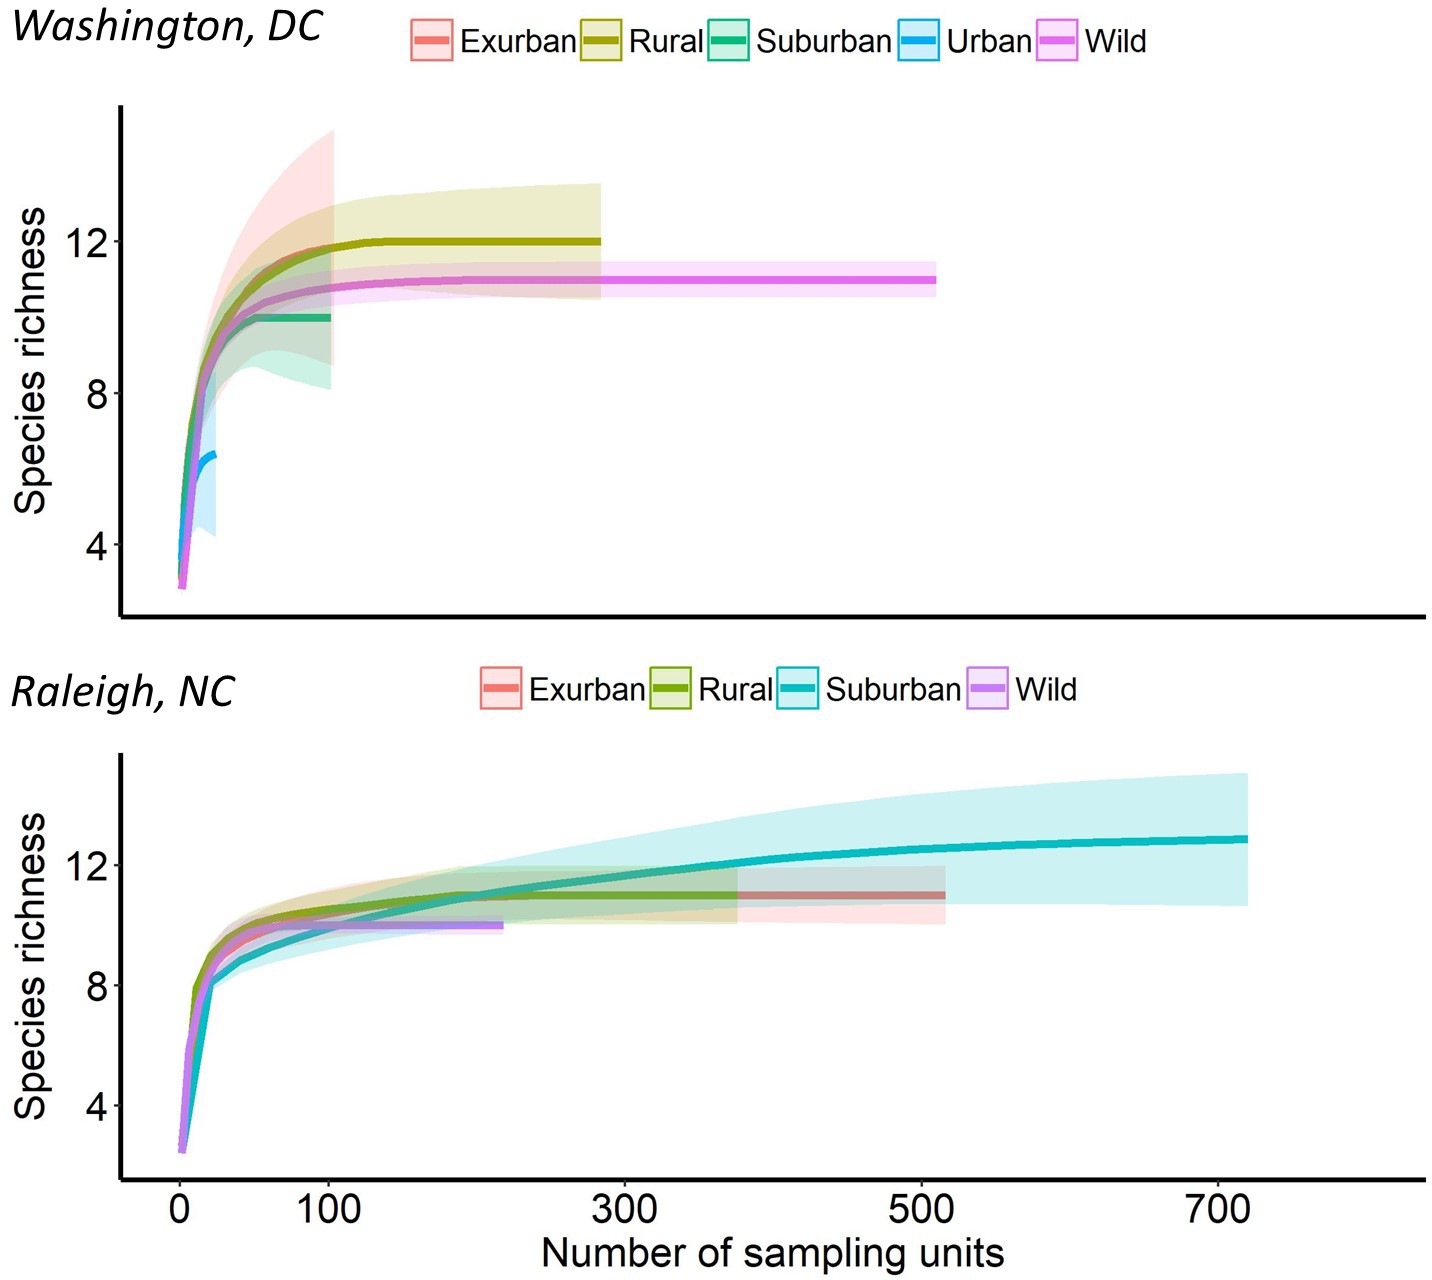
Rarefaction curves estimating species richness in five development levels (urban, suburban, exurban, rural, wild) in two cities, Washington, DC and Raleigh, NC, USA, using camera traps between 2012 and 2016.
Shaded areas represent 95% confidence intervals.
Figure 2—figure supplement 2
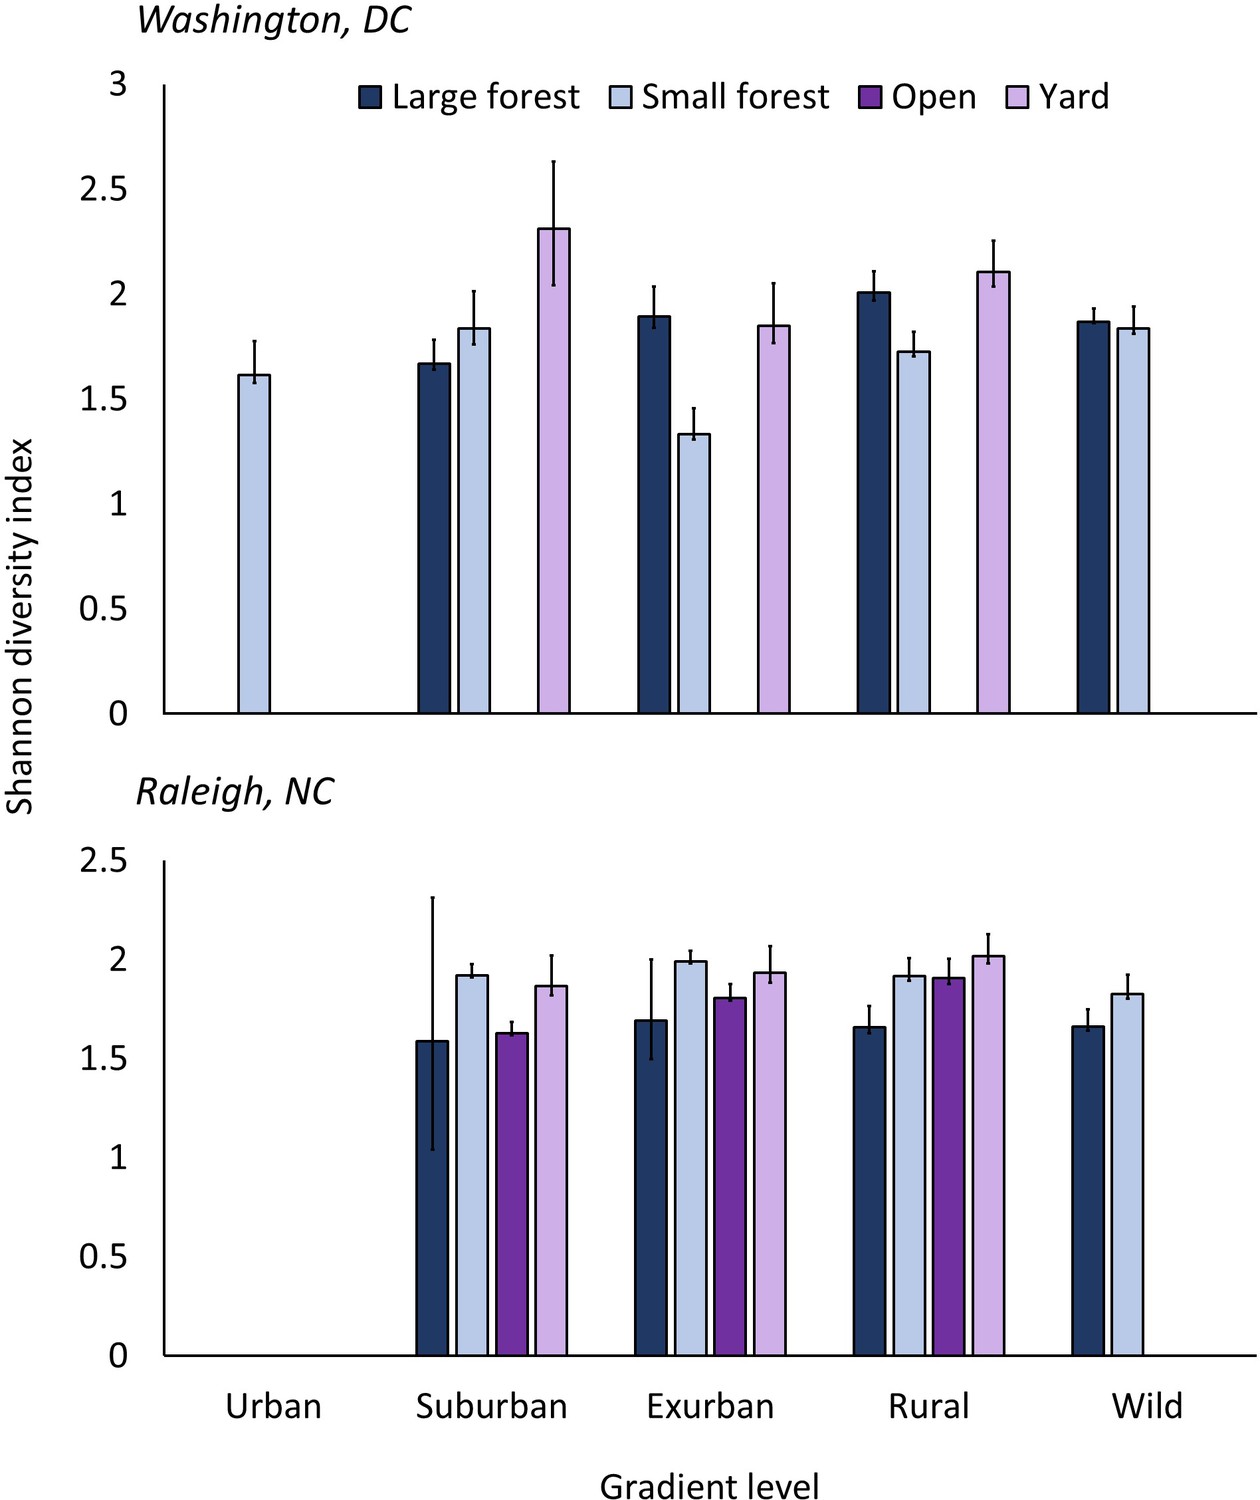
Shannon diversity index estimates from camera trapping in two cities, Washington, DC and Raleigh, NC, USA, across five development levels (urban, suburban, exurban, rural, wild).
Diversity is separated by four plot types: large forest, small forest, open and residential yard. Data were collected using camera traps between 2012 and 2016. Bars show 95% confidence intervals. Urban small forests were not sampled in Raleigh, open areas were not sampled in DC and urban/wild yards, urban open areas and urban large forests were not sampled in either city.
Figure 2—figure supplement 3
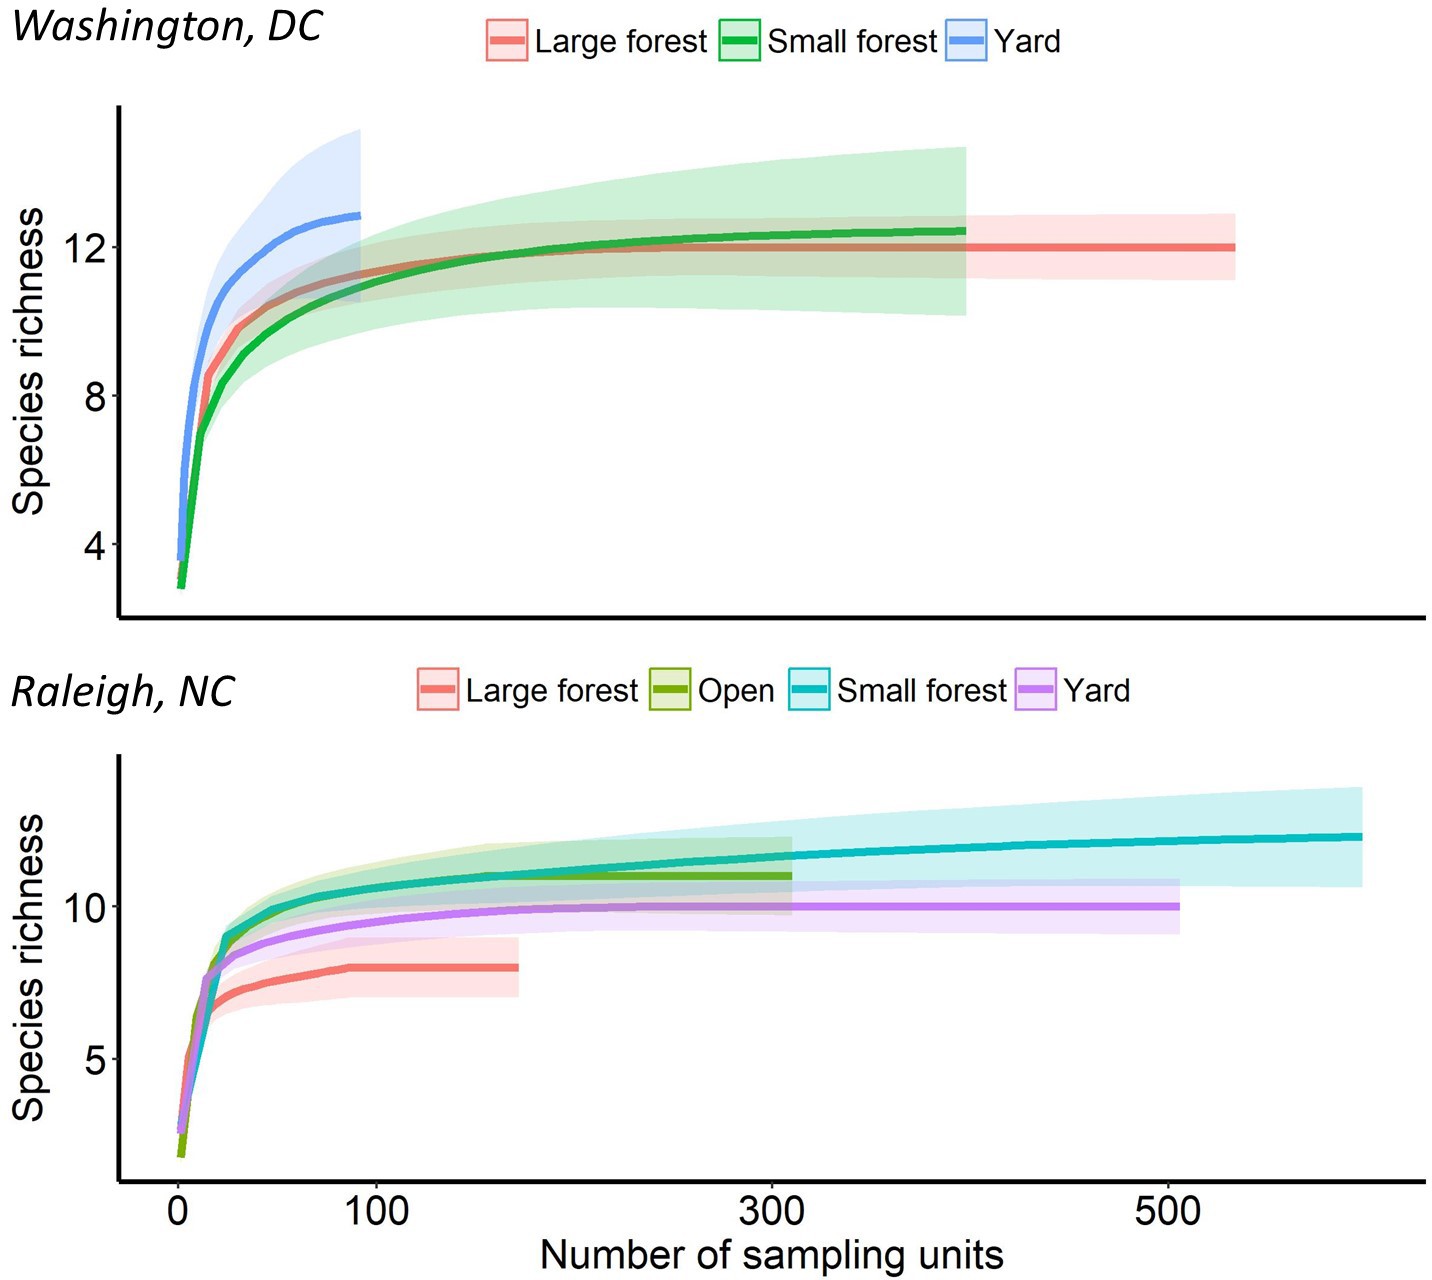
Rarefaction curve estimating species richness in three plot types (residential yard, small forest, large forest) in two cities, Washington, DC and Raleigh, NC, USA, using camera traps between 2012 and 2016.
Shaded areas represent 95% confidence intervals.
Figure 3 with 1 supplement

Comparison of carnivore (i.e.bobcat, coyote, gray fox, red fox) occupancy probabilities at each developmental level in two cities with global values from Rich et al.
(Rich et al., 2017), representing 93 carnivores from 13 protected areas on five continents (Global Wildlands). Each box for our dataset represents the distribution of marginal occupancy probabilities for each of four carnivore species in that city (i.e. four probabilities). The boxes for Global Wildlands represent the distribution of marginal occupancy probabilities for 93 species. We found no statistically significant differences between any habitat levels in our study or between our study and global wildland occupancy probabilities but noted a decreasing trend in occupancy from urban-wild. We included only predators from Rich et al. (2017) and removed omnivores (i.e. raccoon, coati) to better reflect our data.
Figure 3—figure supplement 1

Occupancy estimates from single season occupancy model for four carnivore species (bobcat, coyote, gray fox and red fox) in five development levels (urban, suburban, exurban, rural, wild) in two cities, Washington, DC and Raleigh, NC, USA, using camera traps between 2012 and 2016.
Bars represent 95% credible intervals. Uncertainty was high with no significant differences between the habitats for any species.
Additional files
-
Supplementary file 1
Effort expressed as camera nights with spatial replicates in parentheses for camera traps run in Washington, DC and Raleigh, NC from 2012 to 2016 between different levels along the urban-wild gradient around each city.
- https://doi.org/10.7554/eLife.38012.010
-
Supplementary file 2
Covariates used in the detection rate and occupancy analyses.
- https://doi.org/10.7554/eLife.38012.011
-
Supplementary file 3
Results of goodness-of-fit tests for occupancy and Poisson count models assessed by posterior predictive check with adequate fit if 0.1 < pB < 0.9.
- https://doi.org/10.7554/eLife.38012.012
-
Supplementary file 4
Calculating goodness of fit statistics
- https://doi.org/10.7554/eLife.38012.013
-
Supplementary file 5
Results of a Poisson regression to determine differences in detection rate between the wild gradient level (reference level) and all other levels of the development gradient (above dotted line).
Also presented are results of a separate Poisson regression to determine differences in detection rate between yards and all other plot types. Significant results (95% CIs not overlapping zero) are in bold.
- https://doi.org/10.7554/eLife.38012.014
-
Supplementary file 6
Results of Poisson regression for single species using camera trapping over two cities between 2012–2016.
Posterior mean and posterior standard deviation for each predictor are shown with bold entries indicating predictors with 95% credible intervals that did not overlap zero. Predictors in bold were used for modeling occupancy for that species. Housing density was used as a predictor in all occupancy models, regardless of whether it was significant in the preliminary count analysis.
- https://doi.org/10.7554/eLife.38012.015
-
Supplementary file 7
Beta coefficients and 95% credible intervals (parentheses) for an occupancy model based on camera trapping data in Washington, DC, USA and Raleigh, NC, USA from 2012 to 2016.
Those coefficients with 95% CIs not overlapping zero are shown in bold.
- https://doi.org/10.7554/eLife.38012.016
-
Transparent reporting form
- https://doi.org/10.7554/eLife.38012.017
Download links
A two-part list of links to download the article, or parts of the article, in various formats.
Downloads (link to download the article as PDF)
Open citations (links to open the citations from this article in various online reference manager services)
Cite this article (links to download the citations from this article in formats compatible with various reference manager tools)
Mammal communities are larger and more diverse in moderately developed areas
eLife 7:e38012.
https://doi.org/10.7554/eLife.38012


