Decoupling the impact of microRNAs on translational repression versus RNA degradation in embryonic stem cells
- University of California, San Francisco, United States
Figures
Figure 1 with 1 supplement
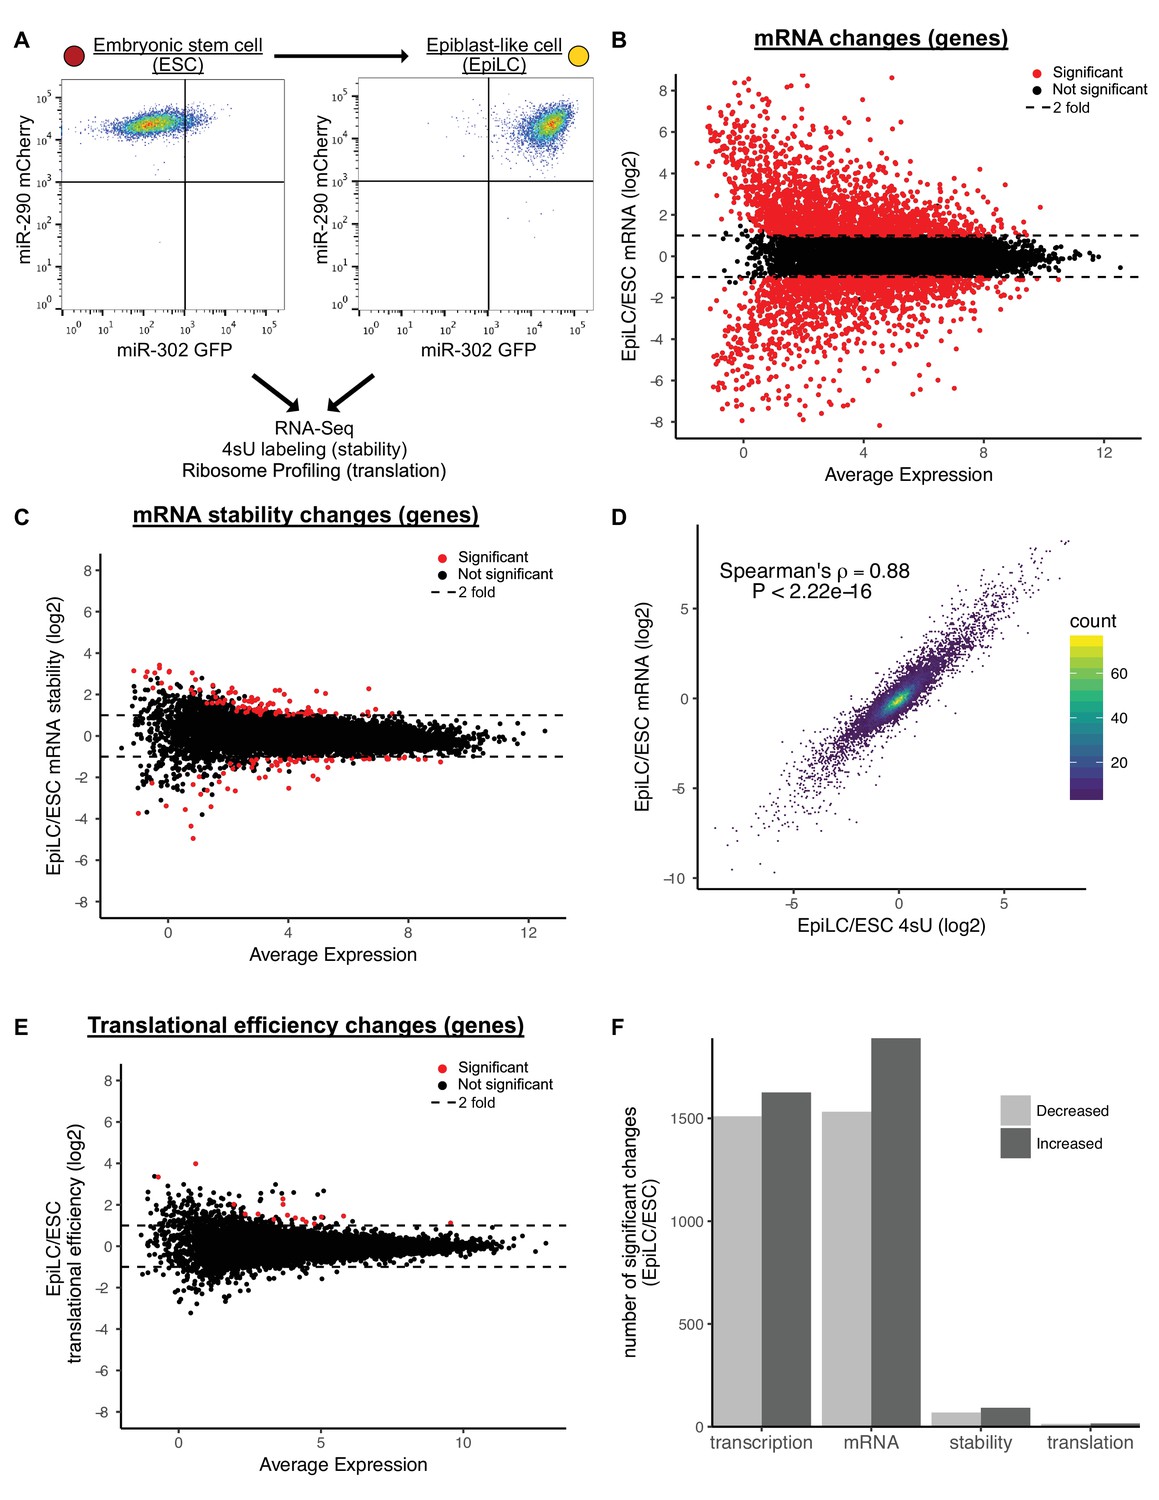
Transcriptional changes drive expression changes during the ESC to EpiLC transition.
(A) Flow cytometry of the transition from naive embryonic stem cells (ESCs) (miR-302 GFP-, miR-290 mCherry+) to primed epiblast-like cells (EpiLCs) (miR-302 GFP+, miR-290 mCherry+). (B) MA plot of mRNA changes during the ESC to EpiLC transition. Significant changes are shown as red dots (Adjusted p value < 0.05 and |log2 fold change| > 1) in B, C, E. Dashed lines indicated a twofold change. (C) MA plot of mRNA stability changes during the ESC to EpiLC transition. (D) Correlation between changes in nascent transcription (4sU-labeled mRNA) and changes in mRNA levels during the ESC to EpiLC transition. The p value was calculated with correlation significance test. (E) MA plot of translational efficiency (TE) changes during the ESC to EpiLC transition. (F) The number of significant increases or decreases in transcription, mRNA levels, mRNA stability, and translational efficiency during the ESC to EpiLC transition. n = 3 for each ESC and EpiLC seq experiment. See also Figure 1—figure supplement 1.
Figure 1—figure supplement 1
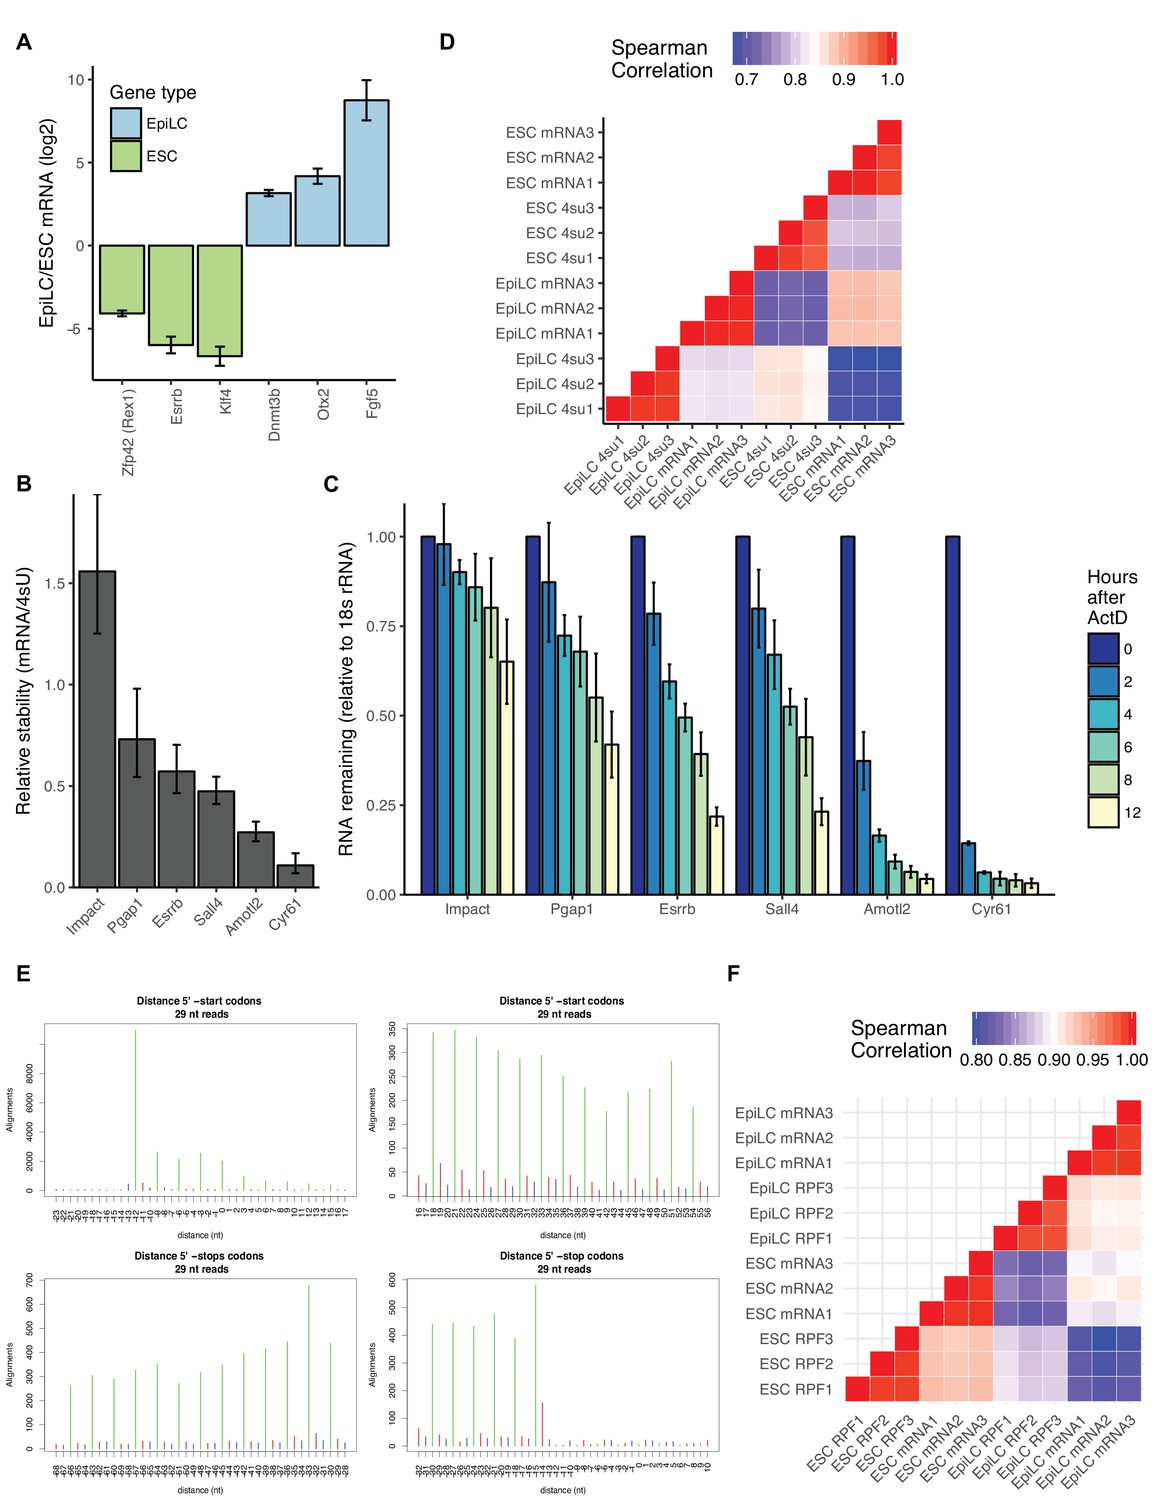
Validation of differentiation, mRNA stability measurements, and ribosome footprinting.
(A) Change in expression of key naive and primed genes during the ESC to EpiLC transition based on RNA-Seq. Error bars represent 95% confidence interval. (B) Relative mRNA stability of candidate genes based on the ratio of mRNA/4sU. Error bars represent 95% confidence interval. (C) Validation of 4sU-Seq measured mRNA stabilities with RT-qPCR time course after blocking transcription with Actinomycin D. Values are normalized to 18S rRNA and their 0 hr timepoint. n = 3 for wild-type and n = 6 (3 replicates of each Ddx6 KO line), error bars are standard deviation. (D) Spearman correlation of log2(counts per million) of ESC and EpiLC RNA-Seq and 4sU-Seq replicates. (E) Ribosome profiling shows characteristic phasing for ribosome protected footprints. (F) Spearman correlation of log2(counts per million) of ESC and EpiLC RNA-Seq and ribosome protected footprint (RPF) replicates.
-
Figure 1—figure supplement 1—source data 1
Actinomycin D RT-qPCR data.
RT-qPCR data for Actinomycin D time course (Figure 1—figure supplement 1C) for three individual replicates, average, and standard deviation. Data values are 2-∆∆Ct normalized to 18S rRNA and 0 hr time point.
- https://doi.org/10.7554/eLife.38014.004
Figure 2 with 1 supplement
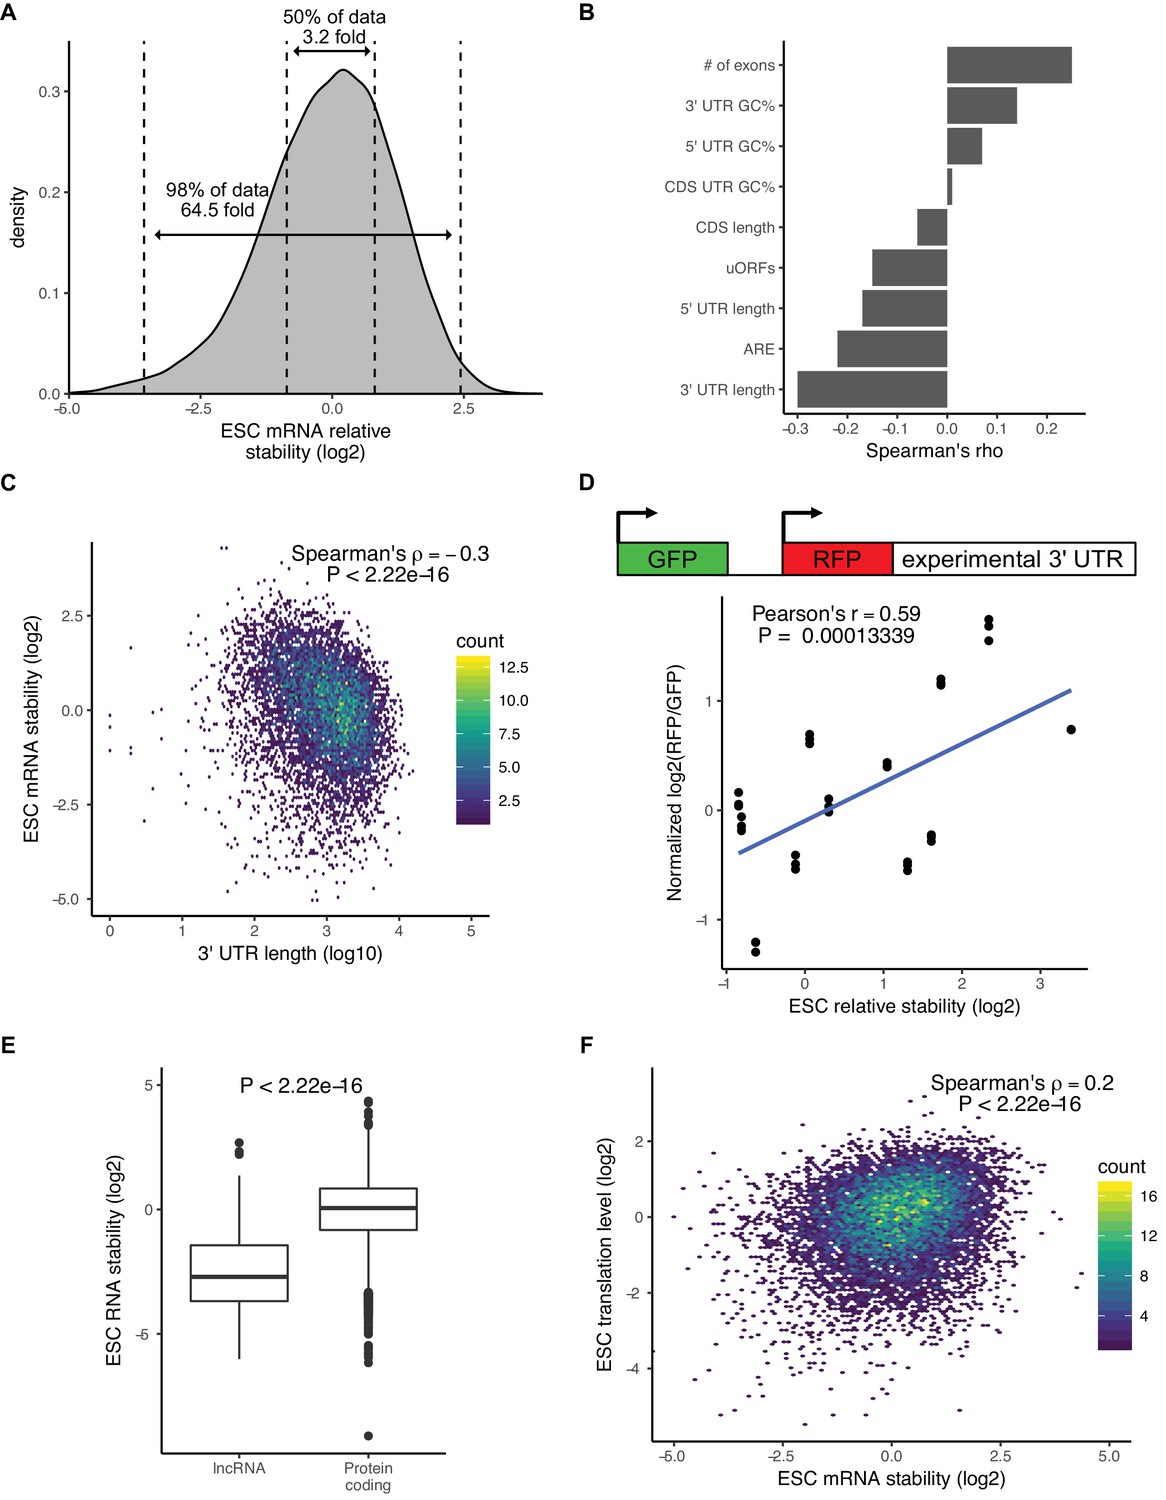
There is a wide range of RNA stabilities, which are positively correlated with translation level in ESCs.
(A) The distribution of mRNA stabilities in ESCs. Dashed lines divide bottom 1%, middle 50%, and top 1% of the data. (B) The correlation between sequence features and mRNA stability in ESCs. uORFs (upstream open-reading frames), ARE (AU Rich Elements). (C) The correlation between 3’ UTR length (log10) and mRNA stability in ESCs. (D) (Top) Schematic of dual reporter system to test endogenous 3’ UTRs. (Bottom) Normalized median RFP/GFP ratios versus mRNA stability for endogenous genes as measured by 4sU-Seq. Clusters of dots indicate an endogenous 3’ UTR, individual dots within a cluster represent biological replicates (n = 3). (E) RNA stability of long non-coding RNAs (lncRNAs) compared to protein-coding RNAs. The p value was calculated using the Mann–Whitney test. (F) Comparison between mRNA stability and translation level (high polysome/monosome ratio) in ESCs. The p value calculated with correlation significance test. n = 3. See also Figure 2—figure supplement 1.
-
Figure 2—source data 1
RFP and GFP values for 3’ UTR reporters.
RFP and GFP intensity values for three individual replicates for 3’ UTR reporters (Figure 2D).
- https://doi.org/10.7554/eLife.38014.007
Figure 2—figure supplement 1

Factors that affect RNA stability in ESCs.
(A) mRNA stability of ESCC miRNA targets compared to all mRNAs. The p value was calculated using the Mann–Whitney test. (B) Polysome trace showing monosome, low polysome, and high polysome fractions collected for RNA-Seq. (C) Translation level of long non-coding RNAs (lncRNAs) compared to protein coding RNAs. The p value calculated with Mann-Whitney test. (D) Comparison between mRNA stability and translational efficiency in ESCs. The p value calculated with correlation significance test. n = 3. (E) Boxplots showing the codon usage frequency in the top and bottom 20% of genes in terms of stability. Codons are ordered along the X-axis based on the median codon usage in unstable - median codon usage in stable. * indicates p<0.05 calculated using the Mann–Whitney test followed by Bonferroni correction.
Figure 3 with 1 supplement
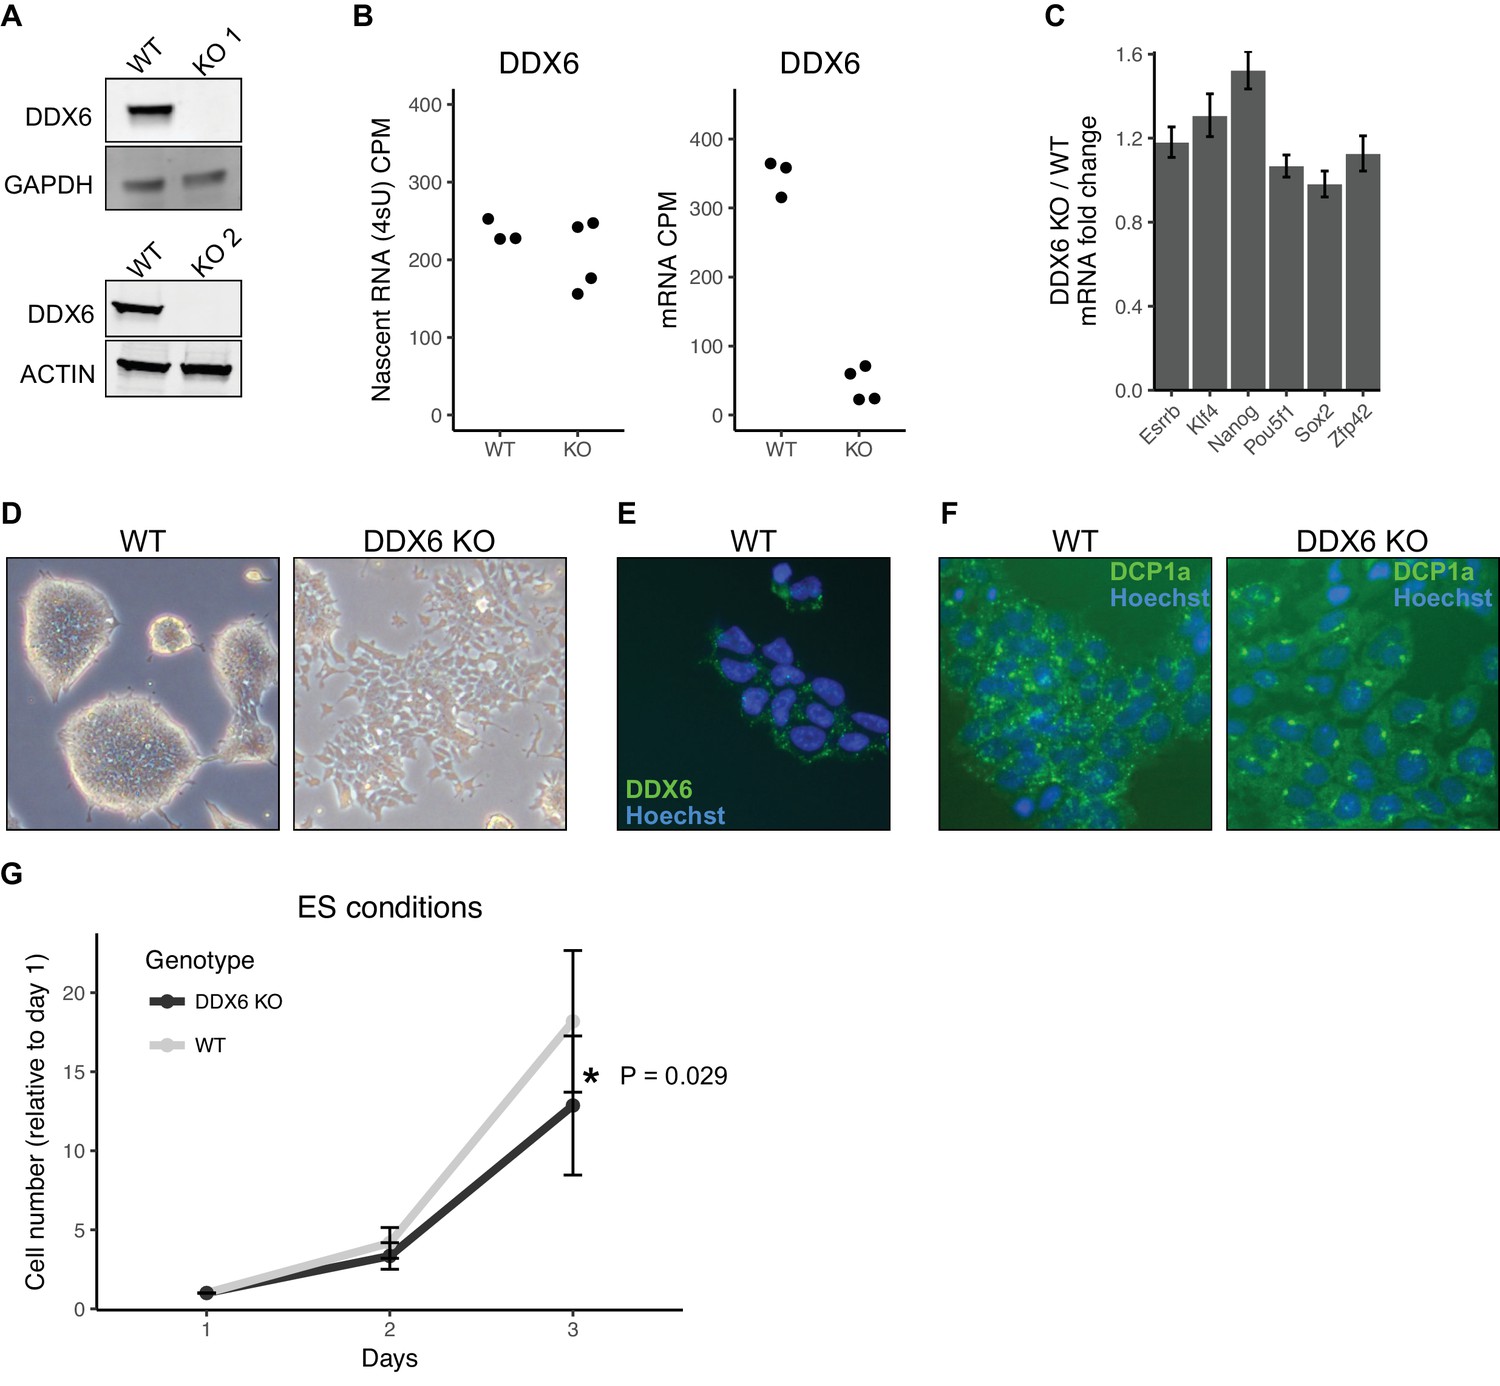
DDX6 regulates proliferation and morphology of ESCs.
(A) Western blot of DDX6 in two Ddx6 knockout (KO) lines. GAPDH and ACTIN were used as loading controls. (B) Ddx6 counts per million (CPM) in nascent mRNA (4sU) or mRNA in wild-type (WT) and Ddx6 KO cells. n = 3 for wild-type, n = 4 for Ddx6 KO (2 replicates of each Ddx6 KO line) (C) Expression of pluripotency genes in Ddx6 KO ESCs based on RNA-Seq. Error bars represent 95% confidence interval. (D) Brightfield images of wild-type and Ddx6 KO ESCs. Images taken at 20X. (E) DDX6 staining in wild-type ESCs. Images taken at 20X. (F) P-body staining against DCP1a in wild-type and Ddx6 KO ESCs. Images taken at 20X. (G) Growth curves of wild-type and Ddx6 KO ESCs in ESC maintenance conditions (LIF/2i). n = 6 for wild-type cells, n = 12 for Ddx6 KO (six replicates of each Ddx6 KO line). * indicates p<0.05 using a t-test, error bars are standard deviation. See also Figure 3—figure supplement 1.
Figure 3—figure supplement 1
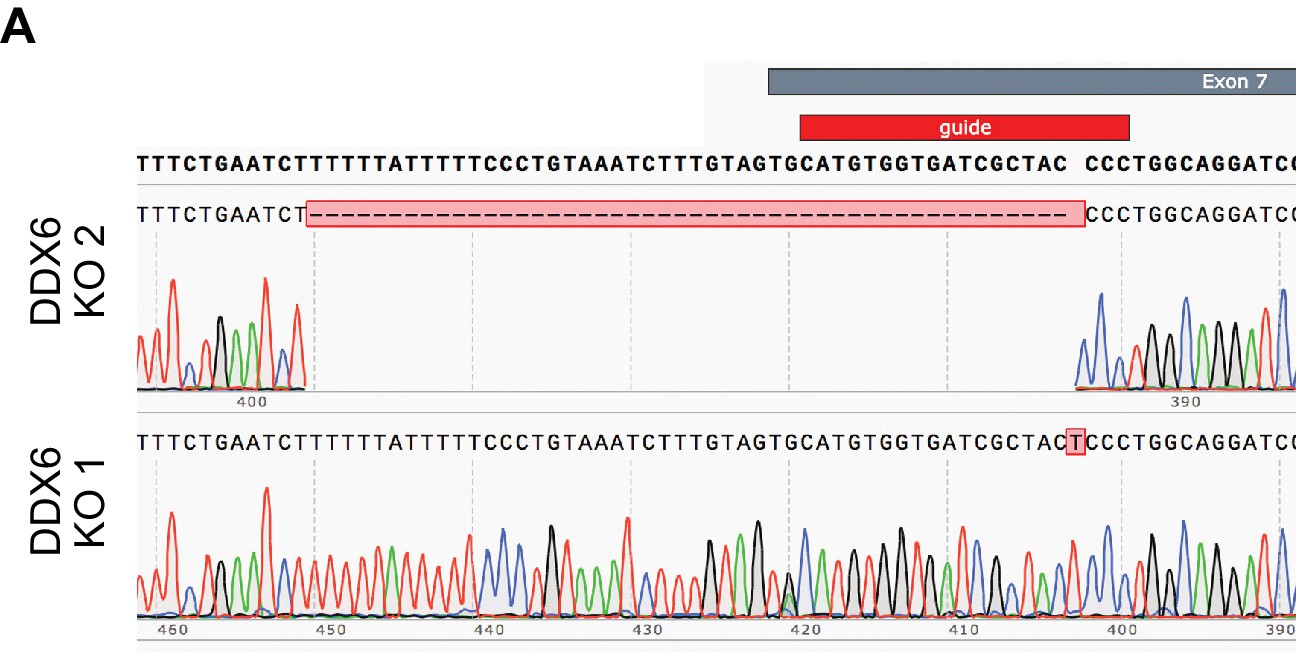
Characterization of Ddx6 KO ESCs.
(A) Sanger sequencing showing deletion and insertion at the beginning of exon seven to generate two Ddx6 KO clones.
Figure 4 with 1 supplement
DDX6 separates miRNA-induced translational repression from RNA degradation.
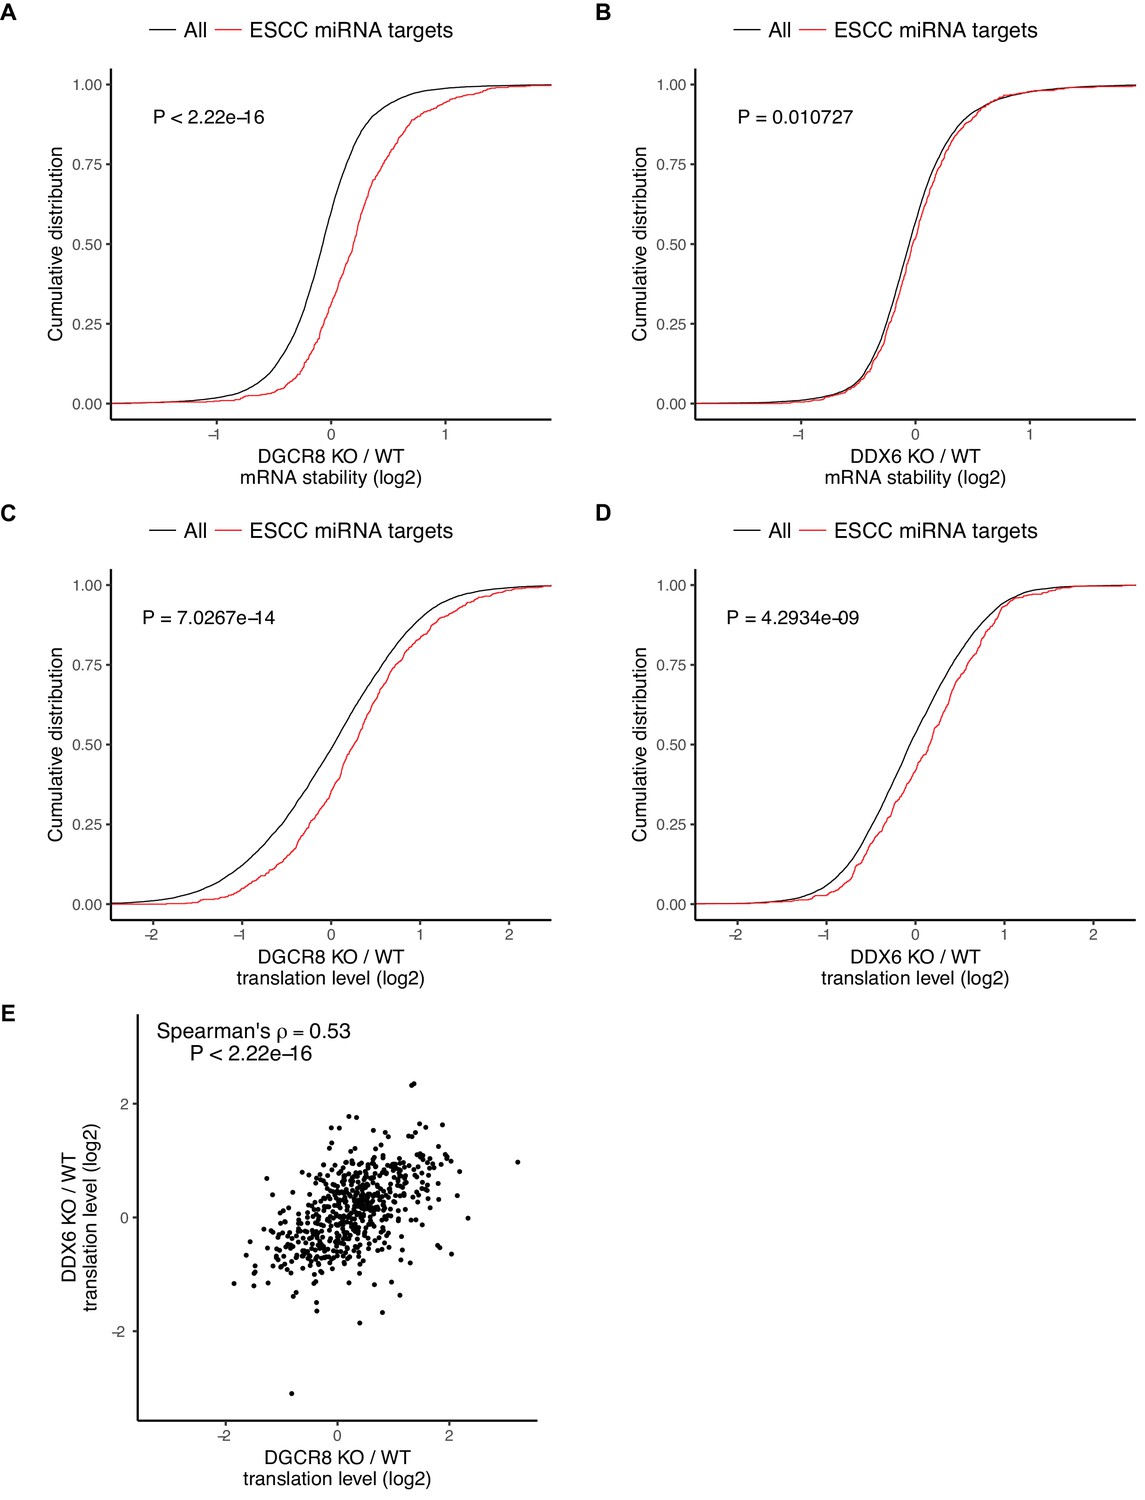
(A–D) mRNA stability or translation level changes of ESCC miRNA targets versus all mRNAs. The p value was calculated with Mann-Whitney test. A/B) mRNA stability changes in Dgcr8 KO (A) or Ddx6 KO (B) cells. n = 3 for wild-type, n = 4 for Ddx6 KO (2 replicates of each Ddx6 KO line), n = 3 for Dgcr8 KO. C/D) Translation level changes in Dgcr8 KO (C) or Ddx6 KO (D) cells. n = 3 for each genotype. (E) Translation level changes of individual ESCC miRNA targets in Dgcr8 KO and Ddx6 KO ESCs. See also Figure 4—figure supplement 1.
Figure 4—figure supplement 1

Connection between stability changes and translation.
(A) mRNA stability changes in Ddx6 KO cells versus wild-type translation level. (B) Boxplots showing the codon usage frequency in the top and bottom 20% of mRNA stability changes in Ddx6 KO for unstable genes as defined in Figure 2—figure supplement 1E. * indicates p<0.05 calculated using the Mann–Whitney test followed by Bonferroni correction. (C) Difference in median codon frequency between stable and unstable transcripts in wild-type cells versus difference in median codon frequency between top and bottom Ddx6 KO mRNA stability changes. (D) mRNA stability changes in Ddx6 KO cells versus species-specific tRNA adaptation index (tAI) scores for each gene.
Figure 5 with 1 supplement
Translational repression alone underlies many of the downstream molecular changes associated with miRNA loss.
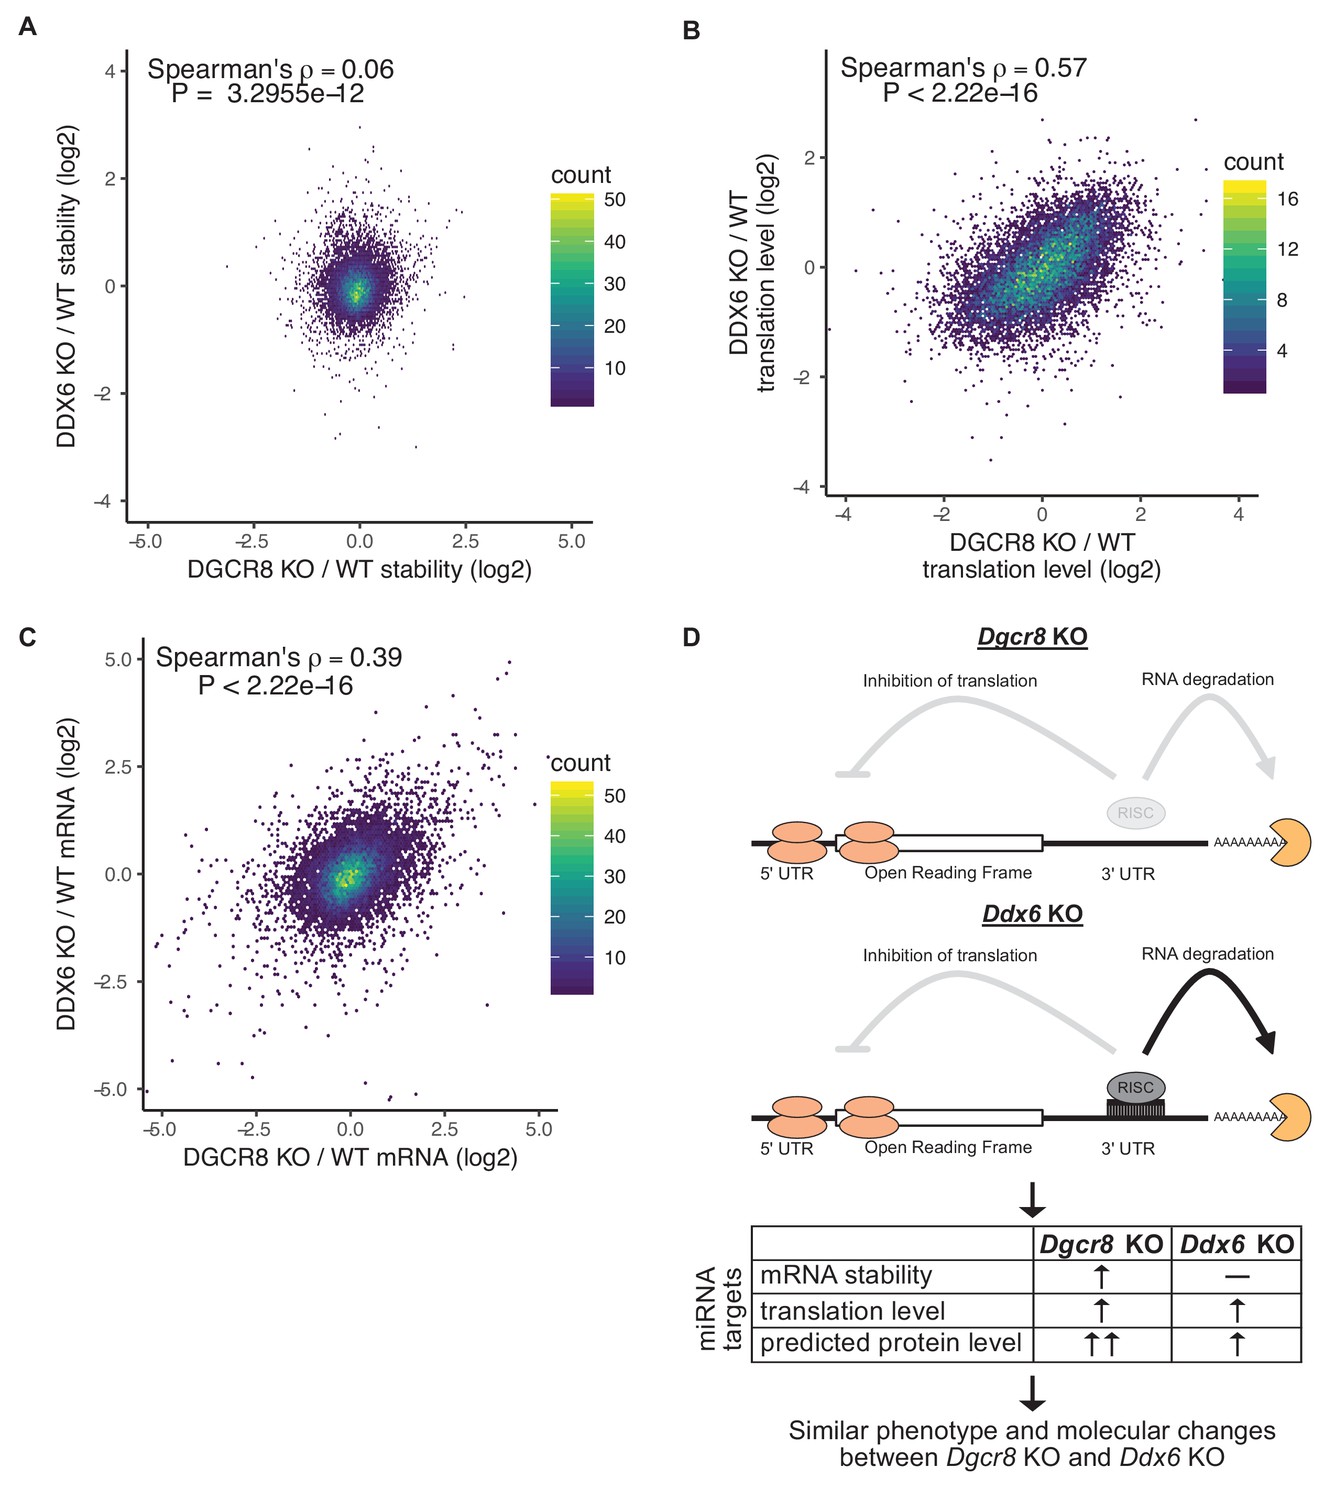
(A) Comparison between mRNA stability changes in Dgcr8 KO versus Ddx6 KO cells. n = 3 for wild-type, n = 4 for Ddx6 KO (2 replicates of each Ddx6 KO line), n = 3 for Dgcr8 KO. (B) Comparison between translation level changes in Dgcr8 KO versus Ddx6 KO cells. n = 3 for each genotype. (C) Comparison between mRNA changes in Dgcr8 KO versus Ddx6 KO cells. The p value was calculated with correlation significance test. (D) Summary schematic comparing Dgcr8 KO cells to Ddx6 KO cells. Dgcr8 KO leads to the loss of both translational repression and mRNA destabilization of miRNA targets, while Ddx6 KO only leads to the loss of translational repression of miRNA targets. mRNA stability is measured as the ratio of mRNA/4sU reads, changes in translation level are measured as the ratio of polysome/monosome reads, protein level changes are not directly measured but are predicted based on mRNA stability and translation level changes. Changes in translation level alone in Ddx6 KO cells produce similar phenotypes and global molecular changes to Dgcr8 KO cells. See also Figure 5—figure supplement 1.
Figure 5—figure supplement 1
Transcriptional changes in Ddx6 KO and Dgcr8 KO.
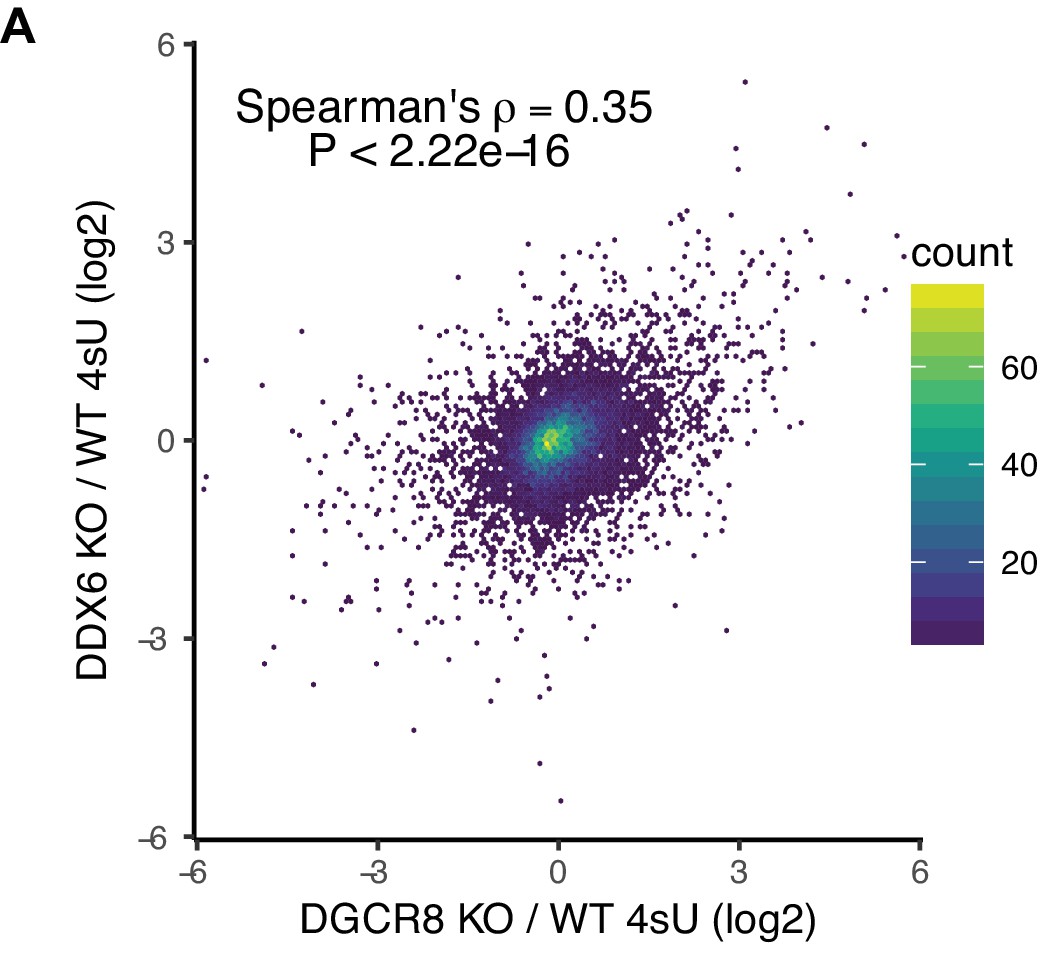
(A) Comparison between changes in nascent transcription (4sU-Seq) in Dgcr8 KO versus Ddx6 KO cells. n = 3 for wild-type, n = 4 for Ddx6 KO (2 replicates of each Ddx6 KO line), n = 3 for Dgcr8 KO. The p value was calculated with correlation significance test.
Tables
Key resources table
| Reagent type (species) or resource | Designation | Source or reference | Identifiers | Additional information |
|---|---|---|---|---|
| Gene (Mouse) | Ddx6 | NA | Ensembl: ENSMUSG00000032097 | |
| Gene (Mouse) | Dgcr8 | NA | Ensembl: ENSMUSG00000022718 | |
| Cell line (Mouse) | WT (V6.5) embryonic stem cell | PMID: 11331774; Novus Biologicals | NBP1-41162 | V6.5 mouse embryonic stem cell line from the Jaenisch lab, maintained in the Blelloch lab. Also available commercially from Novus Biologicals. |
| Cell line (Mouse) | Dgcr8 KO embryonic stem cell | PMID: 17259983; Novus Biologicals | NBA1-19349 | Dgcr8 KO mouse embryonic stem cell line previously generated in the Blelloch lab. Also available commercially from Novus Biologicals. |
| Cell line (Mouse) | Ddx6 KO embryonic stem cell | This paper | N/A | Ddx6 KO mouse embryonic stem cell line generated via CRISPR-Cas9 in the Blelloch lab from V6.5 parental cell line. |
| Cell line (Mouse) | miR290-mCherry and miR302-GFP reporter V6.5 embryonic stem cell | PMID: 26212322 | N/A | Mouse embryonic stem cell line used for differentiation in Figure 1. Previously generated in the Blelloch lab. |
| Antibody | anti-DDX6 | Bethyl Lab | A300-460A-T | 1:1000 |
| Antibody | anti-GAPDH | Santa Cruz Biotechnology | SC 25778 | 1:1000 |
| Antibody | anti-ACTIN | Sigma | A4700 | 1:1000 |
| Antibody | anti DCP1 | Abcam | ab47811 | 1:800 |
| Recombinant DNA reagent | pSpCas9(BB)−2A-GFP (PX458) plasmid | Addgene | 48138 | Used to generate DDX6 KO lines. |
| Recombinant DNA reagent | pBUTR(piggyBac-based 3' UnTranslated Region Reporter) plasmid | PMID: 24753411 | N/A | Used for 3' UTR reporter experiments. |
| Sequence-based reagent | CATGTGGTGATCGCTACCCC | This paper | N/A | DDX6 KO guide sequence |
| Commercial assay or kit | Ribo-Zero Gold kit | Illumina | MRZG126 | |
| Commercial assay or kit | KAPA Stranded RNA-Seq | KAPA | KK8400 | |
| Commercial assay or kit | KAPA HyperPrep Stranded RNA-Seq | KAPA | KK8540 | |
| Commercial assay or kit | Lexogen QuantSeq 3' FWD | Lexogen | 015.96 | |
| Commercial assay or kit | TruSeq Ribosome-Profiling | Illumina | RPHMR12126 | |
| Chemical compound, drug | 4-thioruridine (4sU) | Sigma | T4509-100MG | |
| Chemical compound, drug | Cycloheximide | Sigma | C4859-1ML | |
| Chemical compound, drug | Actinomycin D | Fisher Scientific | BP6065 | |
| Chemical compound, drug | MEK inhibitor PD0325901 | Peprotech | 3911091 | For naïve ESC culture |
| Chemical compound, drug | GSK3 inhibitor CHIR99021 | Peprotech | 2520691 | For naïve ESC culture |
| Other | Streptavidin Dynabeads | Invitrogen | 65305 | |
| Software, algorithm | Cutadapt version 1.14 | DOI:10.14806/ej.17.1.200 | RRID:SCR_011841 | |
| Software, algorithm | STAR version 2.5.3a | PMID: 23104886 | RRID:SCR_015899 | |
| Software, algorithm | Gencode M14 annotation | N/A | https://www.gencodegenes.org | |
| Software, algorithm | Limma version 3.32.10 | PMID: 25605792 | RRID:SCR_010943 | |
| Software, algorithm | R version 3.4.2 | R Core Team | RRID:SCR_001905 | |
| Software, algorithm | ggplot2 version 2.2.1 | H. Wickham | RRID:SCR_014601 | |
| Software, algorithm | featureCounts version 1.5.3 | PMID: 24227677 | RRID:SCR_012919 |
Additional files
-
Transparent reporting form
- https://doi.org/10.7554/eLife.38014.014
Download links
A two-part list of links to download the article, or parts of the article, in various formats.
Downloads (link to download the article as PDF)
Open citations (links to open the citations from this article in various online reference manager services)
Cite this article (links to download the citations from this article in formats compatible with various reference manager tools)
Decoupling the impact of microRNAs on translational repression versus RNA degradation in embryonic stem cells
eLife 7:e38014.
https://doi.org/10.7554/eLife.38014


